
PESTICIDE RESIDUES IN FOOD - 1981
Sponsored jointly by FAO and WHO
EVALUATIONS 1981
Food and Agriculture Organization of the United Nations
Rome
FAO PLANT PRODUCTION AND PROTECTION PAPER 42
pesticide residues in food:
1981 evaluations
the monographs
data and recommendations
of the joint meeting
of the
FAO panel of experts on pesticide residues
in food and the environment
and the
WHO expert group on pesticide residues
Geneva, 23 November-2 December 1981
FOOD AND AGRICULTURE ORGANIZATION OF THE UNITED NATIONS
Rome 1982
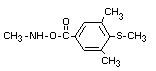
METHIOCARB
IDENTITY
Chemical name (s)
4-methyl-3,5-xylyl methylcarbamate;
3,5-dimethyl-4-methylthiophenyl methylcarbamate
Synonyms
mercaptodimethur (methiocarb and mercaptodimethur are both
standard ISO names)
metmercapturonG, MXMC, DrazaTM, MesurolTM, B-37344
Structural formula
 Other information on identity and properties
See "Fate of residues - in water"
No information was provided to the Meeting either on
manufacturing processes or on the nature of possible contaminants.
DATA FOR THE ESTIMATION OF ACCEPTABLE DAILY INTAKE
BIOCHEMICAL ASPECTS
Absorption, distribution, biotransformation and excretion
Excretion, storage and metabolism of methiocarb has been
investigated employing (ring-l-14C), (carbonyl-14C) and
(methylthio-3H) labelled methiocarb (Bayer 1981).
Rat
Rats were orally dosed with both (carbonyl-14CP methiocarb and
(methylthio-3H) methiocarb at a rate of 20 mg/kg (Gronberg and
Everett 1964). The methiocarb was oxidized partially to methiocarb
sulphoxide and methiocarb sulphone, and then the carbamates were
hydrolysed to phenols, which were excreted in the urine as glycosidic
conjugates. Some N-hydroxy-methyl sulphoxide was also detected. Over
60% of the carbonyl-14C label was expired as CO2. Rats treated with
(carbonyl-14C)methiocarb, methiocarb sulphoxide and methiocarb
sulphone at rates of 10 mg/kg appeared to exhibit the same metabolic
pattern of methiocarb degradation (Gronberg and Everett 1964).
In studies with male and female rats treated orally with a single
dose of (ring-l-14C)methiocarb at a rate of 20 mg/kg or 0.25 mg/kg,
nearly all of the radioactivity was excreted in the urine within 48 h.
Only traces of the intact carbamates were detected in the urine. The
principal metabolites appeared to be conjugated methiocarb sulphoxide
phenol and conjugated methiocarb phenol. There were no appreciable
differences in metabolic patterns between male and female rats
(Stanley and Johnson 1976).
Hen
Hens, after receiving a single oral dose of (ring-l-14C)
methiocarb at a rate of 4.4 mg/kg, excreted 84% of the dose in 24 h
and an additional 1% in the next 72 h. Less than 1% of the dose was
excreted as methiocarb. Conjugated and non-conjugated methiocarb
phenol (21% and 13% of the dose respectively), methiocarb sulphoxide
phenol (1% and 9%), and methiocarb sulphone phenol (1% and 7%) were
detected in the excreta along with N-hydroxy-methyl methiocarb
sulphoxide (2%). All eggs collected during the 96 h period
collectively contained 0.1% of the administered dose, and no single
egg contained more than 0.02 ppm methiocarb equivalents (Stanley
et al 1979a).
Hens were orally dosed with (ring-l-14C)methiocarb for 5
consecutive days at a rate of 4.4 mg/kg/day and then sacrificed after
the fifth dose. Eggs collected during the dosing period and at
sacrifice contained 0.1 ppm methiocarb equivalents each. Radioactive
residues in the tissues ranged from 0.4 ppm in the breast muscle to
7.7 ppm in the gizzard (including lining). In the tissues, the
principal metabolic pathway for methiocarb involved hydrolysis to
methiocarb phenol, oxidation of methiocarb phenol to methiocarb
sulphoxide phenol and methiocarb sulphone phenol, and subsequent
conjugation of these phenols. Some oxidation of methiocarb to
methiocarb sulphoxide, N-hydroxymethyl methiocarb, and N-hydroxy-
methyl methiocarb sulphoxide also occurred (Stanley et al 1979a, b).
Feed treated with methiocarb/methiocarb sulphoxide (9:1) at 20,
60, 120 and 360 ppm was distributed to chickens ad libitum for 28
days. Feed consumption decreased as the amount of methiocarb/
methiocarb sulphoxide in the feed increased and body weights reflected
the reduced feed intake. Egg production was not affected by the
treatments. Plasma cholinesterase activity decreased 40% to 50%, as
compared to the control birds, at the 60, 120 and 350 ppm dosage
levels. Residues were detected in the giblets from the 60, 120 and
360 ppm treatment groups, in the skin from the highest dosage, and in
the eggs from the two highest levels. No residues were detectable in
the muscle or fat (Strankowski and Minor 1976).
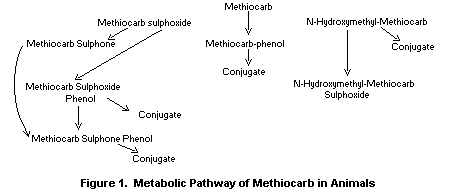
Figure 1 illustrates the metabolic pathway of methiocarb in
animals. The chemical names of the metabolites are given in Table 1.
Dog
Following oral administration of (ring-l-14C)Mesurol to dogs at
a rate of 2 mg/kg, between 64% and 92% of the dose was recovered in
the urine and faeces.
At least 71% of the radioactivity found in the urine was present
as conjugated methiocarb sulphoxide phenol and conjugated methiocarb
sulphone phenol. Essentially all of the radioactivity found in the
faeces was identified as methiocarb and tissue residues were 0.4 ppm
(Bell 1974).
Cow
(ring-l-14C) methiocarb was administered to a dairy cow at a
rate of 0.14 mg/kg. Within 144 h, 96% of the administered
radioactivity was excreted in the urine, 1% in the faeces and 1% in
the milk. Approximately 80% of the urine radioactivity was identified
as conjugates of methiocarb phenol, methiocarb sulphoxide phenol and
methiocarb sulphone phenol, which were present in nearly equal
quantities (Minor and Murphy 1977a).
A dairy cow was dosed once each day for 5 consecutive days with
(ring-l-14C) methiocarb at a rate of 0.14 mg/kg/day and then
sacrificed after the fifth dose. Radioactive residues in the milk
reached a peak (0.062 ppm) after the third dose. Methiocarb sulphoxide
(0.002 ppm) was the only carbamate detected in the milk. Kidney
(0.108 ppm) and liver (0.073 ppm) were the only tissues with
radioactive residues > 0.01 ppm. Methiocarb and its carbamate
metabolites accounted for no more than 0.02 ppm residue in any tissue
(Minor and Murphy 1977b).
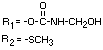
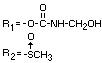
TABLE 1. Chemical names, structures and designations of methiocarb and metabolites
identified in animals
Designation Chemical name
Methiocarb 3,5-dimethyl-4-(methyl thio)-phenol methylcarbamate
Other information on identity and properties
See "Fate of residues - in water"
No information was provided to the Meeting either on
manufacturing processes or on the nature of possible contaminants.
DATA FOR THE ESTIMATION OF ACCEPTABLE DAILY INTAKE
BIOCHEMICAL ASPECTS
Absorption, distribution, biotransformation and excretion
Excretion, storage and metabolism of methiocarb has been
investigated employing (ring-l-14C), (carbonyl-14C) and
(methylthio-3H) labelled methiocarb (Bayer 1981).
Rat
Rats were orally dosed with both (carbonyl-14CP methiocarb and
(methylthio-3H) methiocarb at a rate of 20 mg/kg (Gronberg and
Everett 1964). The methiocarb was oxidized partially to methiocarb
sulphoxide and methiocarb sulphone, and then the carbamates were
hydrolysed to phenols, which were excreted in the urine as glycosidic
conjugates. Some N-hydroxy-methyl sulphoxide was also detected. Over
60% of the carbonyl-14C label was expired as CO2. Rats treated with
(carbonyl-14C)methiocarb, methiocarb sulphoxide and methiocarb
sulphone at rates of 10 mg/kg appeared to exhibit the same metabolic
pattern of methiocarb degradation (Gronberg and Everett 1964).
In studies with male and female rats treated orally with a single
dose of (ring-l-14C)methiocarb at a rate of 20 mg/kg or 0.25 mg/kg,
nearly all of the radioactivity was excreted in the urine within 48 h.
Only traces of the intact carbamates were detected in the urine. The
principal metabolites appeared to be conjugated methiocarb sulphoxide
phenol and conjugated methiocarb phenol. There were no appreciable
differences in metabolic patterns between male and female rats
(Stanley and Johnson 1976).
Hen
Hens, after receiving a single oral dose of (ring-l-14C)
methiocarb at a rate of 4.4 mg/kg, excreted 84% of the dose in 24 h
and an additional 1% in the next 72 h. Less than 1% of the dose was
excreted as methiocarb. Conjugated and non-conjugated methiocarb
phenol (21% and 13% of the dose respectively), methiocarb sulphoxide
phenol (1% and 9%), and methiocarb sulphone phenol (1% and 7%) were
detected in the excreta along with N-hydroxy-methyl methiocarb
sulphoxide (2%). All eggs collected during the 96 h period
collectively contained 0.1% of the administered dose, and no single
egg contained more than 0.02 ppm methiocarb equivalents (Stanley
et al 1979a).
Hens were orally dosed with (ring-l-14C)methiocarb for 5
consecutive days at a rate of 4.4 mg/kg/day and then sacrificed after
the fifth dose. Eggs collected during the dosing period and at
sacrifice contained 0.1 ppm methiocarb equivalents each. Radioactive
residues in the tissues ranged from 0.4 ppm in the breast muscle to
7.7 ppm in the gizzard (including lining). In the tissues, the
principal metabolic pathway for methiocarb involved hydrolysis to
methiocarb phenol, oxidation of methiocarb phenol to methiocarb
sulphoxide phenol and methiocarb sulphone phenol, and subsequent
conjugation of these phenols. Some oxidation of methiocarb to
methiocarb sulphoxide, N-hydroxymethyl methiocarb, and N-hydroxy-
methyl methiocarb sulphoxide also occurred (Stanley et al 1979a, b).
Feed treated with methiocarb/methiocarb sulphoxide (9:1) at 20,
60, 120 and 360 ppm was distributed to chickens ad libitum for 28
days. Feed consumption decreased as the amount of methiocarb/
methiocarb sulphoxide in the feed increased and body weights reflected
the reduced feed intake. Egg production was not affected by the
treatments. Plasma cholinesterase activity decreased 40% to 50%, as
compared to the control birds, at the 60, 120 and 350 ppm dosage
levels. Residues were detected in the giblets from the 60, 120 and
360 ppm treatment groups, in the skin from the highest dosage, and in
the eggs from the two highest levels. No residues were detectable in
the muscle or fat (Strankowski and Minor 1976).
Figure 1 illustrates the metabolic pathway of methiocarb in
animals. The chemical names of the metabolites are given in Table 1.
Dog
Following oral administration of (ring-l-14C)Mesurol to dogs at
a rate of 2 mg/kg, between 64% and 92% of the dose was recovered in
the urine and faeces.
At least 71% of the radioactivity found in the urine was present
as conjugated methiocarb sulphoxide phenol and conjugated methiocarb
sulphone phenol. Essentially all of the radioactivity found in the
faeces was identified as methiocarb and tissue residues were 0.4 ppm
(Bell 1974).
Cow
(ring-l-14C) methiocarb was administered to a dairy cow at a
rate of 0.14 mg/kg. Within 144 h, 96% of the administered
radioactivity was excreted in the urine, 1% in the faeces and 1% in
the milk. Approximately 80% of the urine radioactivity was identified
as conjugates of methiocarb phenol, methiocarb sulphoxide phenol and
methiocarb sulphone phenol, which were present in nearly equal
quantities (Minor and Murphy 1977a).
A dairy cow was dosed once each day for 5 consecutive days with
(ring-l-14C) methiocarb at a rate of 0.14 mg/kg/day and then
sacrificed after the fifth dose. Radioactive residues in the milk
reached a peak (0.062 ppm) after the third dose. Methiocarb sulphoxide
(0.002 ppm) was the only carbamate detected in the milk. Kidney
(0.108 ppm) and liver (0.073 ppm) were the only tissues with
radioactive residues > 0.01 ppm. Methiocarb and its carbamate
metabolites accounted for no more than 0.02 ppm residue in any tissue
(Minor and Murphy 1977b).
TABLE 1. Chemical names, structures and designations of methiocarb and metabolites
identified in animals
Designation Chemical name
Methiocarb 3,5-dimethyl-4-(methyl thio)-phenol methylcarbamate
 Methiocarb sulphoxide 3,5-dimethyl-'4-(methylsulphinyl)phenol methylcarbamate
 Methiocarb sulphone 3,5-dimethyl-4-(methylsulphonyl) phenyl methylcarbamate
 N-hydroxymethyl 3,5-dimethyl-4-(methylthio)-phenol N-Hydroxymethyl carbamate
methiocarb
N-hydroxymethyl 3,5-dimethyl-4-(methylthio)-phenol N-Hydroxymethyl carbamate
methiocarb
 N-hydroxymethyl 3,5-dimethyl-4-(methylsulphinyl)phenol N-hydroxymethyl carbamate
methiocarb suiphoxide
N-hydroxymethyl 3,5-dimethyl-4-(methylsulphinyl)phenol N-hydroxymethyl carbamate
methiocarb suiphoxide
 Methiocarb phenol 3,5-dimethyl-4-(methylthio)phenol
 Methiocarb sulphoxide 3,5-dimethyl-4-(methylsulphinyl)phenol
phenol
Methiocarb sulphoxide 3,5-dimethyl-4-(methylsulphinyl)phenol
phenol
 Methiocarb sulphone 3,5-dimethyl-4-(methylsulphonyl) phenol
phenol
CHEMICAL STRUCTURE 8;V081PR25.BMP
Beef and dairy cattle were fed rations containing 10, 30 and
100 ppm methiocarb for 29 days (Mobay 1970). No toxic symptoms were
observed during the test. One of the nine test animals did show a
slight weight loss and decrease in milk production, but she was
nearing the end of her lactation period and the decrease in production
was expected. Residues were detected only in the liver (animals fed 30
and 100 ppm methiocarb) and kidney (animals fed 100 ppm methiocarb).
All other tissues (brain, heart, muscle and fat) showed no detectable
residues. Milk was collected on the 28th and 29th days of the study.
Detectable residues (> 0.005 ppm) were found at all levels of
treatment. The ranges of the residues were 0.005 to 0.007 at 10 ppm,
0.008 to 0.015 ppm at 30 ppm and 0.021 to 0.033 ppm at 100 ppm.
Methiocarb sulphone 3,5-dimethyl-4-(methylsulphonyl) phenol
phenol
CHEMICAL STRUCTURE 8;V081PR25.BMP
Beef and dairy cattle were fed rations containing 10, 30 and
100 ppm methiocarb for 29 days (Mobay 1970). No toxic symptoms were
observed during the test. One of the nine test animals did show a
slight weight loss and decrease in milk production, but she was
nearing the end of her lactation period and the decrease in production
was expected. Residues were detected only in the liver (animals fed 30
and 100 ppm methiocarb) and kidney (animals fed 100 ppm methiocarb).
All other tissues (brain, heart, muscle and fat) showed no detectable
residues. Milk was collected on the 28th and 29th days of the study.
Detectable residues (> 0.005 ppm) were found at all levels of
treatment. The ranges of the residues were 0.005 to 0.007 at 10 ppm,
0.008 to 0.015 ppm at 30 ppm and 0.021 to 0.033 ppm at 100 ppm.
 TOXICOLOGICAL STUDIES
Acute toxicity
The acute toxicity of methiocarb was tested in several animal
species. Results are summarized in Table 2. Acute toxicity of
methiocarb metabolites were tested in rats, and results are given in
Table 3.
Symptoms of poisoning after acute application
The symptoms of poisoning were typical of cholinesterase activity
depression, and were characterized by trembling, muscular
fasciculations, ataxia, salivation, lachrymation and diarrhoea.
Vomiting was also seen in dogs. The severity and duration of the
symptoms were dose-related. Onset of symptoms was within minutes after
oral and intraperitoneal administration, and they usually persisted
for no more than a few hours. Deaths usually occurred within a few
hours after administration (Bayer 1981).
TABLE 2. Acute toxicity of methiocarb in animals
Species Sex Route Solvent/vehicle LD50(mg/kg) Reference
Rat M oral H2O + tragacanth ca. 100 Kimmerle 1960
oral polyethylene 67 " 1966a
M oral glycol 400 13-15 Lamb and Matzkanin
F oral " 31-32 1976
M oral " 28.0-35.1 Thyssen 1977a
M oral " 33 Nelson 1979
F oral " 47 "
F oral ethanol + polyethylene 100 DuBois and Raymund
glycol 1962
M oral " 130 "
F oral " 135 1961a
M ip H2O + tragacanth ca. 100 Kimmerle 1960
F ip ethanol + polyethylene 25 DuBois and Raymund
glycol 1962
M ip " 35 "
ip " 30 1961b
F dermal,24h ethanol >300 "
1962
M dermal,24h oil >1000 Kimmerle 1960
M&F dermal,24h polyethylene >5000 Thyssen 1977b
glycol 400
M ip ethanol + polyethylene 6.0 DuBois and Raymund
F ip glycol 5.5 1961b
TABLE 2. (con't)
Species Sex Route Solvent/vehicle LD50(mg/kg) Reference
Guinea F oral H2O + emulsifier 50-100 Kimmerle 1969a
pig M oral ethanol + polyethylene 40 DuBois and Raymund
glycol 1961a
F oral ethylene glycol 14.1 Crawford and
Anderson 1972
M ip " 17 DuBois and Raymund
1961b
Rabbit M&F dermal,24h saline >2000 Crawford and
Anderson 1972
Dog M&F oral none (gelatin 25.4 Lamb and Matzkanin
capsule) 1975
F oral H2O + emulsifier 10-25 Kimmerle 1969
Hen oral ethanol + polyethylene 175 DuBois 1962
glycol
TABLE 3. Acute toxicity of several metabolites of methiocarb in the rat
Chemical
(M=methiocarb) Sex Route LD50(mg/kg) Reference
M sulphoxide M oral 6-9 Lamb and Matzkanin
F oral 7-8 1976a, b
oral 42.9 Solmecke 1970a
M sulphone oral >1000 " 1970b
M phenol oral >10001 " 1970c
M oral >10001 DuBois 1964
M dermal >10001 "
M sulphoxide phenol M oral >10001 "
oral >10001 Solmecke 1970d
M dermal >10001 DuBois 1964
M sulphone phenol M oral >10001 "
oral >10001 Solmecke 1970e
M dermal >10001 DuBois 1964
N-hydroxymethyl M M oral >1121 Nelson 1979
F oral >1121 "
N-hydroxymethyl M oral >1121 "
M sulphone F oral >1121 "
N-hydroxymethyl M oral >1601 "
M sulphoxide F oral >1601 "
1 = no mortality.
When ethanol solutions of methiocarb were applied to the skin of
rats at dose levels of 100 and 200 mg/kg, cholinergic symptoms were
observed at the higher dose hut no mortality occurred. Methiocarb was
not well-absorbed from the skin, even when dissolved in a solvent
that should increase dermal absorption. Following application of
polythylene glycol 400 solutions of methiocarb to the skin of rats,
mild cholinergic symptoms of brief duration were also observed at dose
levels of 100 mg/kg bw and above, but no mortalities occurred at dose
levels of up to and including 5 000 mg/kg bw (Bayer 1981).
When one-half of the LD50 of methiocarb was given
intraperitoneally to female rats in combination with the same fraction
of the LD50 of trichlorfon, coumaphos, oxydemeton methyl, fenthion or
propoxur, additive or less than additive acute toxicity was observed
(DuBois and Raymund 1961b).
Potentiation of acute toxicity was investigated in another study
on female rats involving simultaneous intraperitoneal administration
of equitoxic doses of methiocarb and 15 other anticholinesterase
insecticides. The results of the tests demonstrated that potentiation
of acute toxicity does not occur when methiocarb was given in
combination with each of the 15 other anticholinesterase insecticides,
including parathion, methyl parathion, malathion, azinophos methyl
a.o. (DuBois and Raymund 1961b).
Antidote studies
Studies on the protective efficacy of atropine for the treatment
of poisoning by methiocarb demonstrated that the intraperitoneal
injection of 100 mg/kg of atropine sulphate 10 min before treatment
with the carbamate raises the LD50 from 30 to 100 mg/kg. The
intraperitoneal administration of 100 mg/kg of 2-PAM immediately
before or at 15 min after methiocarb administration had no significant
protective or antidotal activity (Dubois and Raymund 1961a).
In another experiment, 50 mg/kg of atropine sulphate or of PAM or
20 mg/kg of Toxogonin, respectively, was injected intraperitoneally
shortly before the appearance of acute symptoms following the oral
application of methiocarb. Injection of atropine sulphate raised the
LD50 from 67 to 467.5 mg/kg bw. PAM and Toxogonin had only a slight
effect. These results demonstrate that atropine has an excellent
antidotal effect in rats poisoned with methiocarb (Kimmerle 1966).
Confirmation of the good antidotal effect of atropine sulphate
was obtained in further experiments. Intraperitoneal injection of
50 mg atropine sulphate/kg bw at onset of cholinergic symptoms
following acute oral administration of methiocarb to male rats raised
the LD50 from 104.5 to 643 mg/kg bw (Kimmerle 1971).
Atropine proved to be an effective antidote also in a dog
accidentally poisoned with methiocarb (Udall 1973).
Short-term studies
Rat
Male rats were dosed on 27 consecutive work-days with methiocarb
suspended in water plus tragacanth and administered by oral
intubation. The daily dose was 2 mg/kg on each of the first 3 days and
4 mg/kg bw thereafter. During and also after termination of treatment,
groups of 3 rats were sacrificed twice weekly, and erythrocyte
cholinesterase activity was measured. Cholinesterase activity
decreased during the course of the treatment, amounted to about 80%
after 14 days, and was 50% on termination of treatment. During the
post-treatment observation period, activity increased again only at a
very slow rate and did not return to normal until about 42 days after
termination of treatment. Cholinergic symptoms were not seen during
the treatment period (Kimmerle 1960).
The subacute oral toxicity of methiocarb was investigated in male
and female weanling Sprague-Dawley rats by feeding groups of animals
diets containing 0, 5, 10 and 50 ppm of methiocarb for a period of 16
weeks. The rats tolerated methiocarb in the diet at levels as high as
50 ppm for 16 weeks without exhibiting any alteration of their growth
rate or food consumption. Animals fed methiocarb at 10 ppm did not
exhibit cholinergic or other toxic symptoms. Methiocarb could be fed
to male and female rats at a dietary concentration of 10 ppm for 16
weeks without producing inhibition of the cholinesterase activity of
the serum, erythrocytes, brain or submaxillary glands. When the
dietary concentration was increased to 50 ppm, the activity of this
enzyme was reduced in the semen by about 30% and that of the
erythrocytes was decreased by about 15% (Doull et al 1962).
Dog
The subchronic oral toxicity of methiocarb was investigated in
male and female beagle dogs to determine the level that can be added
to the diet without producing detectable symptoms of poisoning or
significant inhibitions of blood cholinesterase activity. Dietary
levels of 0 (control), 50, 100 and 250 ppm were employed for these
studies, in which 2 male and 2 female dogs were fed each of these
dietary levels. Individual measurements of the serum and erythrocyte
cholinesterase activity were made weekly for a period of 12 weeks. It
was shown that dietary levels as high as 250 ppm can be fed to male
and female beagle dogs for 12 weeks without causing any reduction of
their normal growth rate or the appearance of other toxic symptoms.
Levels as high as 250 ppm caused no significant inhibition of the
cholinesterase activity of serum or erythrocytes and produced no
cholinergic symptoms (Root et al 1963).
Two male and two female beagle dogs were fed diets containing 0
(control), 50, 100 and 250 ppm of methiocarb for a period of 2 years.
The animals were observed daily for symptoms of cholinergic
stimulation. Measurements of the growth rate, food consumption and
blood cholinesterase activity were carried out at intervals during the
exposure period. At the end of the 2-year feeding period, the dogs
were autopsied and the tissues removed and prepared for microscopic
examination. Samples of the brain, liver and blood were also taken at
autopsy for the terminal cholinesterase activity determinations. The
inclusion of methiocarb in the diet at levels of 250 ppm or less did
not significantly alter the growth rate-food consumption or general
physical condition of either male or female dogs. None of the dietary
levels of methiocarb used produced cholinergic symptoms or other
indications of toxic effects that could be attributed to the presence
of methiocarb in the diet. The dogs tolerated methiocarb in the diet
at levels of 250 ppm or less for a period of 2 years without
exhibiting a significant inhibition of either the serum or erythrocyte
cholinesterase activity. Blood, brain and liver cholinesterase
activity was also not seen to be depressed at termination of the
study. Gross examination of the tissues and organs after the 2-year
treatment failed to reveal any characteristic or significant
indications of toxicity that could be attributed to the inclusion of
methiocarb in the diet (Doull et al 1968).
Groups of 4 male and 4 female beagle dogs were maintained for
104 weeks on a diet containing methiocarb at concentrations of 0
(control), 15 (week 1-2), 5 (week 3-104); 60 and 240 ppm. On
termination of test diet administration, the dogs were sacrificed and
necropsied and organs were weighed and histopathologically examined.
Several dogs of the 240 ppm group were occasionally seen to have
slightly weak hind limbs, to tremble and to be slightly less attentive
during the first 14 treatment weeks. Increased vomiting was also seen
in the dogs of this group. Food was consumed slowly by female dogs fed
60 and 240 ppm and by male dogs fed 240 ppm. Dietary levels of 15 ppm
and above were observed in week 2 to depress plasma cholinesterase
activity. Following reduction of the 15 ppm level to 5 ppm, plasma
cholinesterase activity in this group rapidly returned to normal. The
depression of plasma cholinesterase activity induced by 60 ppm and
240 ppm was observed to be of a slightly dose-related degree. It was
more conspicuous at 2 h than at 24 h after feeding and remained
somewhat constant throughout the 2-year test diet administration.
Erythrocyte and brain cholinesterase activities were not depressed by
dietary levels as high as 240 ppm. Thus, in the 104-week dietary
administration of methiocarb to dogs, it was found that 60 ppm was the
no-somatic-effect dose. The dietary level of 5 ppm had no effect on
cholinesterase activity (Hoffman and Schilde 1980).
Cow
Feeding studies were carried out with cattle to determine the
effects of several organophosphorus and carbamate compounds.
Generally, 3 animals per treatment level were maintained for 1 month
on a diet containing levels of residues expected from normal use
(x), 3 x and 10x rates. Levels for methiocarb were 0.3, 0.9 and
3.0 mg/kg/day. Blood was collected throughout the test to monitor
cholinesterase activity. Residues in tissues and milk were determined
at the end of the test. Changes in weight and milk production were
noted and gross observations were made. Residues from methiocarb were
less than 0.05 ppm in tissues and ranged from 0.005 to 0.026 ppm in
milk. Cholinesterase inhibition in blood was not seen. There were
slight but insignificant effects on weight change and possible milk
production (Waggoner and Olson 1971).
Hen
Four groups of laying hens were fed rations containing
methiocarb/methiocarb sulphoxide (9:1) at levels of 20, 60, 120 and
360 ppm continuously for 28 days. A control group of 4 birds was also
maintained. Feed consumption and body weights were both affected,
but egg production was not affected by the treatment. A drop in
cholinesterase activity was observed in chickens dosed at 60, 120 and
360 ppm. No residues were detected in muscle or fat. Only slight
residues were seen in skin and egg at the highest level of testing,
while residues were detected in giblets (heart, gizzard, liver) in all
but the lowest dosage group (Strankowski and Minor 1976).
Long-term studies
Rat
Twenty-four male and 24 female Sprague-Dawley rats per group were
fed diets containing 0 (control), 25, 50 and 100 ppm for a period of
about 20 months to investigate the chronic effect of methiocarb.
Measurements of the effect of adding methiocarb to the diet on the
growth rate, food consumption, life span and mortality were made at
frequent intervals during the exposure period. Blood and tissue
cholinesterase activity determinations were carried out at the end of
the feeding period. The surviving animals were autopsied and the
tissues removed, weighed and prepared for histological examination.
Male and female rats were able to tolerate methiocarb in the diet at
levels of 100 ppm or less for a period extending over most of their
life span without exhibiting marked changes in food consumption,
growth rate or survival time. The addition of methiocarb to the diet
of male and female rats at dietary levels of 100 ppm or less did not
produce cholinergic or other toxic symptoms and did not result in
marked life-span shortening in either the male or female animals.
There was no marked inhibition of the blood and brain cholinesterase
activity in male and female rats at levels of 100 ppm or less for a
period of about 20 months. Gross examination of the tissues failed to
reveal any characteristic or significant pathology that could be
attributed to the presence of methiocarb in the diet of these rats
(Doull et al 1967).
Methiocarb was evaluated for potential chronic toxicity and
potential carcinogenicity in a 2-year study in which groups of 60 male
and 60 female Wistar rats were maintained on a diet containing
methiocarb at concentrations of 0 (control), 67, 200 and 600 ppm.
Clinical laboratory tests (haematology, clinical chemistry,
urinalysis, measurements of plasma and erythrocyte cholinesterase
activities) were performed at several intervals during the study on 10
male and 10 female rats of each test group. On termination of the
24-month test diet administration, all survivors were sacrificed
and grossly necropsied. The major organs were weighed, brain
cholinesterase activity measured in 10 male and 10 female rats of each
group and a comprehensive histological examination of tissues was
performed. Dietary levels of 600 ppm and less did not have any
untoward effects on the physical appearance, behavioural patterns,
survival rate and food consumption of either male or female rats. No
differences in weight gain were seen between control rats and the
treated male and female rats fed dietary levels of 200 ppm and less.
In the 600 ppm group, the body weights of both males and female were
significantly lower than those of the control rats throughout the
study. Haematology, clinical chemistry, urinalyses, gross pathology
and organ weight measurements did not provide any indication of
methiocarb-related alterations at dietary levels of 600 ppm or less.
The methiocarb dietary level of 67 ppm did not depress plasma and
erythrocyte cholinesterase activities. Rats fed 600 ppm had lower
plasma and erythrocyte cholinesterase activities than the controls. In
rats fed 200 ppm, cholinesterase activity decreased transiently below
the control level only in erythrocytes. Brain cholinesterase activity
was not depressed at any dietary level. Histopathology did not reveal
any methiocarb-induced tissue alterations at dietary levels of 600 ppm
or less. The study provided no indication of methiocarb having
carcinogenic effects. In the 2-year feeding experiment on rats, it was
thus found that the dietary level of 67 ppm had no untoward effect
whatsoever on any of the investigated parameters, including
cholinesterase activity (Krötlinger et al 1981).
Special studies on reproduction
Rat
In a 3-generation study involving two matings per generation,
groups of 10 male and 20 female Long Evans rat were fed a diet
containing methiocarb at concentrations of 0 (control), 30, 100 and
300 ppm, respectively. The treatment was evaluated for effect on
fertility, lactation performance and pup development. The rats
receiving these dietary concentrations did not differ from the
controls with respect to fertility, litter size, average pup weight at
birth, potential survival and lactation performance of the dams.
Because the number of pups per litter was larger than in the control
group, the body weights in the 300 ppm dose group of the F2b
generation and in the 100 and 300 ppm groups of the F3b generation
were lower at the end of the lactation period. Groups with smaller
litters consequently had higher body weights. Thus, these differences
were not considered attributable to inclusion of methiocarb in the
diet. The administered dietary concentrations did not cause any
malformation in the progeny. Histopathological examinations of the 10
major tissues from the F3b generation pups did not reveal any
methiocarb-related tissue alterations.
In this reproduction study, haematological tests, clinical-
chemical tests and urinalyses were performed at 10 and 24 weeks, i.e.
at the end of the pre-treatment just before mating and on conclusion
of lactation of the second litter of the F0 generation. These tests
did not indicate any blood profile damage or interference with liver
and kidney function at dietary levels of up to and including 300 ppm
(highest concentration). Blood sugar and cholesterol levels generally
were within the physiological range (Löser 1969, 1970).
Special studies on embryotoxicity and teratogenicity
Rat
Nineteen to 20 fertilized rats (Long Evans strain) received
methiocarb from gestation day 6 to 15 at dose levels of 0 (control),
1, 3 or 10 mg/kg bw. These dose levels were tested for general
tolerance to the pregnant rats as well as for possible embryotoxic and
teratogenic effects. The dose levels of 1 and 3 mg/kg bw were
tolerated by the pregnant rats without inducing any signs of damage.
Ten mg/kg bw did not affect general behaviour and appearance of the
dams. However, the rats of this dose group showed less weight gain,
although not significantly less, than the control animals during the
treatment period. Methiocarb had no influence on reproduction
parameters and had no teratogenic effect (Lorke 1971).
Special studies on mutagenicity
Microorganisms
Methiocarb was tested for potential mutagenic effects on
histidine-auxotrophic Salmonella typhimurium strains TA 1535, 100,
1537 and 98, with and without metabolic activation. No indication of
methiocarb having mutagenic effects was found (Herbold 1978).
Methiocarb was also found to be non-mutagenic when tested in three
strains of Saccharomyces cerevisiae, using reversion from histidine
and methionine auxotrophy as a measure of the induced mutation
(Guerzoni and DelCupola 1976).
Mammals in vivo
A micronucleus test was conducted on male and female NMRI mice to
evaluate methiocarb for potential mutagenic effects on the chromosomes
of bone marrow erythroblasts. The mice received two applications at an
interval of 24 h, and the femoral marrow was prepared 6 h after the
second application. The methiocarb doses were 2 × 5, 2 × 10 and
2 × 20 mg/kg bw per os. The test provided no indication of methiocarb
having a mutagenic effect at doses of up to and including 2 × 20 mg/kg
bw per os; the highest tested dose level was in the lethal range.
Erythrocyte production, measured against the ratio of polychromatic to
normochromatic erythrocytes, was not adversely affected either. The
co-tested positive control reference substance adriblastin had a
strong mutagenic effect (Herbold 1979b).
Dominant lethal
In a dominant lethal test to evaluate methiocarb for potential
mutagenicity, 50 male NMRI mice each received an acute oral dose of
6 mg methiocarb/kg bw. A vehicle control group consisted of the same
number of male mice. The applied dose had no effect on mouse fertility
or on the numbers of dead implants, viable implants, total implants or
pre-implantation losses. The test revealed no indication of mutagenic
effects of methiocarb (Herbold 1979a).
Special studies on neurotoxicity
Methiocarb administered twice orally at a 3-week interval, at a
dose level of 380 mg/ kg bw (LD50), to atropinized adult female hens
did not cause any delayed neurotoxicity. Neither clinical symptoms nor
histopathological signs of delayed neurotoxicity were seen in the
methiocarb-treated hens. Positive control hens treated orally with a
single non-lethal dose of TOCP at a level of 375 mg/kg bw showed both
clinical symptoms and histopathological manifestations of delayed
neurotoxicity (Thyssen and Schilde 1978).
Groups of 8 2-year old hens were fed methiocarb for 30 days at
dietary levels of 0 (control), 200, 400 and 800 ppm, respectively. At
the end of the 30-day feeding period, 4 hens of each group were
sacrificed and histopathologically examined. The other hens were kept
under observation, without treatment, for a further 30 days and then
examined. The treated hens of all groups did not show any cholinergic
symptoms or signs of paralysis. Histopathology did not reveal any
nerve tissue alterations (Ives 1965).
Special studies on cholinesterase inhibition
Acute experiments
Groups of Wistar rats, each consisting of 5 males and 5 females,
received a single dose of methiocarb at levels of 1, 10, 25 and
50 mg/kg bw by stomach tube. Cholinesterase activity in plasma and
erythrocytes was determined at intervals of 20 min, 2 h and 5 h after
the application. Cholinesterase activity in the male rats receiving
the highest dose was additionally determined after 90 min and 3 h.
Typical symptoms of acute inhibition of cholinesterase activity were
seen in the animals treated with doses of 10 mg/kg bw and above. These
symptoms appeared within 5 to 10 min after application and cleared 2 h
later. The male rats of the 50 mg/kg group died after 2 h. The maximum
dose-related levels of cholinesterase activity depression were
recorded 20 min after the application in the dose groups of 25 mg/kg
and below, and 20 min to 2 h after application in the highest dose
group. Two hours after the application, a marked increase in enzyme
activity was seen again in all dose groups except the highest one. In
another experiment, in which male rats received a single dose of
methiocarb at levels of 10 and 20 mg/kg bw, cholinesterase activity
was measured in the brain at intervals of 30 min, 1 h, 2 h, 3 h and
5 h after the application (3 animals/dose). Inhibition reached its
maximum after 2 h; thereafter, activity increased again (Eben and
Kimmerle 1973).
Subacute experiment
Groups of Wistar rats each consisting of 10 males and 10 females
were treated daily for 4 weeks with methiocarb at dose levels of 1, 3
and 10 mg/kg bw by stomach tube. Only the animals receiving the
highest dose level briefly exhibited cholinergic symptoms after the
applications. Cholinesterase activity in plasma and erythrocytes was
measured in 3 males and 3 females of each group 20 min after
administration on days 4, 8, 14, 21 and 28, and additionally 5 h after
the final application. Brain cholinesterase activity was measured in 5
male rats and 5 female rats of each group 2 h after the final
application. Plasma and erythrocyte cholinesterase activity was
depressed in the highest dose group (10 mg/kg bw). The degree of
depression was almost constant throughout the experiment. Likewise,
brain cholinesterase activity was depressed only in the 10 mg/kg
group. With respect to cholinesterase activity depression, the no-
effect level in this experiment was thus 3 mg methiocarb/kg bw/day
(Eben and Kimmerle 1973).
RESIDUES IN FOOD AND THEIR EVALUATION
USE PATTERN
Methiocarb is widely used world-wide as a bird repellent,
molluscicide, and insecticide. It is registered for use in Europe
(19 countries), Africa, America (USA and 13 countries of South
America), Canada, New Zealand and Asia. It is formulated as a wettable
powder, bait, and seed treatment and may be applied by spraying,
broadcast, pelleting and as a seed dressing. The Meeting was provided
with good agricultural practice information from Germany, Hungary, The
Netherlands, New Zealand and the USA. National good agricultural
practices are listed in Tables 4 and 5 according to type of treatment
or country, and a summary of world-wide proposed or recommended uses
is given in Table 6. Only minimal information was available on good
agricultural practices for bait formulations.
TABLE 4. National good agricultural practices for methiocarb
Spray treatment (insecticidal or bird repellent)
Country Crop Formulation Application Interval between
rate last application
and harvest (days)
Fed. Rep. Germany Cereals(insecticidal) 50% 0.3 kg a.i./ha 28
Potato (insecticidal) 50% 0.3 kg a.i./ha 14
Pome fruit (insecticidal) 50% 0.05% 14
New Zealand Grape (bird repellent) - 75 g a.i./100 L 14
Cherry (bird repellent) - 75 g a.i./100 L 10
Seedling vegetables
(bird repellent) - 750 g a.i./ha -
Pea seed (bird repellent) - 300 g a.i./100 kg seed -
Blueberry(bird repellent) - 75 g a.i./100 L 7
USA Blueberry (bird repellent) 75% WP 2.2 kg a.i./ha 0
Cherry (insecticidal) 75% WP 3.4-4.5 kg a.i./ha 7
(bird repellent) 75% WP 2.2-4.4 kg a.i./ha 7
Peach (insecticidal) 75% WP 3.4-4.5 kg a.i. 21
Fed.Rep. Germany Maize 50% 0.5 kg a.i./100 kg seed -
Beet 50% 0.45 kg a.i./100 kg seed -
USA Maize(field corn, sweet
corn, popcorn) 50% dust1 0.25-0.5 kg a.i. -
per 100 kg seed
Hungary Maize (bird repellent) - 0.5 kg a.i./100 kg seed -
TABLE 4. (con't)
Country Crop Formulation Application Interval between
rate last application
and harvest (days)
Bait Treatment
Fed.Rep. Germany Vegetables,field crops, 4% 0.12 kg a.i./ha 14
strawberry, and ornamentals broadcast or
(field and under glass) 40-120 mg/m/row
USA Citrus and avocado 2%1 0.32 lb/100 sq.ft. -
2 applications/season
(or half this rate
with metaldehyde)
1 State registration.
TABLE 5. National good agricultural practices for methiocarb, The Netherlands
Crop Kind of pest Application Treatment In use
situation1 controlled (kg a.i./ha) Formulation since2
Various l.s. snails 0.12-0.20 ) 4% granular bait 1968
vegetables s.s mole-cricket 0.12-0.20 ) 50% w.p. sprinkling between plants
Strawberry m.s. strawberry seed
beetle 0.20 50% w.p. sprinkling between plants
Maize l.s. bird repellent 0.5 kg/100 kg 50 w.p. seed dressing 1972
seed
Beet m.s. beet beetle + 0.5 kg/100 kg 50% w.p. seed dressing
springtails
Beet m.s. beet beetle +
springtails 0.5 50% w.p. soil treatment (row) 1975
Rapeseed m.s. flea beetle 0.5 50% w.p. crop treatment between mid
September and mid-October 1975
Ornamental
plants l.s. bird repellent 50 g/100 L 50% w.p. plant treatment when necessary 1977
1 l.s. = large scale, ms = moderate scale, s.s. = small scale;
2 Other registered uses: on ornamental plants in combination with propoxur against insects.
TABLE 6. Summary of world-wide proposed or recommended uses
Recommended
Dose Kind of No. of pre-harvest
Crop Pest (a.i %) application Formulation applications interval (days)
Pome, stone biting insects, 0.05 - 0.075 spraying WP 1 - 3 21
and berry- spider mites
fruit mealybugs
Potato biting insects 300 g/ha spraying WP 1 - 2 14
Sugarbeet pygmy mangold 450-900 g/ pelleting or Seed 1
beetle 100 kg seed as seed treatment
dressing
Maize to repel pheasants 500 g/100 kg seed coating Seed 1 -
and frit fly control seed treatment
Apple bird repellent 0.135 spraying WP 1 - 2 21
before harvest
Peach bird repellent 0.12 spraying WP 1 - 2 21
before harvest
Blueberry bird repellent 2.24 kg/ha spraying WP 3 0
before harvest
Grape bird repellent 2.2 kg/ha spraying WP 3 1
before harvest
Cherry bird repellent 4.48 kg/ha spraying WP 3 7
before harvest
TABLE 6. (con't)
Recommended
Dose Kind of No. of pre-harvest
Crop Pest (a.i %) application Formulation applications interval (days)
Vegetables, slugs 120-200 g/ha broadcast Slug 1 - 2 Vegetables and
strawberry, overall pellets strawberry 14;
oilseed rape, oilseed rape
cereals and cereals 90.
RESIDUES RESULTING FROM SUPERVISED TRIALS
Residue data are available in over 170 reports for 24 commodities
and parts thereof from six countries. As noted earlier, there are no
verified nationally-approved good agricultural practices for many of
the commodities for which data were provided. Where nationally-
approved uses have not been confirmed, uses are assumed to be proposed
good agricultural practices or manufacturer recommended uses. Table 7
summarizes residue data provided to the Meeting and maximum residue
estimates are discussed.
Apple
Whether the proposed or recommended uses are nationally-approved
could not be determined. After multiple applications in six trials of
two wettable powder formulations in three countries, according to
proposed or recommended good agricultural practices, maximum residues
ranged from 16 mg/kg at three days to about 8 mg/kg at the recommended
safety interval of 21 days. Maximum apparent residue in controls were
0.14 mg/kg when analysed by methodologies with sensitivities as low as
0.04 mg/kg and capable of measuring parent sulphoxide and sulphone. Up
to four months elapsed between last application and analysis.
Artichoke
Whether there are nationally-approved uses could not be
determined. Multiple applications of a 2% bait and a flowable
formulation of methiocarb in three trials in one state of the USA gave
maximum residues of approximately 9 mg/kg at day of last application.
However, no information was provided on established or proposed good
agricultural practices for the wettable powder formulation that
resulted in the high residues. Maximum residues for the bait
formulation at proposed application rates were 0.05 mg/kg at seven
days. Proposed good agricultural practices for the bait formulation on
artichokes would permit harvest on day of application (maximum residue
at one day is 0.03 mg/kg, no zero data are available). Up to five
months elapsed between last application and analysis. Data are
inadequate to permit an estimate of maximum residues.
Barley
Whether there are nationally-approved good agricultural practices
could not be determined. At an interval approximating recommended or
proposed pre-harvest intervals, no residues were detected using an
analytical method capable of 0.05 mg/kg measurements when application
rates were 0.6 × the maximum recommended. Up to six months elapsed
between last application and analysis.
Table 7. Methiocarb residues from supervised trials
Residues (mg/kg) at intervals (days) after application
Application (mean in parentheses where range is given)1
Crop Country Rate No.
(Year) No (kg a.i./ha) Formulation 0 1 3 4-5 7-8 10 13-14 15 21 Untreated samples
apple England 3 0.1% 50 WP 1.0 <0.15 <0.15
(1962)
Germany 3 1.0 50 WP 0.6 0.15 0.13 0.14
(1975)
Germany 3 1.0 50 WP 0.41 0.11 0.08 0.04
(1975)
U.S.A.
N.Y. 8 4.2 75 WP 6.6 5.3 5.0 7.3 7.9 0.05
(1974) (15 oz a.i./
100 gal)
WA
(1974) 9 4.8 75 WP 4.9 4.6 4.8 3.6 3.3 0.14
(20 oz a.i./
100 gal)
WA 8 7.6 75 WP 11.2 16.2 4.1 5.9 4.5 0.14
(1974) (20 oz a.i./
100 gal)
apple
fruit KS 8 20 oz a.i./ 75 WP 1.6
(1973) 100 gal
wet pomace 3.3
dry pomace 0.7
juice 2.0
Table 7. (con't)
Residues (mg/kg) at intervals (days) after application
Application (mean in parentheses where range is given)1
Crop Country Rate No.
(Year) No (kg a.i./ha) Formulation 0 1 3 4-5 7-8 10 13-14 15 21 Untreated samples
artichokes U.S.A.
CA 5 1.1 2% bait 0.03 0.03 0.05 <0.01 <0.01
(1975)
(1977) 5 1.1 <0.01 <0.01
(1975) 5 1.1 75% WP 8.9 4.1 3.8 1.5 0.9 <0.2
barley Germany 3 0.12 4% 76-92
(1980) days
grain N.D.3 3
straw N.D. 3
0 1 3-4 5 7-8 10 13-14 15 21 Untreated No. samples
beans, snap U.S.A. 1.1 2% bait
beans OR 5 0.03 <0.02
(1977)
beans FL 6 <0.01 0.02 <0.01 <0.01
(1976)
vines (1975) <0.01 <0.01 <0.01 <0.01
beans NY 5 0.5 0.02 0.02 <0.01
(1975)
vines (1974 0.5 0.06 <0.01
beans IN 5 0.03 <0.01 0.04 0.02
(1975)
vines (1974) 0.5 0.1 0.3
Table 7. (con't)
Application Residues (mg/kg) at intervals (days) after application
Crop Country Rate No.
(Year) No (kg a.i./ha) Formulation 0 1 3-4 5 7-8 10 13-14 15 21 Untreated samples
Canada 5 1.1 2% bait
(1975)
beans <0.01 <0.01 0.01 <0.01
vines <0.01 0.1 <0.01
beans, lima U.S.A. 1.1 2% bait
(1975)
pod CA 4 0.35 0.04
bean WI 5 <0.01 <0.01 0.02 0.08
pod 0.03 0.01 0.03 0.09
vine 0.03 0.6 0.04 <0.01
bean NJ 5 <0.01 <0.01 <0.01 <0.01
pod 0.02 0.01 0.02 <0.01
vine 0.2 0.02
U.S.A.
beans, lima IN 5 1.1 2% bait
(1975)
bean <0.01 <0.01 <0.01 <0.01
pod <0.01 0.04 0.02 0.02
vine <0.01 - <0.01
Canada 5 1.1 2% bait
(1975)
bean 0.01 <0.01 <0.01 <0.01
pod 0.01 0.03 <0.01 <0.01
vine 0.02 0.11
Table 7. (con't)
Application Residues (mg/kg) at intervals (days) after application
Crop Country Rate No.
(Year) No (kg a.i./ha) Formulation 0 1 3-4 5 7-8 10 13-14 15 21 Untreated samples
blueberry U.S.A. 75 WP
OR 3 1.7+1.7+2.2 3.3 5.2 5.4 <0.05
(1974)
(1975) 2 2.2 (aerial) 5.4 3.4 3.6 0.27
MI 2 2+2.2 3.1 0.05
(1975)
IN 2 2.2 25.6 0.17
(1975)
broccoli U.S.A. 1.1 2% bait
KS 5 boadcast
head (1975) 0.06 0.66 0.2
leaves 0.44 0.28 1.8
head OR 5 <0.01 0.02 0.03 <0.01
(1975)
leaves <0.01 0.06 0.01 <0.01
head TX 5 <0.02 <0.02 0.04 <0.02
(1976)
leaves <0.05 0.04 0.05 <0.02
head CA 5 0.26 <0.01
(1978)
Table 7. (con't)
Application Residues (mg/kg) at intervals (days) after application
Crop Country Rate No.
(Year) No (kg a.i./ha) Formulation 0 1 3-4 5 7-8 10 13-14 15 21 Untreated samples
brussel U.S.A. 1.1 2% bait
sprouts (broadcast)
IN 5 0.02 0.2 0.06 <0.01
(1975)
5 0.03 <0.01 <0.01 <0.01
KS 6 0.4 <0.01 0.3 <0.01
(1974)
CA 5 <0.01 <0.01 <0.01 <0.01
(1975)
5 <0.01 <0.01 0.02 <0.01
Canada 6 1.1 2% bait 0.24 0.18
(1975) (broadcast)
0 4 7 14 21-28 No. sample
cabbage Germany 2 0.12 4% 0
(white (1980) 0.06-0.9 ND-0.56 ND-0.09 ND 3
(0.03) (0.2) (0.05)
4 ND
7
14
21-28
Table 7. (con't)
Application Residues (mg/kg) at intervals (days) after application
Crop Country Rate No.
(Year) No (kg a.i./ha) Formulation 0 1 3 4-5 7-8 10 13-14 15 21 28-35 Untreated samples
currants, Germany 3 1 50 WP 12.8 5.7 4.6 2.9
red (1976)
21.7 7.4 6 2.8
6.5 3 1.6 4.3
1.5
0.28
citrus U.S.A. 5 1.1 2% bait Residues were <0.01 ppm in peel or pulp at 30-91 days after last
(1975) broadcast treatment on 2 trials on oranges and one each on lemons and grapefruit.
grapes U.S.A.
(MI, NY, 3-4 2.2 75 WP 2-9 1.8-6.1 1.4-4.0 <0.01-0.09 66
CA) (4.2) (3.3) (2.7)
grapes, NY
Baco noir (1973) 3 2.2 75 WP
grape 1.9 2.9 <0.02
juice 1.7 2.6 <0.02
wine 0.9 2.2 <0.04
Delaware NY 6 2.2 75 WP
(1977)
grape 2.6 2 <0.02
juice 1.7 1.6 <0.02
wine 1.1 1.0 1.3
Table 7. (con't)
Application Residues in mg/kg
Crop Country rate days after
(Year) no kg a.i./ha formulation last Crop part No.
application samples
heads leaves whole2
cabbage Canada 5 1.1 2% bait 1 0.2 10 3.1
(1975) broadcast 3 0.4 1.1 0.6
7 0.04 0.8 0.3
untreated 0.06 0.06 0.06
U.S.A. 5-6 1.1 2% bait 1 <0.01-1.1 0.2-5.1 0.08-1.6 8
(1975) broadcast (0.2) (1.7) (0.6)
(KS, TX,
NY, OR, 3 <0.01-0.17 0.18-3.2 0.08-1.0 7
CA) (0.06) (1.1) (0.4)
7 <0.01-0.05 1.3-15 0.4-4.5 6
(0.02) (8.5) (2.3)
untreated <0.01-<0.02 0.01-0.08 <0.01-0.02 6
(<0.01) (0.03) (0.02)
Germany 1 0.12 4% 0 ND3-0.34 3
(1978) (0.13)
(Savoy) 4 ND-1.7 3
(0.4)
7 ND-<0.05 3
(<0.05)
Table 7. (con't)
Application Residues in mg/kg
Crop Country rate days after
(Year) no kg a.i./ha formulation last Crop part No.
application samples
heads leaves whole2
14 ND-<0.05 3
(<0.05)
21 ND 3
cauliflower Canada 5 1.1 2% bait 1 0.03 0.12 0.05 1
(1975) broadcast
3 0.05 0.60 0.16 1
7 0.05 0.08 0.06 1
untreated 0.01 <0.01 <0.01 1
U.S.A. 5-6 1.1 2% bait
(KS, MI, broadcast
IN, OR,
NY, CA,
TX) 1 <0.01-3.0 0.06-6.8 .04-3.5 7
(1975- (0.75) (2.5) (1.5)
1976) 3 <0.01-2 0.04-12.4 0.08-4 6
(0.49) (3) 1.0
7 <0.01-1.1 <0.01-0.3 <0.01-1 6
(0.19) (0.09) (0.18)
8 0.29 11.4 2.4 1
untreated <0.01-0.01 <0.01 <0.01 7
Table 7. (con't)
Application Residues in mg/kg
Crop Country rate days after
(Year) no kg a.i./ha formulation last Crop part No.
application samples
stem
Germany 2 0.12 4% 0 0.3-2.3 0.07-0.8 0.61-5.9 4
(1980) (1.0) (0.41) (3.2)
4 0.1-0.27 0.07-0.36 0.2-1.6 4
(0.18) (0.2) (0.82)
7 0.05-0.14 <0.005-1.3 0.13-4.6 4
(0.09) (0.42) (2)
14 N.D.3 ND-<0.05 ND-0.2 4
28 N.D. ND-<0.05 ND-<0.05 4
cherries USA
(OR, MI) 3 4.5 75 WP 0 0.29-2.9 3
1976 (1.4) 3
7 0.21-2.1
(0.9)
14-15 0.08-0.9 3
(0.4)
untreated <0.02-0.4 3
(0.12)
Table 7. (con't)
Application Residues in mg/kg
Crop Country rate days after
(Year) no kg a.i./ha formulation last Crop part No.
application samples
heads leaves whole2
(sour) Germany 2 1.9-3.8 50 WP 0 5.4-11.9 4
1974-1976 (9.1)
1 5.9-11.9 2
(8.9)
3 0.8-7.9 4
(3.4)
7 2.3-8.2 4
(3.7)
10 1.8-3.5 2
(2.7)
21 1.2-4.1 2
(2.7)
Table 7. (con't)
Application Residues in mg/kg
Crop Country rate days after
(Year) no kg a.i./ha formulation last Crop part No.
application samples
green
forage kernel cob husk
corn, sweet U.S.A.
(MN, FL, 4 1.1 2% bait 0 0.06-8.2 <0.01-<0.02 <0.01-0.1 <0.01-0.4 11
IN, PA, topical (1.2) (0.13)
WI, OR,
CA, ID).
1977
1 0.07-1.4 <0.01-<0.02 <0.01-0.02 <0.01-0.6 11
(0.4) (0.13)
3 0.08-2.1 <0.01-<0.02 <0.01-0.03 0.06-0.5 11
(0.6) (0.11)
7 0.07-3.4 <0.01-<0.02 <0.01-0.04 0.02-0.75 11
(0.8) (0.22)
untreated <0.01-0.04 <0.01-0.02 <0.01-<0.02 <0.01-0.02 10
Table 7. (con't)
Application Residues in mg/kg
Crop Country rate days after
(Year) no kg a.i./ha formulation last Crop part No.
application samples
shelled
grain
corn, field U.S.A. 4 1.1 2% bait 9 <0.03 1
1977 topical untreated <0.03 1
maize Germany 8
1979-1970 1 500/g 50 WP 144-219 ND5
100 kg
seed
lettuce Germany 1 0.12 4% 0 ND3-0.24 7
(1970) (0.1)
3-4 ND-0.1 7
(.05)
7 ND-0.1 6
(<0.05)
10 ND-0.5 7
(0.09)
14 ND 4
Table 7. (con't)
Application Residues in mg/kg
Crop Country rate days after
(Year) no kg a.i./ha formulation last Crop part No.
application samples
outer or
wrapper other
head leaves leaves whole
U.S.A. 5 1.1 2% bait 1 0.01 0.1 8.3 2.3
(1976) (band 3-4 0.03 11 1.3 2.6
side-dress 7 0.03 1.1 12.2 3.7
untreated 0.02 <0.01 <0.01 <0.01
FL 5 1.1 2% bait 3-4 1.8
(1976) band
between
rows
outer or
wrapper other
head leaves leaves whole
TX, AZ 5-6 1.1 2% bait 1 <0.02-7.1 0.1-12.7 0.18-5.5 0.02-6.5 67
FL, NJ, CA (broadcast) (1.4) (4.1) (2.4) (2.5)
(1976-
1980)
3-4 <0.01-2.1 0.05-59 0.05-20 <0.02-30 6757
(0.5) (12.3) (5) (2.5)
Table 7. (con't)
Application Residues in mg/kg
Crop Country rate days after
(Year) no kg a.i./ha formulation last Crop part No.
application samples
outer or
wrapper other
head leaves leaves whole
7 <0.01-1.3 0.03-14 0.02-52 <0.02-11 57
(0.3) (5.7) (19) (3.7)
untreated <0.01-0.11 <0.01-0.13 <0.01- <0.01-
<0.02 0.12 57
peaches Canada 8 1.1 75 WP 7 6.6,20.5
(1973) foliar 14 3.8,13.5
21 2.3 4.7
untreated <0.05,0.08
U.S.A.
(1973) 4-7 1.1 75 WP 0 14-18.9
(WVA, WA foliar (11.5) 2
NC, SC,
CA) 3 18 1
7 5.4-23
(11) 6
14 1.8-11 6
(7)
Table 7. (con't)
Application Residues in mg/kg
Crop Country rate days after
(Year) no kg a.i./ha formulation last Crop part No.
application samples
21 0.7-10 8
(5.3)
untreated <0.03-0.22 8
(0.05)
potatoes Germany
(1972) 1 0.3 50 WP 14-28 ND5 6
prunes Germany 3 1 50 WP 0 0.6-1 3
(1976) (0.8)
14 0.5-0.7 3
(0.6)
21 0.4-0.8 3
(0.6)
28 0.3-0.5 3
(0.4)
35 0.3-0.6 3
(0.4)
rape Germany 3 0.12 4% 0 ND3-5.0
(1980) (1.1) 4
14 ND-0.54 2
(0.3)
Table 7. (con't)
Application Residues in mg/kg
Crop Country rate days after
(Year) no kg a.i./ha formulation last Crop part No.
application samples
20-21 ND-<0.05 3
(<0.05)
61-108 ND 5
grain straw
rice, U.S.A.
domestic (1977) 1 0.5 lb. 75 ST 105 0.03 0.14
(LA, MS, a.i. per i
TX, AR) 100 lb. 119 0.24 0.84
seed
141 0.01 0.32
147 0.11 <0.01
untreated 0.02-0.4 0.05-0.9
processed hulls
rice, wild U.S.A.
(1977) 2 2.2 75 WP 7-10 0.06 1.2
MN post-
emergence 14 0.08 0.11
broadcast
untreated 0.14 0.04-0.09
Table 7. (con't)
Application Residues in mg/kg
Crop Country rate days after
(Year) no kg a.i./ha formulation last Crop part No.
application samples
grain,
green straw
U.S.A. 2 2.2 75 WP 0 21-48 4.6-20 2
(1977) aerial 1 25-89 9.4-11 2
MN post- 3 12-18 5-6.2 2
emergence 7 6.6-18 3.9-10 2
10 6.8-23 0.6-8.4 2
untreated 0.1-1.6 0.04-0.05
spinach Germany 1 0.12 4% 0 ND5-1.8 4
(1978) (0.9)
4-21 ND 9
Strawberries Germany 1 0.12 4% 0 ND5
(under-glass (1974) 2
under 3-4 ND 6
plastic, 7-10 ND 6
and 14-21 ND 3
unspecified)
Leaves roots
sugar Germany 1 900g/100kg -- 135-136 ND5 ND5 2
beets (1971) seed 178-185 ND ND 3
Table 7. (con't)
Application Residues in mg/kg
Crop Country rate days after
(Year) no kg a.i./ha formulation last Crop part No.
application samples
Tomatoes Canada 5 1.1 2% bait 0 <0.01
(1975) broadcast 7 0.05
U.S.A. 5-6
(FL, KS, 1.1 2% bait 0 <0.01-0.42 8
NY, TX, broadcast (0.06)
IN, AZ,
CA, WI)
1 <0.01-0.08 7
(0.03)
3-4 <0.01-0.07 8
(0.02)
7 <0.01-0.3 8
(0.08)
untreated <0.01-0.1 9
(0.02)
fruit dry pulp puree juice
Tomato USA 6 1.1 2% bait 0 <0.02 <0.02 <0.02 <0.02 2
CA broadcast
(1977)
Table 7. (con't)
1 Residues given as <method sensitivity counted as 1/2 method sensitivity for mean;
2 estimated from a 2.5 head to leaf ratio;
3 ND = not detected with a method sensitivity of 0.05 ppm;
4 estimated from a 4.05 head to leaf ratio;
5 ND = not detected with a 0.02 ppm method sensitivity;
6 at each interval;
7 the number of samples given is for whole; for head, 5-6; for outer/wrapper leaves, 5-7; for other leaves, 3-4.
* Table based on submissions to the 1981 JMPR by Bayer AG and Mobay.
Beans
Whether there are nationally-approved good agricultural practices
could not be determined. Multiple applications of a 2% bait according
to proposed good agricultural practices resulted in maximum residues
of 0.46, 0.35 and 0.5 mg/kg, respectively, for beans (snap and lima),
pods and vines at or after the zero to one day intervals from last
application. Data were representative of seven states in the USA and
one site in Canada. A one-day pre-harvest interval is proposed. Up to
15 months elapsed between last application and analysis.
Blueberry
When treated according to good agricultural practices, maximum
residues were 25.6 mg/kg on last day of application. Samples were
analysed up to one year after last application by methodology
sensitive to 0.01 mg/kg. Maximum control values were 0.27 mg/kg.
Summary residue data from trials in New Zealand at 1-2 times proposed
good agricultural practices indicated residues can be up to 30 mg/kg
at 7 days (New Zealand 1981).
Broccoli
Whether there are nationally-approved good agricultural practices
could not be determined. Maximum residues after multiple applications
according to proposed or recommended application rates were 0.26 mg/kg
and 0.44 mg/kg respectively for the heads and leaves at one day after
last application and 0.1 mg/kg and 2 mg/kg on heads and leaves at 3-4
and 7-8 days respectively when analysed with a method capable of
0.01 mg/kg sensitivity. Maximum control values were < 0.02 mg/kg. The
proposed pre-harvest interval is zero days. Up to one year elapsed
from last application to analysis.
Brussels sprout
Whether there are nationally-approved good agricultural practices
could not be determined. When multiple applications of a bait
formulation was applied according to proposed or recommended rates for
brassica leafy vegetables in four sites in the USA and one in Canada,
maximum residues were 0.38 mg/kg at a one-day pre-harvest interval.
The proposed use on brassica leafy vegetables would allow use on day
of harvest. Maximum apparent residue on controls was < 0.01 mg/kg
(method sensitivity); up to 1.5 year elapsed from last application to
analysis. Errors were made in one set of data which were listed as
being from two different sites.
Cabbage
Whether there are nationally-approved uses for methiocarb on
cabbage could not be determined. When multiple applications of a 2%
bait formulation were applied to several varieties of cabbage at rates
approximating proposed uses, maximum residues one day after last
application (the nearest to the zero or one day pre-harvest intervals
proposed) were 3 mg/kg on a whole head basis. Maximum apparent
residues on control were 0.08 mg/kg. However, maximum residues at
seven days were 4.5 mg/kg estimated on a whole head basis, with head
to leaf weight ratios generally 2.45 to 3.9. There was an unexplained
trend of increasing residues from one day after last day of
application to seven days for the whole head basis and on the leaves
for four out of the nine studies. These increases were by a factor
range of 2 to 15 and suggest increasing plant uptake of soil residues
with time. The analytical method employed was capable of detection
at 0.01 mg/kg. Up to one year elapsed from last application to
analysis. When a 4% formulation was applied at rates of 0.6x the
proposed/recommended rates for vegetables, maximum residues at the
proposed/recommended 14-day pre-harvest interval was < 0.05 mg/kg.
Maximum residues at day of last application approach 1 mg/kg. The
analytical method used in these studies had a sensitivity of
0.05 mg/kg.
Cauliflower
At one day or longer after the last day of up to six broadcast
applications of a 2% bait to several varieties of cauliflower in
Canada and seven states in the USA, at maximum proposed/recommended
rates, maximum residues of methiocarb on whole plant, head and leaves
were 4, 3 and 12.4 mg/kg respectively. The residue of the whole plant
was calculated from a 4.05 head/leaf weight ratio. Proposed uses allow
for harvest on day of last application. The maximum values for
controls were at the 0.01 mg/kg analytical sensitivity. Up to 10
months elapsed between harvest and analysis. Maximum residues from
recommended/proposed uses of an unspecified country at 0.6x the
maximum proposed/recommended rates at the 14-day interval recommended
were N.D. (method sensitivity 0.05 mg/kg), 0.2 and < 0.05 mg/kg for
the head, stem and leaf respectively.
Cherry
Maximum residues on two varieties of cherries from maximum
approved USA good agricultural practices application rates and 7-day
pro-harvest interval were 2.1 mg/kg. Maximum control values were
0.35 mg/kg with an analytical sensitivity of 0.04 mg/kg. At rates
approximating (1.6x) other proposed/recommended good agricultural
practices for small fruits, the maximum average residue at 7 days
from 1 application (up to three recommended) was 8.2 mg/kg (method
sensitivity 0.05 mg/kg). Summary residue data reflecting 1-2 times New
Zealand good agricultural practices gave up to 12 mg/kg at 7 days (New
Zealand 1981).
Maize
When maize seed was treated in eight studies in one country
according to good agricultural practices (approved and/or recommended)
in three countries, residues were not detected at 114 to 219 days
after one treatment before planting, by a method with an analytical
sensitivity of 0.02 mg/kg. When sweet corn was topically treated four
times at maximum proposed rates with a 2% bait in eight states of the
USA, maximum residues were 8.2, <0.02, 0.1 and 0.75 mg/kg for the
forage, kernel, cob and husk respectively at the milk stage and 0 to 7
days after last treatment. Proposed uses permit harvest on day of last
application. The analytical capability was 0.01 mg/kg and maximum
control values were 0.04, 0.02, < 0.02 and 0.02 mg/kg respectively
for the forage, kernel, cob and husk. A similar treatment on field
corn gave residues of less than 0.03 mg/kg on the shelled grain 9 days
after last treatment. The interval from last application to analysis
ranged up to one year.
Currant, red
The maximum residue on red currants at the 21-day pre-harvest
interval proposed/recommended for small fruits was 6 mg/kg from three
studies in one country after three treatments with 50 WP. It could not
be determined whether the rate used was consistent with proposed/
recommended good agricultural practices, as application rates in the
field and recommended good agricultural practice information were in
different units.
Citrus
At 31 to 91 days after the last of five broadcast treatments of
grapefruit, lemon and orange at fruit set and at proposed application
rates, maximum residues were < 0.01 mg/kg in both the peel and the
pulp of treated and control samples. The proposed pre-harvest interval
is 31 days. Up to 15 months elapsed from last application to analysis.
No residue data were available from approved uses.
Grape
When five varieties of grapes were treated in three states in the
USA according to proposed good agricultural practices, maximum
residues at the proposed 7-day pre-harvest interval were 4 mg/kg on
grapes, and at 10 days, 2.6 mg/kg in juice and 2.2 mg/kg in wine.
There were no residue data available on grape pomace. Up to 18 months
elapsed from last application to analysis. Residues were up to 2 mg/kg
from application rates of 1 to 2 times New Zealand good agricultural
practices (New Zealand 1981).
Lettuce
No confirmed, approved good agricultural practice information was
provided to the Joint Meeting, although the recommended use on
vegetables in an unspecified location is listed as one to two
broadcasts at 0.12-0.2 kg/ha a.i., formulation unspecified, and a
14-day pre-harvest interval. Data from the Federal Republic of
Germany, representing one application of a 4% formulation at the lower
rate, were provided. At the 14-day interval no residues (< 0.05 mg/kg
according to method sensitivity) were detected in the four trials with
14-day interval, although one study had residues of 0.5 mg/kg at 10
days. The latter value was not consistent with data < 0.05 mg/kg) in
the same study at early intervals, although this is not necessarily
unexpected.
Data from five studies in the USA, representing proposed uses of
5 broadcast or side band applications of a 2% bait at 1.1 kg a.i./ha,
were available. Harvest on day of application is proposed. These data
were for the head, wrapper leaves, "other leaves", whole, or outer
leaves and were for intervals after application of 1 to 7 days.
Residues for the whole plant were estimated from the parts (head to
leaf weight ratios varies from 0.65 to 3), and the maximum residue at
one day after last application was 6.5 mg/kg. However, as in the case
of cabbage, in about one half the studies, residues were higher at
intervals later than the one day after last application. The maximum
residue (on the whole plant) was 29.5 mg/kg at three days. This
suggests uptake by the plant with time. This high one-day value may be
atypical. The next highest value is 11 mg/kg at three or seven days.
Maximum residues on wrapper leaves were up to 58 mg/kg. The maximum
value for untreated samples (whole basis) was 0.12 mg/kg although most
were < 0.02 mg/kg. The analytical method was capable of sensitivities
of 0.01 mg/kg and interval from last application to analysis was up to
13 months. The values for the "head" and leaves may be somewhat low
because of the relative amount of wrapper or other leaves removed.
Therefore, limits based on the head residue values would be somewhat
misleading.
Peach
Two residues studies from Canada and six from the USA
representing approved good agricultural practices were available.
Maximum residues at the approved 21-day pre-harvest interval were
10 mg/kg. Maximum apparent residue in untreated samples was 0.22 mg/kg
although they were generally < 0.08 mg/kg, even on the samples with
the high value, when analysed by a different analytical procedure.
Potato
Approved national uses could not be confirmed. No residues could
be detected at the 14-day pre-harvest interval recommended (apparently
in the Federal Republic of Germany) when one of two permitted spray
applications of a wettable powder formulation were made. The
analytical sensitivity was 0.02 mg/kg. These minimal data are not
sufficient to estimate maximum residues.
Prune
Whether there are nationally-approved good agricultural practices
for use of methiocarb on prunes could not be determined. Residue
trials conducted at application rates of 1 kg a.i./ha (0.05%) resulted
in maximum residues of 0.8 mg/kg at the recommended 21-day pre-harvest
interval. These application rates approximate recommended rates of
0.05 to 0.075% for stone fruit. These data are too minimal as a basis
for estimating maximum residue limits.
Rape
Whether there are nationally-approved good agricultural practice
for the use of methiocarb on rape could not be determined, except for
one country from which no residue data were provided. When two
applications of a 4% formulation was applied to rape at 0.12 kg
a.i./ha (0.12-0.200 kg/ha recommended), no residues (<0.05 mg/kg)
were detected at intervals approximating the recommended 90 days after
last application. These application rates were thus only 0.6x the
maximum recommended and would not be all adequate basis for estimating
maximum residue.
Rice
Whether there are nationally-approved good agricultural practices
for the use of methiocarb on rice could not be determined. Maximum
residues at 105 to 147 days after the last application of a seed
treatment at approximately 2x proposed/recommended rates were
0.24 mg/kg in grain and 0.84 mg/kg in the straw. Maximum apparent
residues in untreated controls were 0.44 mg/kg in the grain and
0.84 mg/kg in the straw, although the untreated samples corresponding
to the maximum residues in treated samples had substantially less
apparent residue. When wild rice was treated according to proposed
uses (with last application at late dough stage) maximum residues on
day of last application were 48 mg/kg in the green grain. Maximum
residues for the processed grain at 10 to 14 days after last
application were 0.08 mg/kg (less than the 0.14 mg/kg in untreated
samples). In the absence of more specific information on pre-harvest
intervals, a zero-day interval must be assumed. Up to seven months
elapsed from last application to analysis. These minimal data from one
geographic location are inadequate for estimating maximum residues in
wild rice.
Spinach
Whether there are nationally-approved good agricultural practices
could not be determined. At 0.12 kg a.i./ha (proposed/recommended rate
is two applications at 0.12 to 0.2 mg/kg for vegetables) no residues
were detected using an analytical method with a limit of sensitivity
of approximately 0.03 mg/kg at the recommended 14-day pre-harvest
interval. These data are inadequate for estimation of maximum
residues in terms of number of applications, quantity and as being
representative of maximum recommended uses.
Strawberry
Whether there are nationally-approved good agricultural practices
could not be determined. After a single application at rates 0.6 to
0.8x that recommended for a 4% formulation, no residues were detected
from 0 to 21 days after last application. Recommended uses allow two
applications. The analytical method was capable of measuring residues
at approximately 0.02 mg/kg. No data were available for proposed uses
of other formulations. Although only one application was made, the
absence of residues at any level through the recommended 14-day
interval suggests a limit at or about the method sensitivity of
0.02 mg/kg would be adequate for the recommended use.
Sugarbeet
Whether there are nationally-approved good agricultural practices
could not be determined, except for one country from which no residue
data were available. No residues (<0.02 mg/kg method sensitivity)
were detected in the roots or leaves of sugarbeets at 135 to 185 days
after seed treatment according to recommended usage.
Tomato
Whether there are approved national good agricultural practices
for methiocarb uses on tomatoes could not be confirmed. No data were
available for recommended/proposed uses on vegetables. Data were
available for proposed use for 2% bait broadcast applications in North
America where harvest on day of last application is proposed. Maximum
residues were 0.42 mg/kg at day of application. Two processing studies
were available in which the dry pulp, puree and juice of treated
tomatoes were analysed, but these were not adequate for conclusions on
the potential for residue concentration as the fruit that was
processed did not have significant residues.
FATE OF RESIDUES
General
Methiocarb is readily metabolized or degraded in the environment
by plants, animals and microorganisms. While hydrolysis and oxidation
are the principle paths for these chemical changes, the conditions of
a particular situation determine the order and relative importance of
these processes. Table 1 identifies metabolites and degradation
products of methiocarb and provides abbreviated designations which are
used in Figure 2, in which methiocarb metabolic routes are summarized.
Similar analytical approaches have been used for determination of
the fate of methiocarb. Typically, extractions of tissues, excretory
products, milk etc. were made with organic solvents for extraction of
non-conjugated moieties followed by enzymatic and/or acid hydrolysis
of aqueous fractions to release conjugates. Analyses were by thin
layer, radiometric, and scintillation techniques.
In plants
Methiocarb uptake, distribution and metabolism in lettuce and
tomato plants were studied for up to 14 days and up to 56 days in
tomato fruit. Direct soil or nutrient solution applications of (ring-
l-14C)-methiocarb 75 WP were made at rates equivalent to 1 lb.
a.i./acre (1 lb/acre = 1.121 kg/ha) (Strankowski and Murphy 1976).
Radioactivity was rapidly taken up by tomato and lettuce plants, being
translocated throughout within one day, levelling off at seven days in
lettuce and continuing. Over 40 to 50% of applied radioactivity was
contained in the plants within two weeks, with the organic soluble
portion decreasing from 75 and 81% of total activity at one day
respectively in lettuce and tomato plants, to 6 and 13% after two
weeks. Radioactivity in the aqueous phase, on the other hand,
increased from 25 and 19% at one day to 94 and 87% respectively on day
14. Organic phase residues in the plants at day one were 30 to 50%
methiocarb sulphoxide, 15-20% methiocarb, and in tomato plants, also
6% methiocarb sulphoxide phenol. Predominant tissues in the aqueous
phase after hydrolysis are methiocarb phenol and its sulphoxide
phenol, with lesser amounts of methiocarb, its sulphoxide, sulphone
and sulphone phenol.
In the tomato fruit study, radioactivity was up to 12 mg/kg
methiocarb equivalent in the leaves at day 28 (96% water soluble) and
up to 0.1 mg/kg in fruit. No methiocarb or carbamate metabolites were
detected in the organosoluble phase. The non-carbamate residues were
not identified.
Greenhouse-grown rice was treated in one study with one
application of (ring-l-14C)-methiocarb 75 WP at a rate of 1 lb
a.i./acre at planting to simulate seed treatment and in another with
1-2 foliar applications (Strankowski 1979) at 2 lb a.i./acre at soft
dough stage. As in the case of soil-treated tomatoes and lettuce,
radioactivity from the simulated seed treatment was steadily taken up
through the 35-day test period (21% of applied in the rice stalks at
day 35). From the foliar treatment, radioactivity decreased through
the post-application period to about 12% of zero day radioactivity in
the grain and to 20 to 60% in stalk at day 28. Surface rinses of the
TOXICOLOGICAL STUDIES
Acute toxicity
The acute toxicity of methiocarb was tested in several animal
species. Results are summarized in Table 2. Acute toxicity of
methiocarb metabolites were tested in rats, and results are given in
Table 3.
Symptoms of poisoning after acute application
The symptoms of poisoning were typical of cholinesterase activity
depression, and were characterized by trembling, muscular
fasciculations, ataxia, salivation, lachrymation and diarrhoea.
Vomiting was also seen in dogs. The severity and duration of the
symptoms were dose-related. Onset of symptoms was within minutes after
oral and intraperitoneal administration, and they usually persisted
for no more than a few hours. Deaths usually occurred within a few
hours after administration (Bayer 1981).
TABLE 2. Acute toxicity of methiocarb in animals
Species Sex Route Solvent/vehicle LD50(mg/kg) Reference
Rat M oral H2O + tragacanth ca. 100 Kimmerle 1960
oral polyethylene 67 " 1966a
M oral glycol 400 13-15 Lamb and Matzkanin
F oral " 31-32 1976
M oral " 28.0-35.1 Thyssen 1977a
M oral " 33 Nelson 1979
F oral " 47 "
F oral ethanol + polyethylene 100 DuBois and Raymund
glycol 1962
M oral " 130 "
F oral " 135 1961a
M ip H2O + tragacanth ca. 100 Kimmerle 1960
F ip ethanol + polyethylene 25 DuBois and Raymund
glycol 1962
M ip " 35 "
ip " 30 1961b
F dermal,24h ethanol >300 "
1962
M dermal,24h oil >1000 Kimmerle 1960
M&F dermal,24h polyethylene >5000 Thyssen 1977b
glycol 400
M ip ethanol + polyethylene 6.0 DuBois and Raymund
F ip glycol 5.5 1961b
TABLE 2. (con't)
Species Sex Route Solvent/vehicle LD50(mg/kg) Reference
Guinea F oral H2O + emulsifier 50-100 Kimmerle 1969a
pig M oral ethanol + polyethylene 40 DuBois and Raymund
glycol 1961a
F oral ethylene glycol 14.1 Crawford and
Anderson 1972
M ip " 17 DuBois and Raymund
1961b
Rabbit M&F dermal,24h saline >2000 Crawford and
Anderson 1972
Dog M&F oral none (gelatin 25.4 Lamb and Matzkanin
capsule) 1975
F oral H2O + emulsifier 10-25 Kimmerle 1969
Hen oral ethanol + polyethylene 175 DuBois 1962
glycol
TABLE 3. Acute toxicity of several metabolites of methiocarb in the rat
Chemical
(M=methiocarb) Sex Route LD50(mg/kg) Reference
M sulphoxide M oral 6-9 Lamb and Matzkanin
F oral 7-8 1976a, b
oral 42.9 Solmecke 1970a
M sulphone oral >1000 " 1970b
M phenol oral >10001 " 1970c
M oral >10001 DuBois 1964
M dermal >10001 "
M sulphoxide phenol M oral >10001 "
oral >10001 Solmecke 1970d
M dermal >10001 DuBois 1964
M sulphone phenol M oral >10001 "
oral >10001 Solmecke 1970e
M dermal >10001 DuBois 1964
N-hydroxymethyl M M oral >1121 Nelson 1979
F oral >1121 "
N-hydroxymethyl M oral >1121 "
M sulphone F oral >1121 "
N-hydroxymethyl M oral >1601 "
M sulphoxide F oral >1601 "
1 = no mortality.
When ethanol solutions of methiocarb were applied to the skin of
rats at dose levels of 100 and 200 mg/kg, cholinergic symptoms were
observed at the higher dose hut no mortality occurred. Methiocarb was
not well-absorbed from the skin, even when dissolved in a solvent
that should increase dermal absorption. Following application of
polythylene glycol 400 solutions of methiocarb to the skin of rats,
mild cholinergic symptoms of brief duration were also observed at dose
levels of 100 mg/kg bw and above, but no mortalities occurred at dose
levels of up to and including 5 000 mg/kg bw (Bayer 1981).
When one-half of the LD50 of methiocarb was given
intraperitoneally to female rats in combination with the same fraction
of the LD50 of trichlorfon, coumaphos, oxydemeton methyl, fenthion or
propoxur, additive or less than additive acute toxicity was observed
(DuBois and Raymund 1961b).
Potentiation of acute toxicity was investigated in another study
on female rats involving simultaneous intraperitoneal administration
of equitoxic doses of methiocarb and 15 other anticholinesterase
insecticides. The results of the tests demonstrated that potentiation
of acute toxicity does not occur when methiocarb was given in
combination with each of the 15 other anticholinesterase insecticides,
including parathion, methyl parathion, malathion, azinophos methyl
a.o. (DuBois and Raymund 1961b).
Antidote studies
Studies on the protective efficacy of atropine for the treatment
of poisoning by methiocarb demonstrated that the intraperitoneal
injection of 100 mg/kg of atropine sulphate 10 min before treatment
with the carbamate raises the LD50 from 30 to 100 mg/kg. The
intraperitoneal administration of 100 mg/kg of 2-PAM immediately
before or at 15 min after methiocarb administration had no significant
protective or antidotal activity (Dubois and Raymund 1961a).
In another experiment, 50 mg/kg of atropine sulphate or of PAM or
20 mg/kg of Toxogonin, respectively, was injected intraperitoneally
shortly before the appearance of acute symptoms following the oral
application of methiocarb. Injection of atropine sulphate raised the
LD50 from 67 to 467.5 mg/kg bw. PAM and Toxogonin had only a slight
effect. These results demonstrate that atropine has an excellent
antidotal effect in rats poisoned with methiocarb (Kimmerle 1966).
Confirmation of the good antidotal effect of atropine sulphate
was obtained in further experiments. Intraperitoneal injection of
50 mg atropine sulphate/kg bw at onset of cholinergic symptoms
following acute oral administration of methiocarb to male rats raised
the LD50 from 104.5 to 643 mg/kg bw (Kimmerle 1971).
Atropine proved to be an effective antidote also in a dog
accidentally poisoned with methiocarb (Udall 1973).
Short-term studies
Rat
Male rats were dosed on 27 consecutive work-days with methiocarb
suspended in water plus tragacanth and administered by oral
intubation. The daily dose was 2 mg/kg on each of the first 3 days and
4 mg/kg bw thereafter. During and also after termination of treatment,
groups of 3 rats were sacrificed twice weekly, and erythrocyte
cholinesterase activity was measured. Cholinesterase activity
decreased during the course of the treatment, amounted to about 80%
after 14 days, and was 50% on termination of treatment. During the
post-treatment observation period, activity increased again only at a
very slow rate and did not return to normal until about 42 days after
termination of treatment. Cholinergic symptoms were not seen during
the treatment period (Kimmerle 1960).
The subacute oral toxicity of methiocarb was investigated in male
and female weanling Sprague-Dawley rats by feeding groups of animals
diets containing 0, 5, 10 and 50 ppm of methiocarb for a period of 16
weeks. The rats tolerated methiocarb in the diet at levels as high as
50 ppm for 16 weeks without exhibiting any alteration of their growth
rate or food consumption. Animals fed methiocarb at 10 ppm did not
exhibit cholinergic or other toxic symptoms. Methiocarb could be fed
to male and female rats at a dietary concentration of 10 ppm for 16
weeks without producing inhibition of the cholinesterase activity of
the serum, erythrocytes, brain or submaxillary glands. When the
dietary concentration was increased to 50 ppm, the activity of this
enzyme was reduced in the semen by about 30% and that of the
erythrocytes was decreased by about 15% (Doull et al 1962).
Dog
The subchronic oral toxicity of methiocarb was investigated in
male and female beagle dogs to determine the level that can be added
to the diet without producing detectable symptoms of poisoning or
significant inhibitions of blood cholinesterase activity. Dietary
levels of 0 (control), 50, 100 and 250 ppm were employed for these
studies, in which 2 male and 2 female dogs were fed each of these
dietary levels. Individual measurements of the serum and erythrocyte
cholinesterase activity were made weekly for a period of 12 weeks. It
was shown that dietary levels as high as 250 ppm can be fed to male
and female beagle dogs for 12 weeks without causing any reduction of
their normal growth rate or the appearance of other toxic symptoms.
Levels as high as 250 ppm caused no significant inhibition of the
cholinesterase activity of serum or erythrocytes and produced no
cholinergic symptoms (Root et al 1963).
Two male and two female beagle dogs were fed diets containing 0
(control), 50, 100 and 250 ppm of methiocarb for a period of 2 years.
The animals were observed daily for symptoms of cholinergic
stimulation. Measurements of the growth rate, food consumption and
blood cholinesterase activity were carried out at intervals during the
exposure period. At the end of the 2-year feeding period, the dogs
were autopsied and the tissues removed and prepared for microscopic
examination. Samples of the brain, liver and blood were also taken at
autopsy for the terminal cholinesterase activity determinations. The
inclusion of methiocarb in the diet at levels of 250 ppm or less did
not significantly alter the growth rate-food consumption or general
physical condition of either male or female dogs. None of the dietary
levels of methiocarb used produced cholinergic symptoms or other
indications of toxic effects that could be attributed to the presence
of methiocarb in the diet. The dogs tolerated methiocarb in the diet
at levels of 250 ppm or less for a period of 2 years without
exhibiting a significant inhibition of either the serum or erythrocyte
cholinesterase activity. Blood, brain and liver cholinesterase
activity was also not seen to be depressed at termination of the
study. Gross examination of the tissues and organs after the 2-year
treatment failed to reveal any characteristic or significant
indications of toxicity that could be attributed to the inclusion of
methiocarb in the diet (Doull et al 1968).
Groups of 4 male and 4 female beagle dogs were maintained for
104 weeks on a diet containing methiocarb at concentrations of 0
(control), 15 (week 1-2), 5 (week 3-104); 60 and 240 ppm. On
termination of test diet administration, the dogs were sacrificed and
necropsied and organs were weighed and histopathologically examined.
Several dogs of the 240 ppm group were occasionally seen to have
slightly weak hind limbs, to tremble and to be slightly less attentive
during the first 14 treatment weeks. Increased vomiting was also seen
in the dogs of this group. Food was consumed slowly by female dogs fed
60 and 240 ppm and by male dogs fed 240 ppm. Dietary levels of 15 ppm
and above were observed in week 2 to depress plasma cholinesterase
activity. Following reduction of the 15 ppm level to 5 ppm, plasma
cholinesterase activity in this group rapidly returned to normal. The
depression of plasma cholinesterase activity induced by 60 ppm and
240 ppm was observed to be of a slightly dose-related degree. It was
more conspicuous at 2 h than at 24 h after feeding and remained
somewhat constant throughout the 2-year test diet administration.
Erythrocyte and brain cholinesterase activities were not depressed by
dietary levels as high as 240 ppm. Thus, in the 104-week dietary
administration of methiocarb to dogs, it was found that 60 ppm was the
no-somatic-effect dose. The dietary level of 5 ppm had no effect on
cholinesterase activity (Hoffman and Schilde 1980).
Cow
Feeding studies were carried out with cattle to determine the
effects of several organophosphorus and carbamate compounds.
Generally, 3 animals per treatment level were maintained for 1 month
on a diet containing levels of residues expected from normal use
(x), 3 x and 10x rates. Levels for methiocarb were 0.3, 0.9 and
3.0 mg/kg/day. Blood was collected throughout the test to monitor
cholinesterase activity. Residues in tissues and milk were determined
at the end of the test. Changes in weight and milk production were
noted and gross observations were made. Residues from methiocarb were
less than 0.05 ppm in tissues and ranged from 0.005 to 0.026 ppm in
milk. Cholinesterase inhibition in blood was not seen. There were
slight but insignificant effects on weight change and possible milk
production (Waggoner and Olson 1971).
Hen
Four groups of laying hens were fed rations containing
methiocarb/methiocarb sulphoxide (9:1) at levels of 20, 60, 120 and
360 ppm continuously for 28 days. A control group of 4 birds was also
maintained. Feed consumption and body weights were both affected,
but egg production was not affected by the treatment. A drop in
cholinesterase activity was observed in chickens dosed at 60, 120 and
360 ppm. No residues were detected in muscle or fat. Only slight
residues were seen in skin and egg at the highest level of testing,
while residues were detected in giblets (heart, gizzard, liver) in all
but the lowest dosage group (Strankowski and Minor 1976).
Long-term studies
Rat
Twenty-four male and 24 female Sprague-Dawley rats per group were
fed diets containing 0 (control), 25, 50 and 100 ppm for a period of
about 20 months to investigate the chronic effect of methiocarb.
Measurements of the effect of adding methiocarb to the diet on the
growth rate, food consumption, life span and mortality were made at
frequent intervals during the exposure period. Blood and tissue
cholinesterase activity determinations were carried out at the end of
the feeding period. The surviving animals were autopsied and the
tissues removed, weighed and prepared for histological examination.
Male and female rats were able to tolerate methiocarb in the diet at
levels of 100 ppm or less for a period extending over most of their
life span without exhibiting marked changes in food consumption,
growth rate or survival time. The addition of methiocarb to the diet
of male and female rats at dietary levels of 100 ppm or less did not
produce cholinergic or other toxic symptoms and did not result in
marked life-span shortening in either the male or female animals.
There was no marked inhibition of the blood and brain cholinesterase
activity in male and female rats at levels of 100 ppm or less for a
period of about 20 months. Gross examination of the tissues failed to
reveal any characteristic or significant pathology that could be
attributed to the presence of methiocarb in the diet of these rats
(Doull et al 1967).
Methiocarb was evaluated for potential chronic toxicity and
potential carcinogenicity in a 2-year study in which groups of 60 male
and 60 female Wistar rats were maintained on a diet containing
methiocarb at concentrations of 0 (control), 67, 200 and 600 ppm.
Clinical laboratory tests (haematology, clinical chemistry,
urinalysis, measurements of plasma and erythrocyte cholinesterase
activities) were performed at several intervals during the study on 10
male and 10 female rats of each test group. On termination of the
24-month test diet administration, all survivors were sacrificed
and grossly necropsied. The major organs were weighed, brain
cholinesterase activity measured in 10 male and 10 female rats of each
group and a comprehensive histological examination of tissues was
performed. Dietary levels of 600 ppm and less did not have any
untoward effects on the physical appearance, behavioural patterns,
survival rate and food consumption of either male or female rats. No
differences in weight gain were seen between control rats and the
treated male and female rats fed dietary levels of 200 ppm and less.
In the 600 ppm group, the body weights of both males and female were
significantly lower than those of the control rats throughout the
study. Haematology, clinical chemistry, urinalyses, gross pathology
and organ weight measurements did not provide any indication of
methiocarb-related alterations at dietary levels of 600 ppm or less.
The methiocarb dietary level of 67 ppm did not depress plasma and
erythrocyte cholinesterase activities. Rats fed 600 ppm had lower
plasma and erythrocyte cholinesterase activities than the controls. In
rats fed 200 ppm, cholinesterase activity decreased transiently below
the control level only in erythrocytes. Brain cholinesterase activity
was not depressed at any dietary level. Histopathology did not reveal
any methiocarb-induced tissue alterations at dietary levels of 600 ppm
or less. The study provided no indication of methiocarb having
carcinogenic effects. In the 2-year feeding experiment on rats, it was
thus found that the dietary level of 67 ppm had no untoward effect
whatsoever on any of the investigated parameters, including
cholinesterase activity (Krötlinger et al 1981).
Special studies on reproduction
Rat
In a 3-generation study involving two matings per generation,
groups of 10 male and 20 female Long Evans rat were fed a diet
containing methiocarb at concentrations of 0 (control), 30, 100 and
300 ppm, respectively. The treatment was evaluated for effect on
fertility, lactation performance and pup development. The rats
receiving these dietary concentrations did not differ from the
controls with respect to fertility, litter size, average pup weight at
birth, potential survival and lactation performance of the dams.
Because the number of pups per litter was larger than in the control
group, the body weights in the 300 ppm dose group of the F2b
generation and in the 100 and 300 ppm groups of the F3b generation
were lower at the end of the lactation period. Groups with smaller
litters consequently had higher body weights. Thus, these differences
were not considered attributable to inclusion of methiocarb in the
diet. The administered dietary concentrations did not cause any
malformation in the progeny. Histopathological examinations of the 10
major tissues from the F3b generation pups did not reveal any
methiocarb-related tissue alterations.
In this reproduction study, haematological tests, clinical-
chemical tests and urinalyses were performed at 10 and 24 weeks, i.e.
at the end of the pre-treatment just before mating and on conclusion
of lactation of the second litter of the F0 generation. These tests
did not indicate any blood profile damage or interference with liver
and kidney function at dietary levels of up to and including 300 ppm
(highest concentration). Blood sugar and cholesterol levels generally
were within the physiological range (Löser 1969, 1970).
Special studies on embryotoxicity and teratogenicity
Rat
Nineteen to 20 fertilized rats (Long Evans strain) received
methiocarb from gestation day 6 to 15 at dose levels of 0 (control),
1, 3 or 10 mg/kg bw. These dose levels were tested for general
tolerance to the pregnant rats as well as for possible embryotoxic and
teratogenic effects. The dose levels of 1 and 3 mg/kg bw were
tolerated by the pregnant rats without inducing any signs of damage.
Ten mg/kg bw did not affect general behaviour and appearance of the
dams. However, the rats of this dose group showed less weight gain,
although not significantly less, than the control animals during the
treatment period. Methiocarb had no influence on reproduction
parameters and had no teratogenic effect (Lorke 1971).
Special studies on mutagenicity
Microorganisms
Methiocarb was tested for potential mutagenic effects on
histidine-auxotrophic Salmonella typhimurium strains TA 1535, 100,
1537 and 98, with and without metabolic activation. No indication of
methiocarb having mutagenic effects was found (Herbold 1978).
Methiocarb was also found to be non-mutagenic when tested in three
strains of Saccharomyces cerevisiae, using reversion from histidine
and methionine auxotrophy as a measure of the induced mutation
(Guerzoni and DelCupola 1976).
Mammals in vivo
A micronucleus test was conducted on male and female NMRI mice to
evaluate methiocarb for potential mutagenic effects on the chromosomes
of bone marrow erythroblasts. The mice received two applications at an
interval of 24 h, and the femoral marrow was prepared 6 h after the
second application. The methiocarb doses were 2 × 5, 2 × 10 and
2 × 20 mg/kg bw per os. The test provided no indication of methiocarb
having a mutagenic effect at doses of up to and including 2 × 20 mg/kg
bw per os; the highest tested dose level was in the lethal range.
Erythrocyte production, measured against the ratio of polychromatic to
normochromatic erythrocytes, was not adversely affected either. The
co-tested positive control reference substance adriblastin had a
strong mutagenic effect (Herbold 1979b).
Dominant lethal
In a dominant lethal test to evaluate methiocarb for potential
mutagenicity, 50 male NMRI mice each received an acute oral dose of
6 mg methiocarb/kg bw. A vehicle control group consisted of the same
number of male mice. The applied dose had no effect on mouse fertility
or on the numbers of dead implants, viable implants, total implants or
pre-implantation losses. The test revealed no indication of mutagenic
effects of methiocarb (Herbold 1979a).
Special studies on neurotoxicity
Methiocarb administered twice orally at a 3-week interval, at a
dose level of 380 mg/ kg bw (LD50), to atropinized adult female hens
did not cause any delayed neurotoxicity. Neither clinical symptoms nor
histopathological signs of delayed neurotoxicity were seen in the
methiocarb-treated hens. Positive control hens treated orally with a
single non-lethal dose of TOCP at a level of 375 mg/kg bw showed both
clinical symptoms and histopathological manifestations of delayed
neurotoxicity (Thyssen and Schilde 1978).
Groups of 8 2-year old hens were fed methiocarb for 30 days at
dietary levels of 0 (control), 200, 400 and 800 ppm, respectively. At
the end of the 30-day feeding period, 4 hens of each group were
sacrificed and histopathologically examined. The other hens were kept
under observation, without treatment, for a further 30 days and then
examined. The treated hens of all groups did not show any cholinergic
symptoms or signs of paralysis. Histopathology did not reveal any
nerve tissue alterations (Ives 1965).
Special studies on cholinesterase inhibition
Acute experiments
Groups of Wistar rats, each consisting of 5 males and 5 females,
received a single dose of methiocarb at levels of 1, 10, 25 and
50 mg/kg bw by stomach tube. Cholinesterase activity in plasma and
erythrocytes was determined at intervals of 20 min, 2 h and 5 h after
the application. Cholinesterase activity in the male rats receiving
the highest dose was additionally determined after 90 min and 3 h.
Typical symptoms of acute inhibition of cholinesterase activity were
seen in the animals treated with doses of 10 mg/kg bw and above. These
symptoms appeared within 5 to 10 min after application and cleared 2 h
later. The male rats of the 50 mg/kg group died after 2 h. The maximum
dose-related levels of cholinesterase activity depression were
recorded 20 min after the application in the dose groups of 25 mg/kg
and below, and 20 min to 2 h after application in the highest dose
group. Two hours after the application, a marked increase in enzyme
activity was seen again in all dose groups except the highest one. In
another experiment, in which male rats received a single dose of
methiocarb at levels of 10 and 20 mg/kg bw, cholinesterase activity
was measured in the brain at intervals of 30 min, 1 h, 2 h, 3 h and
5 h after the application (3 animals/dose). Inhibition reached its
maximum after 2 h; thereafter, activity increased again (Eben and
Kimmerle 1973).
Subacute experiment
Groups of Wistar rats each consisting of 10 males and 10 females
were treated daily for 4 weeks with methiocarb at dose levels of 1, 3
and 10 mg/kg bw by stomach tube. Only the animals receiving the
highest dose level briefly exhibited cholinergic symptoms after the
applications. Cholinesterase activity in plasma and erythrocytes was
measured in 3 males and 3 females of each group 20 min after
administration on days 4, 8, 14, 21 and 28, and additionally 5 h after
the final application. Brain cholinesterase activity was measured in 5
male rats and 5 female rats of each group 2 h after the final
application. Plasma and erythrocyte cholinesterase activity was
depressed in the highest dose group (10 mg/kg bw). The degree of
depression was almost constant throughout the experiment. Likewise,
brain cholinesterase activity was depressed only in the 10 mg/kg
group. With respect to cholinesterase activity depression, the no-
effect level in this experiment was thus 3 mg methiocarb/kg bw/day
(Eben and Kimmerle 1973).
RESIDUES IN FOOD AND THEIR EVALUATION
USE PATTERN
Methiocarb is widely used world-wide as a bird repellent,
molluscicide, and insecticide. It is registered for use in Europe
(19 countries), Africa, America (USA and 13 countries of South
America), Canada, New Zealand and Asia. It is formulated as a wettable
powder, bait, and seed treatment and may be applied by spraying,
broadcast, pelleting and as a seed dressing. The Meeting was provided
with good agricultural practice information from Germany, Hungary, The
Netherlands, New Zealand and the USA. National good agricultural
practices are listed in Tables 4 and 5 according to type of treatment
or country, and a summary of world-wide proposed or recommended uses
is given in Table 6. Only minimal information was available on good
agricultural practices for bait formulations.
TABLE 4. National good agricultural practices for methiocarb
Spray treatment (insecticidal or bird repellent)
Country Crop Formulation Application Interval between
rate last application
and harvest (days)
Fed. Rep. Germany Cereals(insecticidal) 50% 0.3 kg a.i./ha 28
Potato (insecticidal) 50% 0.3 kg a.i./ha 14
Pome fruit (insecticidal) 50% 0.05% 14
New Zealand Grape (bird repellent) - 75 g a.i./100 L 14
Cherry (bird repellent) - 75 g a.i./100 L 10
Seedling vegetables
(bird repellent) - 750 g a.i./ha -
Pea seed (bird repellent) - 300 g a.i./100 kg seed -
Blueberry(bird repellent) - 75 g a.i./100 L 7
USA Blueberry (bird repellent) 75% WP 2.2 kg a.i./ha 0
Cherry (insecticidal) 75% WP 3.4-4.5 kg a.i./ha 7
(bird repellent) 75% WP 2.2-4.4 kg a.i./ha 7
Peach (insecticidal) 75% WP 3.4-4.5 kg a.i. 21
Fed.Rep. Germany Maize 50% 0.5 kg a.i./100 kg seed -
Beet 50% 0.45 kg a.i./100 kg seed -
USA Maize(field corn, sweet
corn, popcorn) 50% dust1 0.25-0.5 kg a.i. -
per 100 kg seed
Hungary Maize (bird repellent) - 0.5 kg a.i./100 kg seed -
TABLE 4. (con't)
Country Crop Formulation Application Interval between
rate last application
and harvest (days)
Bait Treatment
Fed.Rep. Germany Vegetables,field crops, 4% 0.12 kg a.i./ha 14
strawberry, and ornamentals broadcast or
(field and under glass) 40-120 mg/m/row
USA Citrus and avocado 2%1 0.32 lb/100 sq.ft. -
2 applications/season
(or half this rate
with metaldehyde)
1 State registration.
TABLE 5. National good agricultural practices for methiocarb, The Netherlands
Crop Kind of pest Application Treatment In use
situation1 controlled (kg a.i./ha) Formulation since2
Various l.s. snails 0.12-0.20 ) 4% granular bait 1968
vegetables s.s mole-cricket 0.12-0.20 ) 50% w.p. sprinkling between plants
Strawberry m.s. strawberry seed
beetle 0.20 50% w.p. sprinkling between plants
Maize l.s. bird repellent 0.5 kg/100 kg 50 w.p. seed dressing 1972
seed
Beet m.s. beet beetle + 0.5 kg/100 kg 50% w.p. seed dressing
springtails
Beet m.s. beet beetle +
springtails 0.5 50% w.p. soil treatment (row) 1975
Rapeseed m.s. flea beetle 0.5 50% w.p. crop treatment between mid
September and mid-October 1975
Ornamental
plants l.s. bird repellent 50 g/100 L 50% w.p. plant treatment when necessary 1977
1 l.s. = large scale, ms = moderate scale, s.s. = small scale;
2 Other registered uses: on ornamental plants in combination with propoxur against insects.
TABLE 6. Summary of world-wide proposed or recommended uses
Recommended
Dose Kind of No. of pre-harvest
Crop Pest (a.i %) application Formulation applications interval (days)
Pome, stone biting insects, 0.05 - 0.075 spraying WP 1 - 3 21
and berry- spider mites
fruit mealybugs
Potato biting insects 300 g/ha spraying WP 1 - 2 14
Sugarbeet pygmy mangold 450-900 g/ pelleting or Seed 1
beetle 100 kg seed as seed treatment
dressing
Maize to repel pheasants 500 g/100 kg seed coating Seed 1 -
and frit fly control seed treatment
Apple bird repellent 0.135 spraying WP 1 - 2 21
before harvest
Peach bird repellent 0.12 spraying WP 1 - 2 21
before harvest
Blueberry bird repellent 2.24 kg/ha spraying WP 3 0
before harvest
Grape bird repellent 2.2 kg/ha spraying WP 3 1
before harvest
Cherry bird repellent 4.48 kg/ha spraying WP 3 7
before harvest
TABLE 6. (con't)
Recommended
Dose Kind of No. of pre-harvest
Crop Pest (a.i %) application Formulation applications interval (days)
Vegetables, slugs 120-200 g/ha broadcast Slug 1 - 2 Vegetables and
strawberry, overall pellets strawberry 14;
oilseed rape, oilseed rape
cereals and cereals 90.
RESIDUES RESULTING FROM SUPERVISED TRIALS
Residue data are available in over 170 reports for 24 commodities
and parts thereof from six countries. As noted earlier, there are no
verified nationally-approved good agricultural practices for many of
the commodities for which data were provided. Where nationally-
approved uses have not been confirmed, uses are assumed to be proposed
good agricultural practices or manufacturer recommended uses. Table 7
summarizes residue data provided to the Meeting and maximum residue
estimates are discussed.
Apple
Whether the proposed or recommended uses are nationally-approved
could not be determined. After multiple applications in six trials of
two wettable powder formulations in three countries, according to
proposed or recommended good agricultural practices, maximum residues
ranged from 16 mg/kg at three days to about 8 mg/kg at the recommended
safety interval of 21 days. Maximum apparent residue in controls were
0.14 mg/kg when analysed by methodologies with sensitivities as low as
0.04 mg/kg and capable of measuring parent sulphoxide and sulphone. Up
to four months elapsed between last application and analysis.
Artichoke
Whether there are nationally-approved uses could not be
determined. Multiple applications of a 2% bait and a flowable
formulation of methiocarb in three trials in one state of the USA gave
maximum residues of approximately 9 mg/kg at day of last application.
However, no information was provided on established or proposed good
agricultural practices for the wettable powder formulation that
resulted in the high residues. Maximum residues for the bait
formulation at proposed application rates were 0.05 mg/kg at seven
days. Proposed good agricultural practices for the bait formulation on
artichokes would permit harvest on day of application (maximum residue
at one day is 0.03 mg/kg, no zero data are available). Up to five
months elapsed between last application and analysis. Data are
inadequate to permit an estimate of maximum residues.
Barley
Whether there are nationally-approved good agricultural practices
could not be determined. At an interval approximating recommended or
proposed pre-harvest intervals, no residues were detected using an
analytical method capable of 0.05 mg/kg measurements when application
rates were 0.6 × the maximum recommended. Up to six months elapsed
between last application and analysis.
Table 7. Methiocarb residues from supervised trials
Residues (mg/kg) at intervals (days) after application
Application (mean in parentheses where range is given)1
Crop Country Rate No.
(Year) No (kg a.i./ha) Formulation 0 1 3 4-5 7-8 10 13-14 15 21 Untreated samples
apple England 3 0.1% 50 WP 1.0 <0.15 <0.15
(1962)
Germany 3 1.0 50 WP 0.6 0.15 0.13 0.14
(1975)
Germany 3 1.0 50 WP 0.41 0.11 0.08 0.04
(1975)
U.S.A.
N.Y. 8 4.2 75 WP 6.6 5.3 5.0 7.3 7.9 0.05
(1974) (15 oz a.i./
100 gal)
WA
(1974) 9 4.8 75 WP 4.9 4.6 4.8 3.6 3.3 0.14
(20 oz a.i./
100 gal)
WA 8 7.6 75 WP 11.2 16.2 4.1 5.9 4.5 0.14
(1974) (20 oz a.i./
100 gal)
apple
fruit KS 8 20 oz a.i./ 75 WP 1.6
(1973) 100 gal
wet pomace 3.3
dry pomace 0.7
juice 2.0
Table 7. (con't)
Residues (mg/kg) at intervals (days) after application
Application (mean in parentheses where range is given)1
Crop Country Rate No.
(Year) No (kg a.i./ha) Formulation 0 1 3 4-5 7-8 10 13-14 15 21 Untreated samples
artichokes U.S.A.
CA 5 1.1 2% bait 0.03 0.03 0.05 <0.01 <0.01
(1975)
(1977) 5 1.1 <0.01 <0.01
(1975) 5 1.1 75% WP 8.9 4.1 3.8 1.5 0.9 <0.2
barley Germany 3 0.12 4% 76-92
(1980) days
grain N.D.3 3
straw N.D. 3
0 1 3-4 5 7-8 10 13-14 15 21 Untreated No. samples
beans, snap U.S.A. 1.1 2% bait
beans OR 5 0.03 <0.02
(1977)
beans FL 6 <0.01 0.02 <0.01 <0.01
(1976)
vines (1975) <0.01 <0.01 <0.01 <0.01
beans NY 5 0.5 0.02 0.02 <0.01
(1975)
vines (1974 0.5 0.06 <0.01
beans IN 5 0.03 <0.01 0.04 0.02
(1975)
vines (1974) 0.5 0.1 0.3
Table 7. (con't)
Application Residues (mg/kg) at intervals (days) after application
Crop Country Rate No.
(Year) No (kg a.i./ha) Formulation 0 1 3-4 5 7-8 10 13-14 15 21 Untreated samples
Canada 5 1.1 2% bait
(1975)
beans <0.01 <0.01 0.01 <0.01
vines <0.01 0.1 <0.01
beans, lima U.S.A. 1.1 2% bait
(1975)
pod CA 4 0.35 0.04
bean WI 5 <0.01 <0.01 0.02 0.08
pod 0.03 0.01 0.03 0.09
vine 0.03 0.6 0.04 <0.01
bean NJ 5 <0.01 <0.01 <0.01 <0.01
pod 0.02 0.01 0.02 <0.01
vine 0.2 0.02
U.S.A.
beans, lima IN 5 1.1 2% bait
(1975)
bean <0.01 <0.01 <0.01 <0.01
pod <0.01 0.04 0.02 0.02
vine <0.01 - <0.01
Canada 5 1.1 2% bait
(1975)
bean 0.01 <0.01 <0.01 <0.01
pod 0.01 0.03 <0.01 <0.01
vine 0.02 0.11
Table 7. (con't)
Application Residues (mg/kg) at intervals (days) after application
Crop Country Rate No.
(Year) No (kg a.i./ha) Formulation 0 1 3-4 5 7-8 10 13-14 15 21 Untreated samples
blueberry U.S.A. 75 WP
OR 3 1.7+1.7+2.2 3.3 5.2 5.4 <0.05
(1974)
(1975) 2 2.2 (aerial) 5.4 3.4 3.6 0.27
MI 2 2+2.2 3.1 0.05
(1975)
IN 2 2.2 25.6 0.17
(1975)
broccoli U.S.A. 1.1 2% bait
KS 5 boadcast
head (1975) 0.06 0.66 0.2
leaves 0.44 0.28 1.8
head OR 5 <0.01 0.02 0.03 <0.01
(1975)
leaves <0.01 0.06 0.01 <0.01
head TX 5 <0.02 <0.02 0.04 <0.02
(1976)
leaves <0.05 0.04 0.05 <0.02
head CA 5 0.26 <0.01
(1978)
Table 7. (con't)
Application Residues (mg/kg) at intervals (days) after application
Crop Country Rate No.
(Year) No (kg a.i./ha) Formulation 0 1 3-4 5 7-8 10 13-14 15 21 Untreated samples
brussel U.S.A. 1.1 2% bait
sprouts (broadcast)
IN 5 0.02 0.2 0.06 <0.01
(1975)
5 0.03 <0.01 <0.01 <0.01
KS 6 0.4 <0.01 0.3 <0.01
(1974)
CA 5 <0.01 <0.01 <0.01 <0.01
(1975)
5 <0.01 <0.01 0.02 <0.01
Canada 6 1.1 2% bait 0.24 0.18
(1975) (broadcast)
0 4 7 14 21-28 No. sample
cabbage Germany 2 0.12 4% 0
(white (1980) 0.06-0.9 ND-0.56 ND-0.09 ND 3
(0.03) (0.2) (0.05)
4 ND
7
14
21-28
Table 7. (con't)
Application Residues (mg/kg) at intervals (days) after application
Crop Country Rate No.
(Year) No (kg a.i./ha) Formulation 0 1 3 4-5 7-8 10 13-14 15 21 28-35 Untreated samples
currants, Germany 3 1 50 WP 12.8 5.7 4.6 2.9
red (1976)
21.7 7.4 6 2.8
6.5 3 1.6 4.3
1.5
0.28
citrus U.S.A. 5 1.1 2% bait Residues were <0.01 ppm in peel or pulp at 30-91 days after last
(1975) broadcast treatment on 2 trials on oranges and one each on lemons and grapefruit.
grapes U.S.A.
(MI, NY, 3-4 2.2 75 WP 2-9 1.8-6.1 1.4-4.0 <0.01-0.09 66
CA) (4.2) (3.3) (2.7)
grapes, NY
Baco noir (1973) 3 2.2 75 WP
grape 1.9 2.9 <0.02
juice 1.7 2.6 <0.02
wine 0.9 2.2 <0.04
Delaware NY 6 2.2 75 WP
(1977)
grape 2.6 2 <0.02
juice 1.7 1.6 <0.02
wine 1.1 1.0 1.3
Table 7. (con't)
Application Residues in mg/kg
Crop Country rate days after
(Year) no kg a.i./ha formulation last Crop part No.
application samples
heads leaves whole2
cabbage Canada 5 1.1 2% bait 1 0.2 10 3.1
(1975) broadcast 3 0.4 1.1 0.6
7 0.04 0.8 0.3
untreated 0.06 0.06 0.06
U.S.A. 5-6 1.1 2% bait 1 <0.01-1.1 0.2-5.1 0.08-1.6 8
(1975) broadcast (0.2) (1.7) (0.6)
(KS, TX,
NY, OR, 3 <0.01-0.17 0.18-3.2 0.08-1.0 7
CA) (0.06) (1.1) (0.4)
7 <0.01-0.05 1.3-15 0.4-4.5 6
(0.02) (8.5) (2.3)
untreated <0.01-<0.02 0.01-0.08 <0.01-0.02 6
(<0.01) (0.03) (0.02)
Germany 1 0.12 4% 0 ND3-0.34 3
(1978) (0.13)
(Savoy) 4 ND-1.7 3
(0.4)
7 ND-<0.05 3
(<0.05)
Table 7. (con't)
Application Residues in mg/kg
Crop Country rate days after
(Year) no kg a.i./ha formulation last Crop part No.
application samples
heads leaves whole2
14 ND-<0.05 3
(<0.05)
21 ND 3
cauliflower Canada 5 1.1 2% bait 1 0.03 0.12 0.05 1
(1975) broadcast
3 0.05 0.60 0.16 1
7 0.05 0.08 0.06 1
untreated 0.01 <0.01 <0.01 1
U.S.A. 5-6 1.1 2% bait
(KS, MI, broadcast
IN, OR,
NY, CA,
TX) 1 <0.01-3.0 0.06-6.8 .04-3.5 7
(1975- (0.75) (2.5) (1.5)
1976) 3 <0.01-2 0.04-12.4 0.08-4 6
(0.49) (3) 1.0
7 <0.01-1.1 <0.01-0.3 <0.01-1 6
(0.19) (0.09) (0.18)
8 0.29 11.4 2.4 1
untreated <0.01-0.01 <0.01 <0.01 7
Table 7. (con't)
Application Residues in mg/kg
Crop Country rate days after
(Year) no kg a.i./ha formulation last Crop part No.
application samples
stem
Germany 2 0.12 4% 0 0.3-2.3 0.07-0.8 0.61-5.9 4
(1980) (1.0) (0.41) (3.2)
4 0.1-0.27 0.07-0.36 0.2-1.6 4
(0.18) (0.2) (0.82)
7 0.05-0.14 <0.005-1.3 0.13-4.6 4
(0.09) (0.42) (2)
14 N.D.3 ND-<0.05 ND-0.2 4
28 N.D. ND-<0.05 ND-<0.05 4
cherries USA
(OR, MI) 3 4.5 75 WP 0 0.29-2.9 3
1976 (1.4) 3
7 0.21-2.1
(0.9)
14-15 0.08-0.9 3
(0.4)
untreated <0.02-0.4 3
(0.12)
Table 7. (con't)
Application Residues in mg/kg
Crop Country rate days after
(Year) no kg a.i./ha formulation last Crop part No.
application samples
heads leaves whole2
(sour) Germany 2 1.9-3.8 50 WP 0 5.4-11.9 4
1974-1976 (9.1)
1 5.9-11.9 2
(8.9)
3 0.8-7.9 4
(3.4)
7 2.3-8.2 4
(3.7)
10 1.8-3.5 2
(2.7)
21 1.2-4.1 2
(2.7)
Table 7. (con't)
Application Residues in mg/kg
Crop Country rate days after
(Year) no kg a.i./ha formulation last Crop part No.
application samples
green
forage kernel cob husk
corn, sweet U.S.A.
(MN, FL, 4 1.1 2% bait 0 0.06-8.2 <0.01-<0.02 <0.01-0.1 <0.01-0.4 11
IN, PA, topical (1.2) (0.13)
WI, OR,
CA, ID).
1977
1 0.07-1.4 <0.01-<0.02 <0.01-0.02 <0.01-0.6 11
(0.4) (0.13)
3 0.08-2.1 <0.01-<0.02 <0.01-0.03 0.06-0.5 11
(0.6) (0.11)
7 0.07-3.4 <0.01-<0.02 <0.01-0.04 0.02-0.75 11
(0.8) (0.22)
untreated <0.01-0.04 <0.01-0.02 <0.01-<0.02 <0.01-0.02 10
Table 7. (con't)
Application Residues in mg/kg
Crop Country rate days after
(Year) no kg a.i./ha formulation last Crop part No.
application samples
shelled
grain
corn, field U.S.A. 4 1.1 2% bait 9 <0.03 1
1977 topical untreated <0.03 1
maize Germany 8
1979-1970 1 500/g 50 WP 144-219 ND5
100 kg
seed
lettuce Germany 1 0.12 4% 0 ND3-0.24 7
(1970) (0.1)
3-4 ND-0.1 7
(.05)
7 ND-0.1 6
(<0.05)
10 ND-0.5 7
(0.09)
14 ND 4
Table 7. (con't)
Application Residues in mg/kg
Crop Country rate days after
(Year) no kg a.i./ha formulation last Crop part No.
application samples
outer or
wrapper other
head leaves leaves whole
U.S.A. 5 1.1 2% bait 1 0.01 0.1 8.3 2.3
(1976) (band 3-4 0.03 11 1.3 2.6
side-dress 7 0.03 1.1 12.2 3.7
untreated 0.02 <0.01 <0.01 <0.01
FL 5 1.1 2% bait 3-4 1.8
(1976) band
between
rows
outer or
wrapper other
head leaves leaves whole
TX, AZ 5-6 1.1 2% bait 1 <0.02-7.1 0.1-12.7 0.18-5.5 0.02-6.5 67
FL, NJ, CA (broadcast) (1.4) (4.1) (2.4) (2.5)
(1976-
1980)
3-4 <0.01-2.1 0.05-59 0.05-20 <0.02-30 6757
(0.5) (12.3) (5) (2.5)
Table 7. (con't)
Application Residues in mg/kg
Crop Country rate days after
(Year) no kg a.i./ha formulation last Crop part No.
application samples
outer or
wrapper other
head leaves leaves whole
7 <0.01-1.3 0.03-14 0.02-52 <0.02-11 57
(0.3) (5.7) (19) (3.7)
untreated <0.01-0.11 <0.01-0.13 <0.01- <0.01-
<0.02 0.12 57
peaches Canada 8 1.1 75 WP 7 6.6,20.5
(1973) foliar 14 3.8,13.5
21 2.3 4.7
untreated <0.05,0.08
U.S.A.
(1973) 4-7 1.1 75 WP 0 14-18.9
(WVA, WA foliar (11.5) 2
NC, SC,
CA) 3 18 1
7 5.4-23
(11) 6
14 1.8-11 6
(7)
Table 7. (con't)
Application Residues in mg/kg
Crop Country rate days after
(Year) no kg a.i./ha formulation last Crop part No.
application samples
21 0.7-10 8
(5.3)
untreated <0.03-0.22 8
(0.05)
potatoes Germany
(1972) 1 0.3 50 WP 14-28 ND5 6
prunes Germany 3 1 50 WP 0 0.6-1 3
(1976) (0.8)
14 0.5-0.7 3
(0.6)
21 0.4-0.8 3
(0.6)
28 0.3-0.5 3
(0.4)
35 0.3-0.6 3
(0.4)
rape Germany 3 0.12 4% 0 ND3-5.0
(1980) (1.1) 4
14 ND-0.54 2
(0.3)
Table 7. (con't)
Application Residues in mg/kg
Crop Country rate days after
(Year) no kg a.i./ha formulation last Crop part No.
application samples
20-21 ND-<0.05 3
(<0.05)
61-108 ND 5
grain straw
rice, U.S.A.
domestic (1977) 1 0.5 lb. 75 ST 105 0.03 0.14
(LA, MS, a.i. per i
TX, AR) 100 lb. 119 0.24 0.84
seed
141 0.01 0.32
147 0.11 <0.01
untreated 0.02-0.4 0.05-0.9
processed hulls
rice, wild U.S.A.
(1977) 2 2.2 75 WP 7-10 0.06 1.2
MN post-
emergence 14 0.08 0.11
broadcast
untreated 0.14 0.04-0.09
Table 7. (con't)
Application Residues in mg/kg
Crop Country rate days after
(Year) no kg a.i./ha formulation last Crop part No.
application samples
grain,
green straw
U.S.A. 2 2.2 75 WP 0 21-48 4.6-20 2
(1977) aerial 1 25-89 9.4-11 2
MN post- 3 12-18 5-6.2 2
emergence 7 6.6-18 3.9-10 2
10 6.8-23 0.6-8.4 2
untreated 0.1-1.6 0.04-0.05
spinach Germany 1 0.12 4% 0 ND5-1.8 4
(1978) (0.9)
4-21 ND 9
Strawberries Germany 1 0.12 4% 0 ND5
(under-glass (1974) 2
under 3-4 ND 6
plastic, 7-10 ND 6
and 14-21 ND 3
unspecified)
Leaves roots
sugar Germany 1 900g/100kg -- 135-136 ND5 ND5 2
beets (1971) seed 178-185 ND ND 3
Table 7. (con't)
Application Residues in mg/kg
Crop Country rate days after
(Year) no kg a.i./ha formulation last Crop part No.
application samples
Tomatoes Canada 5 1.1 2% bait 0 <0.01
(1975) broadcast 7 0.05
U.S.A. 5-6
(FL, KS, 1.1 2% bait 0 <0.01-0.42 8
NY, TX, broadcast (0.06)
IN, AZ,
CA, WI)
1 <0.01-0.08 7
(0.03)
3-4 <0.01-0.07 8
(0.02)
7 <0.01-0.3 8
(0.08)
untreated <0.01-0.1 9
(0.02)
fruit dry pulp puree juice
Tomato USA 6 1.1 2% bait 0 <0.02 <0.02 <0.02 <0.02 2
CA broadcast
(1977)
Table 7. (con't)
1 Residues given as <method sensitivity counted as 1/2 method sensitivity for mean;
2 estimated from a 2.5 head to leaf ratio;
3 ND = not detected with a method sensitivity of 0.05 ppm;
4 estimated from a 4.05 head to leaf ratio;
5 ND = not detected with a 0.02 ppm method sensitivity;
6 at each interval;
7 the number of samples given is for whole; for head, 5-6; for outer/wrapper leaves, 5-7; for other leaves, 3-4.
* Table based on submissions to the 1981 JMPR by Bayer AG and Mobay.
Beans
Whether there are nationally-approved good agricultural practices
could not be determined. Multiple applications of a 2% bait according
to proposed good agricultural practices resulted in maximum residues
of 0.46, 0.35 and 0.5 mg/kg, respectively, for beans (snap and lima),
pods and vines at or after the zero to one day intervals from last
application. Data were representative of seven states in the USA and
one site in Canada. A one-day pre-harvest interval is proposed. Up to
15 months elapsed between last application and analysis.
Blueberry
When treated according to good agricultural practices, maximum
residues were 25.6 mg/kg on last day of application. Samples were
analysed up to one year after last application by methodology
sensitive to 0.01 mg/kg. Maximum control values were 0.27 mg/kg.
Summary residue data from trials in New Zealand at 1-2 times proposed
good agricultural practices indicated residues can be up to 30 mg/kg
at 7 days (New Zealand 1981).
Broccoli
Whether there are nationally-approved good agricultural practices
could not be determined. Maximum residues after multiple applications
according to proposed or recommended application rates were 0.26 mg/kg
and 0.44 mg/kg respectively for the heads and leaves at one day after
last application and 0.1 mg/kg and 2 mg/kg on heads and leaves at 3-4
and 7-8 days respectively when analysed with a method capable of
0.01 mg/kg sensitivity. Maximum control values were < 0.02 mg/kg. The
proposed pre-harvest interval is zero days. Up to one year elapsed
from last application to analysis.
Brussels sprout
Whether there are nationally-approved good agricultural practices
could not be determined. When multiple applications of a bait
formulation was applied according to proposed or recommended rates for
brassica leafy vegetables in four sites in the USA and one in Canada,
maximum residues were 0.38 mg/kg at a one-day pre-harvest interval.
The proposed use on brassica leafy vegetables would allow use on day
of harvest. Maximum apparent residue on controls was < 0.01 mg/kg
(method sensitivity); up to 1.5 year elapsed from last application to
analysis. Errors were made in one set of data which were listed as
being from two different sites.
Cabbage
Whether there are nationally-approved uses for methiocarb on
cabbage could not be determined. When multiple applications of a 2%
bait formulation were applied to several varieties of cabbage at rates
approximating proposed uses, maximum residues one day after last
application (the nearest to the zero or one day pre-harvest intervals
proposed) were 3 mg/kg on a whole head basis. Maximum apparent
residues on control were 0.08 mg/kg. However, maximum residues at
seven days were 4.5 mg/kg estimated on a whole head basis, with head
to leaf weight ratios generally 2.45 to 3.9. There was an unexplained
trend of increasing residues from one day after last day of
application to seven days for the whole head basis and on the leaves
for four out of the nine studies. These increases were by a factor
range of 2 to 15 and suggest increasing plant uptake of soil residues
with time. The analytical method employed was capable of detection
at 0.01 mg/kg. Up to one year elapsed from last application to
analysis. When a 4% formulation was applied at rates of 0.6x the
proposed/recommended rates for vegetables, maximum residues at the
proposed/recommended 14-day pre-harvest interval was < 0.05 mg/kg.
Maximum residues at day of last application approach 1 mg/kg. The
analytical method used in these studies had a sensitivity of
0.05 mg/kg.
Cauliflower
At one day or longer after the last day of up to six broadcast
applications of a 2% bait to several varieties of cauliflower in
Canada and seven states in the USA, at maximum proposed/recommended
rates, maximum residues of methiocarb on whole plant, head and leaves
were 4, 3 and 12.4 mg/kg respectively. The residue of the whole plant
was calculated from a 4.05 head/leaf weight ratio. Proposed uses allow
for harvest on day of last application. The maximum values for
controls were at the 0.01 mg/kg analytical sensitivity. Up to 10
months elapsed between harvest and analysis. Maximum residues from
recommended/proposed uses of an unspecified country at 0.6x the
maximum proposed/recommended rates at the 14-day interval recommended
were N.D. (method sensitivity 0.05 mg/kg), 0.2 and < 0.05 mg/kg for
the head, stem and leaf respectively.
Cherry
Maximum residues on two varieties of cherries from maximum
approved USA good agricultural practices application rates and 7-day
pro-harvest interval were 2.1 mg/kg. Maximum control values were
0.35 mg/kg with an analytical sensitivity of 0.04 mg/kg. At rates
approximating (1.6x) other proposed/recommended good agricultural
practices for small fruits, the maximum average residue at 7 days
from 1 application (up to three recommended) was 8.2 mg/kg (method
sensitivity 0.05 mg/kg). Summary residue data reflecting 1-2 times New
Zealand good agricultural practices gave up to 12 mg/kg at 7 days (New
Zealand 1981).
Maize
When maize seed was treated in eight studies in one country
according to good agricultural practices (approved and/or recommended)
in three countries, residues were not detected at 114 to 219 days
after one treatment before planting, by a method with an analytical
sensitivity of 0.02 mg/kg. When sweet corn was topically treated four
times at maximum proposed rates with a 2% bait in eight states of the
USA, maximum residues were 8.2, <0.02, 0.1 and 0.75 mg/kg for the
forage, kernel, cob and husk respectively at the milk stage and 0 to 7
days after last treatment. Proposed uses permit harvest on day of last
application. The analytical capability was 0.01 mg/kg and maximum
control values were 0.04, 0.02, < 0.02 and 0.02 mg/kg respectively
for the forage, kernel, cob and husk. A similar treatment on field
corn gave residues of less than 0.03 mg/kg on the shelled grain 9 days
after last treatment. The interval from last application to analysis
ranged up to one year.
Currant, red
The maximum residue on red currants at the 21-day pre-harvest
interval proposed/recommended for small fruits was 6 mg/kg from three
studies in one country after three treatments with 50 WP. It could not
be determined whether the rate used was consistent with proposed/
recommended good agricultural practices, as application rates in the
field and recommended good agricultural practice information were in
different units.
Citrus
At 31 to 91 days after the last of five broadcast treatments of
grapefruit, lemon and orange at fruit set and at proposed application
rates, maximum residues were < 0.01 mg/kg in both the peel and the
pulp of treated and control samples. The proposed pre-harvest interval
is 31 days. Up to 15 months elapsed from last application to analysis.
No residue data were available from approved uses.
Grape
When five varieties of grapes were treated in three states in the
USA according to proposed good agricultural practices, maximum
residues at the proposed 7-day pre-harvest interval were 4 mg/kg on
grapes, and at 10 days, 2.6 mg/kg in juice and 2.2 mg/kg in wine.
There were no residue data available on grape pomace. Up to 18 months
elapsed from last application to analysis. Residues were up to 2 mg/kg
from application rates of 1 to 2 times New Zealand good agricultural
practices (New Zealand 1981).
Lettuce
No confirmed, approved good agricultural practice information was
provided to the Joint Meeting, although the recommended use on
vegetables in an unspecified location is listed as one to two
broadcasts at 0.12-0.2 kg/ha a.i., formulation unspecified, and a
14-day pre-harvest interval. Data from the Federal Republic of
Germany, representing one application of a 4% formulation at the lower
rate, were provided. At the 14-day interval no residues (< 0.05 mg/kg
according to method sensitivity) were detected in the four trials with
14-day interval, although one study had residues of 0.5 mg/kg at 10
days. The latter value was not consistent with data < 0.05 mg/kg) in
the same study at early intervals, although this is not necessarily
unexpected.
Data from five studies in the USA, representing proposed uses of
5 broadcast or side band applications of a 2% bait at 1.1 kg a.i./ha,
were available. Harvest on day of application is proposed. These data
were for the head, wrapper leaves, "other leaves", whole, or outer
leaves and were for intervals after application of 1 to 7 days.
Residues for the whole plant were estimated from the parts (head to
leaf weight ratios varies from 0.65 to 3), and the maximum residue at
one day after last application was 6.5 mg/kg. However, as in the case
of cabbage, in about one half the studies, residues were higher at
intervals later than the one day after last application. The maximum
residue (on the whole plant) was 29.5 mg/kg at three days. This
suggests uptake by the plant with time. This high one-day value may be
atypical. The next highest value is 11 mg/kg at three or seven days.
Maximum residues on wrapper leaves were up to 58 mg/kg. The maximum
value for untreated samples (whole basis) was 0.12 mg/kg although most
were < 0.02 mg/kg. The analytical method was capable of sensitivities
of 0.01 mg/kg and interval from last application to analysis was up to
13 months. The values for the "head" and leaves may be somewhat low
because of the relative amount of wrapper or other leaves removed.
Therefore, limits based on the head residue values would be somewhat
misleading.
Peach
Two residues studies from Canada and six from the USA
representing approved good agricultural practices were available.
Maximum residues at the approved 21-day pre-harvest interval were
10 mg/kg. Maximum apparent residue in untreated samples was 0.22 mg/kg
although they were generally < 0.08 mg/kg, even on the samples with
the high value, when analysed by a different analytical procedure.
Potato
Approved national uses could not be confirmed. No residues could
be detected at the 14-day pre-harvest interval recommended (apparently
in the Federal Republic of Germany) when one of two permitted spray
applications of a wettable powder formulation were made. The
analytical sensitivity was 0.02 mg/kg. These minimal data are not
sufficient to estimate maximum residues.
Prune
Whether there are nationally-approved good agricultural practices
for use of methiocarb on prunes could not be determined. Residue
trials conducted at application rates of 1 kg a.i./ha (0.05%) resulted
in maximum residues of 0.8 mg/kg at the recommended 21-day pre-harvest
interval. These application rates approximate recommended rates of
0.05 to 0.075% for stone fruit. These data are too minimal as a basis
for estimating maximum residue limits.
Rape
Whether there are nationally-approved good agricultural practice
for the use of methiocarb on rape could not be determined, except for
one country from which no residue data were provided. When two
applications of a 4% formulation was applied to rape at 0.12 kg
a.i./ha (0.12-0.200 kg/ha recommended), no residues (<0.05 mg/kg)
were detected at intervals approximating the recommended 90 days after
last application. These application rates were thus only 0.6x the
maximum recommended and would not be all adequate basis for estimating
maximum residue.
Rice
Whether there are nationally-approved good agricultural practices
for the use of methiocarb on rice could not be determined. Maximum
residues at 105 to 147 days after the last application of a seed
treatment at approximately 2x proposed/recommended rates were
0.24 mg/kg in grain and 0.84 mg/kg in the straw. Maximum apparent
residues in untreated controls were 0.44 mg/kg in the grain and
0.84 mg/kg in the straw, although the untreated samples corresponding
to the maximum residues in treated samples had substantially less
apparent residue. When wild rice was treated according to proposed
uses (with last application at late dough stage) maximum residues on
day of last application were 48 mg/kg in the green grain. Maximum
residues for the processed grain at 10 to 14 days after last
application were 0.08 mg/kg (less than the 0.14 mg/kg in untreated
samples). In the absence of more specific information on pre-harvest
intervals, a zero-day interval must be assumed. Up to seven months
elapsed from last application to analysis. These minimal data from one
geographic location are inadequate for estimating maximum residues in
wild rice.
Spinach
Whether there are nationally-approved good agricultural practices
could not be determined. At 0.12 kg a.i./ha (proposed/recommended rate
is two applications at 0.12 to 0.2 mg/kg for vegetables) no residues
were detected using an analytical method with a limit of sensitivity
of approximately 0.03 mg/kg at the recommended 14-day pre-harvest
interval. These data are inadequate for estimation of maximum
residues in terms of number of applications, quantity and as being
representative of maximum recommended uses.
Strawberry
Whether there are nationally-approved good agricultural practices
could not be determined. After a single application at rates 0.6 to
0.8x that recommended for a 4% formulation, no residues were detected
from 0 to 21 days after last application. Recommended uses allow two
applications. The analytical method was capable of measuring residues
at approximately 0.02 mg/kg. No data were available for proposed uses
of other formulations. Although only one application was made, the
absence of residues at any level through the recommended 14-day
interval suggests a limit at or about the method sensitivity of
0.02 mg/kg would be adequate for the recommended use.
Sugarbeet
Whether there are nationally-approved good agricultural practices
could not be determined, except for one country from which no residue
data were available. No residues (<0.02 mg/kg method sensitivity)
were detected in the roots or leaves of sugarbeets at 135 to 185 days
after seed treatment according to recommended usage.
Tomato
Whether there are approved national good agricultural practices
for methiocarb uses on tomatoes could not be confirmed. No data were
available for recommended/proposed uses on vegetables. Data were
available for proposed use for 2% bait broadcast applications in North
America where harvest on day of last application is proposed. Maximum
residues were 0.42 mg/kg at day of application. Two processing studies
were available in which the dry pulp, puree and juice of treated
tomatoes were analysed, but these were not adequate for conclusions on
the potential for residue concentration as the fruit that was
processed did not have significant residues.
FATE OF RESIDUES
General
Methiocarb is readily metabolized or degraded in the environment
by plants, animals and microorganisms. While hydrolysis and oxidation
are the principle paths for these chemical changes, the conditions of
a particular situation determine the order and relative importance of
these processes. Table 1 identifies metabolites and degradation
products of methiocarb and provides abbreviated designations which are
used in Figure 2, in which methiocarb metabolic routes are summarized.
Similar analytical approaches have been used for determination of
the fate of methiocarb. Typically, extractions of tissues, excretory
products, milk etc. were made with organic solvents for extraction of
non-conjugated moieties followed by enzymatic and/or acid hydrolysis
of aqueous fractions to release conjugates. Analyses were by thin
layer, radiometric, and scintillation techniques.
In plants
Methiocarb uptake, distribution and metabolism in lettuce and
tomato plants were studied for up to 14 days and up to 56 days in
tomato fruit. Direct soil or nutrient solution applications of (ring-
l-14C)-methiocarb 75 WP were made at rates equivalent to 1 lb.
a.i./acre (1 lb/acre = 1.121 kg/ha) (Strankowski and Murphy 1976).
Radioactivity was rapidly taken up by tomato and lettuce plants, being
translocated throughout within one day, levelling off at seven days in
lettuce and continuing. Over 40 to 50% of applied radioactivity was
contained in the plants within two weeks, with the organic soluble
portion decreasing from 75 and 81% of total activity at one day
respectively in lettuce and tomato plants, to 6 and 13% after two
weeks. Radioactivity in the aqueous phase, on the other hand,
increased from 25 and 19% at one day to 94 and 87% respectively on day
14. Organic phase residues in the plants at day one were 30 to 50%
methiocarb sulphoxide, 15-20% methiocarb, and in tomato plants, also
6% methiocarb sulphoxide phenol. Predominant tissues in the aqueous
phase after hydrolysis are methiocarb phenol and its sulphoxide
phenol, with lesser amounts of methiocarb, its sulphoxide, sulphone
and sulphone phenol.
In the tomato fruit study, radioactivity was up to 12 mg/kg
methiocarb equivalent in the leaves at day 28 (96% water soluble) and
up to 0.1 mg/kg in fruit. No methiocarb or carbamate metabolites were
detected in the organosoluble phase. The non-carbamate residues were
not identified.
Greenhouse-grown rice was treated in one study with one
application of (ring-l-14C)-methiocarb 75 WP at a rate of 1 lb
a.i./acre at planting to simulate seed treatment and in another with
1-2 foliar applications (Strankowski 1979) at 2 lb a.i./acre at soft
dough stage. As in the case of soil-treated tomatoes and lettuce,
radioactivity from the simulated seed treatment was steadily taken up
through the 35-day test period (21% of applied in the rice stalks at
day 35). From the foliar treatment, radioactivity decreased through
the post-application period to about 12% of zero day radioactivity in
the grain and to 20 to 60% in stalk at day 28. Surface rinses of the
 grain indicated methiocarb penetration into the grain. Also as in the
case of lettuce and tomato plants, organosoluble residues in plant or
grain decreased with time after treatment. The predominant over-all
residue distribution at day 28 in rice plants and grain from these
studies show a decrease of methiocarb from > 90% at day zero to 2 to
20% at day 28; an increase in methiocarb sulphoxide from 2 to 6% at
day zero to approximately 35% and an increase of methiocarb phenol
conjugate and methiocarb sulphoxide phenol from none to approximately
10%, all in the same period. There were lesser amounts < 3%) of
other metabolites at day 28. The hydroxymethyl methiocarb sulphoxide
occurred up to about 3%.
A metabolism study and a cumulative residue study were conducted
on apples (Morgan and Parton 1974). In the metabolism study a single
50% ethanol solution syringe application of (ring-l-14C)-methiocarb
and methiocarb (1:1 ratio) was made to each of 37 apples at a combined
rate of 2 mg/apple with no run-off. Samples of three apples or more
were analysed at intervals from 0 to 43 days post-application. As a
percent of that applied, radioactivity declined from 94% at day zero
to about 30% at day 17, where it levelled off for the duration of the
43 days. The bulk of observed residue was surface residues removable
by a benzene wash (from 99% on day zero to around 60 to 65% after day
29) and was said to consist of 96 to 100% methiocarb and the rest its
sulphoxide. As a percent of applied radioactivity, the decline was
more rapid, down to about 20% after day 29. Following the pattern on
other plants, the water soluble residues increased with time in peel
and pulp relative to organsolubles. Total analysis of the 43-day
residue was methiocarb 65.3%, methiocarb sulphoxide 9.4%, methiocarb
sulphone 0.4%, methiocarb phenol 18%, methiocarb sulphone 0.8% and
water soluble unknown 1.5%.
In the residue study, eight syringe applications of a 75 WP
methiocarb formulation (1:9 ratio (ring-l-14C)-methiocarb:methiocarb)
were made to each of 24 apples to run-off at a rate equivalent to
1.5 lb. a.i./100 gal. (1 lb/US gal = 120 g/l). Apples were sampled
throughout and up to day 14 after the last application. Residues
peaked at about 3 to 8 mg/kg after the fourth treatment. With
approximately 95% of the residue identified, the over-all distribution
14 days post-application (77 days from initial application) in terms
of percent and mg/kg (methiocarb equivalents) was methiocarb 61
(2.7), methiocarb sulphoxide 7 (0.3), methiocarb sulphone 0.1 (0.0),
methiocarb phenol 4.6 (0.2), methiocarb sulphoxide phenol 22.1 (1.0),
methiocarb sulphone phenol 1.1 (0.05) and unknowns < 5 (0.2).
Therefore, methiocarb is the predominant residue shortly after
application and up to 14 days post-application, and while methiocarb
phenol was the second largest residue in the metabolism study, the
sulphoxide phenol is second in the residue study (14 days post-
treatment or 77 days from initial application). The primary metabolic
route in plants, therefore, appears to be methiocarb -> its
sulphoxide -> sulphoxide phenol -> glycosidic conjugation with a
minor route of methiocarb -> its phenol -> phenol conjugate. The
relative abundance of any one moiety varies with time and crop.
In animals
The metabolism of methiocarb in rats (Gronberg and Everett 1964
and Stanley and Johnson 1926) and in dogs (Bell 1974) is discussed
under "Biochemical Aspects".
The animal studies discussed in this section indicate that the
primary difference between liver and kidney metabolism in the cow and
hen is less methiocarb phenol in chicken liver and kidney but higher
overall methiocarb equivalent residues in chicken tissues than in that
of cows. It is also noteworthy that N-hydroxymethyl methiocarb
sulphoxide is an analytically significant residue in chicken tissues,
especially in muscle. Apparently no attempt was made to identify the
hydroxy metabolites during the cow studies. Hydrolysis and conjugation
were the major metabolic routes in liver and kidney of chickens
whereas oxidation was also important in fat skin, and muscle.
Cow
In two studies a dairy cow was dosed with (ring-l-14C)methiocarb
(Minor and Murphy 1977a,b). Details are reported under "Biochemical
Aspects". In the first study maximum radioactivity in milk peaked at
0.02 mg/kg (methiocarb equivalent) at 24 to 32 hours post-treatment.
One week later, the same cow was dosed in the same manner.
Maximum radioactive residues in milk were 0.06 mg/kg methiocarb
equivalent. Nineteen percent of the radioactivity in milk was
organosoluble although most of this residue was unidentified. Only
methiocarb sulphoxide was positively identified in this fraction.
Another 9% was precipitated in a coagulation step. About 56% of the
milk radioactivity in the form of conjugates was released by enzyme
and acid hydrolysis. Most of this 56% was equally divided between
methiocarb sulphoxide phenol and methiocarb sulphone phenol with a
< 1% each of methiocarb, its sulphoxide, its phenol, and an unknown.
In tissues, radioactive residues were 0.11 mg/kg in kidney, 0.07 mg/kg
in liver, approximately 0.01 mg/kg in udder, heart and renal fat and
< 0.01 mg/kg in round, shoulder, loin, brain and omental fat.
Therefore, only kidney and liver contained sufficient residues for
further characterization. The distribution of residues in kidney and
liver and the relative portions which are organosoluble or requiring
hydrolysis for release of conjugated moieties are given in Table 8. it
can also be seen in Table 8 that methiocarb phenol is the principal
metabolite in liver and kidney (25 and 55% respectively). While
methiocarb sulphoxide phenol and methiocarb sulphone phenol are also
present in analytically significant amounts in liver and kidney,
methiocarb, its sulphoxide and to a lesser extent its sulphone, occur
in analytically significant amounts in the liver but not in kidney.
Methiocarb, together with its carbamate metabolites, accounted for no
more than 0.02 mg/kg in any tissue.
TABLE 8. Percent distribution of radioactivity among methiocarb and its metabolites extracted
from kidney and liver tissue of a dairy cow dosed five times with
(ring-1-14C)-methiocarb
Percent distribution
Kidney Liver
Compound Acid Acid
Organosoluble reflux Organosoluble reflex
Methiocarb <1 0 12 2
Methiocarb sulphoxide 0 0 4 3
Methiocarb sulphone <1 0 <1 1
Methiocarb phenol 11 44 14 11
Methiocarb sulphoxide phenol 7 0 7 2
Methiocarb sulphone phenol 16 1 3 3
Origin unknown 2 1 3 9
Total extractable 38 46 44 30
Beef and dairy cattle were fed rations containing 10 (0.3 mg/kg
bw/day), 30 and 100 mg/kg methiocarb for 29 days, three cows at each
feeding level (Mobay 1970). Milk was collected on the days 28 and 29
of feeding and cattle sacrificed on day 29 for tissue analyses. A copy
of the method used was not provided, although it is known that the
procedure measures methiocarb, its sulphoxide and sulphone as one gas
chromatographic response after oxidizing the sulphone and silylating.
It is apparently basically the same procedure as that of Thornton and
Drager (1973). As such, it would not be expected to determine
conjugated residues as there is no hydrolysis step. For this reason,
up to 50% of the total residue may not have been determined in some
tissues. Phenolic metabolites, the major part of the residue in some
tissues, may not have been determined if extracted. It cannot be
concluded whether the hydroxy metabolites would have been determined.
Except for one 0.05 mg/kg residue in heart at the 100 mg/kg feeding
level, residues in steak (loin, round, flank) heart, brain and fat
(omental, renal, back) were < 0.05 mg/kg at the 10 to 100 mg/kg
feeding levels. Residues (mg/kg) in milk, liver and kidney are given
in Table 9.
TABLE 9. Residues recovered from cattle tissues and milk after methiocarb feeding
No. samples
Dose level Milk Liver Kidney Each Milk
tissue
10 <0.05-0.007 <0.05 <0.05 3 6
(mean <0.005)
30 0.008-0.02 <0.05,<0.05, <0.05 3 6
(mean 0.014) 0.08 (mean <0.05)
100 0.021-0.033 <0.05,0.09,0.1 <0.05,0.06,0.08 3 6
(mean 0.026) (mean 0.07) (mean 0.06)
control <0.05 <0.05 <0.05 1 9
Hen
Eight White Leghorn hens were given a single dose of (ring-l-
14C)-methiocarb by intubation at 4.4 mg/kg bw and the excreta and
eggs monitored at regular intervals up to 96 h post-treatment (Stanley
et al 1979). About 84% of the dose was excreted within 24 h and only
1% more in the next 72 h. Thirty-four percent of the dose was found
in the excreta as non-conjugated methiocarb, methiocarb phenol,
methiocarb sulphoxide phenol, methiocarb sulphone phenol, and
hydroxymethylmethiocarb sulphoxide with a distribution of < 1, 13, 9,
7 and 2% of the dose respectively.
Of the 49% of the administered dose in the aqueous excreta
fraction, 41% was released by acid hydrolysis. Methiocarb phenol,
methiocarb sulphoxide phenol and methiocarb sulphone phenol released
by the acid hydrolysis constituted 21, 1 and 10% respectively of the
applied dose. The remaining 17% of the dose in the aqueous fraction
was not identified. In the combined eggs, maximum radioactivity peaked
at 6 to 24 h after administration of the dose and was 0.02 mg/kg
methiocarb equivalents. The residues in eggs were not further
characterized.
Three weeks later, these same hens were dosed by tube at the same
level with (ring-l-14C)-methiocarb for each of five consecutive days
and sacrificed for tissue studies (Stanley et al 1979a). Radioactive
methiocarb equivalent were: kidney 3.3 mg/kg, liver 2.0 mg/kg; gizzard
(including lining), 7.7 mg/kg; fat, 0.7 mg/kg; skin, 1.3 mg/kg; breast
muscle, 0.4 mg/kg; leg muscle, 0.5 mg/kg; heart, 0.8 mg/kg and egg,
0.02 - 0.08 mg/kg. Because residues in eggs were < 0.1 mg/kg, they
were not further characterized.
Non-conjugated residues as a percent of residue in the specific
tissue ranged from 28% in kidney to 84% in the gizzard and residues
released used by acid hydrolysis ranged from 3% in the gizzard to 47%
in the kidney. Unidentified residues remaining in solids or unreleased
by acid hydrolysis accounted for 25, 19, and 13% of radioactivity in
kidney, liver and fat respectively with 7% or less in other tissues.
Although all compounds listed in Table 1 except methiocarb
sulphone were identified in varying concentrations in one or more
tissues, the major residues as a percent of radioactivity in each
tissue (abbreviations as in Table 1) according to non-conjugated and
acid released conjugates respectively were as given in Table 10.
TABLE 10. Residues recovered from hen tissues after dosing with (ring-l-14C)-methiocarb
Tissue Non-conjugated conjugates
Kidney MSOP 11% MSOP 18%, MP 13%, HMSO 3%
Liver MSOP 17% MP 10%, MSOP 7%, HMSO 6%
Gizzard(with lining) M 75% < 1% MP, MSOP, MSO2P
Fat M 41%, MP 14% MP 12%
Skin M 16% MP 30%
Breast muscle MSOP 24%, HMSO 17% MP 8%
Leg muscle MSOP 15%, HMSO 18% MSOP 9%, MP 6%
Heart HMSO 16% MP 32%
Hens were fed, ad libitum, with methiocarb/methiocarb sulphoxide
(9:1) at 20, 60, 120 and 360 ppm in the diet for 28 days, four hens
per feeding level and for controls (Strankowski and Minor 1976).
Giblets (heart, gizzard, liver), muscle (composite), skin, fat tissues
(composite) and eggs (collected on the even and last three days) were
analysed. While the method used was not provided, it is known that it
measures methiocarb and its sulphoxide by oxidation both to the
sulphone, hydrolysis to the sulphone phenol and silylation for gas
chromatographic detection and with a reported sensitivity of 0.02
mg/kg. Except for 0.02 mg/kg in skin at the 360 mg/kg feeding level,
average residues were < 0.02 mg/kg in muscle, skin and fat at all
feeding levels and in all tissue controls. Average residues in giblets
were 0.13, 0.13, 0.06 and < 0.02 mg/kg at the 360, 120, 60 and
20 mg/kg feeding levels respectively. Residues on individual tissues
were not available. Residues in eggs were < 0.02, < 0.02, <0.02,
< 0.02 to 0.03, and 0.03 to 0.06 mg/kg in controls, feeding levels
20, 60, 120 and 360 mg/kg respectively.
In soil
Adsorption and desorption
Absorption and desorption of (ring-l-14C)-methiocarb of an
aqueous solution by loam soil was studied over a concentration range
of 0.25 to 4.8 mg/ml (Atwell and Murphy 1978). Ten gram air-dried soil
samples with 3% moisture were treated with 50 ml pH 6 buffered test
solution and shaken at 25°C for 16h before analysis. Residue absorbed
was determined by the residue in the decant vs. the initial
concentration. Desorption was conducted similarly, using a pH 6
buffered solution, the most stable pH for methiocarb. Equilibrium was
established at 7 to 9 and 9 to 11 h for adsorption and desorption
respectively. Under the test conditions 70 to 82% were adsorbed over
the concentration range, decreasing from the highest to the lowest as
the concentration increased. Desorption was proportional to the amount
adsorbed and ranged from 17 to 22% from over the 10 to 170 mg/kg range
of soil-adsorbed methiocarb. Freundlich constants were k=12.6 and
l/n=0.8.
Leaching
(Ring-l-14C)-methiocarb was applied to thin layers of six soils
(ranging from sand to loam to clay), one from each of six states in
the USA and compared with 23 other pesticides for leaching behaviour
on the basis of Rf values (Thornton et al 1976). On a scale of 1.0,
the Rf of methiocarb ranged from 0.22 to 0.42 (mean 0.33) in the six
soils and was considered to be of low relative mobility. Other
pesticides ranged from an Rf of 0.01 to 0.02 for DDT to 0.91 to 0.99
for trichlorfon. The mobilities were directly related to water
solubility.
(Ring-l-14C)-methiocarb was applied to 30 cm × 7.6 cm segmented
columns containing six soil types with organic matter ranging from 0.6
to 77% and eluted with 50 cm of water at the rate of 2.5 cm per hour
(Houseworth and Tweedy 1974). Radioactivity was leached, but in three
of the soils > 70% remained in the top two inches of soil. Leaching
was generally inversely related to organic matter. Radioactivity was
found in the leachate of only the sandy loam, and this could have been
due to the pH of 8 and possible degradation of methiocarb. The other
soils had a pH of < 6.2.
The same authors (Tweedy and Houseworth 1974) also eluted 30 cm
high columns of aged sandy loam topped with (ring-l-14C)-methiocarb
with distilled water at a rate of 0.5 acre. inch/day (1 acre. in =
1 ha.cm) for 45 days. The top one third of the column contained 91.2%
of the radioactivity while 5% was in the leachate.
Persistence
Methiocarb 50 WP was sprayed at a rate of 20 lb a.i./acre onto
two soil plots and incorporated to a depth of 9 to 15 cm to achieve a
theoretical concentration of 10 mg/kg (Mobay 1973). Samples were taken
from the 0 to 9 cm depth and analysed for methiocarb, methiocarb
sulphoxide and methiocarb sulphone, in total, at various intervals in
a period from 0 to 370 days. The methiocarb residue half-life was
approximately 15 days in silt loam and approximately 45 days in clay.
Residues ranged from 5 mg/kg at zero day to < 0.25 mg/kg at 370 days.
A second set of three soil plots was sprayed twice with methiocarb 75
WP at a rate of 20 lb a.i./acre with a one-year interval between the
applications (Mobay 1974). The applications were incorporated, and the
soil was sampled and analysed as described previously. The methiocarb
half-life in these plots (two sandy loams and one silt loam) ranged
from 15 to 50 days and residues ranged from 28 mg/kg at day zero to
0.13 mg/kg at 343 days.
Two additional studies were concluded with methiocarb 2% bait or
methiocarb 75 WP applied in broadcast fashion to the soil at a rate
of 5 lb a.i./acre (Mobay 1979-81). Subsequent soil samples taken
from both the 0 to 15 cm and 15 to 30 cm depths were analysed for
methiocarb, methiocarb sulphoxide and methiocarb sulphone
individually. In these studies methiocarb residues declined rapidly
(from a maximum residue of 4.7 mg/kg at the 0 - 15 cm depth), while
the residues of methiocarb sulphoxide and sulphone rose to maximum
peak levels of 0.6 mg/kg and 0.3 mg/kg respectively at 30 to 82 days
and then also declined to less than 0.1 mg/kg each by 365 days and
< 0.02 mg/kg each in all cases by 553 days. The half-life of
methiocarb for each of the soils varied between 6 and 64 days.
Although some residues do occur in the 15 to 30 cm depth (up to a
combined residue of 0.4 mg/kg), at the zero-time samplings the
combined residue was generally well below 0.1 mg/kg. This suggests
that methiocarb and its carbamates do not have a strong propensity for
leaching.
Rotational crops
A radioactive rotational crop study was performed in greenhouse
planters to test for possible residues from (14C)-methiocarb in crops
planted 30, 120 and 365 days (601 days for wheat) after a (ring-l-
14C)-methiocarb 75 WP soil treatment at a rate equivalent to 5 lb
a.i./acre (Strankowski and Parker 1981). Radioactive residues in the
soil declined from 0.934 to 0.623 mg/kg methiocarb equivalents during
the two-year study, while the actual carbamate residue decreased from
0.828 to 0.121 mg/kg methiocarb equivalents during the same period.
The rotational crops contained radioactive residues at harvest, but
only a portion of this residue could be attributed to intact
carbamates. Maximum total radioactivity as methiocarb equivalents
decreased in mature crops over the course of the study (30 to 365 day
plantings) 5.7 to 0.3 mg/kg in wheat heads, 7.8 to 0.6 mg/kg in wheat
stalks, 64 to 3 mg/kg in wheat forage, 1.4 to 0.2 mg/kg in beet tops,
0.3 to 0.1 mg/kg in beet roots, and 2 to 0.2 mg/kg in kale.
Total carbamate residues made up 19 to < 1% (1.9 to
< 0.006 mg/kg) of total residues. Methiocarb sulphoxide was the
principal carbamate found, along with small amounts of its sulphone,
N-hydroxymethyl sulphoxide, and N-hydroxymethyl sulphone.
As radioactive residues were detected in these greenhouse-grown
rotational crops at levels higher than expected, a field study, using
formulated products, was undertaken to determine if residues would
occur in subsequent crops under actual use conditions (Murphy and
Morris 1979; Mobay 1977-81). Methiocarb 75 WP was applied at rates of
1.25, 2.5, 5 and 10 lb. a.i./acre to bare soil. The single application
at the exaggerated rates was an attempt to simulate a full season's
application of methiocarb. At 30 and 365 days after the methiocarb
treatment, grains (sorghum and corn), pod vegetables (snap beans and
black-eyed peas) and root crops (radishes and turnips) were planted in
the plots as representative of rotational crops that may be planted
after use of methiocarb on a target crop. The total residue of
methiocarb, methiocarb sulphoxide and methiocarb sulphone in each crop
was determined.
Maximum residues determined as total methiocarb, its sulphoxide
and sulphone, found in mature crops were sorghum (some wheat)
< 0.02 mg/kg (green forage), < 0.02 mg/kg (grain), 0.07 mg/kg
(straw); corn, 0.14 mg/kg (green forage 10 lb. a.i./acre, 30 day
plant), < 0.02 mg/kg (kernel); snap beans or peas, 0.03 mg/kg (green
vines), 0.11 mg/kg (snap beans, planted at 355 days and at 1.25 lb
a.i./acre or 0.03 mg/kg at 1.25 lb a.i./acre 30-day plant),
< 0.02 mg/kg (pod); blackeyes, 0.15 mg/kg (green vines 5 lb a.i./acre
30-day plant), 0.07 mg/kg (peas, 1 lb a.i./acre 90-day plant),
< 0.02 mg/kg (pod); radish, 0.03 (root), 0.05 mg/kg (top), both at
1.25 lb a.i./acre, 120-day plant; turnip, < 0.02 mg/kg (root),
0.29 mg/kg (top, 10 lb a.i./acre 30-day plant); soil, 7 mg/kg (30 day
plant, 10 lb a.i./ acre).
These studies indicate that methiocarb carbamate residues in
mature crops can generally be expected to be quite low or non-
detectable in rotational crops planted at 30 or more days after
maximum treatments of less than 5 lb a.i./acre. The data do indicate,
however, that on occasion residues of < 0.03 mg/kg can occur in
legumes or root crops grown under these conditions, and that even
higher residues can occur in the tops of root crops or vines/forage
parts.
Metabolism
In a preliminary study, the fate of (carbonyl-14C, methylthio-
3H) methiocarb was monitored in sandy loam and two silt loam soils
for 17 days (Church and Flint 1971). The pH of the soils varied from
5.4 to 6.4. Metabolism of methiocarb in these soils was quite similar,
and the average distribution of radioactivity at 17 days was
methiocarb, 81%, methiocarb sulphoxide, 15%; ethereal sulphate of
methiocarb sulphoxide phenol, 1% and unknown, 3%. Based on sampling
dates of 2, 7 and 17 days, the estimated half-life for methiocarb was
< 20 days for each of the soils tested.
A second study of longer duration (6 weeks) was conducted with
(carbonyl-14C)-methiocarb in three soils having alkaline pH (loamy
sand, loam and sandy clay loam) and three soils having acidic pH (all
loams) (Starr and Cunningham 1973). The half-life of methiocarb was
<14 days in the alkaline soils and <50 days in the acidic soils.
Hydrolysis of the parent carbamate appeared to be the primary route of
degradation in the alkaline soils, while oxidation of methiocarb to
methiocarb sulphoxide followed by hydrolysis of the sulphoxide to the
corresponding phenol seemed to be the metabolic route in the acidic
soils.
A third study was conducted with (ring-l-14C)-methiocarb in
sandy loam (Stanley and Flint 1974). Although the soil was very
slightly alkaline, the half-life of methiocarb was approximately 28
days. Over a 16-week period, methiocarb was oxidized to its sulphoxide
phenol. Soil-bound methiocarb-related residues increased over time,
but they did not exceed 10% in the 16-week investigation. No unknown
accounted for >10% in the applied radioactivity.
Behaviour in soil micro-organisms
Selected soil bacteria and fungi were individually incubated for
14 days at 30°C in a nutrient broth containing (ring-l-14C)-
methiocarb (Strankowski 1978). These studies indicate that soil micro-
organisms are capable of metabolizing methiocarb by hydrolysis,
oxidation, hydroxylation and conjugation. The major degradation
products detected were methiocarb sulphoxide, methiocarb sulphoxide
phenol and N-hydroxyl methyl methiocarb.
In water
Solubility
The solubility of methiocarb in distilled water at 20°C was
reported by the manufacturer to be 10 ppm, although the documentation
(Stanley and Parker 1981) was not provided.
Octanol/water partition
The octanol/water partition co-efficient for methiocarb was
determined at 20°C with an octanol to water volume ratio of 1:44
(Stanley and Parker 1981). The partition coefficient (K) was 915.
Again, the documentation was not provided.
Hydrolysis
The stability of methiocarb in buffered solutions from pH's of
5 to 9 have been studied (Church 1970; Saakvitne et al 1981).
Half-lives varied from 40 to 321 days at pH 5, 6h to 24 days at pH 7
and 0.2 days to instantaneous hydrolysis at pH 9. There was a direct
relationship between temperature and hydrolysis at a given pH.
Stability in pond or river water was also investigated
(Eichelberger and Lichtenberg 1971; Minor and Atwell 1979; Flint and
Shaw 1974). The half-life varied from less than 3 to 14 days,
depending on conditions. The principal route was hydrolysis to the
phenol which then decreased while methiocarb sulphoxide phenol
increased (63% of radioactivity at 14 days in one study).
Aquatic metabolism
(Ring-l-14C)-methiocarb was applied at 2 ppm to a pond
water/sediment system. The half-life of methiocarb was less than three
days (Minor and Atwell 1979). In this anaerobic aquatic environment,
methiocarb decreased to <1% of the total radioactivity in the pond
water and to 5% in the sediment extracts within 21 days. Methiocarb
degradation in a water/sediment system involves hydrolysis of the
carbamate to yield methiocarb phenol and subsequent formation of
sediment-bound components.
Fish accumulation
Bluegill were continuously exposed to (ring-l-14C)-methiocarb at
a concentration of 10 ppb for 34 days (Lamb 1974). The fish reached an
equilibrium with their surroundings at approximately 0.7 ppm at about
7 days after exposure. These residues were reduced to 0.07 ppm within
7 days on transfer of the blue-gill to uncontaminated water. Over 60%
of the radioactivity was unextractable and therefore unidentified. Of
the extracted residues, identified compounds were methiocarb 3%, its
sulphoxide 6%, its sulphone 8%, methiocarb phenol sulphoxide 17%,
methiocarb phenol sulphone 35% and unknown 31%. Methiocarb, methiocarb
sulphoxide and methiocarb sulphone accounted for only 6% of the whole-
body radioactive residues and did not accumulate in the fish.
In storage and processing
The effects of 0 to 109 F storage of over 20 food or feed items
(most fortified separately with 1.0 mg/kg methiocarb, its sulphoxide
and sulphone) were studied (Mobay 1981). This is of particular
importance, as the interval from harvest to analysis for much of the
residue data submitted to the Meeting was 6 to 18 months. The storage
interval in the investigation ranged from 57 to 805 days and over-all
decomposition averaged approximately 17%. Average decomposition can be
substantial in some individual commodities - strawberry 47% (643
days), grape 32% (807 days), rice grain 32% (95 to 365 days), lettuce
28% (804 days), fish (edible part) 24% (93 to 204 days), brassica
leafy vegetables 22% (804 to 805 days).
Processing of apples with field-incurred methiocarb residues of
1.6 ppm resulted in residues of 3.3, 0.7 and 2 ppm respectively in wet
pomace, dry pomace and juice respectively (Table 7). As a percent of
original fruit residue, the values were 77, 68 and 2 in the juice, wet
pomace and dry pomace respectively. Therefore, there is an approximate
2X concentration from the fruit to wet pomace.
Grape juice had approximately the same residue and wine 0.4 to
0.7X that of the grape with field-incurred residues from which they
were processed (Table 7).
Photodecomposition
The degradation of (ring-l-14C)-methiocarb on glass, silica gel
and soil surfaces and in aqueous solution under artificial ultraviolet
light was investigated (Houseworth and Tweedy 1974). The half-life of
methiocarb was <2 h on glass and in water, <4 h on silica gel, and
<16 h in soil. There was no evidence for volatile degradation
products. Major degradation products were sulphoxide, sulphones and
more polar materials.
METHODS OF RESIDUE ANALYSIS
Numerous analytical methods have been developed for the
determination of residues of methiocarb and its metabolites in a
variety of crops and animal products. Although each is unique, the
approaches have certain similarities. Typically, chopped or ground
samples are blended (or seeped) with a variety of solvents, filtered,
purified by partitions and/or chromatographic columns, derivatized (or
hydrolysed to the sulphone then derivatized) and determined on methyl
silcone gas chromatographic columns. Determination is usually by a
flame photometric detector.
Chopped and buffered apples and pears were extracted with acetone
and the sulphide sulphoxides and sulphones of methiocarb separated
on silica, further separated into the carbamate and phenols on an
alumina column, the carbamates hydrolysed to their phenols and all
underivatized phenols analysed on a flame photometric detector (FPD)
(Bowman and Beroza 1969). Recoveries compared favourably with Soxhlet
extraction and were 68 to 108% at 0.1 to 5 mg/kg fortification levels
for the five compounds, and a sensitivity of 0.01 mg/kg was claimed.
Thornton (1969) also used acetone for the extraction of
methiocarb and its sulphoxide and sulphone from apples and pears,
followed by a NH4Cl:H3PO4 precipitation step, oxidation to the
sulphone with KMnO4, overnight silylation and determination by FPD.
Recoveries of 58 to 117% were attained at 0.05 to 0.5 mg/kg
fortification levels and a sensitivity of 0.04 mg/kg claimed. This
method was validated by the US Environmental Protection Agency down to
0.03 mg/kg for methiocarb and its sulphoxide respectively in maize
grain with recoveries of 108 and 106%.
The same basic procedure was used to analyse a variety of plant
and animal tissues (Thornton and Drager 1973). Modifications were made
for animal products and high-fat products, including a florosil column
clean-up step. Recoveries were similar, with a sensitivity (accurately
measurable) of 0.03 mg/kg achieved, and a 0.01 mg/kg limit of
detection. The limits were approximately 10X better for milk. This
method was validated in US Environmental Protection Agency
laboratories down to 0.01 mg/kg for milk, except that a hydrolysis
step was added. Recoveries were > 80% when a 1% mineral oil in
benzene keeper solution (8 drops) was added before concentration of
the chloroform solutions after hydrolysis and oxidation.
A similar approach, using CH3CN extraction, the precipitating
step, and for the first time a specific hydrolysis step to hydrolyse
the sulphone to the phenol, was used on a variety of commodities
(Strankowski and Stanley 1975). This is again followed by silylation,
which does not require overnight silylation, with the hydrolysis step
included and analysis by FPD. As in the earlier versions, the
individual carbamates could be determined separately, if the oxidation
step is omitted. It is included for analytical convenience. Recoveries
for all three compounds were 70 to 112% at 0.05 to 0.1 mg/kg
fortification levels and an analytical sensitivity of 0.01 mg/kg was
claimed. This method is of particular importance as it is used for the
analysis of well over half of the commodities for which analytical
residue data were provided to the Meeting. A similar method was used
for the determination of methiocarb residues in poultry and eggs
(Strankowski 1976a). Modifications improved the latter method and made
it suitable for the determination of the N-hydroxy sulphoxide and
sulphone metabolites, as well as methiocarb and its sulphoxide and
sulphone (Delphia and Stanley 1980).
Acetone or CH3CN extraction of peaches and cherries was followed
by a precipation step, hydrolysis to the phenols and silylation
(without the oxidation step) to determine methiocarb and its
sulphoxide and sulphone separately by FPD (Stanley 1976). Recoveries
were 56 to 110% at 0.05 to 0.1 mg/kg fortification levels and
sensitivity of 0.03 mg/kg.
Blueberries were extracted with buffered acetone, partitioned
with CHCl3, cleaned up on a silica gel column and derivatized with
trifluoroacetic anhydride for the separate determination of the
respective trifluoroacetyl derivatives of methiocarb and its
sulphoxide and sulphone (Greenhalgh et al 1977). Recoveries were
> 94% at 0.1 and 0.3 mg/kg fortifications with methiocarb, its
sulphoxide and sulphone respectively. The sensitivity was given as
1.3, 2.3 and 5.8×10⁻¹¹ g/sec of methiocarb, its sulphoxide and
sulphone respectively.
Maitlen (1981) modified Thornton's procedure by steeping of
chopped commodities (five) with 1:3 acetone:CH2Cl2, to minimize
emulsions, and oxidized methiocarb and its sulphoxide with peroxide
and acetic acid before hydrolysing the sulphone to its phenol and
derivatizing with methanesulphonyl chloride followed by a florosil
column clean-up. The modification of the oxidation step minimizes
problems with impurities in acetone experienced by earlier
investigators. Although only the mesylated sulphone phenol is
determined, recoveries of methiocarb, its sulphoxide and sulphone were
67 to 129% from 0.05 to 3 mg/kg fortifications. Little difficulty was
required to attain a 0.05 lower limit of detection (the chromatograms
suggest this could be a limit of determination, although it was not so
validated).
An extraction procedure using 1:1 CHCl3:methanol (Morris 1976)
and an analytical procedure using the familiar precipation, oxidation,
silylation techniques and FPD detection was developed (Norris and
Olson 1973). Recoveries were > 80% at 0.5 mg/kg fortifications in
four soils with a 0.13 mg/kg sensitivity.
Methiocarb may also be determined by HPLC multi-residue methods
(Krause 1980) or by electron capture gas chromatography after
hydrolysis and derivatization with pentafluorobenzyl bromide (Coburn
et al 1975).
Because other pesticides registered on the same commodities can
interfere with the analysis of methiocarb, confirmatory methods using
QF-1 (Thornton 1970a) and OV-17 (Thornton 1970b) instead of the less
polar methyl silcone gas chromatographic liquid phases have been
developed. Interference studies of various pesticides in several crops
have been conducted (Olson 1970; Olson 1971; Thornton 1969b;
Strankowski 1976; Morris and Strankowski 1978). Potential interfering
pesticides can be malathion, methyl parathion, dioxathion, ronnel,
thiono systox, phorate, thimet and prometryne. All but the first two
may be separated from methiocarb sulphone derivatives by QF-1 phases.
The first two may be separated using OV-17 (Thornton 1969a).
NATIONAL MAXIMUM RESIDUE LIMITS
National maximum residue limits (MRLs) were reported to the
Meeting by several countries and are summarized in Table 11.
TABLE 11. National maximum residue limits reported to the Meeting
Pre-harvest
Country Crop/Commodity interval MRL
(days) (mg/kg)
Argentina Pome fruit 21
Stone fruit 21
Australia Orchards 7
Berry crops 7
Vegetable crops 7
Field crops 7
Pastures 7
Gardens 7
Cherry 7 15
Grape 7 25
Orange 1 5
Belgium Ornamentals only 7
Bulgaria General 21
Czechoslovakia Hops 35
Ornamentals 7
Denmark Food crops 7
Pastures 7
Federal Republic Head cabbage 14 0.1 *
of Germany Red cabbage 14 0.1 *
Cauliflower 14 0.1 *
Spinach 14 0.1 *
Lettuce (also under glass) 14 1.0 *
Small fruit (berries) 28 0.1 *
Pome fruit 14 0.2 *
Stone fruit 28 0.1 *
TABLE 11. (con't)
Pre-harvest
Country Crop/Commodity interval MRL
(days) (mg/kg)
Strawberry 14 0.1 *
Cereals 28 0.1 *
Potato 14 0.1 *
Sugarbeet 28 0.1 *
Fodder beet 28 0.1 *
Clover 28
Lucerne 28
Lupines 28
Hops 21
France Potato 15
German Fruit 14
Democratic Leafy vegetables 14
Republic Stem vegetables 14
Brassices 14
Root vegetables 14
Fruiting vegetables 4
Hungary Maize 0.1
Israel Vegetables 30
Beet 30
Citrus fruit 30
Fruit 30
Grape 30
Artichoke 30
Italy Fruit 21 0.05
Vegetables 21 0.05
Sugarbeet 21 0.05
Cereals 21 0.05
Mexico Peach 21
New Zealand Pastures 21
Norway General 7
TABLE 11. (con't)
Pre-harvest
Country Crop/Commodity interval MRL
(days) (mg/kg)
Poland Fruit 42
Vegetables 42
Pulse crops 42
Root crops 42
Other crops 42
Portugal General 21
New Zealand Cereals 10
Grape 3
Stone fruit 7
Blueberry 25 (under consideration)
South Africa Apple 14 0.2
Pear 14 0.2
Apricot 14 0.2
Plum 0.2
Table grape 14 0.2
Wine grape 28 - 42 0.2
(according to
variety)
Spain Pastures 15
Cotton 21
Hops 21
Hazelnut 21
United Kingdom Cereals 7
Potato 7
Brassicas 7
Sugarbeet 7
Pea 7
USA Citrus fruit 0.02
Maize, fodder and forage 0.03
Maize, fresh, includes 0.03
sweet corn (kernels plus
cobs)
Maize, grain, field and 0.03
TABLE 11. (con't)
Pre-harvest
Country Crop/Commodity interval MRL
(days) (mg/kg)
popcorn
Peach 21 15
Blueberry 0 25
Cherry 7 25
Venezuela Rice 21 1
* Proposed.
EVALUATION
COMMENTS AND APPRAISAL
Methiocarb has a relatively high acute oral toxicity in the rat
(LD50 13 to 47 mg/kg bw) and dog (LD50 10 to 25 mg/kg bw) and
exhibits a rapid, reversible toxic action characteristic of a
carbamate. There are no marked differences in the sensitivity of the
tested animal species or the sexes.
Metabolites formed in the experimental animal species tested are
of slight toxicity, with the exception of methiocarb sulphoxide, which
has a higher acute toxicity than the parent compound.
Potentiation tests by the I.P. routes with a number of other
anticholinesterase compounds did not result in more than additive
effects. Atropine sulphate proved to be a very effective antidote in
cases of methiocarb poisoning.
Neurotoxicity, embryotoxicity, teratogenicity, multigeneration
reproduction and mutagenicity tests did not indicate any observable
adverse effects due to methiocarb.
Short-term rat, hen, rabbit, dog and cattle studies and long-term
rat studies were performed with methiocarb.
Methiocarb did not have a carcinogenic effect, and in two-year
feeding experiments on dogs and rats no-effect levels were determined.
Methiocarb is widely used around the world, either as a seed
treatment, spray or bait for the control of a variety of pests. The
most important uses are as a bait treatment for control of slugs and
snails and as a bird repellent, either as a spray or seed treatment.
Residue data were available for a wide range of food crops,
representing good agricultural practices. They were not adequate for
the estimation of maximum residue levels for artichokes, barley,
potatoes, rape, wild rice and spinach, but were adequate for the
estimation of maximum residue levels on several commodities when
residues resulted from seed or spray treatments.
In the case of bait treatments, most of the available residue
data were the result of broadcast treatments. The Meeting was aware
that methiocarb is widely used in this manner. However, the Meeting
concluded that information on good agricultural practices using
broadcast bait applications were inadequate to permit estimation of
full maximum residue levels, but the Meeting was able to estimate
temporary maximum residue levels. In estimating these temporary
residue levels, the Meeting was aware, and the data indicate, that on
occasion residue levels on the various commodities so treated may
exceed the estimated residue levels. The Meeting was of the opinion
that these occasional high residues result from the presence of actual
bait pellets or fragments thereof, or contamination, which will be
dislodged by normal handling procedures before consumption.
Methiocarb is relatively stable for lengthy periods under acidic
conditions and hydrolyses rapidly under alkaline conditions. The
degradation rate is increased with temperature.
Methiocarb is readily metabolized or degraded in the environment
by plants, animals and microorganisms. Hydrolysis of the carbamate to
the phenol, oxidation of the sulphide to the sulphoxide and
subsequently to the sulphone, often followed by conjugation, are the
basic chemical changes that occur. The relative order and extent of
each varies with the conditions of each particular situation.
In animals, (ring-l-14C)-methiocarb radioactivity is rapidly
eliminated in the urine (96% of administered within 144 h in the cow)
with low levels in the faeces and milk. Conjugated phenols accounted
for 85% of urine radioactivity. Most of the organosoluble radioactive
residue in milk was unidentified, only methiocarb sulphoxide being
positively identified. The greater part of the milk radioactivity was
in the form of conjugated methiocarb sulphoxide and sulphone phenols.
In cow liver and kidney, methiocarb phenol was the principal
residue, with lesser amounts of the sulphoxide and sulphone phenols
and even less of other moieties. Methiocarb was found at appreciable
levels only in the liver. In cow feeding studies mean residues in
kidney and liver were greater than the 0.05 mg/kg method sensitivity
only at the 100 ppm feeding level. In milk, measurable residues (mean)
were found at both the 30 and 100 mg/kg feeding levels at 0.014 and
0.03 mg/kg respectively.
Excretion and metabolism in poultry was in many respects similar
to that of the cow, although measurable and identifiable residues were
found in most tissues of poultry, whereas residues were sufficient for
characterization only in liver and kidney of the cow. A primary
difference between the cow and poultry is less methiocarb phenol in
liver and kidney of poultry and higher over-all radioactive
equivalents in poultry tissues. Analytically significant levels of
N-hydroxymethyl methiocarb were also found in chicken tissues
(organosoluble and/or conjugated) but apparently not tested in cow
tissues.
In poultry feeding studies, except for skin at the highest
feeding level, residues were found only in the giblets and were 0.02,
0.06, 0.13 and 0.13 mg/kg from lowest to highest feeding levels.
Residue data on individual tissues were not provided. Neither is it
clear whether the N-hydroxymethyl methiocarb residues would have been
measured. In eggs, residues were greater than the 0.02 mg/kg method
sensitivity only at the highest feeding level.
Residues in crops at levels estimated from recommended or
approved practices examined by the Meeting would not be expected to
result in analytically significant residue in animal meat tissues,
eggs or milk.
When methiocarb is applied to soil, it is rapidly taken up by
plants and translocated throughout. Different studies show that
residues can penetrate plants from surface treatments. Studies show
that shortly after treatment, residues in plants are largely
organosoluble and predominantly methiocarb sulphoxide, methiocarb and
methiocarb sulphoxide phenol. As time from treatment increases
organosoluble residues decrease while conjugated aqueous soluble
residues (primarily conjugated methiocarb sulphoxide phenol and
methiocarb phenol) increase. The degree varies with the plant. There
may be low levels of N-hydroxymethyl methiocarb sulphoxide and other
moieties. In some commodities, (e.g. cabbage and lettuce) there is
evidence that residues increase for a period after last application.
In soils, methiocarb desorption is proportional to the amount
adsorbed and has relatively low mobility compared to other pesticides.
Studies show leaching to be inversely related to organic content of
the soil, although methiocarb does not appear to have a strong
propensity for leaching. Persistence in soil varies with soil type and
pH, with a half-life of 6 to 64 days, depending on conditions. Studies
indicate some potential for low level residues in mature rotational
crops grown in soils previously treated, especially for legumes and
root crops, and substantially higher residues in vines and forage
(leaf parts). Residues will accumulate in fish from water containing
10 ppb levels of methiocarb, but rapidly decrease when they are
returned to uncontaminated water.
On topically treated apples, residues are primarily surface ones,
which were found to be mostly methiocarb with some sulphoxide. As in
other plants, water soluble residues increased with time in the peel
and pulp, while there was some decrease in surface organosoluble
residues.
Only a limited amount of information is available on the effects
of processing on residues of methiocarb foods and none on residues in
commerce or at consumption.
Decomposition of methiocarb residues on commodities under
prolonged storage conditions does occur, averaging approximately 17%
over all commodities and over 30% on some commodities. Because many of
the samples analysed for field-incurred residues were stored for
periods up to 18 months before analysis, the resulting actual residues
at sampling can reasonably be expected to have been somewhat higher
than recorded. This was taken into account when limits were estimated.
Numerous methods have been developed for the determination of
methiocarb residues in a variety of crops and foods. Typically,
residues are extracted with an organic solvent, cleaned up by
partitioning and/or column chromatography, methiocarb residues
oxidized to the sulphone, hydrolysed to the phenol, derivatized and
analysed on gas chromatography using a flame photometric detector.
Total residues are typically measured as the sulphone phenol
derivative for analytical convenience, although methiocarb, its
sulphoxide and sulphone phenol derivatives can be determined
separately if the oxidation step is omitted. Several of the methods
are probably suitable for enforcement, as they are all remarkably
similar. The methods of Thornton (1969 a,b) and Thornton and Drager
(1973) are preferred methods as they are published, have been tested
on several commodities and have been validated. The method of
Strankowski and Stanley (1925), although presumably unpublished,
should also receive special consideration as it was the basis of much
of the residue data provided. The method of Bowman and Beroza (1969)
is probably too long for routine enforcement but does offer an
approach for a more detailed characterization of individual residues,
The method of Maitlen (1981) shows promise, although it is relatively
new and perhaps has not been used to the same extent as other ones.
Confirmatory gas chromatographic methods are available to eliminate
pesticides interfering with methiocarb analysis.
Level causing no toxicological effect
Rat: 25 ppm in the diet equivalent to 1.3 mg/kg bw/day
Dog: 5 ppm in the diet equivalent to 0.125 mg/kg bw/day
Estimation of acceptable daily intake for man
0 - 0.001 mg/kg bw
RECOMMENDATIONS OF RESIDUE LIMITS
The Meeting examined residue data from residue trials reflecting
the basic uses for the control of slugs and snails or bird repellency.
For those crops treated by spray applications or as seed treatments,
the Meeting was able to estimate maximum residue levels likely to
occur when methiocarb is used in accordance with approved agricultural
practice and at the specified intervals between last application and
harvest. For those crops treated by bait applications the Meeting was
able to estimate temporary maximum residue levels, pending additional
information on good agricultural practices. The levels refer to the
sum of methiocarb, its sulphoxide and sulphone.
Commodity Estimated Pre-harvest interval and/or
Maximum Residue uses on which recommendations
levels (mg/kg) are based (days)
Seed treatments
Maize 0.05 -1
Rice 0.5 -
Sugarbeets 0.02 -
Spray
Apple 10 21
Blueberry 25 0
Cherry 10 7
Currant, red 5 21
Grape 5 7
Peach 15 21
Plum 1 21
Strawberry 0.02 14
Commodity Estimated Pre-harvest interval and/or
Maximum Residue uses on which recommendations
level3 (mg/kg) are based (days)
Bait
Beans, snap 0.2 7 (broadcast)
Beans, lima 0.2 7 (broadcast)
Broccoli 0.2 7 (broadcast)
Brussels sprout 0.2 7 (broadcast)
Cabbage 0.2 7 (broadcast)2
Cauliflower 0.2 7 (broadcast)2
Maize, sweet corn 0.05 0 (broadcast)
Citrus 0.02 30 (broadcast)
Lettuce 0.2 7 (broadcast)2
Tomato 0.2 7 (broadcast)
1 Data were also available from topical treatments;
2 Data were also available from spray treatments;
3 Pending additional information on good agricultural practices
(see further work required).
FURTHER WORK OR INFORMATION
Required (by 1983)
Information on good agricultural practice for commodities on
which bait applications are recommended/used.
Desirable
1. If future uses on animal feed items could result in potential
residues in meat, milk, poultry and eggs, additional metabolism and
residue data will be necessary. This would include (a) additional
residue data on the pertinent animal feed items, (b) identification of
radioactive residues observed in the organosoluble milk fractions, (c)
from feeding studies, analysis of ruminant liver and kidney tissues
for N-hydroxymethyl methiocarb, (d) from poultry feeding studies,
residue data from individual giblets and analysis of giblets and
muscle tissues for N-hydroxymethyl methiocarb.
2. Information on levels of methiocarb residues in foods at commerce
or at consumption. (this is an example of a selective survey, para
2.10, 1979 JMPR Report).
3. Observations in man.
REFERENCES
Atwell, S.H. and Murphy, J.J. Soil adsorption and desorption of (14C)
1978 Mesurol. Mobay Ag. Chemical Report no. 66145, 10 May 1978.
(Unpublished)
Bayer. Mercaptodimethur (methiocarb) monographs prepared for FAO/WHO.
1981 Report submitted by Bayer, AG, September 1981. (Unpublished)
Bell, R.L. The metabolic fate in vivo of Mesurol (3,5.dimethyl-4
1974 (methylthio) phenol methylcarbamate) in dogs. Mobay Ag.
Chem. Report no. 39243, 11 January 1974. (Unpublished)
Bowman, M.C. and Beroza, M. Determination of Mesurol and five of its
1969 metabolites in apple, pear, and corn by gas chromatography.
Journal of the Association of Official Analytical Chemists,
52:1054-1063.
Church, D.D. BAY 37344 - runoff, leaching, and water stability. Mobay
1970 Ag Chem Report no.26894, 13 February 1970. (Unpublished)
Church, D.D. and Flint, D.R. The fate of Mesurol (4-(methylthio)-3,5
1971 xylyl methylcarbamate) in soil. Mobay Ag Chem Report no.
29591, 23 February 1971. (Unpublished)
Coburn, J.A., Ripley, B.D. and Chan, A.S.Y. Analysis of pesticide
1976 residues by chemical derivatization. II. N-Methylcarbamates
in natural water and soils. Journal of the Association of
Official Analytical Chemists, 59: 188-196.
Crawford, C.R. and Anderson, R.G. The skin and eye irritating
1970 properties of BAY 37344 technical to rabbits. 15 October,
report no. 28304, Mobay Chemical Corp., USA submitted by
Bayer AG. (Unpublished)
1972a The acute oral toxicity to guinea pigs and the acute
inhalation toxicity to rats of Mesurol technical, 24
January. Report no. 31987, Chemagro Division of Baychem
Corp. submitted by Bayer AG. (Unpublished)
1972b The dermal toxicity of Mesurol technical and Mesurol 75%
wettable powder to rabbits, 21 August. Report no. 34477,
Chemagro Division of Baychem Corp., submitted by Bayer AG.
(Unpublished)
Delphia, L.M. and Stanley, C.W. A gas chromatographic method for the
1980 determination of combined residues of (R)Mesurol and five of
its metabolites in poultry tissues and eggs. Mobay report
68642, 13 February 1980. (Unpublished)
Doull, J., Cowan, J. and Root, M. Subacute (16-week) oral toxicity of
1962 Bayer 37344 to male and female rats, 12 June. Report no.
9456, University of Chicago, Dept. of Pharmacology,
submitted by Bayer AG. (Unpublished)
Doull, J., Root, M. and Meskauskas, J. Chronic oral toxicity of Bay
1967 37344 to rats, 15 December. Report no. 21791, University of
Chicago, Toxicity Laboratory, submitted by Bayer AG.
(Unpublished)
1968 Chronic oral toxicity of Bay 37344 to male and female dogs,
1 February. Report no. 22115, University of Chicago,
Toxicity Laboratory, submitted by Bayer AG. (Unpublished)
DuBois, K.P. The acute oral toxicity of Bayer 37344 to chickens, 16
1962 May. Report no.9248, University of Chicago, Department of
Pharmacology, submitted by Bayer AG. (Unpublished)
1964 The acute toxicity of some possible metabolites of Bayer
37344, 22 January. Report no. 12806, University of Chicago,
Department of Pharmacology, submitted by Bayer AG.
(Unpublished)
DuBois, K.P. and Raymund, A.B. The acute toxicity of Bayer 37344 to
1961a mammals, 25 April. Report no. 6775, University of Chicago,
Department of Pharmacology, submitted by Bayer AG.
(Unpublished)
1961b The acute toxicity of Bayer 37344 in combination with other
anticholinesterase insecticides, 1 November. Report no.
7880, University of Chicago, Department of Pharmacology,
submitted by Bayer AG. (Unpublished)
1961c The acute toxicity of Bayer 39007 and Bayer 37344 in
combination with some other anticholinesterase insecticides
to Rats, 4 November. Report no. 7879, University of Chicago,
Department of Pharmacology, submitted by Bayer AG.
(Unpublished)
DuBois, K.P. and Raymund, A.B. The acute toxicity of recrystallized
1962 Bayer 37344 and a wettable powder of Bayer 37344 to female
rats, 12 June. Report no. 9424, University of Chicago,
Department of Pharmacology, submitted by Bayer AG.
(Unpublished)
Eben, A. and Kimmerle, G. Mercaptodimethur - effect of acute and
1973 subacute oral doses on acetylcholinesterase activity in
plasma, erythrocytes and brain of rats, 9 November. Report
no 4284, Bayer AG, Institut fur Toxikologie, submitted by
Bayer AG. (Unpublished)
Eichelberger, J.W. and Lichtenberg, J.J. Persistence of pesticides in
1971 river water. Environmental Science and Technology,
5:541-544.
Ernst, G.F., Saskia, J.R., Gwan, H.T. and Jansen, J.T.A. Thin layer
1975 chromatographic detection and indirect gas chromatographic
determination of three carbamate pesticides. Journal of the
Association of Official Analytical Chemists, 58:1015-1019.
Flint, D.R. and Shaw, H.R. II. The mobility of Mesurol residues in
1974 soil runoff water and the degradation of Mesurol-14C in
pond water. Mobay Ag Chem Report no.39258, 30 January.
(Unpublished)
Greenhalgh, R., Wood, C. and Pearce, P.A. A rapid GC method of
1977 monitoring Mesurol (4-(methylthio)-3.5-xylyl-N-methyl
carbamate) and its sulphoxide and sulphone metabolites and
their persistence in low bush blueberries. Journal of
Environmental Science and Health, B 12(4):229-244.
Gronberg, R.R. and Everett, L.J. The metabolic fate of 4-(methylthio
1964 3,5-xylyl methylcarbamate (BAY 37344 sulphoxide) and
4-(methylsulphonyl)-3,5-xylyl methylcarbamate (BAY 37344
sulphone) in white rats, Mobay Ag Chem Report no. 26819,
submitted by Mobay Chemical Corp.(Unpublished)
Guerzoni, M.E. and DelCupola, L. Attivitá mutagenica degli
1976 antiparassitari, S-TANU,6(3):161-165.
Herbold, B. H321 (active ingredient of Mesurol) Salmonella/microsome
1978 test for determination of point mutations, 6 December.
Report no. 7978, Bayer AG, Institut für Toxikologie,
submitted by Bayer AG. (Unpublished)
1979a H321 - dominant lethal study on male mouse to test for
mutagenic effects, 23 May. Report no. 8395, Bayer AG,
Institut für Toxikologie, submitted by Bayer AG.
(Unpublished)
1979b H321 (active ingredient of Mesurol) micronucleus test for
mutagenic effect on mice, 8 June. Report no. 8426, Bayer
AG,Institut für Toxikologie, submitted by Bayer AG.
(Unpublished)
Hoffman, K. and Schilde, B. H321 (mesurol-Workstoff, Mercaptodimethur)
1980 Chronischer Toxizitätsversuch an Hunden bei Verabreichung im
Futter (2 Jahre - Fütterungs-versuch), 12 Dez. Bericht Nr.
9626, Bayer AG, Institut für Toxikologie, submitted by Bayer
AG. (Unpublished)
Houseworth, L.D. and Tweedy, B.G. Parent leaching studies for
1974 MesurolR. Mobay Ag. Chem Report no. 40568, 21 March 1974.
(Unpublished)
Ives, M. Demyelination study in chickens/Bayer 37344, 16 April. Report
1965 no.16063, Wedge's Creek Research Farm, Inc., Subsidiary of
Industrial Bio-Test Lab., Inc., Biological Evaluations, USA,
submitted by Bayer AG. (Unpublished)
Kraus, R.T. Multi-residue method for N-methyl carbamate pesticides in
1980 crops using HPLC. Journal of the Association of Official
Analytical Chemists, 63:1114-1124.
Kimmerle, G. Product Dr. Wedemeyer II 321 (E 37 344) Production no.
1960 2410, 25 March, Bayer AG, Toxicological and Industrial
Hygiene Laboratory, report submitted by Bayer AG.
(Unpublished)
1966a Mesurol active ingredient (Wedemeyer H321; Ht. no. 3657)
antidotal effect - translation - 8 August. Report no. 34267,
Bayer AG, Institut für Toxikologie, submitted by Bayer AG.
(Unpublished)
1966b Wirkstoff Wedemeyer H 321 (Ht.-Nr. 3657)
Inhalationsversuche, Dez.7. Bayer AG, Institut für
Toxikologie, report submitted by Bayer AG. (Unpublished)
1969a Bay 37344 (subacute dermal toxicity study on rabbits, 1
April. Report no.1291, Bayer AG, Institut für Toxikologie,
submitted by Bayer AG. (Unpublished)
1969b Bay 37344(=H 321) Lo-Nr.691, 20 May. Bayer AG, Institut für
Toxikologie, report submitted by Bayer AG. (Unpublished)
1971 Comparison of the antidotal actions of tetraethylammonium
chloride and atropine in acute poisoning of carbamate
insecticides in rats, 9 January. Archives of Toxicology,
27:311-314.
Krötlinger, F., Löser, E. and Voge, O. H 321 (Mercaptodimethur)
1981 Akarizide, toxikologische Untersuchungen an Ratten. Br.
10039 v. 2.7.81, report submitted by Bayer AG to WHO.
(Unpublished)
Lamb, D.W. Accumulation and persistence of residues in bluegill fish
1974 exposed to Mesurol-14C. Mobay Ag Chem Report no. 40096, 8
March 1974. (Unpublished)
Lamb, D.W. and Matzkanin, C.S. The acute oral toxicities of Mesurol
1975 technical to dogs, 25 August. Report no. 45074, Mobay
Chemical Corp., Agr. Division, submitted by Bayer AG.
(Unpublished)
1976a The acute oral toxicities of mesurol technical and Mesurol
sulphoxide, 12 July. Report no. 49541, Mobay Chemical Corp.,
Agr. Division, submitted by Bayer AG. (Unpublished)
1976b The acute oral toxicities of Mesurol technical and Mesurol
sulphoxide, 19 August. Report no. 50541, Mobay Chemical
Corp., Agr. Division, Submitted by Bayer AG. (Unpublished)
Löser, E. Bay 37344/Blut-, hart- und Klinisch-Chemische Untersuchungen
1969 nach oraler applikationan Ratten, 3 March, Bericht Nr. 1358,
Bayer AG, Institut für Toxikologie, report submitted by
Bayer AG. (Unpublished)
Löser, E. Bay 37344/Generation studies on rats, 10 July. Report no.
1970 2208, Bayer AG, Institut für Toxikologie, submitted by Bayer
AG, Addenda: Histopathology - Huntingdon Research Centre,
Huntingdon, England. (Unpublished)
Lorke, D. Mesurol active ingredient (Bay 37344) studies on rats for
1971 embryotoxic and teratogenic effects, 30 November. Report no.
3133, Bayer AG, Institut für Toxikologie, submitted by Bayer
AG. (Unpublished)
Maitlen, J.C. Gas-liquid chromatographic determination of residues of
1981 methiocarb and its toxic metabolites with the flame
photometric detector after derivatization with
methanesulphonyl chloride. Journal of Agricultural and Food
Chemistry, 29:260-264.
Minor, R.G. and Atwell, S.H. Metabolic fate of Mesurol(R) in aerobic
1979 and anaerobic aquatic environments. Mobay Ag Chem Report no.
66775, 30 January 1979. (Unpublished)
Minor, R.G. and Murphy, J.J. Metabolism and excretion of Mesurol by a
1977a dairy cow, Mobay AG Chem Report no. 51144 (1977), submitted
by Mobay Chemical Corp. (Unpublished)
1977b Radioactive residues of (ring-l-14C)-Mesurol in a lactating
dairy cow. Mobay Ag Chem Report no. 51145 (1977) submitted
by Mobay Chemical Corp. (Unpublished)
Mobay Residues of Mesurol in bovine tissues and milk. Mobay Ag
1970 Chem Report 26848, 26 February, 1970 and Mobay Ag Chem
Report no. 26879, 3 March, 1970. (Unpublished)
Mobay Residues of Mesurol in soils. Mobay Ag Chem Report Nos.
1973 2680, and 26883, 3 March (Unpublished)
Mobay Residues of Mesurol in soils. Mobay Ag Chem Report nos.
1974 38948, 38949 and 38950, 30 November 1973. (Unpublished)
Mobay Residues of Mesurol in rotational crops. Mobay Ag. Chem
1977-81 Reports: 48847, April 5, 1978; 50430, August 3, 1978; 48865,
April 5, 1978; 50431, August 3 1978; 50382, April 17 1978;
53816, October 4, 1977; 50422 April 17 1978; 53855 October 4
1977; 53815 October 17 1977; 54055 October 4 1977; 53854
October 4 1977; 66805 April 4 1978; 66809 April 5 1978;
66806 April 5 1978; 66810 April 5 1978; 66807 April 5 1978;
66813 April 22 1978; 66808 April 5 1978; 66814 April 22
1978; 66821 April 5 1978; 66817 April 4 1978; 66822 July 13
1978.
66818 April 4 1978; 66823 July 13 1978; 66825 July 13 1978;
66824 July 13 1978; 66828 April 22 1978; 66831 April 27
1978; 66835 April 22 1978; 66832 April 27 1978; 66836 April
22 1978; 66833 April 27 1978; 49835 April 17 1978; 66834
April 27 1978; 45379 August 3 1978; 66839 August 3 1978;
45850 August 3 1978; 66840 August 3 1978; 46257 August 3
1978; 66841 August 3 1978; 46436 August 3 1978; 66842 August
3 1978; 49231 April 6 1978; 66843 January 5 1979; 49431
April 6 1978; 66843 January 5 1979 49456 August 3 1978;
66844 January 5 1979; 49591 August 3 1978; 66845 January 5
1979; 49693 April 17 1978; 66846 January 5 1979; 49835 1978;
69256 January 28 1981; 50335 April 17 1978; 69257 January 29
1981; 50423 August 3 1978; 69259 January 29 1981; 50429
August 3 1978; 69260 January 29 1981; 69261 January 29 1981;
69262 January 29 1981. (Unpublished)
Mobay Residues of Mesurol in soils. Mobay Ag Chem Reports: 66929, 26
1979-81 February 1979; 67052 26 February 1979; 69230 20 January
1981; 69231 20 January 1981; 69233 16 February 1981; 69234
19 January 1981; 69236 20 January 1981; 69239 21 January
1981. (Unpublished)
Mobay The effect of frozen storage at 0 to 10°F on Mesurol residues
1981 in crops, Mobay Ag Chem Reports: 49948 1976; 27072 March 19
1970; 51168 January 12 1977; 27081 March 30 1979; 66101 May
3 1978; 49580 January 21 1977; 67923 March 2 1979; 49729
September 20 1976; 68013 July 19 1979; 49947 November 1
1976; 68205 October 5 1979. (Unpublished)
Morgan, J.G. and Parton, K. Metabolism of Mesurol in apples. Mobay Ag
1974 Chem Report no. 40208, 1 April 1974. (Unpublished)
Morris, R.A. and Olson, T.J. Determination of Mesurol and metabolites
1973 in soil by flame photometric gas chromatography. Mobay
report no. 38319, 10 September 1973. (Unpublished)
Morris, R.A. and Strankowski, K.J. An interference study for the
1978 residue method for Mesurol on rice. Mobay report no. 66095,
12 June 1978. (Unpublished)
Murphy, J.J. and Morris, R.A. Residues of Mesurol in rotational crops.
1979 Mobay Chem Ag Report no. 66926, 1 February 1979.
(Unpublished)
Nelson, D.L. Acute oral toxicity of Mesurol technical and metabolites
1979 to rats, 27 June. Report no. 67815, Mobay Chemical Corp.,
submitted by Bayer AG. (Unpublished)
New Zealand, Information provided by the New Zealand Government, which
1981 also included undated documents: methiocarb as a bird
repellent in blueberries, P.T. Holland, D.W. McFarlane and
R.M. Bates, Proc. 33rd N.Z. Weed Pest Control Conference,
and, Further experiments with methiocarb on blueberries,
P.T. Holland, D.W. McFarlane and G. Lawn, Proc. 34th N.Z.
Weed and Pest Control Conference.
Olson, T.J. An interference study for Mesurol residue determinations
1970 on apple, pear, meat and milk. Mobay report no. 27080, 30
March 1970. (Unpublished)
Olson, T.J. Interference study for the residue method for Mesurol and
1971 its metabolites on corn. Mobay report no. 29412, 18 February
1971. (Unpublished)
Root, M., Doull, J. and Cowan, J. Determination of the safe dietary
1963 level of Bayer 37344 for dogs, 23 March. Report no. 11159,
University of Chicago, Department of Pharmacology, submitted
by Bayer AG. (Unpublished)
Saakvitne, J.A., Gustafson, D.E. and Wilkes, L.C. Mesurol hydrolysis
1981 in sterile buffers Mobay Ag Chem, 22 January 1981.
(Unpublished)
Solmecke, B. Akute oral Toxizität KLN 1584/1, April 6. Bayer AG,
1970a Institut für Toxikologie, report submitted by Bayer AG.
(Unpublished)
1970b Akute oral Toxizität KLN 1584/2, April 6. Bayer AG, Institut
für Toxikologie, report submitted by Bayer AG. (Unpublished)
1970c Akute oral Toxizität KLN 1584/3, April 6. Bayer AG, Institut
für Toxikologie, report submitted by Bayer AG. (Unpublished)
1970d Akute oral Toxizität KLN 1584/4, April 6. Bayer AG, Institut
für Toxikologie, report submitted by Bayer AG. (Unpublished)
1970e Akute oral Toxizität Mesurol-Phenol, 14 May. Bayer AG,
Institut für Toxikologie, report submitted by Bayer AG.
(Unpublished)
Stanley, C.W. Determination of residues of Mesurol and its toxic
1976 metabolites separately in peaches and cherries. Mobay report
no. 49727, 1 September 1976. (Unpublished)
Stanley, C.W. and Flint, D.R. The metabolic fate of Mesurol in sandy
1974 loam soil. Mobay Ag Chem Report 39429, 29 January 1974.
(Unpublished)
Stanley, C.W. and Johnson, G.A. II. Metabolites of Mesurol in rat
1976 urine. Mobay Ag Chem Report no. 50732, submitted by Mobay
Chemical Corp. (Unpublished)
Stanley, C.W., Kottman, R.F. and Bingman, K.J. Metabolism and
1979a excretion of Mesurol by poultry. Mobay Ag Chem Report no.
66777, submitted by Mobay Chemical Corp. (Unpublished)
1979b Radioactive residues of (14C)-Mesurol in poultry. Mobay Ag
chem Report no.66778, submitted by Mobay Chemical Corp.
(Unpublished)
Stanley, and Parker - cited by Manufacturer, but the document was not
1981 provided or identified.
Starr, R.I. and Cunningham, D.J. Metabolism of 14C-labelled methiocarb
1973 (4-methylthio)-3.4-xylyl methyl carbamate) in soil and
water. Mobay Ag Chem Report no. 38747. (Unpublished)
Strankowski, K.J. An interference study for the residue method for
1976a Mesurol in various crops. Mobay Report no. 49467, 1 July
1976. (Unpublished)
1976b Method for the determination of Mesurol and its toxic
metabolites in poultry and eggs. Mobay Report no. 49078, 29
January 1976. (Unpublished)
Strankowski, K.J. Microbial degradation of Mesurol. Mobay Ag Chem
1978 Report no. 66625, 19 October 1978. (Unpublished)
Strankowski, K.J. Metabolism of Mesurol in rice. Mobay Ag Chem Report
1979 no. 66776, 30 January 1979. (Unpublished)
Strankowski, K.J., Delphia, L.M. and Murphy, J.J. Cattle acceptance
1978 (palatability) of alfalfa pellets treated with Mesurol, 15
June. Report no. 66391, Mobay Chemical Corp., submitted by
Mobay Chemical Corp. (Unpublished)
Strankowski, K.J. and Minor, R.G. Effects of feeding Mesurol/Mesurol
1976 sulphoxide (9:1) to chickens for 28 days, 7 January. Report
no. 49639, Mobay Chemical Corp., Agr. Division, submitted by
Mobay Chemical Corp. (Unpublished)
Strankowski, K.J. and Murphy, J.J. Mesurol uptake and metabolism by
1981 lettuce and tomato plants. Mobay Ag Chem Report 50863, 12
November 1976. (Unpublished)
Strankowski, K.J. and Parker, G.D. (14C)-Mesurol rotational crop
1981 study. Mobay Ag Chem Report no. 69270, 10 February 1981.
(Unpublished)
Strankowski, K.J. and Stanley, C.W. Determination of residues of
1975 Mesurol and its toxic metabolites in crops. Mobay report no.
45089, 15 August 1975. (Unpublished)
Thornton, J.S. Determination of residues of BAY 37344 and metabolites
1969a in apples and pears by flame photometric gas chromatography.
Mobay Report no. 25168, 12 June 1969. Published as Method I
of the U.S. Food and Drug Administration Pesticide
Analytical Manual, Vol. II.
1969b An interference study for the residue methods for BAY 37344
and metabolites. Mobay report no. 26438, 18 December 1969.
(Unpublished)
Thornton, J.S. A confirmation procedure for the BAY 37344 residues
1970a methods. Mobay report no. 26964, 13 March 1979.
(Unpublished)
1970b A secondary confirmatory procedure for the Mesurol (BAY
37344) residue methods. Mobay report no. 27147, 9 April
1970. (Unpublished)
Thornton, J.S. and Drager, G. Determination of residues of Mesurol and
1973 its toxic metabolites in plant and animal tissues.
International Journal of Environmental Analytical Chemistry,
2:229-239.
Thornton, J.S., Hurley, J.B. and Obrist, J.J. Soil thin-layer mobility
1976 of twenty-four pesticide chemicals. Mobay Ag Chem Report no.
51016, 15 December 1976. (Unpublished)
Thyssen, J. Bestimmung der akuten Toxizität (LD50), 15 November. Bayer
1977a AG, Institut für Toxikologie, report submitted by Bayer AG.
(Unpublished)
1977b Bestimmung der akuten Toxizität (LD50), 30 November. Bayer
AG, Institut für Toxikologie, report submitted by Bayer AG.
(Unpublished)
Thyssen, J. and Schilde, B. H 321 (Mesurol active ingredient)
1978 neurotoxicity studies on hens, 20 June. Report no. 7637,
Bayer AG, Institut für Toxikologie, submitted by Bayer AG.
(Unpublished)
Tweedy, B.G. and Houseworth, L.D. Leaching of aged residues of Mesurol
1974 (ring-l-14C) in sandy loam soil. Mobay Ag. Chem Report no.
40568, 15 May 1974. (Unpublished)
Udall, N.D. The toxicity of the molluscicides metaldehyde and
1973 methiocarb to dogs. The Veterinary Record, 13 October 1973.
Waggoner, T.B. and Olson, T.J. Effect of feeding organophosphorus and
1971 carbamate pesticides to cattle. Chemagro Corp., 12-17
September, Paper no. 45, Division of Pesticide Chemistry,
162nd National ACS Meeting, Washington, submitted by Bayer
AG. (Unpublished)
Wheeler, L. and Strother, A. Placental transfer, excretion and
1974 disposition of (14C)-Mesurol in maternal and foetal rat
tissues. Toxicology and Applied Pharmacology, 30:163-174.
grain indicated methiocarb penetration into the grain. Also as in the
case of lettuce and tomato plants, organosoluble residues in plant or
grain decreased with time after treatment. The predominant over-all
residue distribution at day 28 in rice plants and grain from these
studies show a decrease of methiocarb from > 90% at day zero to 2 to
20% at day 28; an increase in methiocarb sulphoxide from 2 to 6% at
day zero to approximately 35% and an increase of methiocarb phenol
conjugate and methiocarb sulphoxide phenol from none to approximately
10%, all in the same period. There were lesser amounts < 3%) of
other metabolites at day 28. The hydroxymethyl methiocarb sulphoxide
occurred up to about 3%.
A metabolism study and a cumulative residue study were conducted
on apples (Morgan and Parton 1974). In the metabolism study a single
50% ethanol solution syringe application of (ring-l-14C)-methiocarb
and methiocarb (1:1 ratio) was made to each of 37 apples at a combined
rate of 2 mg/apple with no run-off. Samples of three apples or more
were analysed at intervals from 0 to 43 days post-application. As a
percent of that applied, radioactivity declined from 94% at day zero
to about 30% at day 17, where it levelled off for the duration of the
43 days. The bulk of observed residue was surface residues removable
by a benzene wash (from 99% on day zero to around 60 to 65% after day
29) and was said to consist of 96 to 100% methiocarb and the rest its
sulphoxide. As a percent of applied radioactivity, the decline was
more rapid, down to about 20% after day 29. Following the pattern on
other plants, the water soluble residues increased with time in peel
and pulp relative to organsolubles. Total analysis of the 43-day
residue was methiocarb 65.3%, methiocarb sulphoxide 9.4%, methiocarb
sulphone 0.4%, methiocarb phenol 18%, methiocarb sulphone 0.8% and
water soluble unknown 1.5%.
In the residue study, eight syringe applications of a 75 WP
methiocarb formulation (1:9 ratio (ring-l-14C)-methiocarb:methiocarb)
were made to each of 24 apples to run-off at a rate equivalent to
1.5 lb. a.i./100 gal. (1 lb/US gal = 120 g/l). Apples were sampled
throughout and up to day 14 after the last application. Residues
peaked at about 3 to 8 mg/kg after the fourth treatment. With
approximately 95% of the residue identified, the over-all distribution
14 days post-application (77 days from initial application) in terms
of percent and mg/kg (methiocarb equivalents) was methiocarb 61
(2.7), methiocarb sulphoxide 7 (0.3), methiocarb sulphone 0.1 (0.0),
methiocarb phenol 4.6 (0.2), methiocarb sulphoxide phenol 22.1 (1.0),
methiocarb sulphone phenol 1.1 (0.05) and unknowns < 5 (0.2).
Therefore, methiocarb is the predominant residue shortly after
application and up to 14 days post-application, and while methiocarb
phenol was the second largest residue in the metabolism study, the
sulphoxide phenol is second in the residue study (14 days post-
treatment or 77 days from initial application). The primary metabolic
route in plants, therefore, appears to be methiocarb -> its
sulphoxide -> sulphoxide phenol -> glycosidic conjugation with a
minor route of methiocarb -> its phenol -> phenol conjugate. The
relative abundance of any one moiety varies with time and crop.
In animals
The metabolism of methiocarb in rats (Gronberg and Everett 1964
and Stanley and Johnson 1926) and in dogs (Bell 1974) is discussed
under "Biochemical Aspects".
The animal studies discussed in this section indicate that the
primary difference between liver and kidney metabolism in the cow and
hen is less methiocarb phenol in chicken liver and kidney but higher
overall methiocarb equivalent residues in chicken tissues than in that
of cows. It is also noteworthy that N-hydroxymethyl methiocarb
sulphoxide is an analytically significant residue in chicken tissues,
especially in muscle. Apparently no attempt was made to identify the
hydroxy metabolites during the cow studies. Hydrolysis and conjugation
were the major metabolic routes in liver and kidney of chickens
whereas oxidation was also important in fat skin, and muscle.
Cow
In two studies a dairy cow was dosed with (ring-l-14C)methiocarb
(Minor and Murphy 1977a,b). Details are reported under "Biochemical
Aspects". In the first study maximum radioactivity in milk peaked at
0.02 mg/kg (methiocarb equivalent) at 24 to 32 hours post-treatment.
One week later, the same cow was dosed in the same manner.
Maximum radioactive residues in milk were 0.06 mg/kg methiocarb
equivalent. Nineteen percent of the radioactivity in milk was
organosoluble although most of this residue was unidentified. Only
methiocarb sulphoxide was positively identified in this fraction.
Another 9% was precipitated in a coagulation step. About 56% of the
milk radioactivity in the form of conjugates was released by enzyme
and acid hydrolysis. Most of this 56% was equally divided between
methiocarb sulphoxide phenol and methiocarb sulphone phenol with a
< 1% each of methiocarb, its sulphoxide, its phenol, and an unknown.
In tissues, radioactive residues were 0.11 mg/kg in kidney, 0.07 mg/kg
in liver, approximately 0.01 mg/kg in udder, heart and renal fat and
< 0.01 mg/kg in round, shoulder, loin, brain and omental fat.
Therefore, only kidney and liver contained sufficient residues for
further characterization. The distribution of residues in kidney and
liver and the relative portions which are organosoluble or requiring
hydrolysis for release of conjugated moieties are given in Table 8. it
can also be seen in Table 8 that methiocarb phenol is the principal
metabolite in liver and kidney (25 and 55% respectively). While
methiocarb sulphoxide phenol and methiocarb sulphone phenol are also
present in analytically significant amounts in liver and kidney,
methiocarb, its sulphoxide and to a lesser extent its sulphone, occur
in analytically significant amounts in the liver but not in kidney.
Methiocarb, together with its carbamate metabolites, accounted for no
more than 0.02 mg/kg in any tissue.
TABLE 8. Percent distribution of radioactivity among methiocarb and its metabolites extracted
from kidney and liver tissue of a dairy cow dosed five times with
(ring-1-14C)-methiocarb
Percent distribution
Kidney Liver
Compound Acid Acid
Organosoluble reflux Organosoluble reflex
Methiocarb <1 0 12 2
Methiocarb sulphoxide 0 0 4 3
Methiocarb sulphone <1 0 <1 1
Methiocarb phenol 11 44 14 11
Methiocarb sulphoxide phenol 7 0 7 2
Methiocarb sulphone phenol 16 1 3 3
Origin unknown 2 1 3 9
Total extractable 38 46 44 30
Beef and dairy cattle were fed rations containing 10 (0.3 mg/kg
bw/day), 30 and 100 mg/kg methiocarb for 29 days, three cows at each
feeding level (Mobay 1970). Milk was collected on the days 28 and 29
of feeding and cattle sacrificed on day 29 for tissue analyses. A copy
of the method used was not provided, although it is known that the
procedure measures methiocarb, its sulphoxide and sulphone as one gas
chromatographic response after oxidizing the sulphone and silylating.
It is apparently basically the same procedure as that of Thornton and
Drager (1973). As such, it would not be expected to determine
conjugated residues as there is no hydrolysis step. For this reason,
up to 50% of the total residue may not have been determined in some
tissues. Phenolic metabolites, the major part of the residue in some
tissues, may not have been determined if extracted. It cannot be
concluded whether the hydroxy metabolites would have been determined.
Except for one 0.05 mg/kg residue in heart at the 100 mg/kg feeding
level, residues in steak (loin, round, flank) heart, brain and fat
(omental, renal, back) were < 0.05 mg/kg at the 10 to 100 mg/kg
feeding levels. Residues (mg/kg) in milk, liver and kidney are given
in Table 9.
TABLE 9. Residues recovered from cattle tissues and milk after methiocarb feeding
No. samples
Dose level Milk Liver Kidney Each Milk
tissue
10 <0.05-0.007 <0.05 <0.05 3 6
(mean <0.005)
30 0.008-0.02 <0.05,<0.05, <0.05 3 6
(mean 0.014) 0.08 (mean <0.05)
100 0.021-0.033 <0.05,0.09,0.1 <0.05,0.06,0.08 3 6
(mean 0.026) (mean 0.07) (mean 0.06)
control <0.05 <0.05 <0.05 1 9
Hen
Eight White Leghorn hens were given a single dose of (ring-l-
14C)-methiocarb by intubation at 4.4 mg/kg bw and the excreta and
eggs monitored at regular intervals up to 96 h post-treatment (Stanley
et al 1979). About 84% of the dose was excreted within 24 h and only
1% more in the next 72 h. Thirty-four percent of the dose was found
in the excreta as non-conjugated methiocarb, methiocarb phenol,
methiocarb sulphoxide phenol, methiocarb sulphone phenol, and
hydroxymethylmethiocarb sulphoxide with a distribution of < 1, 13, 9,
7 and 2% of the dose respectively.
Of the 49% of the administered dose in the aqueous excreta
fraction, 41% was released by acid hydrolysis. Methiocarb phenol,
methiocarb sulphoxide phenol and methiocarb sulphone phenol released
by the acid hydrolysis constituted 21, 1 and 10% respectively of the
applied dose. The remaining 17% of the dose in the aqueous fraction
was not identified. In the combined eggs, maximum radioactivity peaked
at 6 to 24 h after administration of the dose and was 0.02 mg/kg
methiocarb equivalents. The residues in eggs were not further
characterized.
Three weeks later, these same hens were dosed by tube at the same
level with (ring-l-14C)-methiocarb for each of five consecutive days
and sacrificed for tissue studies (Stanley et al 1979a). Radioactive
methiocarb equivalent were: kidney 3.3 mg/kg, liver 2.0 mg/kg; gizzard
(including lining), 7.7 mg/kg; fat, 0.7 mg/kg; skin, 1.3 mg/kg; breast
muscle, 0.4 mg/kg; leg muscle, 0.5 mg/kg; heart, 0.8 mg/kg and egg,
0.02 - 0.08 mg/kg. Because residues in eggs were < 0.1 mg/kg, they
were not further characterized.
Non-conjugated residues as a percent of residue in the specific
tissue ranged from 28% in kidney to 84% in the gizzard and residues
released used by acid hydrolysis ranged from 3% in the gizzard to 47%
in the kidney. Unidentified residues remaining in solids or unreleased
by acid hydrolysis accounted for 25, 19, and 13% of radioactivity in
kidney, liver and fat respectively with 7% or less in other tissues.
Although all compounds listed in Table 1 except methiocarb
sulphone were identified in varying concentrations in one or more
tissues, the major residues as a percent of radioactivity in each
tissue (abbreviations as in Table 1) according to non-conjugated and
acid released conjugates respectively were as given in Table 10.
TABLE 10. Residues recovered from hen tissues after dosing with (ring-l-14C)-methiocarb
Tissue Non-conjugated conjugates
Kidney MSOP 11% MSOP 18%, MP 13%, HMSO 3%
Liver MSOP 17% MP 10%, MSOP 7%, HMSO 6%
Gizzard(with lining) M 75% < 1% MP, MSOP, MSO2P
Fat M 41%, MP 14% MP 12%
Skin M 16% MP 30%
Breast muscle MSOP 24%, HMSO 17% MP 8%
Leg muscle MSOP 15%, HMSO 18% MSOP 9%, MP 6%
Heart HMSO 16% MP 32%
Hens were fed, ad libitum, with methiocarb/methiocarb sulphoxide
(9:1) at 20, 60, 120 and 360 ppm in the diet for 28 days, four hens
per feeding level and for controls (Strankowski and Minor 1976).
Giblets (heart, gizzard, liver), muscle (composite), skin, fat tissues
(composite) and eggs (collected on the even and last three days) were
analysed. While the method used was not provided, it is known that it
measures methiocarb and its sulphoxide by oxidation both to the
sulphone, hydrolysis to the sulphone phenol and silylation for gas
chromatographic detection and with a reported sensitivity of 0.02
mg/kg. Except for 0.02 mg/kg in skin at the 360 mg/kg feeding level,
average residues were < 0.02 mg/kg in muscle, skin and fat at all
feeding levels and in all tissue controls. Average residues in giblets
were 0.13, 0.13, 0.06 and < 0.02 mg/kg at the 360, 120, 60 and
20 mg/kg feeding levels respectively. Residues on individual tissues
were not available. Residues in eggs were < 0.02, < 0.02, <0.02,
< 0.02 to 0.03, and 0.03 to 0.06 mg/kg in controls, feeding levels
20, 60, 120 and 360 mg/kg respectively.
In soil
Adsorption and desorption
Absorption and desorption of (ring-l-14C)-methiocarb of an
aqueous solution by loam soil was studied over a concentration range
of 0.25 to 4.8 mg/ml (Atwell and Murphy 1978). Ten gram air-dried soil
samples with 3% moisture were treated with 50 ml pH 6 buffered test
solution and shaken at 25°C for 16h before analysis. Residue absorbed
was determined by the residue in the decant vs. the initial
concentration. Desorption was conducted similarly, using a pH 6
buffered solution, the most stable pH for methiocarb. Equilibrium was
established at 7 to 9 and 9 to 11 h for adsorption and desorption
respectively. Under the test conditions 70 to 82% were adsorbed over
the concentration range, decreasing from the highest to the lowest as
the concentration increased. Desorption was proportional to the amount
adsorbed and ranged from 17 to 22% from over the 10 to 170 mg/kg range
of soil-adsorbed methiocarb. Freundlich constants were k=12.6 and
l/n=0.8.
Leaching
(Ring-l-14C)-methiocarb was applied to thin layers of six soils
(ranging from sand to loam to clay), one from each of six states in
the USA and compared with 23 other pesticides for leaching behaviour
on the basis of Rf values (Thornton et al 1976). On a scale of 1.0,
the Rf of methiocarb ranged from 0.22 to 0.42 (mean 0.33) in the six
soils and was considered to be of low relative mobility. Other
pesticides ranged from an Rf of 0.01 to 0.02 for DDT to 0.91 to 0.99
for trichlorfon. The mobilities were directly related to water
solubility.
(Ring-l-14C)-methiocarb was applied to 30 cm × 7.6 cm segmented
columns containing six soil types with organic matter ranging from 0.6
to 77% and eluted with 50 cm of water at the rate of 2.5 cm per hour
(Houseworth and Tweedy 1974). Radioactivity was leached, but in three
of the soils > 70% remained in the top two inches of soil. Leaching
was generally inversely related to organic matter. Radioactivity was
found in the leachate of only the sandy loam, and this could have been
due to the pH of 8 and possible degradation of methiocarb. The other
soils had a pH of < 6.2.
The same authors (Tweedy and Houseworth 1974) also eluted 30 cm
high columns of aged sandy loam topped with (ring-l-14C)-methiocarb
with distilled water at a rate of 0.5 acre. inch/day (1 acre. in =
1 ha.cm) for 45 days. The top one third of the column contained 91.2%
of the radioactivity while 5% was in the leachate.
Persistence
Methiocarb 50 WP was sprayed at a rate of 20 lb a.i./acre onto
two soil plots and incorporated to a depth of 9 to 15 cm to achieve a
theoretical concentration of 10 mg/kg (Mobay 1973). Samples were taken
from the 0 to 9 cm depth and analysed for methiocarb, methiocarb
sulphoxide and methiocarb sulphone, in total, at various intervals in
a period from 0 to 370 days. The methiocarb residue half-life was
approximately 15 days in silt loam and approximately 45 days in clay.
Residues ranged from 5 mg/kg at zero day to < 0.25 mg/kg at 370 days.
A second set of three soil plots was sprayed twice with methiocarb 75
WP at a rate of 20 lb a.i./acre with a one-year interval between the
applications (Mobay 1974). The applications were incorporated, and the
soil was sampled and analysed as described previously. The methiocarb
half-life in these plots (two sandy loams and one silt loam) ranged
from 15 to 50 days and residues ranged from 28 mg/kg at day zero to
0.13 mg/kg at 343 days.
Two additional studies were concluded with methiocarb 2% bait or
methiocarb 75 WP applied in broadcast fashion to the soil at a rate
of 5 lb a.i./acre (Mobay 1979-81). Subsequent soil samples taken
from both the 0 to 15 cm and 15 to 30 cm depths were analysed for
methiocarb, methiocarb sulphoxide and methiocarb sulphone
individually. In these studies methiocarb residues declined rapidly
(from a maximum residue of 4.7 mg/kg at the 0 - 15 cm depth), while
the residues of methiocarb sulphoxide and sulphone rose to maximum
peak levels of 0.6 mg/kg and 0.3 mg/kg respectively at 30 to 82 days
and then also declined to less than 0.1 mg/kg each by 365 days and
< 0.02 mg/kg each in all cases by 553 days. The half-life of
methiocarb for each of the soils varied between 6 and 64 days.
Although some residues do occur in the 15 to 30 cm depth (up to a
combined residue of 0.4 mg/kg), at the zero-time samplings the
combined residue was generally well below 0.1 mg/kg. This suggests
that methiocarb and its carbamates do not have a strong propensity for
leaching.
Rotational crops
A radioactive rotational crop study was performed in greenhouse
planters to test for possible residues from (14C)-methiocarb in crops
planted 30, 120 and 365 days (601 days for wheat) after a (ring-l-
14C)-methiocarb 75 WP soil treatment at a rate equivalent to 5 lb
a.i./acre (Strankowski and Parker 1981). Radioactive residues in the
soil declined from 0.934 to 0.623 mg/kg methiocarb equivalents during
the two-year study, while the actual carbamate residue decreased from
0.828 to 0.121 mg/kg methiocarb equivalents during the same period.
The rotational crops contained radioactive residues at harvest, but
only a portion of this residue could be attributed to intact
carbamates. Maximum total radioactivity as methiocarb equivalents
decreased in mature crops over the course of the study (30 to 365 day
plantings) 5.7 to 0.3 mg/kg in wheat heads, 7.8 to 0.6 mg/kg in wheat
stalks, 64 to 3 mg/kg in wheat forage, 1.4 to 0.2 mg/kg in beet tops,
0.3 to 0.1 mg/kg in beet roots, and 2 to 0.2 mg/kg in kale.
Total carbamate residues made up 19 to < 1% (1.9 to
< 0.006 mg/kg) of total residues. Methiocarb sulphoxide was the
principal carbamate found, along with small amounts of its sulphone,
N-hydroxymethyl sulphoxide, and N-hydroxymethyl sulphone.
As radioactive residues were detected in these greenhouse-grown
rotational crops at levels higher than expected, a field study, using
formulated products, was undertaken to determine if residues would
occur in subsequent crops under actual use conditions (Murphy and
Morris 1979; Mobay 1977-81). Methiocarb 75 WP was applied at rates of
1.25, 2.5, 5 and 10 lb. a.i./acre to bare soil. The single application
at the exaggerated rates was an attempt to simulate a full season's
application of methiocarb. At 30 and 365 days after the methiocarb
treatment, grains (sorghum and corn), pod vegetables (snap beans and
black-eyed peas) and root crops (radishes and turnips) were planted in
the plots as representative of rotational crops that may be planted
after use of methiocarb on a target crop. The total residue of
methiocarb, methiocarb sulphoxide and methiocarb sulphone in each crop
was determined.
Maximum residues determined as total methiocarb, its sulphoxide
and sulphone, found in mature crops were sorghum (some wheat)
< 0.02 mg/kg (green forage), < 0.02 mg/kg (grain), 0.07 mg/kg
(straw); corn, 0.14 mg/kg (green forage 10 lb. a.i./acre, 30 day
plant), < 0.02 mg/kg (kernel); snap beans or peas, 0.03 mg/kg (green
vines), 0.11 mg/kg (snap beans, planted at 355 days and at 1.25 lb
a.i./acre or 0.03 mg/kg at 1.25 lb a.i./acre 30-day plant),
< 0.02 mg/kg (pod); blackeyes, 0.15 mg/kg (green vines 5 lb a.i./acre
30-day plant), 0.07 mg/kg (peas, 1 lb a.i./acre 90-day plant),
< 0.02 mg/kg (pod); radish, 0.03 (root), 0.05 mg/kg (top), both at
1.25 lb a.i./acre, 120-day plant; turnip, < 0.02 mg/kg (root),
0.29 mg/kg (top, 10 lb a.i./acre 30-day plant); soil, 7 mg/kg (30 day
plant, 10 lb a.i./ acre).
These studies indicate that methiocarb carbamate residues in
mature crops can generally be expected to be quite low or non-
detectable in rotational crops planted at 30 or more days after
maximum treatments of less than 5 lb a.i./acre. The data do indicate,
however, that on occasion residues of < 0.03 mg/kg can occur in
legumes or root crops grown under these conditions, and that even
higher residues can occur in the tops of root crops or vines/forage
parts.
Metabolism
In a preliminary study, the fate of (carbonyl-14C, methylthio-
3H) methiocarb was monitored in sandy loam and two silt loam soils
for 17 days (Church and Flint 1971). The pH of the soils varied from
5.4 to 6.4. Metabolism of methiocarb in these soils was quite similar,
and the average distribution of radioactivity at 17 days was
methiocarb, 81%, methiocarb sulphoxide, 15%; ethereal sulphate of
methiocarb sulphoxide phenol, 1% and unknown, 3%. Based on sampling
dates of 2, 7 and 17 days, the estimated half-life for methiocarb was
< 20 days for each of the soils tested.
A second study of longer duration (6 weeks) was conducted with
(carbonyl-14C)-methiocarb in three soils having alkaline pH (loamy
sand, loam and sandy clay loam) and three soils having acidic pH (all
loams) (Starr and Cunningham 1973). The half-life of methiocarb was
<14 days in the alkaline soils and <50 days in the acidic soils.
Hydrolysis of the parent carbamate appeared to be the primary route of
degradation in the alkaline soils, while oxidation of methiocarb to
methiocarb sulphoxide followed by hydrolysis of the sulphoxide to the
corresponding phenol seemed to be the metabolic route in the acidic
soils.
A third study was conducted with (ring-l-14C)-methiocarb in
sandy loam (Stanley and Flint 1974). Although the soil was very
slightly alkaline, the half-life of methiocarb was approximately 28
days. Over a 16-week period, methiocarb was oxidized to its sulphoxide
phenol. Soil-bound methiocarb-related residues increased over time,
but they did not exceed 10% in the 16-week investigation. No unknown
accounted for >10% in the applied radioactivity.
Behaviour in soil micro-organisms
Selected soil bacteria and fungi were individually incubated for
14 days at 30°C in a nutrient broth containing (ring-l-14C)-
methiocarb (Strankowski 1978). These studies indicate that soil micro-
organisms are capable of metabolizing methiocarb by hydrolysis,
oxidation, hydroxylation and conjugation. The major degradation
products detected were methiocarb sulphoxide, methiocarb sulphoxide
phenol and N-hydroxyl methyl methiocarb.
In water
Solubility
The solubility of methiocarb in distilled water at 20°C was
reported by the manufacturer to be 10 ppm, although the documentation
(Stanley and Parker 1981) was not provided.
Octanol/water partition
The octanol/water partition co-efficient for methiocarb was
determined at 20°C with an octanol to water volume ratio of 1:44
(Stanley and Parker 1981). The partition coefficient (K) was 915.
Again, the documentation was not provided.
Hydrolysis
The stability of methiocarb in buffered solutions from pH's of
5 to 9 have been studied (Church 1970; Saakvitne et al 1981).
Half-lives varied from 40 to 321 days at pH 5, 6h to 24 days at pH 7
and 0.2 days to instantaneous hydrolysis at pH 9. There was a direct
relationship between temperature and hydrolysis at a given pH.
Stability in pond or river water was also investigated
(Eichelberger and Lichtenberg 1971; Minor and Atwell 1979; Flint and
Shaw 1974). The half-life varied from less than 3 to 14 days,
depending on conditions. The principal route was hydrolysis to the
phenol which then decreased while methiocarb sulphoxide phenol
increased (63% of radioactivity at 14 days in one study).
Aquatic metabolism
(Ring-l-14C)-methiocarb was applied at 2 ppm to a pond
water/sediment system. The half-life of methiocarb was less than three
days (Minor and Atwell 1979). In this anaerobic aquatic environment,
methiocarb decreased to <1% of the total radioactivity in the pond
water and to 5% in the sediment extracts within 21 days. Methiocarb
degradation in a water/sediment system involves hydrolysis of the
carbamate to yield methiocarb phenol and subsequent formation of
sediment-bound components.
Fish accumulation
Bluegill were continuously exposed to (ring-l-14C)-methiocarb at
a concentration of 10 ppb for 34 days (Lamb 1974). The fish reached an
equilibrium with their surroundings at approximately 0.7 ppm at about
7 days after exposure. These residues were reduced to 0.07 ppm within
7 days on transfer of the blue-gill to uncontaminated water. Over 60%
of the radioactivity was unextractable and therefore unidentified. Of
the extracted residues, identified compounds were methiocarb 3%, its
sulphoxide 6%, its sulphone 8%, methiocarb phenol sulphoxide 17%,
methiocarb phenol sulphone 35% and unknown 31%. Methiocarb, methiocarb
sulphoxide and methiocarb sulphone accounted for only 6% of the whole-
body radioactive residues and did not accumulate in the fish.
In storage and processing
The effects of 0 to 109 F storage of over 20 food or feed items
(most fortified separately with 1.0 mg/kg methiocarb, its sulphoxide
and sulphone) were studied (Mobay 1981). This is of particular
importance, as the interval from harvest to analysis for much of the
residue data submitted to the Meeting was 6 to 18 months. The storage
interval in the investigation ranged from 57 to 805 days and over-all
decomposition averaged approximately 17%. Average decomposition can be
substantial in some individual commodities - strawberry 47% (643
days), grape 32% (807 days), rice grain 32% (95 to 365 days), lettuce
28% (804 days), fish (edible part) 24% (93 to 204 days), brassica
leafy vegetables 22% (804 to 805 days).
Processing of apples with field-incurred methiocarb residues of
1.6 ppm resulted in residues of 3.3, 0.7 and 2 ppm respectively in wet
pomace, dry pomace and juice respectively (Table 7). As a percent of
original fruit residue, the values were 77, 68 and 2 in the juice, wet
pomace and dry pomace respectively. Therefore, there is an approximate
2X concentration from the fruit to wet pomace.
Grape juice had approximately the same residue and wine 0.4 to
0.7X that of the grape with field-incurred residues from which they
were processed (Table 7).
Photodecomposition
The degradation of (ring-l-14C)-methiocarb on glass, silica gel
and soil surfaces and in aqueous solution under artificial ultraviolet
light was investigated (Houseworth and Tweedy 1974). The half-life of
methiocarb was <2 h on glass and in water, <4 h on silica gel, and
<16 h in soil. There was no evidence for volatile degradation
products. Major degradation products were sulphoxide, sulphones and
more polar materials.
METHODS OF RESIDUE ANALYSIS
Numerous analytical methods have been developed for the
determination of residues of methiocarb and its metabolites in a
variety of crops and animal products. Although each is unique, the
approaches have certain similarities. Typically, chopped or ground
samples are blended (or seeped) with a variety of solvents, filtered,
purified by partitions and/or chromatographic columns, derivatized (or
hydrolysed to the sulphone then derivatized) and determined on methyl
silcone gas chromatographic columns. Determination is usually by a
flame photometric detector.
Chopped and buffered apples and pears were extracted with acetone
and the sulphide sulphoxides and sulphones of methiocarb separated
on silica, further separated into the carbamate and phenols on an
alumina column, the carbamates hydrolysed to their phenols and all
underivatized phenols analysed on a flame photometric detector (FPD)
(Bowman and Beroza 1969). Recoveries compared favourably with Soxhlet
extraction and were 68 to 108% at 0.1 to 5 mg/kg fortification levels
for the five compounds, and a sensitivity of 0.01 mg/kg was claimed.
Thornton (1969) also used acetone for the extraction of
methiocarb and its sulphoxide and sulphone from apples and pears,
followed by a NH4Cl:H3PO4 precipitation step, oxidation to the
sulphone with KMnO4, overnight silylation and determination by FPD.
Recoveries of 58 to 117% were attained at 0.05 to 0.5 mg/kg
fortification levels and a sensitivity of 0.04 mg/kg claimed. This
method was validated by the US Environmental Protection Agency down to
0.03 mg/kg for methiocarb and its sulphoxide respectively in maize
grain with recoveries of 108 and 106%.
The same basic procedure was used to analyse a variety of plant
and animal tissues (Thornton and Drager 1973). Modifications were made
for animal products and high-fat products, including a florosil column
clean-up step. Recoveries were similar, with a sensitivity (accurately
measurable) of 0.03 mg/kg achieved, and a 0.01 mg/kg limit of
detection. The limits were approximately 10X better for milk. This
method was validated in US Environmental Protection Agency
laboratories down to 0.01 mg/kg for milk, except that a hydrolysis
step was added. Recoveries were > 80% when a 1% mineral oil in
benzene keeper solution (8 drops) was added before concentration of
the chloroform solutions after hydrolysis and oxidation.
A similar approach, using CH3CN extraction, the precipitating
step, and for the first time a specific hydrolysis step to hydrolyse
the sulphone to the phenol, was used on a variety of commodities
(Strankowski and Stanley 1975). This is again followed by silylation,
which does not require overnight silylation, with the hydrolysis step
included and analysis by FPD. As in the earlier versions, the
individual carbamates could be determined separately, if the oxidation
step is omitted. It is included for analytical convenience. Recoveries
for all three compounds were 70 to 112% at 0.05 to 0.1 mg/kg
fortification levels and an analytical sensitivity of 0.01 mg/kg was
claimed. This method is of particular importance as it is used for the
analysis of well over half of the commodities for which analytical
residue data were provided to the Meeting. A similar method was used
for the determination of methiocarb residues in poultry and eggs
(Strankowski 1976a). Modifications improved the latter method and made
it suitable for the determination of the N-hydroxy sulphoxide and
sulphone metabolites, as well as methiocarb and its sulphoxide and
sulphone (Delphia and Stanley 1980).
Acetone or CH3CN extraction of peaches and cherries was followed
by a precipation step, hydrolysis to the phenols and silylation
(without the oxidation step) to determine methiocarb and its
sulphoxide and sulphone separately by FPD (Stanley 1976). Recoveries
were 56 to 110% at 0.05 to 0.1 mg/kg fortification levels and
sensitivity of 0.03 mg/kg.
Blueberries were extracted with buffered acetone, partitioned
with CHCl3, cleaned up on a silica gel column and derivatized with
trifluoroacetic anhydride for the separate determination of the
respective trifluoroacetyl derivatives of methiocarb and its
sulphoxide and sulphone (Greenhalgh et al 1977). Recoveries were
> 94% at 0.1 and 0.3 mg/kg fortifications with methiocarb, its
sulphoxide and sulphone respectively. The sensitivity was given as
1.3, 2.3 and 5.8×10⁻¹¹ g/sec of methiocarb, its sulphoxide and
sulphone respectively.
Maitlen (1981) modified Thornton's procedure by steeping of
chopped commodities (five) with 1:3 acetone:CH2Cl2, to minimize
emulsions, and oxidized methiocarb and its sulphoxide with peroxide
and acetic acid before hydrolysing the sulphone to its phenol and
derivatizing with methanesulphonyl chloride followed by a florosil
column clean-up. The modification of the oxidation step minimizes
problems with impurities in acetone experienced by earlier
investigators. Although only the mesylated sulphone phenol is
determined, recoveries of methiocarb, its sulphoxide and sulphone were
67 to 129% from 0.05 to 3 mg/kg fortifications. Little difficulty was
required to attain a 0.05 lower limit of detection (the chromatograms
suggest this could be a limit of determination, although it was not so
validated).
An extraction procedure using 1:1 CHCl3:methanol (Morris 1976)
and an analytical procedure using the familiar precipation, oxidation,
silylation techniques and FPD detection was developed (Norris and
Olson 1973). Recoveries were > 80% at 0.5 mg/kg fortifications in
four soils with a 0.13 mg/kg sensitivity.
Methiocarb may also be determined by HPLC multi-residue methods
(Krause 1980) or by electron capture gas chromatography after
hydrolysis and derivatization with pentafluorobenzyl bromide (Coburn
et al 1975).
Because other pesticides registered on the same commodities can
interfere with the analysis of methiocarb, confirmatory methods using
QF-1 (Thornton 1970a) and OV-17 (Thornton 1970b) instead of the less
polar methyl silcone gas chromatographic liquid phases have been
developed. Interference studies of various pesticides in several crops
have been conducted (Olson 1970; Olson 1971; Thornton 1969b;
Strankowski 1976; Morris and Strankowski 1978). Potential interfering
pesticides can be malathion, methyl parathion, dioxathion, ronnel,
thiono systox, phorate, thimet and prometryne. All but the first two
may be separated from methiocarb sulphone derivatives by QF-1 phases.
The first two may be separated using OV-17 (Thornton 1969a).
NATIONAL MAXIMUM RESIDUE LIMITS
National maximum residue limits (MRLs) were reported to the
Meeting by several countries and are summarized in Table 11.
TABLE 11. National maximum residue limits reported to the Meeting
Pre-harvest
Country Crop/Commodity interval MRL
(days) (mg/kg)
Argentina Pome fruit 21
Stone fruit 21
Australia Orchards 7
Berry crops 7
Vegetable crops 7
Field crops 7
Pastures 7
Gardens 7
Cherry 7 15
Grape 7 25
Orange 1 5
Belgium Ornamentals only 7
Bulgaria General 21
Czechoslovakia Hops 35
Ornamentals 7
Denmark Food crops 7
Pastures 7
Federal Republic Head cabbage 14 0.1 *
of Germany Red cabbage 14 0.1 *
Cauliflower 14 0.1 *
Spinach 14 0.1 *
Lettuce (also under glass) 14 1.0 *
Small fruit (berries) 28 0.1 *
Pome fruit 14 0.2 *
Stone fruit 28 0.1 *
TABLE 11. (con't)
Pre-harvest
Country Crop/Commodity interval MRL
(days) (mg/kg)
Strawberry 14 0.1 *
Cereals 28 0.1 *
Potato 14 0.1 *
Sugarbeet 28 0.1 *
Fodder beet 28 0.1 *
Clover 28
Lucerne 28
Lupines 28
Hops 21
France Potato 15
German Fruit 14
Democratic Leafy vegetables 14
Republic Stem vegetables 14
Brassices 14
Root vegetables 14
Fruiting vegetables 4
Hungary Maize 0.1
Israel Vegetables 30
Beet 30
Citrus fruit 30
Fruit 30
Grape 30
Artichoke 30
Italy Fruit 21 0.05
Vegetables 21 0.05
Sugarbeet 21 0.05
Cereals 21 0.05
Mexico Peach 21
New Zealand Pastures 21
Norway General 7
TABLE 11. (con't)
Pre-harvest
Country Crop/Commodity interval MRL
(days) (mg/kg)
Poland Fruit 42
Vegetables 42
Pulse crops 42
Root crops 42
Other crops 42
Portugal General 21
New Zealand Cereals 10
Grape 3
Stone fruit 7
Blueberry 25 (under consideration)
South Africa Apple 14 0.2
Pear 14 0.2
Apricot 14 0.2
Plum 0.2
Table grape 14 0.2
Wine grape 28 - 42 0.2
(according to
variety)
Spain Pastures 15
Cotton 21
Hops 21
Hazelnut 21
United Kingdom Cereals 7
Potato 7
Brassicas 7
Sugarbeet 7
Pea 7
USA Citrus fruit 0.02
Maize, fodder and forage 0.03
Maize, fresh, includes 0.03
sweet corn (kernels plus
cobs)
Maize, grain, field and 0.03
TABLE 11. (con't)
Pre-harvest
Country Crop/Commodity interval MRL
(days) (mg/kg)
popcorn
Peach 21 15
Blueberry 0 25
Cherry 7 25
Venezuela Rice 21 1
* Proposed.
EVALUATION
COMMENTS AND APPRAISAL
Methiocarb has a relatively high acute oral toxicity in the rat
(LD50 13 to 47 mg/kg bw) and dog (LD50 10 to 25 mg/kg bw) and
exhibits a rapid, reversible toxic action characteristic of a
carbamate. There are no marked differences in the sensitivity of the
tested animal species or the sexes.
Metabolites formed in the experimental animal species tested are
of slight toxicity, with the exception of methiocarb sulphoxide, which
has a higher acute toxicity than the parent compound.
Potentiation tests by the I.P. routes with a number of other
anticholinesterase compounds did not result in more than additive
effects. Atropine sulphate proved to be a very effective antidote in
cases of methiocarb poisoning.
Neurotoxicity, embryotoxicity, teratogenicity, multigeneration
reproduction and mutagenicity tests did not indicate any observable
adverse effects due to methiocarb.
Short-term rat, hen, rabbit, dog and cattle studies and long-term
rat studies were performed with methiocarb.
Methiocarb did not have a carcinogenic effect, and in two-year
feeding experiments on dogs and rats no-effect levels were determined.
Methiocarb is widely used around the world, either as a seed
treatment, spray or bait for the control of a variety of pests. The
most important uses are as a bait treatment for control of slugs and
snails and as a bird repellent, either as a spray or seed treatment.
Residue data were available for a wide range of food crops,
representing good agricultural practices. They were not adequate for
the estimation of maximum residue levels for artichokes, barley,
potatoes, rape, wild rice and spinach, but were adequate for the
estimation of maximum residue levels on several commodities when
residues resulted from seed or spray treatments.
In the case of bait treatments, most of the available residue
data were the result of broadcast treatments. The Meeting was aware
that methiocarb is widely used in this manner. However, the Meeting
concluded that information on good agricultural practices using
broadcast bait applications were inadequate to permit estimation of
full maximum residue levels, but the Meeting was able to estimate
temporary maximum residue levels. In estimating these temporary
residue levels, the Meeting was aware, and the data indicate, that on
occasion residue levels on the various commodities so treated may
exceed the estimated residue levels. The Meeting was of the opinion
that these occasional high residues result from the presence of actual
bait pellets or fragments thereof, or contamination, which will be
dislodged by normal handling procedures before consumption.
Methiocarb is relatively stable for lengthy periods under acidic
conditions and hydrolyses rapidly under alkaline conditions. The
degradation rate is increased with temperature.
Methiocarb is readily metabolized or degraded in the environment
by plants, animals and microorganisms. Hydrolysis of the carbamate to
the phenol, oxidation of the sulphide to the sulphoxide and
subsequently to the sulphone, often followed by conjugation, are the
basic chemical changes that occur. The relative order and extent of
each varies with the conditions of each particular situation.
In animals, (ring-l-14C)-methiocarb radioactivity is rapidly
eliminated in the urine (96% of administered within 144 h in the cow)
with low levels in the faeces and milk. Conjugated phenols accounted
for 85% of urine radioactivity. Most of the organosoluble radioactive
residue in milk was unidentified, only methiocarb sulphoxide being
positively identified. The greater part of the milk radioactivity was
in the form of conjugated methiocarb sulphoxide and sulphone phenols.
In cow liver and kidney, methiocarb phenol was the principal
residue, with lesser amounts of the sulphoxide and sulphone phenols
and even less of other moieties. Methiocarb was found at appreciable
levels only in the liver. In cow feeding studies mean residues in
kidney and liver were greater than the 0.05 mg/kg method sensitivity
only at the 100 ppm feeding level. In milk, measurable residues (mean)
were found at both the 30 and 100 mg/kg feeding levels at 0.014 and
0.03 mg/kg respectively.
Excretion and metabolism in poultry was in many respects similar
to that of the cow, although measurable and identifiable residues were
found in most tissues of poultry, whereas residues were sufficient for
characterization only in liver and kidney of the cow. A primary
difference between the cow and poultry is less methiocarb phenol in
liver and kidney of poultry and higher over-all radioactive
equivalents in poultry tissues. Analytically significant levels of
N-hydroxymethyl methiocarb were also found in chicken tissues
(organosoluble and/or conjugated) but apparently not tested in cow
tissues.
In poultry feeding studies, except for skin at the highest
feeding level, residues were found only in the giblets and were 0.02,
0.06, 0.13 and 0.13 mg/kg from lowest to highest feeding levels.
Residue data on individual tissues were not provided. Neither is it
clear whether the N-hydroxymethyl methiocarb residues would have been
measured. In eggs, residues were greater than the 0.02 mg/kg method
sensitivity only at the highest feeding level.
Residues in crops at levels estimated from recommended or
approved practices examined by the Meeting would not be expected to
result in analytically significant residue in animal meat tissues,
eggs or milk.
When methiocarb is applied to soil, it is rapidly taken up by
plants and translocated throughout. Different studies show that
residues can penetrate plants from surface treatments. Studies show
that shortly after treatment, residues in plants are largely
organosoluble and predominantly methiocarb sulphoxide, methiocarb and
methiocarb sulphoxide phenol. As time from treatment increases
organosoluble residues decrease while conjugated aqueous soluble
residues (primarily conjugated methiocarb sulphoxide phenol and
methiocarb phenol) increase. The degree varies with the plant. There
may be low levels of N-hydroxymethyl methiocarb sulphoxide and other
moieties. In some commodities, (e.g. cabbage and lettuce) there is
evidence that residues increase for a period after last application.
In soils, methiocarb desorption is proportional to the amount
adsorbed and has relatively low mobility compared to other pesticides.
Studies show leaching to be inversely related to organic content of
the soil, although methiocarb does not appear to have a strong
propensity for leaching. Persistence in soil varies with soil type and
pH, with a half-life of 6 to 64 days, depending on conditions. Studies
indicate some potential for low level residues in mature rotational
crops grown in soils previously treated, especially for legumes and
root crops, and substantially higher residues in vines and forage
(leaf parts). Residues will accumulate in fish from water containing
10 ppb levels of methiocarb, but rapidly decrease when they are
returned to uncontaminated water.
On topically treated apples, residues are primarily surface ones,
which were found to be mostly methiocarb with some sulphoxide. As in
other plants, water soluble residues increased with time in the peel
and pulp, while there was some decrease in surface organosoluble
residues.
Only a limited amount of information is available on the effects
of processing on residues of methiocarb foods and none on residues in
commerce or at consumption.
Decomposition of methiocarb residues on commodities under
prolonged storage conditions does occur, averaging approximately 17%
over all commodities and over 30% on some commodities. Because many of
the samples analysed for field-incurred residues were stored for
periods up to 18 months before analysis, the resulting actual residues
at sampling can reasonably be expected to have been somewhat higher
than recorded. This was taken into account when limits were estimated.
Numerous methods have been developed for the determination of
methiocarb residues in a variety of crops and foods. Typically,
residues are extracted with an organic solvent, cleaned up by
partitioning and/or column chromatography, methiocarb residues
oxidized to the sulphone, hydrolysed to the phenol, derivatized and
analysed on gas chromatography using a flame photometric detector.
Total residues are typically measured as the sulphone phenol
derivative for analytical convenience, although methiocarb, its
sulphoxide and sulphone phenol derivatives can be determined
separately if the oxidation step is omitted. Several of the methods
are probably suitable for enforcement, as they are all remarkably
similar. The methods of Thornton (1969 a,b) and Thornton and Drager
(1973) are preferred methods as they are published, have been tested
on several commodities and have been validated. The method of
Strankowski and Stanley (1925), although presumably unpublished,
should also receive special consideration as it was the basis of much
of the residue data provided. The method of Bowman and Beroza (1969)
is probably too long for routine enforcement but does offer an
approach for a more detailed characterization of individual residues,
The method of Maitlen (1981) shows promise, although it is relatively
new and perhaps has not been used to the same extent as other ones.
Confirmatory gas chromatographic methods are available to eliminate
pesticides interfering with methiocarb analysis.
Level causing no toxicological effect
Rat: 25 ppm in the diet equivalent to 1.3 mg/kg bw/day
Dog: 5 ppm in the diet equivalent to 0.125 mg/kg bw/day
Estimation of acceptable daily intake for man
0 - 0.001 mg/kg bw
RECOMMENDATIONS OF RESIDUE LIMITS
The Meeting examined residue data from residue trials reflecting
the basic uses for the control of slugs and snails or bird repellency.
For those crops treated by spray applications or as seed treatments,
the Meeting was able to estimate maximum residue levels likely to
occur when methiocarb is used in accordance with approved agricultural
practice and at the specified intervals between last application and
harvest. For those crops treated by bait applications the Meeting was
able to estimate temporary maximum residue levels, pending additional
information on good agricultural practices. The levels refer to the
sum of methiocarb, its sulphoxide and sulphone.
Commodity Estimated Pre-harvest interval and/or
Maximum Residue uses on which recommendations
levels (mg/kg) are based (days)
Seed treatments
Maize 0.05 -1
Rice 0.5 -
Sugarbeets 0.02 -
Spray
Apple 10 21
Blueberry 25 0
Cherry 10 7
Currant, red 5 21
Grape 5 7
Peach 15 21
Plum 1 21
Strawberry 0.02 14
Commodity Estimated Pre-harvest interval and/or
Maximum Residue uses on which recommendations
level3 (mg/kg) are based (days)
Bait
Beans, snap 0.2 7 (broadcast)
Beans, lima 0.2 7 (broadcast)
Broccoli 0.2 7 (broadcast)
Brussels sprout 0.2 7 (broadcast)
Cabbage 0.2 7 (broadcast)2
Cauliflower 0.2 7 (broadcast)2
Maize, sweet corn 0.05 0 (broadcast)
Citrus 0.02 30 (broadcast)
Lettuce 0.2 7 (broadcast)2
Tomato 0.2 7 (broadcast)
1 Data were also available from topical treatments;
2 Data were also available from spray treatments;
3 Pending additional information on good agricultural practices
(see further work required).
FURTHER WORK OR INFORMATION
Required (by 1983)
Information on good agricultural practice for commodities on
which bait applications are recommended/used.
Desirable
1. If future uses on animal feed items could result in potential
residues in meat, milk, poultry and eggs, additional metabolism and
residue data will be necessary. This would include (a) additional
residue data on the pertinent animal feed items, (b) identification of
radioactive residues observed in the organosoluble milk fractions, (c)
from feeding studies, analysis of ruminant liver and kidney tissues
for N-hydroxymethyl methiocarb, (d) from poultry feeding studies,
residue data from individual giblets and analysis of giblets and
muscle tissues for N-hydroxymethyl methiocarb.
2. Information on levels of methiocarb residues in foods at commerce
or at consumption. (this is an example of a selective survey, para
2.10, 1979 JMPR Report).
3. Observations in man.
REFERENCES
Atwell, S.H. and Murphy, J.J. Soil adsorption and desorption of (14C)
1978 Mesurol. Mobay Ag. Chemical Report no. 66145, 10 May 1978.
(Unpublished)
Bayer. Mercaptodimethur (methiocarb) monographs prepared for FAO/WHO.
1981 Report submitted by Bayer, AG, September 1981. (Unpublished)
Bell, R.L. The metabolic fate in vivo of Mesurol (3,5.dimethyl-4
1974 (methylthio) phenol methylcarbamate) in dogs. Mobay Ag.
Chem. Report no. 39243, 11 January 1974. (Unpublished)
Bowman, M.C. and Beroza, M. Determination of Mesurol and five of its
1969 metabolites in apple, pear, and corn by gas chromatography.
Journal of the Association of Official Analytical Chemists,
52:1054-1063.
Church, D.D. BAY 37344 - runoff, leaching, and water stability. Mobay
1970 Ag Chem Report no.26894, 13 February 1970. (Unpublished)
Church, D.D. and Flint, D.R. The fate of Mesurol (4-(methylthio)-3,5
1971 xylyl methylcarbamate) in soil. Mobay Ag Chem Report no.
29591, 23 February 1971. (Unpublished)
Coburn, J.A., Ripley, B.D. and Chan, A.S.Y. Analysis of pesticide
1976 residues by chemical derivatization. II. N-Methylcarbamates
in natural water and soils. Journal of the Association of
Official Analytical Chemists, 59: 188-196.
Crawford, C.R. and Anderson, R.G. The skin and eye irritating
1970 properties of BAY 37344 technical to rabbits. 15 October,
report no. 28304, Mobay Chemical Corp., USA submitted by
Bayer AG. (Unpublished)
1972a The acute oral toxicity to guinea pigs and the acute
inhalation toxicity to rats of Mesurol technical, 24
January. Report no. 31987, Chemagro Division of Baychem
Corp. submitted by Bayer AG. (Unpublished)
1972b The dermal toxicity of Mesurol technical and Mesurol 75%
wettable powder to rabbits, 21 August. Report no. 34477,
Chemagro Division of Baychem Corp., submitted by Bayer AG.
(Unpublished)
Delphia, L.M. and Stanley, C.W. A gas chromatographic method for the
1980 determination of combined residues of (R)Mesurol and five of
its metabolites in poultry tissues and eggs. Mobay report
68642, 13 February 1980. (Unpublished)
Doull, J., Cowan, J. and Root, M. Subacute (16-week) oral toxicity of
1962 Bayer 37344 to male and female rats, 12 June. Report no.
9456, University of Chicago, Dept. of Pharmacology,
submitted by Bayer AG. (Unpublished)
Doull, J., Root, M. and Meskauskas, J. Chronic oral toxicity of Bay
1967 37344 to rats, 15 December. Report no. 21791, University of
Chicago, Toxicity Laboratory, submitted by Bayer AG.
(Unpublished)
1968 Chronic oral toxicity of Bay 37344 to male and female dogs,
1 February. Report no. 22115, University of Chicago,
Toxicity Laboratory, submitted by Bayer AG. (Unpublished)
DuBois, K.P. The acute oral toxicity of Bayer 37344 to chickens, 16
1962 May. Report no.9248, University of Chicago, Department of
Pharmacology, submitted by Bayer AG. (Unpublished)
1964 The acute toxicity of some possible metabolites of Bayer
37344, 22 January. Report no. 12806, University of Chicago,
Department of Pharmacology, submitted by Bayer AG.
(Unpublished)
DuBois, K.P. and Raymund, A.B. The acute toxicity of Bayer 37344 to
1961a mammals, 25 April. Report no. 6775, University of Chicago,
Department of Pharmacology, submitted by Bayer AG.
(Unpublished)
1961b The acute toxicity of Bayer 37344 in combination with other
anticholinesterase insecticides, 1 November. Report no.
7880, University of Chicago, Department of Pharmacology,
submitted by Bayer AG. (Unpublished)
1961c The acute toxicity of Bayer 39007 and Bayer 37344 in
combination with some other anticholinesterase insecticides
to Rats, 4 November. Report no. 7879, University of Chicago,
Department of Pharmacology, submitted by Bayer AG.
(Unpublished)
DuBois, K.P. and Raymund, A.B. The acute toxicity of recrystallized
1962 Bayer 37344 and a wettable powder of Bayer 37344 to female
rats, 12 June. Report no. 9424, University of Chicago,
Department of Pharmacology, submitted by Bayer AG.
(Unpublished)
Eben, A. and Kimmerle, G. Mercaptodimethur - effect of acute and
1973 subacute oral doses on acetylcholinesterase activity in
plasma, erythrocytes and brain of rats, 9 November. Report
no 4284, Bayer AG, Institut fur Toxikologie, submitted by
Bayer AG. (Unpublished)
Eichelberger, J.W. and Lichtenberg, J.J. Persistence of pesticides in
1971 river water. Environmental Science and Technology,
5:541-544.
Ernst, G.F., Saskia, J.R., Gwan, H.T. and Jansen, J.T.A. Thin layer
1975 chromatographic detection and indirect gas chromatographic
determination of three carbamate pesticides. Journal of the
Association of Official Analytical Chemists, 58:1015-1019.
Flint, D.R. and Shaw, H.R. II. The mobility of Mesurol residues in
1974 soil runoff water and the degradation of Mesurol-14C in
pond water. Mobay Ag Chem Report no.39258, 30 January.
(Unpublished)
Greenhalgh, R., Wood, C. and Pearce, P.A. A rapid GC method of
1977 monitoring Mesurol (4-(methylthio)-3.5-xylyl-N-methyl
carbamate) and its sulphoxide and sulphone metabolites and
their persistence in low bush blueberries. Journal of
Environmental Science and Health, B 12(4):229-244.
Gronberg, R.R. and Everett, L.J. The metabolic fate of 4-(methylthio
1964 3,5-xylyl methylcarbamate (BAY 37344 sulphoxide) and
4-(methylsulphonyl)-3,5-xylyl methylcarbamate (BAY 37344
sulphone) in white rats, Mobay Ag Chem Report no. 26819,
submitted by Mobay Chemical Corp.(Unpublished)
Guerzoni, M.E. and DelCupola, L. Attivitá mutagenica degli
1976 antiparassitari, S-TANU,6(3):161-165.
Herbold, B. H321 (active ingredient of Mesurol) Salmonella/microsome
1978 test for determination of point mutations, 6 December.
Report no. 7978, Bayer AG, Institut für Toxikologie,
submitted by Bayer AG. (Unpublished)
1979a H321 - dominant lethal study on male mouse to test for
mutagenic effects, 23 May. Report no. 8395, Bayer AG,
Institut für Toxikologie, submitted by Bayer AG.
(Unpublished)
1979b H321 (active ingredient of Mesurol) micronucleus test for
mutagenic effect on mice, 8 June. Report no. 8426, Bayer
AG,Institut für Toxikologie, submitted by Bayer AG.
(Unpublished)
Hoffman, K. and Schilde, B. H321 (mesurol-Workstoff, Mercaptodimethur)
1980 Chronischer Toxizitätsversuch an Hunden bei Verabreichung im
Futter (2 Jahre - Fütterungs-versuch), 12 Dez. Bericht Nr.
9626, Bayer AG, Institut für Toxikologie, submitted by Bayer
AG. (Unpublished)
Houseworth, L.D. and Tweedy, B.G. Parent leaching studies for
1974 MesurolR. Mobay Ag. Chem Report no. 40568, 21 March 1974.
(Unpublished)
Ives, M. Demyelination study in chickens/Bayer 37344, 16 April. Report
1965 no.16063, Wedge's Creek Research Farm, Inc., Subsidiary of
Industrial Bio-Test Lab., Inc., Biological Evaluations, USA,
submitted by Bayer AG. (Unpublished)
Kraus, R.T. Multi-residue method for N-methyl carbamate pesticides in
1980 crops using HPLC. Journal of the Association of Official
Analytical Chemists, 63:1114-1124.
Kimmerle, G. Product Dr. Wedemeyer II 321 (E 37 344) Production no.
1960 2410, 25 March, Bayer AG, Toxicological and Industrial
Hygiene Laboratory, report submitted by Bayer AG.
(Unpublished)
1966a Mesurol active ingredient (Wedemeyer H321; Ht. no. 3657)
antidotal effect - translation - 8 August. Report no. 34267,
Bayer AG, Institut für Toxikologie, submitted by Bayer AG.
(Unpublished)
1966b Wirkstoff Wedemeyer H 321 (Ht.-Nr. 3657)
Inhalationsversuche, Dez.7. Bayer AG, Institut für
Toxikologie, report submitted by Bayer AG. (Unpublished)
1969a Bay 37344 (subacute dermal toxicity study on rabbits, 1
April. Report no.1291, Bayer AG, Institut für Toxikologie,
submitted by Bayer AG. (Unpublished)
1969b Bay 37344(=H 321) Lo-Nr.691, 20 May. Bayer AG, Institut für
Toxikologie, report submitted by Bayer AG. (Unpublished)
1971 Comparison of the antidotal actions of tetraethylammonium
chloride and atropine in acute poisoning of carbamate
insecticides in rats, 9 January. Archives of Toxicology,
27:311-314.
Krötlinger, F., Löser, E. and Voge, O. H 321 (Mercaptodimethur)
1981 Akarizide, toxikologische Untersuchungen an Ratten. Br.
10039 v. 2.7.81, report submitted by Bayer AG to WHO.
(Unpublished)
Lamb, D.W. Accumulation and persistence of residues in bluegill fish
1974 exposed to Mesurol-14C. Mobay Ag Chem Report no. 40096, 8
March 1974. (Unpublished)
Lamb, D.W. and Matzkanin, C.S. The acute oral toxicities of Mesurol
1975 technical to dogs, 25 August. Report no. 45074, Mobay
Chemical Corp., Agr. Division, submitted by Bayer AG.
(Unpublished)
1976a The acute oral toxicities of mesurol technical and Mesurol
sulphoxide, 12 July. Report no. 49541, Mobay Chemical Corp.,
Agr. Division, submitted by Bayer AG. (Unpublished)
1976b The acute oral toxicities of Mesurol technical and Mesurol
sulphoxide, 19 August. Report no. 50541, Mobay Chemical
Corp., Agr. Division, Submitted by Bayer AG. (Unpublished)
Löser, E. Bay 37344/Blut-, hart- und Klinisch-Chemische Untersuchungen
1969 nach oraler applikationan Ratten, 3 March, Bericht Nr. 1358,
Bayer AG, Institut für Toxikologie, report submitted by
Bayer AG. (Unpublished)
Löser, E. Bay 37344/Generation studies on rats, 10 July. Report no.
1970 2208, Bayer AG, Institut für Toxikologie, submitted by Bayer
AG, Addenda: Histopathology - Huntingdon Research Centre,
Huntingdon, England. (Unpublished)
Lorke, D. Mesurol active ingredient (Bay 37344) studies on rats for
1971 embryotoxic and teratogenic effects, 30 November. Report no.
3133, Bayer AG, Institut für Toxikologie, submitted by Bayer
AG. (Unpublished)
Maitlen, J.C. Gas-liquid chromatographic determination of residues of
1981 methiocarb and its toxic metabolites with the flame
photometric detector after derivatization with
methanesulphonyl chloride. Journal of Agricultural and Food
Chemistry, 29:260-264.
Minor, R.G. and Atwell, S.H. Metabolic fate of Mesurol(R) in aerobic
1979 and anaerobic aquatic environments. Mobay Ag Chem Report no.
66775, 30 January 1979. (Unpublished)
Minor, R.G. and Murphy, J.J. Metabolism and excretion of Mesurol by a
1977a dairy cow, Mobay AG Chem Report no. 51144 (1977), submitted
by Mobay Chemical Corp. (Unpublished)
1977b Radioactive residues of (ring-l-14C)-Mesurol in a lactating
dairy cow. Mobay Ag Chem Report no. 51145 (1977) submitted
by Mobay Chemical Corp. (Unpublished)
Mobay Residues of Mesurol in bovine tissues and milk. Mobay Ag
1970 Chem Report 26848, 26 February, 1970 and Mobay Ag Chem
Report no. 26879, 3 March, 1970. (Unpublished)
Mobay Residues of Mesurol in soils. Mobay Ag Chem Report Nos.
1973 2680, and 26883, 3 March (Unpublished)
Mobay Residues of Mesurol in soils. Mobay Ag Chem Report nos.
1974 38948, 38949 and 38950, 30 November 1973. (Unpublished)
Mobay Residues of Mesurol in rotational crops. Mobay Ag. Chem
1977-81 Reports: 48847, April 5, 1978; 50430, August 3, 1978; 48865,
April 5, 1978; 50431, August 3 1978; 50382, April 17 1978;
53816, October 4, 1977; 50422 April 17 1978; 53855 October 4
1977; 53815 October 17 1977; 54055 October 4 1977; 53854
October 4 1977; 66805 April 4 1978; 66809 April 5 1978;
66806 April 5 1978; 66810 April 5 1978; 66807 April 5 1978;
66813 April 22 1978; 66808 April 5 1978; 66814 April 22
1978; 66821 April 5 1978; 66817 April 4 1978; 66822 July 13
1978.
66818 April 4 1978; 66823 July 13 1978; 66825 July 13 1978;
66824 July 13 1978; 66828 April 22 1978; 66831 April 27
1978; 66835 April 22 1978; 66832 April 27 1978; 66836 April
22 1978; 66833 April 27 1978; 49835 April 17 1978; 66834
April 27 1978; 45379 August 3 1978; 66839 August 3 1978;
45850 August 3 1978; 66840 August 3 1978; 46257 August 3
1978; 66841 August 3 1978; 46436 August 3 1978; 66842 August
3 1978; 49231 April 6 1978; 66843 January 5 1979; 49431
April 6 1978; 66843 January 5 1979 49456 August 3 1978;
66844 January 5 1979; 49591 August 3 1978; 66845 January 5
1979; 49693 April 17 1978; 66846 January 5 1979; 49835 1978;
69256 January 28 1981; 50335 April 17 1978; 69257 January 29
1981; 50423 August 3 1978; 69259 January 29 1981; 50429
August 3 1978; 69260 January 29 1981; 69261 January 29 1981;
69262 January 29 1981. (Unpublished)
Mobay Residues of Mesurol in soils. Mobay Ag Chem Reports: 66929, 26
1979-81 February 1979; 67052 26 February 1979; 69230 20 January
1981; 69231 20 January 1981; 69233 16 February 1981; 69234
19 January 1981; 69236 20 January 1981; 69239 21 January
1981. (Unpublished)
Mobay The effect of frozen storage at 0 to 10°F on Mesurol residues
1981 in crops, Mobay Ag Chem Reports: 49948 1976; 27072 March 19
1970; 51168 January 12 1977; 27081 March 30 1979; 66101 May
3 1978; 49580 January 21 1977; 67923 March 2 1979; 49729
September 20 1976; 68013 July 19 1979; 49947 November 1
1976; 68205 October 5 1979. (Unpublished)
Morgan, J.G. and Parton, K. Metabolism of Mesurol in apples. Mobay Ag
1974 Chem Report no. 40208, 1 April 1974. (Unpublished)
Morris, R.A. and Olson, T.J. Determination of Mesurol and metabolites
1973 in soil by flame photometric gas chromatography. Mobay
report no. 38319, 10 September 1973. (Unpublished)
Morris, R.A. and Strankowski, K.J. An interference study for the
1978 residue method for Mesurol on rice. Mobay report no. 66095,
12 June 1978. (Unpublished)
Murphy, J.J. and Morris, R.A. Residues of Mesurol in rotational crops.
1979 Mobay Chem Ag Report no. 66926, 1 February 1979.
(Unpublished)
Nelson, D.L. Acute oral toxicity of Mesurol technical and metabolites
1979 to rats, 27 June. Report no. 67815, Mobay Chemical Corp.,
submitted by Bayer AG. (Unpublished)
New Zealand, Information provided by the New Zealand Government, which
1981 also included undated documents: methiocarb as a bird
repellent in blueberries, P.T. Holland, D.W. McFarlane and
R.M. Bates, Proc. 33rd N.Z. Weed Pest Control Conference,
and, Further experiments with methiocarb on blueberries,
P.T. Holland, D.W. McFarlane and G. Lawn, Proc. 34th N.Z.
Weed and Pest Control Conference.
Olson, T.J. An interference study for Mesurol residue determinations
1970 on apple, pear, meat and milk. Mobay report no. 27080, 30
March 1970. (Unpublished)
Olson, T.J. Interference study for the residue method for Mesurol and
1971 its metabolites on corn. Mobay report no. 29412, 18 February
1971. (Unpublished)
Root, M., Doull, J. and Cowan, J. Determination of the safe dietary
1963 level of Bayer 37344 for dogs, 23 March. Report no. 11159,
University of Chicago, Department of Pharmacology, submitted
by Bayer AG. (Unpublished)
Saakvitne, J.A., Gustafson, D.E. and Wilkes, L.C. Mesurol hydrolysis
1981 in sterile buffers Mobay Ag Chem, 22 January 1981.
(Unpublished)
Solmecke, B. Akute oral Toxizität KLN 1584/1, April 6. Bayer AG,
1970a Institut für Toxikologie, report submitted by Bayer AG.
(Unpublished)
1970b Akute oral Toxizität KLN 1584/2, April 6. Bayer AG, Institut
für Toxikologie, report submitted by Bayer AG. (Unpublished)
1970c Akute oral Toxizität KLN 1584/3, April 6. Bayer AG, Institut
für Toxikologie, report submitted by Bayer AG. (Unpublished)
1970d Akute oral Toxizität KLN 1584/4, April 6. Bayer AG, Institut
für Toxikologie, report submitted by Bayer AG. (Unpublished)
1970e Akute oral Toxizität Mesurol-Phenol, 14 May. Bayer AG,
Institut für Toxikologie, report submitted by Bayer AG.
(Unpublished)
Stanley, C.W. Determination of residues of Mesurol and its toxic
1976 metabolites separately in peaches and cherries. Mobay report
no. 49727, 1 September 1976. (Unpublished)
Stanley, C.W. and Flint, D.R. The metabolic fate of Mesurol in sandy
1974 loam soil. Mobay Ag Chem Report 39429, 29 January 1974.
(Unpublished)
Stanley, C.W. and Johnson, G.A. II. Metabolites of Mesurol in rat
1976 urine. Mobay Ag Chem Report no. 50732, submitted by Mobay
Chemical Corp. (Unpublished)
Stanley, C.W., Kottman, R.F. and Bingman, K.J. Metabolism and
1979a excretion of Mesurol by poultry. Mobay Ag Chem Report no.
66777, submitted by Mobay Chemical Corp. (Unpublished)
1979b Radioactive residues of (14C)-Mesurol in poultry. Mobay Ag
chem Report no.66778, submitted by Mobay Chemical Corp.
(Unpublished)
Stanley, and Parker - cited by Manufacturer, but the document was not
1981 provided or identified.
Starr, R.I. and Cunningham, D.J. Metabolism of 14C-labelled methiocarb
1973 (4-methylthio)-3.4-xylyl methyl carbamate) in soil and
water. Mobay Ag Chem Report no. 38747. (Unpublished)
Strankowski, K.J. An interference study for the residue method for
1976a Mesurol in various crops. Mobay Report no. 49467, 1 July
1976. (Unpublished)
1976b Method for the determination of Mesurol and its toxic
metabolites in poultry and eggs. Mobay Report no. 49078, 29
January 1976. (Unpublished)
Strankowski, K.J. Microbial degradation of Mesurol. Mobay Ag Chem
1978 Report no. 66625, 19 October 1978. (Unpublished)
Strankowski, K.J. Metabolism of Mesurol in rice. Mobay Ag Chem Report
1979 no. 66776, 30 January 1979. (Unpublished)
Strankowski, K.J., Delphia, L.M. and Murphy, J.J. Cattle acceptance
1978 (palatability) of alfalfa pellets treated with Mesurol, 15
June. Report no. 66391, Mobay Chemical Corp., submitted by
Mobay Chemical Corp. (Unpublished)
Strankowski, K.J. and Minor, R.G. Effects of feeding Mesurol/Mesurol
1976 sulphoxide (9:1) to chickens for 28 days, 7 January. Report
no. 49639, Mobay Chemical Corp., Agr. Division, submitted by
Mobay Chemical Corp. (Unpublished)
Strankowski, K.J. and Murphy, J.J. Mesurol uptake and metabolism by
1981 lettuce and tomato plants. Mobay Ag Chem Report 50863, 12
November 1976. (Unpublished)
Strankowski, K.J. and Parker, G.D. (14C)-Mesurol rotational crop
1981 study. Mobay Ag Chem Report no. 69270, 10 February 1981.
(Unpublished)
Strankowski, K.J. and Stanley, C.W. Determination of residues of
1975 Mesurol and its toxic metabolites in crops. Mobay report no.
45089, 15 August 1975. (Unpublished)
Thornton, J.S. Determination of residues of BAY 37344 and metabolites
1969a in apples and pears by flame photometric gas chromatography.
Mobay Report no. 25168, 12 June 1969. Published as Method I
of the U.S. Food and Drug Administration Pesticide
Analytical Manual, Vol. II.
1969b An interference study for the residue methods for BAY 37344
and metabolites. Mobay report no. 26438, 18 December 1969.
(Unpublished)
Thornton, J.S. A confirmation procedure for the BAY 37344 residues
1970a methods. Mobay report no. 26964, 13 March 1979.
(Unpublished)
1970b A secondary confirmatory procedure for the Mesurol (BAY
37344) residue methods. Mobay report no. 27147, 9 April
1970. (Unpublished)
Thornton, J.S. and Drager, G. Determination of residues of Mesurol and
1973 its toxic metabolites in plant and animal tissues.
International Journal of Environmental Analytical Chemistry,
2:229-239.
Thornton, J.S., Hurley, J.B. and Obrist, J.J. Soil thin-layer mobility
1976 of twenty-four pesticide chemicals. Mobay Ag Chem Report no.
51016, 15 December 1976. (Unpublished)
Thyssen, J. Bestimmung der akuten Toxizität (LD50), 15 November. Bayer
1977a AG, Institut für Toxikologie, report submitted by Bayer AG.
(Unpublished)
1977b Bestimmung der akuten Toxizität (LD50), 30 November. Bayer
AG, Institut für Toxikologie, report submitted by Bayer AG.
(Unpublished)
Thyssen, J. and Schilde, B. H 321 (Mesurol active ingredient)
1978 neurotoxicity studies on hens, 20 June. Report no. 7637,
Bayer AG, Institut für Toxikologie, submitted by Bayer AG.
(Unpublished)
Tweedy, B.G. and Houseworth, L.D. Leaching of aged residues of Mesurol
1974 (ring-l-14C) in sandy loam soil. Mobay Ag. Chem Report no.
40568, 15 May 1974. (Unpublished)
Udall, N.D. The toxicity of the molluscicides metaldehyde and
1973 methiocarb to dogs. The Veterinary Record, 13 October 1973.
Waggoner, T.B. and Olson, T.J. Effect of feeding organophosphorus and
1971 carbamate pesticides to cattle. Chemagro Corp., 12-17
September, Paper no. 45, Division of Pesticide Chemistry,
162nd National ACS Meeting, Washington, submitted by Bayer
AG. (Unpublished)
Wheeler, L. and Strother, A. Placental transfer, excretion and
1974 disposition of (14C)-Mesurol in maternal and foetal rat
tissues. Toxicology and Applied Pharmacology, 30:163-174.