
OCHRATOXIN A
First draft prepared by
Drs T. Kuiper-Goodman and D.L. Grant,
Toxicological Evaluation Division,
Health and Welfare Canada.
1. EXPLANATION
Ochratoxin A (OA) is a mycotoxin produced by aspergillus
ochraceus, after which it was named, as well as by other molds,
notably Penicillium viridicatum. OA consists of a
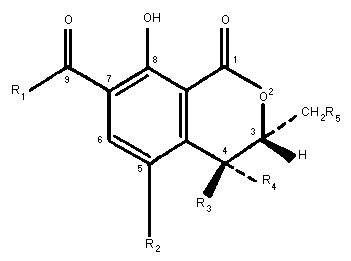
dihydroisocoumarin moiety linked through its 7-carboxyl group by an
amide bond to one molecule of L-ß-phenylalanine (Fig. 1). OA has
not been evaluated previously by the Joint FAO/WHO Expert Committee.
OA has both antibiotic and toxic properties, the most important
of which are its nephrotoxic, teratogenic, carcinogenic, and
immunotoxic properties. It has been the cause of a nephropathy
affecting many pigs in Scandinavian countries. In Denmark carcasses
are condemned if residue levels of OA in the kidney exceed 25 ng/g
(previous 10 ng/g). Its presence in Yugoslavian and Bulgarian
foodstuffs has been speculatively associated with a human
nephropathy endemic in certain parts of those countries. OA
residues are known to occur in food and feed grade cereal crops and
in pig tissues and pig blood at levels that may be of health
concern.
A detailed risk assessment on OA, which discusses the
chemistry, mycology, and natural occurrence of OA as well as its
toxicity, metabolic disposition, and its role in porcine, avian and
human nephropathy has recently been published (Kuiper-Goodman &
Scott, 1989) and the present review has made considerable use of
that paper. OA was also recently reviewed by WHO/IPCS (draft
document was not available to the reviewers) and was a subject for 2
working groups of the International Agency for Research on Cancer
(IARC, 1976, 1983).
2. BIOLOGICAL DATA
2.1 Biochemical aspects
2.1.1 Absorption, distribution, and excretion
 R1 R2 R3 R3 R5
Phenylalanyl Cl H H H Ochratoxin A
Phenylalanyl H H H H Ochratoxin B
Phenylalanyl ethyl ester Cl H H H Ochratoxin C
Phenylalanyl methyl ester Cl H H H Ochratoxin A methyl ester
Phenylalanyl methyl ester H H H H Ochratoxin B methyl ester
Phenylalanyl ethyl ester H H H H Ochratoxin B ethyl ester
OH Cl H H H Ochratoxin alpha
OH H H H H Ochratoxin ß
Phenylalanyl Cl H OH H 4R-Hydroxyochratoxin A
Phenylalanyl Cl OH H H 4S-Hydroxyochratoxin A
Phenylalanyl Cl H H OH 10-Hydroxyochratoxin A
Fig. 1 Chemical structures of ochratoxin A and related metabolites
2.1.1.1 Absorption
It has been suggested that in most species OA is absorbed from
the stomach, aided by the acidic properties of the mycotoxin
(pKa=7.1) (Galtier, 1978; Roth et al., 1988).
However, in studies with ligated gastro-intestinal loops, the
small intestine was found to be the major site of absorption, with
maximal absorption from the proximal jejunum. Absorption from the
jejunum can take place against a concentration gradient, and is
dependent on the pH at the mucosal surface of the jejunum. OA so
transferred is in lipid soluble, non-ionized form (Kumagai & Aibara,
1982; Kumagai, 1988).
Recent studies, with a low dose of 3H-OA given by intubation
to mice, were interpreted by the authors as indicating rapid
absorption of OA from the stomach (Roth et al., 1988), but the
reviewers felt that the data could also be interpreted as supporting
intestinal absorption of OA as the major route, based on rapid
transit of OA from the stomach to the intestine. These authors also
found that secondary distribution peaks of OA in the intestinal
content and serum may be a consequence of enterohepatic circulation
since the biliary excretion of OA is very efficient (Roth et al.,
1988, Fuchs et al., 1988).
The overall percentage of OA absorbed is 66%, 56%, 56%, and
40%, respectively, for the pig, rat, rabbit and chicken (Galtier et
al., 1981; Suzuki et al., 1977).
Phenylalanine, given to mice by gavage together with OA in a
10:1 molar ratio, appeared to increase absorption of OA from the
stomach and intestine, and increase gastrointestinal transit. This
resulted in 8-fold and 4-fold higher levels of OA in serum and
liver, respectively, during the first 12 hours (Roth et al.,
1988).
OA that has been transferred across the intestinal mucosa
reaches the liver via the portal vein (Kumagai & Aibra, 1982; Storen
et al., 1982a).
Its relative bioavailability, estimated from a comparison of
the maximal serum concentration after oral and intravenous exposure,
was estimated to be very low in fish, but 44 and 97% for several
mammalian species investigated (Hagelberg et al., 1989).
Once it reaches the blood, OA readily binds to serum albumin
(Galtier et al., 1980), and other serum macromolecules (Hult &
Fuchs, 1986). Red blood cells contained only traces of OA (Galtier,
1978).
The association constants for OA binding to serum albumins were
7.1 x 10⁴ M-1, 5.1 x 10⁴ M-1 and 4.0 x 10⁴ M-1 for porcine,
chicken and rat albumins respectively (Galtier et al., 1981).
The fraction of OA bound to serum albumin and other serum
macromolecules constitutes a mobile reserve of mycotoxin which can
be available for release to the tissues for a long time (Galtier,
1978;; Hult et al., 1982).
Studies with albumin deficient rats have shown that the primary
effect of OA binding or serum albumin is to retard its elimination
by limiting transfer of OA from the blood stream to hepatic and
renal cells (Kumagai, 1985).
In studies on the stability of OA bound to porcine albumin, the
acidic drug phenylbutazone displaced OA from serum albumin so that
more free toxin was available. In vivo studies in male rats
showed greater toxicity of OA in the presence of phenylbutazone,
with a significant decrease in the LD50 value from 33.4 to 21.1
mg/kg bw (Galtier et al., 1980).
OA was found to have higher affinity for an as yet
unidentified serum macromolecule (MW=20,000) with association
constants of 2.3 x 10¹⁰ M-1 and 0.59 x 10¹⁰ M-1 in human and
porcine sera respectively. Saturation of this specific binding
macromolecule occurs at low levels of OA, 10 to 20 ng per ml serum.
Significant serum albumin binding takes place at higher
concentrations of OA, with saturation taking place above several
hundred µg of OA per ml serum (Stojkovic et al., 1984; Hult &
Fuchs, 1986).
Binding constants of OA to two identified plasma proteins and
the fraction of unbound toxin in the sera of different species were
also determined. The latter values were 0.02% (man, rat), 0.08%
(monkey), 0.1% (mouse, pig), and 22% (fish) (Hagelberg et al.,
1989).
2.1.1.2 Tissue residues and half lives of OA in various species
Once OA has been absorbed, tissue and plasma residues of OA and
its metabolites depend on a number of factors such as: the length of
time of feeding, the dose, the use of naturally contaminated grain
versus crystalline OA, the route, the degree of serum binding, the
half life of OA, and the length of time on an OA-free diet prior to
sacrifice. These factors are of importance in assessing data on the
natural occurrence of residues in animal tissues (Kuiper-Goodman &
Scott, 1989).
With a single oral exposure, maximum serum levels of OA were
found within 10 to 48 hours in the pig and rat (Mortensen et al.,
1983b; Suzuki et al., 1977; Galtier, 1978; Galtier et al.,
1981), at 2 to 4 hours in the ruminant calf (Sreemannarayana et
al., 1988), and more rapidly in rabbits and chickens, 1 and 0.33
hrs, respectively (Galtier et al., 1981). Maximum tissue residues
were also found within 48 hours in the rat.
Wide species differences in the serum half life of OA have been
reported. After oral administration in the monkey (Macaca mulata),
510 hr (Hagelberg et al., 1989), in the pig, 72-120 hours (Galtier
et al., 1981; Mortensen et al., 1983a), in the pre-ruminant calf
77 hours (Sreemannarayana et al., 1988), in rats 55-120 hours
(Galtier et al., 1979; Ballinger et al., 1986; Hagelberg et
al., 1989), in mice 24-39 hours (Fukui et al., 1981), in quail
6.7 hours (Hagelberg et al., 1989) and in chickens 4.1 hour
(Galtier et al., 1981).
In the above species which were so tested, the serum half life
was longer after intravenous administration of OA (Hagelberg et
al., 1989). Differences in serum half life could be related in
part to differences in absorption (Galtier et al., 1981);
differences in peak plasma values (see above); and species
differences in degree of binding to serum macromolecules, including
albumin.
The disappearance rate of OA from blood was slower than from
kidney, liver and other tissues in the pig (Hult et al., 1979).
Whole body autoradiography using a single i.v. dose of 14C-
labeled OA in mice (approximately 200 µg/kg bw), showed that OA
persisted for a long time (> 4 days) in the blood. This was
attributed to OA being present mainly in bound form at this low dose
level (Fuchs et al., 1988).
Preliminary observations indicated no specific binding of OA to
macromolecules in porcine kidney cytosol (Stojkovic et al., 1984).
Tissue distribution in pigs, rats, chickens and goats generally
follows the order kidney > liver > muscle > fat (Harwig et al.,
1983), or in some recent studies kidney > muscle > liver > fat
(Mortensen et al., 1983b; Madsen et al., 1982).
Very few data are available on the metabolic disposition of OA
in humans. It has been suggested that OA in humans has a long serum
half life, based on the strong binding of OA to human serum
macromolecules (Bauer & Gareis, 1987; Hagelberg et al., 1989).
2.1.1.3 Excretion
Both biliary excretion and glomerular filtration play an
important role in the plasma clearance in OA in rats. This can be
related to its molecular weight of 403.8, since for this species
both pathways are used for substances with molecular weights between
350 and 450. Thus in the rat both the urinary and faecal excretory
routes are important, the relative contribution of each depending on
factors such as route of administration and dose (Kuiper-Goodman &
Scott, 1989).
With different species the relative contribution of each
excretory route is also influenced by the degree of serum
macromolecular binding and differences in degree of enterohepatic
recirculation of OA (Hagelberg et al., 1989).
In rats, the major excretory products were Oalpha (Fig. 1)
(both in urine and foeces), OA and the 4R-OH-OA epimer, and in the
urine these represented 25-27%, 6%, and 1-1.5% of the administered
dose respectively (Storen et al., 1982b).
Up to 33% of radioactivity of an orally administered dose of OA
was excreted into the bile of rats up to 6 hours after dosing; only
trace amounts of Oalpha were detected in the bile (Suzuki et al.,
1977).
Biliary excretion of OA was increased and urinary excretion of
OA and Oalpha was decreased in mice pretreated with phenobarbital
(Moroi et al., 1985).
When OA was administered to rats by i.p. injection, only traces
of OA and Oalpha were identified in faeces, whereas after oral
administration 12% and 9% of OA and Oalpha were found in faeces
(Storen et al., 1982b).
In pre-ruminant and ruminant calves 85-90% of orally
administered OA was excreted as Oalpha, most of it in the urine
(Sreemannarayana et al., 1988).
2.1.1.4 Metabolic Disposition during pregnancy
2.1.1.4.1 Mouse
Whole body autoradiography studies by i.v. route, using high
doses of 14C-labeled OA, showed that OA could cross the placenta
more readily at days 8 and 9 than at day 10 of gestation, with
radioactive label appearing within 20 minutes in the uterine wall,
placental and fetal tissues. OA given to mice later during
gestation (day 17) resulted in very low fetal radioactive label
(Appelgren & Arora, 1983a, 1983b).
Differences in fetal uptake of OA during different times of
gestation were suggested to be due to differences in the placenta,
which was considered to be completely developed by day 9 of
gestation. After i.p. injection of OA at days 11 or 13 of
gestation, fetal residues appeared more slowly, and reached maximum
values at 30 to 48 hours after dosing. Residues in the placenta
were high around 2 to 6 hours after injection and then decreased
more slowly than from other tissues. Serum half lives of OA were 29
and 24 hours at days 11 and 13 of gestation respectively. The
authors considered the embryo as a "deep compartment" (Fukui et
al., 1987).
2.1.1.4.2 Rat
3H-labeled OA given s.c. to rats at day 12 of gestation also
showed a delayed fetal uptake of OA, with maximum residues appearing
at 48 to 72 hours after dosing, and representing approximately 0.1%
of the administered dose (Ballinger et al., 1986).
2.1.1.4.3 Pig
OA given at 0.38 mg/kg bw to pregnant sows from day 21 to 28 of
pregnancy did not cross the placenta (Patterson et al., 1976).
Similarly, no residues were found in piglets when low levels of
OA, 7-16 µg/kg bw, were fed during the whole period of gestation
(Mortensen et al., 1983a).
However, in more recent studies, in utero transmission of OA
to 6 piglets was observed in a sow which had been fed naturally
contaminated feed; blood levels in newborn piglets were 0.075 - 0.12
ng OA/ml compared to 0.20 ng/ml in the blood of the sow (Barnikol &
Thalmann, 1988).
2.1.2 Biotransformation
OA is hydrolyzed to the non-toxic Oalpha (Fig. 1) at various
sites. In rodents detoxification by hydrolysis to Oalpha is a
function of the bacterial microflora in the rat caecum (Galtier,
1978). The enzymes responsible for hydrolysis to Oalpha are
carboxypeptidase A and chymotrypsin, both in the cow and rodent
(Pitout, 1969a, 1969b; Pitout & Nel, 1969), with other mycotoxins
such as penicilloic acid inhibiting this reaction (Parker et al.,
1982).
Studies with rat tissue homogenates have shown that the
duodenum, ileum and pancreas also have a high capacity to carry out
this reaction, whereas the activity in the liver and kidney was low
(Suzuki et al., 1977), or non-existent in rat hepatocytes (Hansen
et al., 1982) and rabbit and rat liver (Stormer et al., 1983;
Kanisawa et al., 1979).
Distribution studies in rats with 14C-labeled OA showed that
most radioactivity was due to OA, indicating that major efficient
metabolism of OA is lacking in most tissues other than the intestine
(Galtier et al., 1979).
In vitro incubation studies with the contents from the four
stomachs of the cow indicated effective hydrolysis of OA to Oalpha
by the cow's ruminant protozoa; assuming a similar reaction velocity
in vivo, it was estimated that up to 12 mg OA per kg feed can be
degraded (Hult et al., 1976; Pettersson et al., 1982), so that
this species is assumed to be relatively resistant to the effects of
OA in the feed. Similarly sheep have a good capacity to detoxify OA
before it reaches the blood (Kiesling et al., 1984).
It has been suggested, from studies conducted in mice, that OA
circulates from the liver into the bile and into the intestine,
where it is hydrolyzed to Oalpha (Moroi et al., 1985).
About 25-27% of OA, given either i.p. or orally to rats, was
present as Oalpha in the urine. Its presence in rat urine can be
explained by reabsorption from the intestine following its formation
in the intestine (Storen et al., 1982b) .
A similar mechanism of intestinal reabsorption of Oalpha has
recently been suggested for ruminant calves (Sreemannarayana et
al., 1988).
Other minor urinary metabolites of OA are 4-OH-(4R-and
4S)epimers (Fig. 1) produced in rat and rabbit liver (Stormer et
al., 1981) and rat kidney (Stein et al., 1985) under the
influence of cytochromes P-450 (Stormer et al., 1981; 1983). The
4R-OH-OA epimer, which is considered less toxic than OA, is the
major of these two metabolites formed from OA in human and rat liver
microsomal systems (Stormer et al., 1981), whereas the 4S-OH-OA
epimer is more prevalent with pig liver microsomes. No data are
available on its toxicity (Moroi et al., 1985).
The 10-OH derivative (Fig. 1) was formed from OA with a rabbit
liver microsomal system (Stormer et al., 1983). OC (Fig. 1), a
metabolite of OA produced in rumen fluid, is equally as toxic as OA
(cited by Galtier et al., (1981)). OB (Fig. 1), a dechloro
derivative of OA, may co-occur with OA in cereal products. In the
rat it is less toxic than OA and is metabolized to 4-OH-OB and Oß
(Stormer et al., 1985).
OB was not found to act as an antagonist to OA, with respect to
the effects of OA on the formation of phenylalanyl-tRNA and protein
synthesis (Roth et al., 1989).
Many researchers have considered that the toxicity of OA was
due to one of its metabolites. From the research findings cited
above, however, it appears that in the rat OA itself, rather than
one of the metabolites mentioned above, may be the active toxic
agent, since the known metabolites are less toxic than or equally
toxic to OA itself. This agrees with findings in mice where the
LD50 of OA increased 1.5- to 2-fold after feeding phenobarbital at
500 mg/kg diet for one week prior to oral or i.p. administration
(Moroi et al., 1985).
Similarly, pretreatment with sodium phenobarbital (80 mg/kg bw
by gavage) for 5 days, or 3-methylcholanthrene (20 mg/kg bw by
gavage) for 2 days resulted in increased LD50 values for OA given
by gavage. For phenobarbital the difference was, however, less
large at 144 hours post dosing with OA, compared to the 48-hr LD50.
The administration of piperonyl butoxide, an inhibitor of microsomal
mono-oxygenases, decreased the 144-hr LD50 of OA from 40 to 18.9
mg/kg bw (Chakor et al., 1988).
On the other hand, preliminary studies with mice showed that
simultaneous feeding of phenobarbital slightly increased the
incidence of liver tumours seen after OA alone, and that mice
developed large and multiple hepatomas (Suzuki et al., 1986).
2.1.3 Effects on enzymes and other biochemical parameters
The biochemistry and molecular aspects of the action of OA in
both prokaryotes and eukaryotes were recently reviewed
(Röschenthaler et al., 1984). It was noted that not all findings
are consistent, due to limitations in experimental models and
procedures as well as interfering factors, especially in more
complex organisms. Based on work in prokaryotes (Konrad &
Röschenthaler, 1977), eukaryotic microorganisms (Creppy et al.,
1979b) mammalian cell cultures (Creppy et al., 1980a; 1983b) and
on in vivo animal studies (Creppy et al., 1980b; 1984), it is
established that the primary effect of OA is inhibition of protein
synthesis. Secondary to this, RNA and DNA synthesis may be
inhibited.
The inhibition of protein synthesis is specific and occurs at
the post-transcription level, with OA having a direct effect on the
translation step in protein synthesis. This involves a competitive
inhibition of phenylalanine-tRNAPhe synthetase, so that amino-
acylation and peptide elongation are stopped. This reaction is
fundamental for all living organisms. In yeast, the first part of
this reaction, phenylalanine dependent pyrophosphate exchange, was
inhibited 5 times more than transfer to tRNA, the second part. In
this reaction OA may be regarded as an analogue of phenylalanine,
and in cell cultures the competitive inhibition could be reversed by
an increase in phenylalanine concentration (Creppy et al., 1979a).
Similarly, in mice, the lethality of an acute dose of 0.8 mg OA
injected i.p. was completely prevented by the simultaneous injection
of 1 mg phenylalanine (Creppy et al., 1980b).
In yeast the rR-OH-OA epimer, a metabolite of OA, had a
similar effect to that of OA on protein synthesis, but Oalpha,
lacking the phenylalanine moiety, had no effect (Creppy et al.,
1983b).
Analogues of OA in which phenylalanine has been replaced by
other amino acids, i.e., tyrosine, have similar inhibitory effect on
the respective amino acid specific tRNA synthetases (Creppy et al.,
1983a).
The binding affinity of phenylalanine-tRNAPhe synthetase for
OA is lower than for phenylalanine and ranges from 1/300 in yeast
(KM = 1.3 mM for OA and 3.3 µM for phenylalanine) (Creppy et al.,
1983b), to 1/20 in rat liver (Km = 0.28 mM for OA and 6 µM for
phenylalanine) (Röschenthaler et al., 1984). Despite these
differences in binding affinity, the inhibition of phenylalanine-
tRNAPhe by OA is very effective, since OA is more readily
concentrated by cells than phenylalanine. In HTC cells the
concentration of OA inside the cells was 200- to 300-fold that in
the medium (Creppy et al., 1983b).
There was a dose related inhibition of protein synthesis in
mice given OA i.p. at a dose of 1 mg/kg bw or more. The degree of
inhibition of protein synthesis, 5 hours after administration of 1
mg OA/kg bw, was found to vary within different organs, and for
liver, kidney, and spleen was 26%, 68% and 75% as compared to
controls (Creppy et al., 1984).
It is possible that OA also acts on other enzymes which use
phenylalanine as a substrate, but no direct effect of OA on the
activity of other isolated enzyme systems has been demonstrated
(Röschenthaler et al., 1984).
However, in kidney slices from rats, two days after feeding 2
mg/kg bw OA, the activity of renal phosphoenolpyruvate
carboxykinase, a key enzyme in the gluconeogenic pathway, was
lowered by 50% (Meisner and Krogh, 1986). It was found that the
inhibition was indirectly due to a specific degradation of mRNA
coding for the above enzyme. This effect was not seen in rat liver
(Meisner et al., 1983).
2.2 Toxicological studies
2.2.1 Acute toxicity studies
A comparison of LD50 values in different species and using
different routes of exposure is shown in Table 1. These results
indicate that in acute toxicity studies with OA, the dog and pig
were the most sensitive species, and rats and mice were the least
sensitive. Simultaneous oral administration of 100 mg/kg bw
phenylalanine to mice increased the oral LD50 from 46 mg/kg bw to
71 mg/kg bw (Moroi et al., 1985). As is the case with many
xenobiotics, the neonate rat was considerably more susceptible than
the adult rat.
Table 1: LD50 values for ochratoxin A in various speciesa
LD50 values (mg/kg body weight)
Species Oral i.p. i.v.
Mouse 46-58.3 22-40.1 25.7-33.8
Rat 20-30.3 12.6 12.7
Rat neonate 3.9
Dog 0.2
Pig 1
Chicken 3.3
a Based on literature compilations in
Harwig et al., (1983) and NIOSH (1986).
Histopathological and electron microscopic studies were
conducted in groups of 10 male Long Evans and Sprague-Dawley rats
administered by gavage a single dose of 0, 17, or 22 mg/kg bw
benzene free OA in 0.1 M sodium bicarbonate and examined for up to
48 hours afterwards. The earliest changes were multifocal
haemorrhages in many organs, and fibrin thrombi in the spleen, the
choroid plexus of the brain, liver, kidney and heart suggesting
disseminated intravascular coagulation. This was postulated to be
due to the activation of extrinsic and intrinsic systems of
coagulation. Other changes were hepatic and lymphoid necrosis,
enteritis with villous atrophy affecting the jejunum most severely,
and nephrosis. Myocardial changes were thought to be related to
shock and subsequent ischemic injuries (Albassam et al., 1987).
2.2.2 Short term studies
OA has been demonstrated to have a nephrotoxic effect in all
monogastric mammalian species which have been tested so far (Kuiper-
Goodman & Scott, 1989). For their risk assessment of OA, these
authors summarized the results of about 12 short studies in rats,
dogs and pigs (see Table 2, adapted from their report). The most
relevant of these studies are presented here.
2.2.2.1 Rat
Groups of 10 male weanling Wistar rats were fed semi-purified
diets containing 0, 2.4, 4.8, 9.6, or 24 mg/kg OA, equivalent to 0,
0.24, 0.48, 0.96, and 2.4 mg/kg bw/day, for 14 days. At the two
highest dose levels there was growth retardation, reduced food
consumption, and an increased serum BUN. At the highest dose level
relative kidney weight was increased. Renal pathology, involving
degenerative changes in the entire tubular system, and a decrease in
urine volume were seen at all dose levels. Increased eosinophilia
and karyomegaly in cells of the proximal convoluted tubules were
noted at all dose levels (Munro et al., 1974).
Similar results were seen when OA was administered to groups of
4 to 6 adult Sprague-Dawley and Wistar rats by intraperitoneal
injection for 5 to 7 days at dose levels of 0, 0.75, and 2 mg/kg
bw/day. Decreased body weight, increased urine flow, increased
urinary protein, increased urinary glucose, and impaired urinary
transport of organic substances were seen at all dose levels.
Sprague-Dawley rats were found to be more sensitive than Wistar
rats, and males were more sensitive than females. It was suggested
that the increased urinary protein indicated interference with
protein reabsorption by cells of the convoluted tubules (Berndt &
Hayes, 1979).
Groups of 5 weanling male and female Fischer F344/N rats were
administered OA in corn oil by gavage at dose levels of 0, 1, 4 or
16 mg/kg bw 5 days per week for a total of 12 doses over a 16 day
period. All rats that received 16 mg/kg bw OA had diarrhoea and
nasal discharge, and died before the end of the study. Increased
relative weights of kidneys, heart and brain, thymus atrophy,
forestomach necrosis and/or hyperplasia, and haemorrhage of adrenal
glands were seen at doses above 1 mg/kg bw. Bone marrow hypoplasia
and nephropathy were seen at all dose levels, and involved renal
tubular degenerative and regenerative changes (NTP, 1989). Groups
of 15 weanling rats were administered OA in 0.1 M sodium bicarbonate
by gavage at dose levels of 0 or 100 µg/rat (equivalent to 1.25
mg/kg bw/day) for 8 weeks. Fasting blood samples of OA treated rats
contained about twice the level of glucose as control rats. After a
glucose tolerance test, insulin levels did not reach the level seen
in control rats. Total carbohydrates and glycogen in liver tissue
of treated rats were reduced, in agreement with earlier observations
(Kuiper-Goodman, personal observations; Suzuki et al., 1975).
Activities of glycolytic enzymes were reduced, whereas gluconeogenic
enzymes were increased. The diabetogenic effect of OA was thought
to be due to inhibited synthesis and/or release of insulin from
pancreatic cells, thereby suppressing glycolysis, glycogenesis, and
enhancing gluconeogenesis and glycogenolysis (Subramanian et al.,
1989).
Semi-purified diets containing 0, 0.2, 1, or 5 mg OA/kg,
equivalent to 0, 0.015, 0.075, or 0.37 mg OA/kg bw/day, were fed to
groups of 15 weanling Wistar rats of both sexes for 90 days. At this
time, 8 animals from each group were sacrificed, and the remaining
rats were subsequently fed control diet for an additional 90 days.
No changes in BUN, urinalysis, or haematological parameters were
seen at any of the dosage levels. After 90 days at the two highest
dietary levels, relative kidney weights were reduced in both sexes,
but returned to control values after the 90-day recovery period,
except for males that had received the highest dose level. Dose
related changes in morphological parameters were seen after 90 days
of treatment at doses as low as 0.2 mg/kg in the diet and involved
karyomegaly and increased eosinophilia in cells of the proximal
convoluted tubules. The authors considered the latter change a
phenomenon of ageing which had been accelerated by OA
administration. Desquamation of proximal tubular cells, autolysis,
changes in rough endoplasmic reticulum (RER), smooth endoplasmic
reticulum (SER), and tubular basement membrane thickening up to 4 µm
were noted at the highest dose level after 90 days of treatment. In
animals from the highest dose group that were subsequently given
control diet for 90 days, karyomegaly and tubular basement membrane
thickening persisted, but otherwise the kidneys appeared normal
(Munro et al., 1974).
Groups of 10 male and female weanling Fischer F344/N rats were
administered OA in corn oil by gavage at doses of 0, 0.0625, 0.125,
0.25, 0.50 and 1 mg/kg bw for 5 days per week for 91 days. Growth
retardation and a reduced relative kidney weight were seen in males
at the two highest dose levels. The NOEL for kidney tubular
necrosis was 0.0625 mg/kg bw, but karyomegaly, with dose related
severity, was observed in proximal tubules at all dose levels. Less
severe renal changes consisting of tubular atrophy were seen at
lower doses (NTP, 1989).
Table 2: Subacute and Subchronic Toxicity of Ochratoxin A
Species, N Route mg/kg b.w./day Time NOEL Effects Reference
Strain, sex [mg/kg in diet] (days) (mg/kg b.w.)
[Age]
Rat, Wistar, 10 Diet 0.24-2.4 14 -0.48 Growth retardation Munro et al.,
M, [Weanling] [2.4-24] -0.48 increased serum BUN 1974
-0.96 increased kidney wt.
<0.24 Decreased urine vol.
<0.24 Kidney pathology
Rat, Wistar, 15 Diet 0.015-0.37 90 approx. 0.075 Reduced weight gain. Munro et al.,
M.F [Weanling] [0.2-5] -0.016 Reduced kidney wt. No 1974
>0.37 change in BUN,
urinalysis,
haematology.
Desquamation, increase
in SER, changes in RER,
basement membrane
thickening of PCT
cells. Increased
eosinophilia and
karyomegaly in PCT cells
Rat, Wistar, M 5 Gavage 5.15 3 <5 Reduced p-amine hippuric Suzuki et al.,
[Adult] acid clearance, basement 1975
membrane thicking
Rat, Wistar, M 10 Gavage 0.5-2 10 1 Increased BUN. Hatey & Galtier,
[Adult] <0.5 Increased urine volume 1977
Table 2 (contd)
Species, N Route mg/kg b.w./day Time NOEL Effects Reference
Strain, sex [mg/kg in diet] (days) (mg/kg b.w.)
[Age]
Rat, Sprague- 4-6 i.p. 0.475-2 5-7 <0.75 Decreased body weight, Berndt & Hayes,
Dawley and Increased urine flow. 1979
Wistar, M,F Decreased urine
[Adult] osmolality. Increased
urinary protein.
Increased urinary
glucose. Impaired
urinary transport of
organic substances,
(Sprague-Dawley more
sensitive than Wistar,
females less sensitive)
Rat, Wistar, M 14 Gavage 4 4-10 Decreased factors Galtier et al.,
[Adult] <4 II, VI, X. Decreased 1979a
plasma fibrinogen.
Decreased thrombocyte,
megakaryocyte counts
Rat, Wistar, M 9 Gavage 4 10 <4 Hypothermia cachexia, Galtier et al.,
[Adult] tremors, diarrhoea 1980
Rat, Wistar, M 3 Gavage 0.145 56-84 <0.145 Decrease in kidney Kane et al.,
[Adult] approx. 2 enzymes. Increase in 1986a
urinary enzymes
Table 2 (contd)
Species, N Route mg/kg b.w./day Time NOEL Effects Reference
Strain, sex [mg/kg in diet] (days) (mg/kg b.w.)
[Age]
Rat, F344/N, M,F 5 Gavage 1-6 16 1 Increased relative NTP (1989)
[Weanling] (12 kidney, heart, and brain
doses) weight.
1 Thymus atrophy.
1 Forestomach necrosis.
1 Adrenal gland
Haemorrhage.
<1 Bone marrow hyplasia.
<1 Kidney nephropathy
Rat, F344/N M,F 10 Gavage 0.06-1 91 0.125,M Growth retardation NTP (1989)
[Weanling] 0.125,M Reduced relative kidney
weight
0.062 Kidney tubular necrosis
<0.062 Karyomegaly
Dog, Beagle, M. 3-6 Cap. 0.1-0.2 14 >0.2 No change in kidney Kitchen et al.,
[Young] function 1977b
<0.1 Kidney tubular Kitchen et al..
necrosis 1977b
<0.1 Proximal tubes, EM Kitchen et al.,
changes 1977a
<0.1 Thymus, lymphoid necrosis Kitchen et al.,
1977c
functions 1988
Table 2 (contd)
Species, N Route mg/kg b.w./day Time NOEL Effects Reference
Strain, sex [mg/kg in diet] (days) (mg/kg b.w.)
[Age]
Pig. F 3-6 Diet approx. 0.008- 5-90 <0.008 Renal enzyme changes; Elling, 1979b;
[8-12 weeks] [0.2 0.2, 1.5] changes in renal Krogh et al.,
Note: number of animals per group.
2.2.2.2 Dog
Groups of 3 to 6 young Beagle dogs were administered OA by
capsule at dose levels of 0, 0.1 and 0.2 mg/kg bw/day for 14 days.
At these dose levels no changes were observed in kidney function,
but kidney tubular necrosis and ultrastructural changes in proximal
tubules were observed at all dose levels. Necrosis of lymphoid
tissues of the thymus and tonsils was also seen at all dose levels
(Kitchen et al., 1977a,b,c).
2.2.2.3 Pig
In a series of experiments, groups of 3 to 6 female pigs were
administered OA at levels of 0, 0.2, 1, and 5 mg/kg feed, equivalent
to approximately 0, 0.008, 0.04 and 0.2 mg/kg bw/day, for periods of
5 days, 8 and 12 weeks, and up to 2 years. A decrease in kidney
function (see 2.2.6), nephropathy and reduction in kidney enzymes
were reported. Progressive nephropathy but no renal failure was
seen in female pigs given feed containing 1 mg OA/kg feed for 2
years. No 2-year toxicity studies in male pigs have been reported.
(Krogh & Elling, 1977; Elling, 1979a, 1979b, 1983; Elling et al.,
1985; Krogh et al., 1988).
2.2.3 Long-term/carcinogenicity studies
2.2.3.1 Mouse
Diets containing 0 or 40 mg/kg OA, equivalent to an intake of
approximately 5.6 mg/kg bw/day, were fed to groups of 10 ddY male
adult mice for 44 weeks, followed by 5 weeks of basal diet. Of the
9 surviving OA-fed mice, 5 had hepatic cell tumours, 9 had renal
cystic adenomas, and 2 had solid renal cell tumours (terminology as
used by the authors). No liver or renal tumours were observed in
control mice, and no data on the incidence of these tumours in
historical controls of this strain of mice were presented. It was
not clearly indicated whether liver tumours were benign or malignant
(Kanisawa & Suzuki, 1978).
A second study from the same laboratory confirmed the results
of the above study. Diets containing 0 or 25 mg/kg, equivalent to
an intake of approximately 3.5 mg/kg bw/day were fed to groups of 20
6-week old male DDD mice for 70 weeks. All of the 20 surviving OA-
treated mice had renal cystic adenomas, 6 had solid renal tumours,
and 8 had hepatic cell tumours. One of the 17 control mice had a
hepatic cell tumour (Kanisawa, 1984).
A third study from the same laboratory was not a lifetime
exposure study. Diets containing 0 or 50 mg/kg OA, equivalent to an
intake of approximately 7 mg/kg bw/day, were fed to groups of 16
adult male ddY mice for periods of 5 to 30 weeks, followed by a
control diet for the remainder of the study (total length of study
was 70 weeks). The length of time on control diet ranged from 65
down to 40 weeks. No renal or liver tumours were observed in
control mice or in mice fed OA for 10 weeks or less. The incidences
of renal cell tumours were 3/15, 1/14, 2/15 and 4/17 after 15, 20,
25, and 30 weeks on an OA diet, respectively. The incidence of
renal cystic adenomas was not indicated. A significant increase in
liver tumours was observed after mice had been fed OA for 25 weeks
(5/15) and 30 weeks (6/17). These results indicated that the renal
and liver tumours persisted through long term subsequent feeding of
control diet (Kanisawa, 1984).
In these studies two types of renal tumours were distinguished
by the authors, papillary cyst adenomas (benign) and solid type
renal cell tumours which contained atypical cells, displayed
infiltrative growth, and which were interpreted by the present
reviewers as being malignant. Pre-neoplastic kidney lesions were
frequent and multiple, consisting of distended tubules with atypical
epithelial cells. No metastases attributable to the kidney or liver
tumours were found.
Diets containing 0, 1, or 40 mg/kg OA were fed to groups of 50
weanling B6C3F1 mice of each sex for 24 months. The test compound
contained about 84% OA, 7% OB, and 9% benzene. Inspections of dead
or moribund mice were made daily. The mice were examined, weighed,
and food consumption recorded weekly for the first 4 weeks, then
monthly. At the 40 mg/kg dietary level, body weights were decreased
by 25 and 33% in female and male mice respectively, indicating that
the Maximum Tolerated Dose (MTD) was exceeded, although no other
signs of toxicity were observed. Nephropathy, characterized by
cystic dilatation of renal tubules often with hyperplasia of the
lining epithelium, was seen only in mice fed diets containing 40
mg/kg OA, and was more severe in males than in females. There was
no nephropathy in males or females given a control diet, or diets
containing 1 mg/kg OA. Benign and malignant renal tumours were seen
only in male mice fed diets containing 40 mg/kg OA, and their
incidence was 53% and 28.6% respectively (combined incidence 63%).
No metastases attributable to renal tumours were found.
When compared to concurrent controls, the combined incidence of
hepatocellular adenomas and carcinomas was statistically significant
in both male and female mice administered 40 mg OA per kg diet;
however, for males the 20% incidence was within the historical
control range of 0-21.6% for this strain of mice (Ward et al.,
1979); for females the 14% incidence was greater than the incidence
of 0-3.9% for historical controls (Ward et al., 1979). The
authors noted that the OA used in their study contained 9% benzene,
a proven carcinogen, and thus the possibility of synergism must be
considered. The presence of renal tumours in males did not decrease
survival. In fact, survival of males in the control and 1 mg/kg
dietary groups at 18 months was only 75% and 65%, respectively,
compared to 98% in the 40 mg/kg dietary group, due to a high
incidence of fatal obstructive urinary tract disease (uropathy) in
the 0 and 1 mg/kg dietary dose groups, with an onset as early as 4
months (Bendele et al., 1985a).
The protective effect of the 40 mg/kg dietary level of OA may
have been due to a growth inhibitive effect on Gram positive
bacteria, and to the OA induced polyuria, as a result of renal
proximal tubular damage (Bendel & Carlton, 1980). Group caging and
fighting-related lesions of the prepuce/penis may have contributed
to the chronic uropathy (Rao, 1987).
2.2.3.2 Rat
Groups of 80 male and female Fischer F344/N rats were
administered OA by gavage in corn oil at 0, 21, 70, or 210 µg/kg
bw/day, 5 days per week for 9 months, 15 months or 103 weeks. The
rats were observed twice daily, and body weights and food
consumption were recorded weekly for the first 13 weeks, and then
monthly. Feed and water were available ad libitum. Groups of 15
rats of each sex were sacrificed after 9 and 15 months. At the
highest dose level, body weight was decreased from 4-7% between 18-
77 weeks for male rats, and between 6-89 weeks for female rats. No
compound related clinical signs were noted, and the results of
haematological and serum chemical analysis showed no effects of
biological significance. Urinalysis indicated a mild to moderate
change in the ability to concentrate urine, with no other changes in
kidney function (see 2.2.6).
The incidences of renal adenomas and renal carcinomas in males
administered 0, 21, 70, and 210 µg OA were 1/50, 1/51, 6/51 and
10/50 and 0/50, 0/51, 16/51 and 30/50 respectively. The combined
incidences of renal tubular cell adenomas and carcinomas were 36/50
and 20/51 at 210 µg and 70 µg respectively. At the highest dose
level many renal adenomas and carcinomas were multiple or bilateral.
There was a dose related increase in the number of males that were
dead or moribund (7, 19, 23, and 26, respectively, in the 0, 21, 70,
and 210 µg/kg bw dose groups) before the time of terminal sacrifice.
In the two highest dosage groups, decrease in survival was
attributed by the authors to the presence of kidney tumours since 15
out of 23, and 18 out of 26 rats which died had kidney tumours. As
well, a larger proportion of animals that died prior to the terminal
sacrifice had carcinomas that had become metastatic (3/8 and 11/15
at the mid- and high dose respectively) compared to animals killed
at terminal sacrifice (0/7 and 3/15 at the mid- and high dose
respectively). However in male rats given the low dose of OA, only
one kidney tumour was present, although the decrease in survival was
similar to that of the two higher doses. Lower survival in this
group must therefore be attributed to a non-neoplastic treatment-
related effect.
In females, the combined incidences of renal adenomas and
carcinomas were 0/50, 0/51, 2/50 and 8/50 for the 0, 21, 70, and 210
µg OA groups, respectively.
The significance of the OA-induced rat renal carcinoma is
increased by the presence of a high frequency of metastases,
attributed to renal cell carcinomas, mainly in the lungs and lymph
nodes.
In high dose female rats there was also an increased incidence
in multiplicity of fibroadenomas in the mammary gland (14/50
compared to 4-5/50 in controls and lower doses).
Non-neoplastic lesions involved mainly the kidney. Chronic
diffuse nephropathy, common to old rats, was seen with about the
same incidence in all groups of males and females, but the extent
and grade were not reported.
At the two highest dose levels karyomegaly or karyocytomegaly
(large kidney epithelial cells with giant polyploid nuclei and
prominent nucleoli) was seen in all males and females, and it was
the most consistent finding at the two highest dose levels in the
interim 9- and 15-month sacrifices, as well as in the 13-week NTP
preliminary study (NTP, 1989).
2.2.4 Reproduction studies
No adequate reproduction studies with OA have been reported to
date.
2.2.5 Special studies on embryotoxicity/teratogenicity
2.2.5.1 Mouse
Groups of 4 to 26 pregnant CBA mice were administered a single
dose of OA in corn oil by gavage at dose levels of 0, 1, 2, or 4
mg/kg bw on days 8 or 9 of gestation (vaginal plug day = post
conception day 1), or of 4 mg/kg bw on days -2 (2 days prior to
mating), 2, 4, 6, 7, 10, and 14 of gestation and observed until day
19. At this time the number of viable and dead fetuses and the
number of resorption sites were determined, and fetuses were weighed
and examined for morphological changes. No mention was made of
whether maternal toxicity was present. Prenatal survival was
decreased for groups that had received 4 mg/kg bw on days 7 (24%
deaths), 8 (17.3% deaths), and 9 (22.2% deaths) of gestation. Overt
craniofacial anomalies were produced only by exposure on days 8 or
9, and their incidence, multiplicity, and severity increased with
increasing dosage, the peak effect being on day 9. The incidences
of malformed pups among surviving pups were 0%, 0%, 8.1%, and 16.4%
for mice administered 0, 1, 2, or 4 mg/kg bw on day 8 of gestation,
and 0%, 29.3%, 41.8%, and 91.1% for mice administered these same
dosages on day 9 of gestation. The mean number of malformations per
fetus was approximately 0.3 and 2.3 on days 8 and 9 of gestation in
the 4 mg/kg dose group, and 1.7 and 3.9 respectively when
administered 8 mg/kg bw (separate study). The central nervous
system, the eye and the axial skeleton were mainly affected. The
most important malformations were those affecting the craniofacial
structures, including aplasia and dysplasia of the upper facial
structures, such as exencephaly, microcephaly, blunt jaws,
anophthalmia, microphthalmia, median cleft face. On day 9 of
gestation at the 4 mg/kg dose level, the incidences for the various
major anomalies were exencephaly (89.3%), anophthalmia (44.6%),
microphthalmia (26.8%), open eye lids (16.1%), agenesis of external
nares (21.4%), cleft lip (7.1%), median cleft face (8.9%), and
malformed jaws/short maxilla with protruding tongue (41.1%). The
craniofacial anomalies were thought to arise from a failure of
closure of the neurocranium, resulting in abnormal configuration,
position and size of the bones of the base and lateral walls of the
skull (Arora & Frölen, 1981).
The effects of protein deprivation on the teratogenic effects
of OA were studied in groups of 10 to 13 CD-1 mice, maintained on
diets providing 26% (control), 16%, 8%, and 4% purified protein
(casein), following mating and throughout gestation. A single dose
of OA in 0.1 N sodium bicarbonate was administered by gavage at dose
levels of 0, 2, or 3 mg/kg bw on day 8 of gestation (vaginal
plug=day 1), and the mice were sacrificed at day 18 of gestation for
teratologic examination. Dams were monitored twice daily and food
consumption was monitored. Protein diets and water were available
ad libitum.
OA treatment did not affect maternal food consumption, but in
some of the 3 mg OA groups (26% and 4% protein) maternal deaths were
significantly more frequent (5 and 4 respectively versus 0 in the
two OA free groups). There were also 9 maternal deaths in the 4%
protein group given 2 mg OA/kg. The percentage of litters with
grossly malformed fetuses and the percentage of malformed fetuses
(in brackets) for each of the 4 protein diets (26, 16, 8, and 4%,
respectively were 58 (25), 50 (17), 75 (45), and 100 (81.3) at 3 mg
OA/kg bw, 25 (5), 50 (21), 30 (12.6), and 100 (77.7) at 2 mg OA/kg
bw, and 0 (0), 0 (0), 18 (3), and 31 (9.8) at 0 mg OA/kg bw. Fetal
weights were reduced as a result of OA and protein deprivation.
Cranofacial malformations were the most common, but at lower protein
levels gross malformations affecting limbs and tail were also seen
(Singh & Hood, 1985).
2.2.5.2 Rat
Five groups of 12 to 20 pregnant Wistar rats were administered
a total of 5 mg/kg bw OA in 0.16 M sodium bicarbonate by gavage as
follows: at each of days 8 and 9 of gestation (vaginal plug=day 1)
single doses of 2.5 mg/kg bw, on each of days 8 to 11 of gestation
doses of 1.25 mg/kg bw, on each of days 8 to 13 of gestation doses
of 0.83 mg/kg bw, and on each of days 8 to 15 of gestation doses of
0.63 mg/kg bw, or vehicle control. In a similar way, three groups
of 20 rats were administered single doses of 2.5 mg OA/kg bw on each
of days 8 and 9 of gestation, or on each of days 8 to 10 of
gestation doses of 1.67 mg OA/kg bw, or vehicle control. Rats were
sacrificed on day 20 of gestation. There were no significant
differences in the number of implantations per female for the
various groups. Females that had received the same total amount of
OA, divided into fewer single doses, and early in gestation were
most affected. There was a single-dose related increase in the
number of resorptions per female, and decreases in the mean number
of fetuses per female, mean fetal weight, and mean placental weight.
A high single-dose related incidence of fetal haemorrhages (seen at
the 2 times 2.5 and 4 times 1.25 mg/kg dose levels) and celosome
with or without oedema were considered teratogenic responses (Moré &
Galtier, 1974).
In a follow-up study from the same laboratory a similar
protocol for OA administration was used, but rats were observed
until 82 days after birth. There was a single-dose related decrease
in the mean number of new-born rats, mean number of rats alive at 4
days, and the viability index, but not in the lactation index. In
the group given 2.5 mg OA/kg bw twice, the mean body weights in male
and female offspring at 82 days were reduced by 12 and 8%,
respectively. In 26% of male offspring of that group hydrocephalus
was observed on day 15 after birth, and 40% of these animals died by
20 days after birth. A second generation was bred to look for
residual maternal or paternal effects of OA, and without further
administration of OA. No differences in reproductive parameters
were noted, and details were not given (Moré & Galtier, 1975).
Levels as low as 0.5 mg OA/kg b.w. given by gavage to rats on
days 11 to 14 of gestation caused learning deficits in pups which
were tested over a 26-week period (Kihara et al., 1984).
Other studies on the teratogenicity in mice and rats given OA
by i.p. or s.c. route were reviewed by Kuiper-Goodman & Scott
(1989).
2.2.6 Special studies on nephrotoxicity
As seen in the short-term studies, kidney function and
morphology are greatly affected at higher dose levels of OA as
indicated by increases in kidney weight, urine volume, blood urea
nitrogen (BUN) (Hatey & Galtier, 1977), urinary glucose and
proteinuria (Berndt and Hayes, 1979). The latter two findings
indicate that the site of reabsorption, i.e. the proximal convoluted
tubules, is damaged. NOELs for changes in renal function depend on
the species and on the parameter tested.
At lower dose levels of OA, no increases in BUN, creatinine or
glucose were found in the urine of male and female rats given 210
µg/kg b.w./day by gavage for 6-12 months, but a mild to moderate
decreased ability to concentrate urine was seen. The NOEL for this
effect was 70 µg/kg b.w. for male rats and 21 µg/kg b.w. for female
rats (NTP, 1989).
Different groups of investigators have shown that this specific
toxic effect is due to an OA induced defect on the organic anion
transport mechanism located on the brush border of the proximal
convoluted tubular cells and basolateral membranes (Endou et al.,
1986; Sokol et al., 1988).
The organic ion transport system is also the mechanism by which
OA enters proximal tubular cells (Friis et al., 1988; Sokol et
al., 1988).
The middle (S2) and terminal (S3) segments of the proximal
tubule of isolated nephron segments were found to be the most
sensitive to the toxic effects of OA (0.05 mM), as shown by a
significant decrease in cellular ATP and a dose related decrease in
mitochondrial ATP content (Jung & Endou, 1989).
Several investigators have measured the effect of OA on the
release of enzymes from the kidney into the urine. Changes in
enzyme and protein pattern can be used to distinguish different
types of renal injury (Stonard et al., 1987).
Subcutaneous doses of OA, at a dose level of 10 mg/kg bw for 5
days, decreased first the level of muramidase, followed by decreases
in the levels of lactate dehydrogenase, alkaline phosphatase,
glutamate dehydrogenase, and acid phosphatase in the kidney (Ngaha,
1985).
The levels of alanine peptidase, leucine amino peptidase and
alkaline phosphatase were decreased by 60%, 50%, and 35%
respectively in isolated kidney tubules in the presence of 0.1 mM OA
(Endou et al., 1986).
In male rats, given 0.1 to 2 mg/kg bw OA by oral route for 2 to
5 days, phosphoenolpyruvate carboxykinase (PEPCK) activity decreased
by 50 to 70% at the highest dose level (Meisner et al., 1983;
Meisner & Krogh, 1986); the minimum effect level (MEL) for rats was
0.1 mg/kg bw (Meisner & Polsinelli, 1986); at 2 mg/kg bw other
enzymes such as pyruvate carboxylase, malate dehydrogenase,
hexokinase and gamma-glutamyl transpeptidase were not affected
(Meisner & Selanik, 1979).
More recently, it was shown that in rats given OA by gavage at
a dose level of 0.145 mg/kg bw every 48 h (equivalent to about 2
mg/kg diet) for 8 to 12 weeks, the level of lactate dehydrogenase,
alkaline phosphatase, leucine amino peptidase, and gamma-glutamyl
transferase decreased significantly. The latter three enzymes are
located in the brush border of the proximal convoluted tubules,
indicating damage at that site. Concomitant with the decrease of
enzyme activity in the kidney was the appearance of these enzymes in
the urine. A late event was the urinary increase in N-acetyl ß-D-
glucosidase, a lysosomal enzyme. The activity of this enzyme in the
kidney was not affected (Kane et al., 1986a). The late appearance
of this enzyme may indicate active regeneration and the exfoliation
of necrotic proximal convoluted tubular cells releasing lysosomal
enzymes (Stonard et al., 1987).
In the above study, para-aminohippurate clearance was reduced
initially by 56% at 2 weeks and 8% at 12 weeks of dosing, indicating
damage followed by regeneration.
Pigs are very sensitive to the effect of OA on renal enzyme
activity. In kidneys of pigs fed 0.2 to 1 mg/kg OA in the diet
(equivalent to about 0.008 to 0.041 mg/kg bw/day), a dose related
decrease in the activity of PEPCK and gamma-glutamyl transpeptidase
was accompanied by a dose related decrease of renal function, as
indicated by a reduction of maximal tubular excretion of para-
aminohippurate per clearance of inulin and an increase in glucose
excretion. Only cytosolic PEPCK activity was inhibited, with
mitochondrial PEPCK activity not affected by OA (Meisner & Krogh,
1986; Krogh et al., 1988).
2.2.7 Special studies on genotoxicity
The genotoxicity of OA was recently reviewed (Bendele et al.,
1985b; Kuiper-Goodman & Scott 1989). The following is taken from
the latter review. OA has been shown to be non-mutagenic in various
microbial and mammalian gene mutation assays, both with and without
exogenous metabolic activation. A single positive result in a
bacterial assay was attributed to the presence of 15% OB in the OA
(Kuczuk et al., 1978) (Table 3).
While evidence for DNA damage/repair in microbial systems has
been negative, a weakly positive response was found for induction of
unscheduled DNA synthesis (UDS) in ACI strain rat and C3H strain
mouse primary hepatocytes, each treated at 2 dose levels for 20
hours with OA (purity not stated) (Mori et al., 1984) (Table 3).
The positive results were reported at approximately 0.4 and 4.0
µg/ml, respectively; OA was cytotoxic at 4.0 and 40.0 µg/ml,
respectively.
On the other hand, Bendele et al., (1985b) tested 2 lots of
highly purified OA over a 7 1/2 log concentration range, and used 15
dose levels (treatment duration not stated) for induction of UDS in
Fischer 344 primary rat hepatocytes. They found that OA was
cytotoxic at ±0.05 µg/ml concentration, and that OA did not induce
UDS at dose levels up to cytotoxic doses.
OA has caused a small but significant dose-related increase in
sister chromatid exchange (SCE) in CHO cells in the presence, but
not in the absence, of rat liver S9 activation (NTP, 1989).
Negative effects on SCE frequency were found in HPBL cells
(Cooray, 1984) and in an in vivo assay (Bendele et al., 1985b).
OA did not induce chromosome aberrations in CHO cells (NTP,
1989) (Table 3).
OA has caused DNA damage (single strand breaks) in vitro in
CHO cells, rat fibroblasts (Stetina & Votava, 1986) and in mouse
spleen cells (Creppy et al., 1985).
DNA strand breaks were induced by OA treatment in vivo in
mouse spleen, kidney and liver cells, and rat kidney and liver cells
after a single i.p. injection, at fairly high dose levels (Creppy
et al., 1985), or after gavage treatment for 12 weeks at levels
equivalent to low (4 mg/kg) dietary concentrations (Kane et al.,
1986b) (Table 3).
2.2.8 Special studies on immune response
Several studies have shown that OA affects structural
components of the immune system in several species. In chickens fed
2-4 mg OA/kg in the diet for 20 days, OA was found to decrease the
lymphoid cell population of immune organs (Dwivedi & Burns, 1984a).
The size of the mouse thymus was reduced to 33% of controls
after four i.p. injections of 20 mg OA/kg bw on alternate days, a
dose which caused minimal nephrotoxicity. There was also bone
marrow depression, as shown by a dose-related and significantly
(p<0.01) decreased marrow cellularity, including a reduction of
bone marrow macrophage-granulocyte progenitors, a decrease in the
number of haematopoietic stem cells and a significant decrease in
erythropoiesis as measured by 59Fe uptake; increased phagocytosis
by macrophages was also observed (Boorman et al., 1984).
Residual damage, 3 weeks post exposure, was demonstrated by an
increased sensitivity to irradiation, even though bone marrow
cellularity and the peripheral blood count had returned to normal
(Hong et al., 1988; NTP, 1989).
Bone marrow hypocellularity and a reduction in thymic size were
also seen in Fischer rats given 1 or 4 mg OA/kg bw/day by gavage for
16 days (NTP, 1989).
Necrosis of germinal centers in the spleen and lymph nodes was
seen in Wistar rats given a single dose of 5 - 50 mg OA/kg bw
(Kanisaw et al., 1977), and in dogs given OA by capsule at doses
of 0.1-0.2 mg/kg bw/day for 14 days (Kitchen et al., 1977c).
It is possible that the effects of OA on the bone marrow and
lymphatic cell population reflect the sensitivity of these cells to
inhibition of protein synthesis induced by OA. These effects on the
structural components of the immune system indicated that OA was
likely to have an effect on immune function.
Several studies have shown that OA affects both humoral and
cell-mediated immunity. In chickens fed OA at 5 mg/kg diet for 56
days, the content of alpha1 alpha2, beta and gamma globulin in
blood plasma was reduced (Rupic et al., 1978).
In chickens, fed 2-4 mg OA per kg diet for 20 days, there was a
depression of IgG, IgA and IgM in lymphoid tissues and serum
(Dwivedi & Burns, 1984b), and complement activity was slightly
affected when fed at 2 mg OA per kg diet for 5-6 weeks (Campbell et
al., 1983).
OA also reduced IgG and increased IgM in the bursa of Fabricius
in chick embryos that had been injected with 2.5 µg OA/embryo on day
13. This did not however affect immunocompetence, as seen after
challenge of the hatched chickens with E. coli at 1, 2 and 4 weeks
of age, indicating that the effect on immunoglobulins may have been
transient (Harvey et al., 1987b).
OA administered to 8-10 week old Swiss mice at 5 mg/kg bw/day
by i.p. injection for 50 days, reduced the antibody response to
Brucella abortus, a cell mediated immune response, and this was
postulated to be due to a suppression of IgM synthesis (Prior &
Sisodia, 1982).
The same treatment also reduced mitogen (con A)-induced blast
formation in mouse spleen derived lymphocytes (Prior & Sisodia,
1982).
Table 3: Results of Genotoxicity Tests with Ochratoxin A
Dose
Endpoint Organism/ Details Activation Value Units Result Comment Reference
cell type
Microbial
Prokaryotes
Gene S. typhimurium TA98, +/- 0.4-400 µg/plate -/- Highly Wehner et al., 1978
mutation 100, variable Kuzuk et al., 1978
1535, TA 100
1537, controls,
1538 not tested to
cytotoxicity
Gene S. typhimurium TA100, +/- approx. 198 µg/plate -/- Mouse Bartsch et al., 1980
mutation 1538 liver and
rat liver
activation
Gene S. typhimurium TA98, +/- 50-600 µg/plate -/- Tested to Bendele et al.,
mutation 100, cytotoxicity/ 1985b)
1535, solubility
1537,
1538
Gene S. typhimurium TA98, +/- 0.1-100 µg/ml -/- Non Bendele et al., 1985b
mutation 100, (in log- quantitative
1535, arithmic assay
1537, gradients)
1538,
G46,
C3076,
D3052
Table 3 (contd)
Dose
Endpoint Organism/ Details Activation Value Units Result Comment Reference
cell type
Gene S. typhimurium TA1538, + 0.1-500 µg/plate + Positive > Kuczuk et al., 1978
mutation (OA:OB = 100 µg/plate
17.3)
Gene S. typhimurium TA97, +/- 1-100 µg/plate -/- Hamster or NTP, 1989
mutation 98, rat liver
100, activation
1535
DNA damage/repair
DNA repair E. coli SOS +/- 1-2 mg/100 µl -/- Qualitative Reiss (1986);
colorimetric; Auffray & Bouti-
spot test bonnes (1986)
DNA repair E. coli WP2 +/- Gradient Not -/- Qualitative Bendele et al.,
plate stated assay (1985b)
DNA damage B. subtilis rec 20-100 µg/disk - Inhibition Ueno & Kubota
zone (1976)
Eukaryotes -
-
Gene mutation S. cerevisiae D3 - 200 µg/plate Kuczuk et al., 1978
+ 75 µg/plate
Mammalian In vitro
Gene mutation Mouse lymphoma TK +/- 0.1-12.5 µg/ml -/- >12.5 µg/ml, Bendele et al., 1985b
cytotoxic
Table 3 (contd)
Dose
Endpoint Organism/ Details Activation Value Units Result Comment Reference
cell type
Gene mutation C3H mouse 8-AG 5-10 µg/ml -/- 10 µg/ml, Umeda et al., 1977b
mammary cytotoxic
carcinoma
DNA damage/repair
UDS, repair Rat primary Fisher 344 - 0.000025- µg/ml - >0.05 µg/ml Bendele et al., 1985b
hepatocytes strain 500; 2 lots cytotoxic
tested, 15
doses
UDS, repair Rat primary ACI strain - 0.4, 4.0 µg/ml + At approx. Mori et al., 1984
hepatocytes (weak) 0.4 µg/ml;
cytotoxic; at
approx. 4
µg/ml
UDS, repair Mouse primary C3H strain - 4.0, 40.0 µg/ml + At 4.0 µg/ml; Mori et al., 1984
hepatocytes (weak) cytotoxic at
40 µg/ml
SCE Human, HPBL +/- 5-10 µg/ml - Mitotic Cooray (1984)
inhibition at
10 µg/ml
SCE CHO cells 26 h with - 0.5-5 µg/ml - NTP (1989)
OA
Table 3 (contd)
Dose
Endpoint Organism/ Details Activation Value Units Result Comment Reference
cell type
SCE CHO cells 2 h with OA + 5-160 µg/ml + SCE frequency NTP (1989)
(weak, up to 37%
dose above control
related)
Chromosome CHO cells 8-10 h with - 30-160 µg/ml - NTP (1989)
aberration OA
2 h with OA + 100-300 µg/ml - NTP (1989)
DNA strand CHO cells; rat Alkaline 200 µg/ml + 1.2 breaks/109 Stetina & Votava
break fibroblasts elution Da (1986)
DNA damage Mouse spleen 48 h 10 µg/ml + replicated 6 Creppy et al., 1985
PHA stimulated treatment (dose times in pairs
at 1-10 related)
µg/ml
In vivo
SCE Chinese Gavage, mg/kg - >100 mg/kg Bendele et al., 1985b
hamster, bone 25-400 body wt. body wt.
marrow cytotoxic
DNA damage Balb/c mouse
single strand Spleen 4, 16, i.p. 2500 µg/kg + Max. response Creppy et al., 1985
breaks 24 h after body wt at 24 h
treatment
Table 3 (contd)
Dose
Endpoint Organism/ Details Activation Value Units Result Comment Reference
cell type
Kidney 24, 48 h i.p. 2500 µg/kg + Max. response Creppy et al., 1985
after body wt at 24 h
treatment
Liver 24, 48, i.p. 2500 µg/kg + Max. response Creppy et al., 1985
72 h after body wt at 48 h;
Recovery at
72 h
DNA damage- Wistar rat 6-12 weeks Gavage 144 µg/kg both+ No recovery Kane et al., 1986b
single strand kidney, liver (289 µg/kg body wt seen between
breaks body wt treatments
every 48 h
equiv. to
4 ppm in
diet)
Chromosome human 48hr +/- 4.5 µg/ml +/+ 4.5-5 fold Manolova et al., 1990
aberration lymphocytes increase in
aberrationsa
a Aberrations on x chromosomes of similar types to those previously detected in lymphocytes from patients suffering from
endemic nephropathy.
In the above-mentioned mouse studies, immune response to sheep
red blood cells (SRBC), measured as the number of antibody forming
cells in the spleen using the indirect plaque assay, was not
affected. When OA was administered at 4 mg/kg diet (equivalent to
about 0.5 mg/kg bw), a dose which is about 10-fold lower and close
to that which can be found to occur naturally, none of these
responses were affected (Prior & Sisodia, 1982).
In contrast to these studies, very low levels of OA (1 µg
kg/bw) given once by i.p. route to BALB mice, 8-12 weeks of age, had
an immuno-suppressive effect on both IgM and IgG response to a
single injection of SRBC in the standard plaque counting assay for
the estimation of antibody producing spleen lymphocytes (Creppy et
al., 1982).
No explanation, other than differences in route of exposure, is
available for the differences in response to SRBC between these
studies and those of Prior and Sisodia.
A reduction in blast cell formation was also seen in human
peripheral lymphocytes treated with 5-20 µg OA/ml (Cooray, 1984).
At even lower concentrations of OA, similar and dose related
inhibition of con-A-induced blastogenesis of porcine blood
lymphocytes was observed, with concentrations of >1 µg, 0.5 µg, and
0.06 µg OA/ml causing almost complete, 50% and 10% inhibition,
respectively (Holmberg et al., 1988).
PHA-induced proliferation of highly purified human t-
lymphocytes was inhibited by 12.5 to 50 µM concentrations of OA
(equivalent to 5-20 µg OA/ml). This was attributed to a low
interleukin-2 receptor expression and/or production. OA also
impaired the ability of purified human B-lymphocytes to proliferate
in response to anti-µ antibodies in the presence of BCGF-1 (Lea et
al., 1989). The immunosupressive effects of OA could be prevented
by i.p. administration of phenylalanine at 10 µg/kg b.w. (Haubeck
et al., 1981; Creppy et al., 1982). Thus the immunosuppressive
action of OA could be due to its action on protein synthesis,
although the dose employed was very low. Immunocompetent cells
require activation, differentiation and proliferation, and all these
steps could be affected if protein synthesis in lymphocytes is
inhibited.
The OA metabolite, 4R-OH-OA, was found to be almost as
effective as OA, and Oalpha was found to be ineffective (Creppy et
al., 1983c).
Protein synthesis inhibition occurred in lymphocytes in culture
at 0.5 mg OA/ml after 2 hrs, and in hepatoma cells at 10-15 mg/ml,
compared to an in vivo immunosuppressive dose in the above studies
of 1 µg/kg bw (Creppy et al., 1982).
Female B6C3F1 mice, 6-8 weeks of age, administered OA at 3.4,
6.7, and 13.4 mg/kg bw by gavage or i.p. injection (6 doses over 12
days) had decreased natural killer (NK) cell activity. OA also
caused an increase in the growth of transplantable tumor cells
without altering T-cell- or macrophage-mediated antitumor activity.
Suppression of NK activity appears to be due to a decreased
production of basal interferon; OB was much less toxic in this
system (Luster et al., 1987).
2.3 Observations in humans
Chronic human nephropathy, endemic in the Balkan area, has been
associated with OA exposure, as indicated by the presence of OA
residues in local foodstuffs as well as in the blood of patients
with nephropathy. In the last 10 years, direct evidence of human
exposure to OA has been obtained in six countries (Table 4).
Published surveys have shown up to 40 ng/ml OA in human blood serum.
In a preliminary study on lymphocytes from healthy women, OA
treatment at 6 ng/ml resulted in an increased frequency of numerical
chromosome aberrations, mainly affecting the X chromosome (Manolova
et al., 1990)
In Bulgaria, a significant proportion of serum samples from
patients with endemic nephropathy and/or urinary system tumours
contained more than 2 ng OA/ml serum compared to samples from people
in a non-endemic area (Petkova-Bocharova et al., 1988).
A survey conducted in 1980 in Yugoslavia showed a higher upper
range of OA in serum in a hyper-endemic village than in a non-
endemic village, although the incidence of positive samples (> 1
ng/ml serum) was about the same in both villages, 6% and 7.8%
respectively. In 1979, the incidence of positive OA samples in the
same hyper-endemic village was 16.6%, whereas the non-endemic
village had an incidence of 7.8% positive samples (Hult et al.,
1982).
Since that time, one exceptionally high level of 1800 ng/ml
serum has also been found. Thus it is apparent that there are
fluctuations in human serum OA levels, that probably reflect local,
seasonal or yearly fluctuations in the level of OA in food. Further
long term studies are underway to investigate serum levels of OA in
Yugoslavia (Hult & Fuchs, 1986).
The mean level of OA in Polish human sera was estimated as 0.27
ng/ml, and the average daily human exposure from food was estimated
to be 0.448 ng/kg (Golinski & Grabarkiewicz-Szcaesna, 1989).
Table 4 Occurrence of Ochratoxin in Humans
Sample Location Incidence Ochratoxin A Reference
level(s),
ng/g or ng/ml
Blood serum Bulgaria 26% 1-35 Petkova-Bocharova
(from patients with et al., 1988
urinary system
tumours and/or
endemic nephropathy)
Blood serum Bulgaria 7.7% 1-2 Petkova-Bocharova
(from non-endemic et al., 1988
area)
Blood serum Yugoslavia 25/420 1-40 Hult et al.,
(from village with 1982a,b
endemic nephropathy)
Blood serum Yugoslavia 17/219 1-10 Hult et al.,
(from non-endemic 1982a,b
village)
Blood serum Poland 9/216 1.3-4.8 Goliski &
Grabarkiewicz -
Szczesna, 1985
Blood serum Germany (FRG) 173/306 0.1-14.4 Bauer & Gareis,
(1977, 1985) 1987
Kidneys Germany (FRG) 3/46 0.1-0.3 Bauer & Gareis,
(1982, 1983) 1987
Table 4 (contd)
Sample Location Incidence Ochratoxin A Reference
level(s),
ng/g or ng/ml
Milk (1986) Germany (FRG) 4/36 0.017-0.03 Bauer & Gareis,
1987; Gareis et
al., 1988
Blood serum Denmark ? <0.1-9.7 Hald, 1989
(obtained from mean 1.5-2.3
blood bank
(1986, 1987)
Blood serum Czechoslovakia 35/143 <0.1-1.26 Fukal & Reisnerova,
1990
? - incidence not given
A high incidence of OA in human blood serum, as well as kidneys
and milk, reported in the Federal Republic of Germany reflects the
use of a very sensitive analytical method (sensitivity = 0.1 ng/ml
serum) (Bauer & Gareis, 1987; Gareis et al., 1988). It also
reflects continuous and widespread exposure of humans to OA.
Mean serum levels in 96 randomly collected Danish human blood
bank samples collected during 1986 and 1987 were 1.5 to 2.3 ng/ml,
and ranged from < 0.1 (detection limit) to 9.7 ng/ml (incidence not
reported) (Hald, 1989).
The maximum level of OA detected in human sera obtained from
two hospitals in Czechoslovakia was 1.26 ng/ml (Fukal & Reisnerova,
1990).
About one third of the patients dying from Balkan endemic
nephropathy (BEN) have been reported to have papillomas and/or
carcinomas of the renal pelvis, ureter or bladder. In one endemic
area in Bulgaria the relative risk of patients with BEN developing
urinary tract tumours is 90-fold higher than in the population from
non-endemic areas (Castegnaro & Chernozemsky, 1987).
Besides a possible association with OA, genetic factors may
also be involved in this disease. More analytical epidemiology
studies, and studies on oncogene activation in urothelial neoplasms
are required (Castegnaro & Chernozemsky, 1987; Radovanovic, 1989).
3. COMMENTS
The Committee reviwed studies on the metabolic disposition and
toxicology of OA, as well as limited information on the association
of OA exposure and chronic human nephropathy, endemic in Yugoslavia,
Bulgaria and Rumania.
Metabolic studies indicated that OA is absorbed mainly from the
proximal jejunum and stomach. Absorption varied from 40-60% and
serum half-life ranged from 4 to > 500 hours, depending on the
species. In blood, OA was predominantly bound to serum albumin and
other yet unidentified macromolecules, Tissue distribution of OA
residues followed the order kidney > liver > muscle > fat. OA
was excreted via the urine and faeces. Cows and sheep had a high
capacity to hydrolyse OA to the relatively non-toxic ochratoxin
alpha.
The underlying mechanism of the toxic action of OA is believed
to be specific competitive inhibition of phenylalanine-tRNA ligase
(phenylalanyl-tRNA synthetase).
Acute toxicity studies indicated that the pig and dog were the
most sensitive species and that the cause of death was attributed to
widespread multifocal haemorrhages, intravascular coagulation and
necrosis of the liver, kidney and lymphoid organs. Short-term
studies in rats, dogs and pigs showed that the dominant pathological
effects were found in the kidneys. Progressive nephropathy was
observed in each species, characterized by a deterioration in
kidney function and, histologically, by karyomegaly and necrosis of
tubular cells, and thickening of tubular basement membranes. The
severity of the effects depended on the dose and sensitivity of the
animal species used. Long-term studies with mice and rats
demonstrated that, in addition to nephropathy, there was a dose
related incidence of benign and malignant tumours. Rats appeared to
be more sensitive than mice. The majority of the genotoxicity
assays on OA were negative.
OA also exhibited teratogenic activity in rats and mice with
the CNS being the predominant target tissue.
4. EVALUATION
In experimental animals treated with ochratoxin A, both humoral
and cell-mediated immunity as well as structural components of the
immune system were adversely affected.
The effects of ochratoxin A that were considered to be most
significant by the Committee are summarized in Table 5. The kidney
appeared to be the primary target organ and the most sensitive
species was the pig. As no-observed-effect levels were frequently
not demonstrated and since the effects were observed in a small
proportion of the pig's lifetime, the Committee concluded that, in
assessing the tolerable intake of ochratoxin A, a 500-fold margin of
safety should be applied to the lowest-observed-effect levels of
0.008 mg per kg of body weight per day. On this basis, a
provisional tolerable weekly intake of 112 ng per kg of body weight
was established.
Chronic human nephropathy, endemic in some areas of the
Balkans, has been lined with exposure to ochratoxin A, as indicated
by the presence of ochratoxin A residues in local foodstuffs as well
as in the blood of inhabitants. On the other hand, some individuals
and village populations have had detectable ochratoxin A residues in
the blood, but have shown no evidence of nephropathy. This suggests
that either the effects of ochratoxin A are delayed or the disease
is caused by more than one factor. About one-third of those dying
with Balkan endemic nephropathy have had papillomas and/or
carcinomas of the renal pelvis, ureter or bladder. No quantitative
estimates of ochratoxin A dietary intake were available.
Data on the occurrence of ochratoxin A have demonstrated
significant levels in a variety of foods although the overall
incidence of positive samples is low. As a result, it is extremely
difficult to estimate total dietary exposure to ochratoxin A for the
general population, although worst-case intakes of the order of 1 to
5 ng per kg of body weight per day have been estimated in
populations when there is no evidence of nephropathy.
The Committee was informed that the occurrence of elevated
ochratoxin A levels in foodstuffs in areas with endemic nephropathy
was associated with poor conditions for grain storage; this factor
has been recognized as being important in the production of
ochratoxin A.
The Committee therefore recommended that efforts be made to
highlight the need for instituting proper storage conditions for
grain and grain products. Furthermore, monitoring of appropriate
ochratoxin A residues should be undertaken to obtain better
estimates of dietary exposure and to identify populations at greater
risk with a view to implementing preventive measure. The Committee
also encouraged further studies to elucidate the role of ochratoxin
A and other mycotoxins in nephropathy in pigs and humans, the
mechanism of induction of tumours, and the role of phenylalanine in
antagonizing the adverse effects of ochratoxin A.
Table 5
Summary of effects observed in laboratory animal studies, following
oral administration of ochratoxin A
Effect Species Duration of Lowest-observed- No-observed-
treatment effect level effect level
(mg/kg bw/day) (mg/kg bw/day)
Deterioration Pig 90 days 0.008 -a
in renal
function
Karyomegaly of Rat 90 days 0.015 -a
the proximal
tubular cells
Progressive Pig 2 years 0.04 0.008
nephropathy
Overt fetal Mouse -b 1 -a
craniofacial
anomalies
Kidney tumours Mouse 2 years 4.4 0.13
Rat 2 years 0.07 0.02
Necrosis of Dog 14 days 0.1 -a
lymphoid
tissues of
thymus and
tonsils
Table 5 (contd)
Effect Species Duration of Lowest-observed- No-observed-
treatment effect level effect level
(mg/kg bw/day) (mg/kg bw/day)
Decreased Mouse 50 days -c 0.5
antibody
response
a No-observed-effect levels were not demonstrated in these studies.
b Results refer to a teratogenicity study in which ochratoxin A was
administered on day 9 of gestation.
c Only one dose level was used.
5. REFERENCES
ALBASSAM, M.A., YONG, S.I., BHATNAGAR, R., SHARMA, A.K. & PRIOR,
M.G. (1987). Histopathologic and electron microscopic studies on
the acute toxicity of ochratoxin A in rats. Vet. Pathol., 424,
427-435.
APPELGREN, L.E. & ARORA, R.G. (1983a). Distribution of
14C-labelled ochratoxin A in pregnant mice. Food Chem. Toxicol.,
21, 563-568.
APPELGREN, L.E. & ARORA, R.G. (1983b). Distribution studies of
14C-labelled aflatoxin B1 and ochratoxin A in pregnant mice.
Vet. Res. Commun., 7, 141-144.
ARORA, R.G. (1985). Experimental mycotoxicosis: some observations
on the teratopathological effects of a single dose of aflatoxin B1
and ochratoxin A in CBA/CA mice. In: Trichothecenes and Other
Mycotoxins. (J. Lacey, Ed.), pp. 537-544. John Wiley & Sons,
Chichester, U.K.
ARORA, R.G., FRÖLEN, H. & NILSSON, A. (1981). Interference of
mycotoxins with prenatal development of the mouse. 1. Influence of
aflatoxin B1, ochratoxin A, and zearalenone. Acta Vet. Scand.,
22, 524-534.8
ARORA, R.G. & FRÖLEN, H. (1981). Interference of mycotoxins with
prenatal development of the mouse. 2. Ochratoxin A induced
teratogenic effects in relation to the dose and stage of gestation.
Acta Vet. Scand., 22, 535-552.
AUFFRAY, Y. & BOUTIBONNES, P. (1986). Evaluation of the genotoxic
activity of some mycotoxins using Escherichia coli, in the SOS
spot test. Mutat. Res., 171, 79-82.
BALLINGER, M.B., PHILLIPS, T.D. & KUBENA, L.F. (1986). Assessment
of the distribution and elimination of ochratoxin A in the pregnant
rat. 1. Food Safety, 8, 11-24.
BARNIKOL, H. & THALMANN, A. (1988). Klinische Beobachtungen beim
Schwein in Zusammenhang mit den Mykotoxinen Ochratoxin A und
Zearalenon. Tierärztl. Umsch., 43, 74-82.
BARTSCH, H., MALAVEILLE, C., CAMUS, A.M., MARTEL-PLANCHE, G., BRUN,
G., HAUTELFEVILLE, A., SABADIE, N., BARBIN, A., KUOKI, T., DREVON,
C., PICCOLI, A. & MONTESANO, R. (1980). Validation and comparative
studies on 180 chemicals with S. typhimurium strains and V79
Chinese hamster cells in the presence of various metabolizing
systems. Mutat. Res., 76, 1-50.
BAUER, J. & GAREIS, M. (1987). Ochratoxin A in der
Nahrungsmittelkette. Z. Veterinärmed. B., 34, 613-627.
BENDELE, A.M., CARLTON, W.W., KROGH, P. & LILLEHOJ, E.B. (1985a).
Ochratoxin A carcinogenesis in the (C57BL/6J x C3H)F1 mouse. J.
Natl. Cancer Inst., 75, 733-742.
BENDELE, A.M., NEAL, S.B., OBERLY, T.J., THOMPSON, C.Z., BEWSEY,
B.J., HILL, L.E., REXROAT, M.A., CARLTON, W.W. & PROBST, G.S.
(1985b). Evaluation of ochratoxin A for mutagenicity in a battery
of bacterial and mammalian cell assays. Food Chem. Toxicol., 23,
911-918.
BENDELE, A.M. & CARLTON, W.W. (1986). Incidence of obstructive
uropathy in male B6C3F1 mice on a 24-month carcinogenicity study
and its apparent prevention by ochratoxin A. Lab. Anim. Sci., 36,
282-285.
BERNDT, W.O. & HAYES, A.W. (1979). In vivo and in vitro changes
in renal function caused by ochratoxin A in the rat. Toxicology,
12, 5-17.
BOORMAN, G.A., HONG, H.L., DIETER, M.P., HAYES, H.T., POHLAND, A.E.,
STACK, M. & LUSTER, M.I. (1984). Myelotoxicity and macrophage
alteration in mice exposed to ochratoxin A. Toxicol. Appl.
Pharmacol., 72, 304-312.
CAMPBELL, M.L.,JR, MAY, J.D., HUFF, W.E. & DOERR, J.A. (1983).
Evaluation of immunity of young broiler chickens during simultaneous
aflatoxicosis and ochratoxicosis. Poult. Sci., 62, 2138-2144.
CASTEGNARO, M. & CHERNOZEMSKY, I. (1987). Endemic nephropathy and
urinary tract tumors in the Balkans. Cancer Res., 47, 3608-3609.
CHAKOR, K., CREPPY, E.E., & DIRHEIMER, G. (1988). In vivo studies
on the relationship between hepatic metabolism and toxicity of
ochratoxin A. Arch. Toxicol., Suppl., 12, 201-204.
COORAY, R. (1984). Effects of some mycotoxins on mitogen-induced
blastogenesis and SCE frequency in human lymphocytes. Food Chem.
Toxicol., 22, 529-534.
CREPPY, E.E., LUGNIER, A.A.J., BECK, G., RÖSCHENTHALER, R. &
DIRHEIMER, G. (1979a). Action of ochratoxin A on cultured hepatoma
cells reversion of inhibition by phenylalanine. FEBS Lett., 104,
287-290.
CREPPY, E.E., LUGNIER, A.A.J., FASOLO, F., HELLER, K.,
RÖSCHENTHALER, R. & DIRHEIMER, G. (1979b). In vitro inhibition of
yeast phenylalanyl-tRNA synthetase by ochratoxin A. Chem. Biol.
Interact., 24, 257-262.
CREPPY, E.E., LORKOWSKI, G., BECK, G., RÖSCHENTHALER, R. &
DIRHEIMER, G. (1980a). Combined action of citrinin and ochratoxin A
on hepatoma tissue culture cells. Toxicol. Lett., 5, 375-380.
CREPPY, E.E., SCHLEGEL, M., RÖSCHENTHALER, R. & DIRHEIMER, G.
(1980b). Phenylalanine prevents acute poisoning by ochratoxin A in
mice. Toxicol. Lett., 6, 77-80.
CREPPY, E.E., LORKOWSKI, G., RÖSCHENTHALER, R. & DIRHEIMER, G.
(1982). Kinetics of the immunosuppressive action of ochratoxin A on
mice. In: Proceedings, V International IUPAC Symposium Mycotoxins
and Phycotoxins, September 1-3, 1982, Vienna, pp. 289-292.
Austrian Chem. Soc., Vienna.
CREPPY, E.E., KERN, D., STEYN, P.S., VLEGGAAR, R., RÖSCHENTHALER, R.
& DIRHEIMER, G. (1983a). Comparative study of the effect of
ochratoxin A analogues on yeast aminoacyl-tRNA synthetases and on
the growth and protein synthesis of hepatoma cells. Toxicol.
Lett., 19, 217-224.
CREPPY, E.E., STORMER, F.C., KERN, D., RÖSCHENTHALER, R. &
DIRHEIMER, G. (1983b). Effect of ochratoxin A metabolites on yeast
phenylalanyl-tRNA synthetase and on the growth and in vivo protein
synthesis of hepatoma cells. Chem. Biol. Interact., 47, 239-247.
CREPPY, E.E., STORMER, F.C., RÖSCHENTHALER, R. & DIRHEIMER, G.
(1983c). Effects of two metabolites of ochratoxin A, (43)-4-hydroxy
ochratoxin A and ochratoxin-alpha, on immune response in mice.
Infect. Immun., 39, 1015-1018.
CREPPY, E.E., RÖSCHENTHALER, R. & DIRHEIMER, G. (1984). Inhibition
of protein synthesis in mice by ochratoxin A and its prevention by
phenylalanine. Food Chem. Toxicol., 22, 883-886.
CREPPY, E.E., KANE, A., DIRHEIMER, G., LAFARGE-FRAYSSINET, C.,
MOUSSET, S., & FRAYSSINET, C. (1985). Genotoxicity of ochratoxin A
in mice: DNA single-strand break evaluation in spleen, liver and
kidney. Toxicol. Lett., 28, 29-35.
DWIVEDI, P. & BURNS,R.B. (1984a). Pathology of ochratoxicosis A in
young broiler chicks. Res. Vet. Sci., 36, 92-103.
DWIVEDI, P. & BURNS, R.B. (1984b). Effect of ochratoxin A on
immunoglobulins in broiler chicks. Res. Vet. Sci., 36, 117-121.
ELLING, F. (1979a). Enzyme histochemical studies of ochratoxin
A-induced mycotoxic porcine nephropathy. (abstract). In: 6th
International Symposium Animal, Plant Microbial Toxins. Vol 17.
ELLING, F. (1979b). Ochratoxin A-induced mycotoxic porcine
nephropathy: alterations in enzyme activity in tubular cells. Acta
Pathol. Microbiol. Scand., 87, 237-243.
ELLING, F. (1983). Feeding experiments with ochratoxin
A-contaminated barley to bacon pigs. IV. Renal lesions. Acta.
Agric. Scand., 33, 153-159.
ELLING, F., NIELSEN, J.P., LILLEHOJ, E.B., THOMASSEN, M.S. &
STORMER, F.C. (1985). Ochratoxin A-induced porcine nephropathy:
enzyme and ultrastructure changes after short-term exposure.
Toxicol., 23, 247-254.
ENDOU, H., KOSEKI, C., YAMADA, H. & OBARA, T. (1986). Evaluation of
nephrotoxicity using isolated nephron segments. Dev. Toxicol.
Environ. Sci., 14, 207-216.
FRIIS, C., BRINN, R., & HALD, B. (1988). Uptake of ochratoxin A by
slices of pig kidney cortex. Toxicology, 52, 209-217.
FUCHS, R., RADI, B., PERAICA, M., HULT, K. & PLESTINA, R. (1988).
Enterohepatic circulation of ochratoxin A in rats. Period. Biol.,
90, 39-42.
FUKAL, L. & REISNEROVA, H. (1990). Monitoring of aflatoxins and
ochratoxin A in Czechoslovak human sera by immunoassay. Bull.
Environ. Contam. Toxicol., 44, 345-349.
FUKUI, Y., HOSHINO, K., KAMEYANA, Y., YASUI, T., TODA, C. & NAGANO,
H. (1987). Placental transfer of ochratoxin A and its cytotoxic
effect on the mouse embryonic brain. Food Chem. Toxicol., 25,
17-24.
GALTIER, P. (1978). Contribution of pharmacokinetic studies to
mycotoxicology - ochratoxin A. Vet. Sci. Commun., 1, 349-358.
GALTIER, P., CHARPENTEAU, J.L., ALVINERIE, M. & LABOUCHE, C. (1979).
The pharmacokinetic profile of ochratoxin A in the rat after oral
and intravenous administration. Drug Metabol. Dispos., 7,
429-434.
GALTIER, P., CAMGUILHEM, R. & BODIN, G. (1980). Evidence for in
vitro and in vivo interaction between ochratoxin A and three
acidic drugs. Food Cosmet. Toxicol., 18, 493-496.
GALTIER, P., ALVINERIE, M. & CHARPENTEAU, J.L. (1981). The
pharmacokinetic profiles of ochratoxin A in pigs, rabbits and
chickens. Food Cosmet. Toxicol., 19, 735-738.
GAREIS, M., MÄRTLBAUER, E., BAUER, J. & GEDEK, B. (1988). Bestimmung
von Ochratoxin A in Muttermilch. Z. Lebensm. Unters. Forsch., 186,
114-117.
GOLINSKI, P. & GRABARKIEWICZ-SZCZESNA, J. (1989). A trial of
determination of the daily dose of ochratoxin A consumed by humans in
Poland. Rocz. Panstw. Zakl. Hig., 40, 50-52. (in Polish]
HAGELBERG, S., HULT, K. & FUCHS, R. (1989). Toxicokinetics of
ochratoxin A in several species and its plasma-binding properties.
J. Appl. Toxicol., 9, 91-96.
HALD, B. (1989). Human exposure to ochratoxin A. Bioact. Molec.,
10, 57-67.
HANSEN, C.E., DUELAND, S., DREVON, C.A. & STORMER, F.C. (1982).
Metabolism of ochratoxin A by primary cultures of rat hepatocytes.
Appl. Environ. Microbiol., 43, 1267-1271.
HARVEY, R.B., KUBENA, L.F., NAQI, S.A., GYIMAH, J.E., CORRIER, D.E.,
PANIGRAHY, B. & PHILLIPS, T.D. (1987b). Immunologic effects of low
levels of ochratoxin A in ovo: utilization of a chicken embryo
model. Avian Dis., 31, 787-791.
HARWIG, J., KUIPER-GOODMAN, T. & SCOTT, P.M. (1983). Microbial food
toxicants: ochratoxins. In: Handbook of Foodborne Diseases of
Biological Origin. (M. Rechcigl, Ed.), pp 193-238. CRC Press, Boca
Raton, FL.
HATEY, F. & GALTIER, P. (1977). Toxicité a court terme de
l'ochratoxine A chez le rat; quelques manifestations biochimiques de
l'intoxication. Ann. Rech. Vét., 8, 7-12.
HAUBECK, H.D., LORKOWSKI, G., KOLSH, E. & RÖSCHENTHALER, R. (1981).
Immunosuppression by ochratoxin A and its prevention by phenylalanine.
Appl. Environ. Microbiol., 41, 1040-1042.
HOLMBERG, T., THUVANDER, A. & HULT, K. (1988). Ochratoxin A as a
suppressor of mitogen-induced blastogenesis of porcine blood
lymphocytes. Acta Vet. Scand., 29, 219-223.
HONG, H.H.L., JAMESON, C.W. & BOORMAN, G.A. (1988). Residual
haematopoietic effect in mice exposed to ochratoxin A prior to
irradiation. Toxicology, 53, 57-67.
HULT, K., TEILING, A. & GATENBECK, S. (1976). Degradation of
ochratoxin A by a ruminant. Appl. Environ. Microbiol., 32, 443-444.
HULT, K., HÖKBY, E., HÄGGLUND, U., GATENBECK, S., RUTQVIST, L. &
SELLYEY, G. (1979). Ochratoxin A in pig blood: method of analysis and
use as a tool for feed studies. Appl. Environ. Microbiol., 38,
772-776.
HULT, K., PLESTINA, R., HABAZIN-NOVAK, V., RADI, B. & CEOVI, S.
(1982). Ochratoxin A in human blood and Balkan endemic nephropathy.
Arch. Toxicol., 51, 313-321.
HULT, K. & FUCHS, R. (1986). Analysis and dynamics of ochratoxin A in
biological systems. In: Mycotoxins and Phycotoxins. Sixth
International IUPAC Symposium Mycotoxins and Phycotoxins. Pretoria,
Rep. of South Africa, July 22-25, 1985. (P.S. Steyn and R. Vleggaar,
Eds.), pp. 365-376. Elsevier Science Publishers B.V., Amsterdam.
IARC (International Agency for Research on Cancer). (1976).
Ochratoxin A. In: IARC Monographs on the Evaluation of Carcinogenic
Risk of Chemicals to Man. Vol. 10. Some Naturally Occurring
Substances pp.191-197. International Agency for Research on Cancer,
Lyon, France.
JUNG, K.Y., & ENDOU, H. (1989). Nephrotoxicity assessment by
measuring cellular ATP content. II. Intranephron site of ochratoxin A
nephrotoxicity. Toxicol. Appl. Pharmacol., 100, 383-390.
KANE, A., CREPPY, E.E., Röschenthaler, R. & Dirheimer, G. (1986a).
Changes in urinary and renal tubular enzymes caused by subchronic
administration of ochratoxin A in rats. Toxicology, 42, 233-243.
KANE, A., CREPPY, E.E., ROTH, A., RÖSCHENTHALER, R. & DIRHEIMER, G.
(1986b). Distribution of the [H3]-label from low doses of
radioactive ochratoxin A ingested by rats, and evidence for DNA
single-strand breaks caused in liver and kidneys. Arch. Toxicol.,
58, 219-224.
KANISAWA, M., SUZUKI, S., KOZUKA, Y. & YAMAZAKI, M. (1977).
Histopathological studies on the toxicity of ochratoxin A in rats 1.
Acute oral toxicity. Toxicol. Appl. Pharmacol., 41, 55-64.
KANISAWA, M. & SUZUKI, S. (1978). Induction of renal and hepatic
tumors in mice by ochratoxin A; a mycotoxin. Gann., 69, 599-600.
KANISAWA, M., SUZUKI, S. & MOROI, K. (1979). Ochratoxin-alpha, is it
an inducing factor of acute enteritis by ochratoxin A? In: 6th
International Symposium Animal, Plant, Microbial Toxins, Uppsala,
Sweden.
KANISAWA, M. (1984). Synergistic effect of citrinin on hepatorenal
carcinogenesis of OA in mice. In: Toxigenic Fungi - Their Toxins and
Health Hazard (H. Kurata and Y. Ueno, Eds.), pp. 245-254. Kodansha,
Tokyo and Elsevier, Amsterdam.
KIESSLING, K.H., PETTERSSON, H., SANDHOLM, K. & OLSEN, M. (1984).
Metabolism of aflatoxin, ochratoxin, zearalenone, and three
trichothecenes by intact rumen fluid, rumen protozoa, and rumen
bacteria. Appl. Environ. Microbiol., 47, 1070-1073.
KIHARA, T., NAKAGAWA, K., YAMAMOTO, Y. & TANIMURA, T. (1984).
Behavioural teratological study of rat offspring exposed to ochratoxin
A in utero by using cross-fostering. (abstract). Teratology, 30,
10A.
KITCHEN, D.N., CARLTON, W.W. & HINSMAN, E.J. (1977a). Ochratoxin A
and citrinin induced nephrosis in beagle dogs III. Terminal renal
ultrastructural alterations. Vet. Pathol., 14, 392-406.
KITCHEN, D.N., CARLTON, W.W. & TUITE, J. (1977b). Ochratoxin A and
citrinin induced nephrosis in beagle dogs. I. Clinical and
clinicopathological features. Vet. Pathol., 14, 154-172.
KITCHEN, D.N., CARLTON, W.W. & TUITE, J. (1977c). Ochratoxin A and
citrinin induced nephrosis in beagle dogs. II. Pathology. Vet.
Pathol., 14, 261-272.
KONRAD, I. & RÖSCHENTHALER, R. (1977). Inhibition of phenylalanine
tRNA synthetase from Bacillus subtillis by ochratoxin A. FEBS
Lett., 83, 341-347.
KROGH, P. & ELLING, F. (1977). Mycotoxic nephropathy. Vet. Sci.
Commun., 1, 51-63.
KROGH, P., GYRD-HANSEN, N., HALD, B., LARSEN, S., NEILSEN, J.P.,
SMITH, M., IVANOFF, C. & MEISNER, H. (1988). Renal enzyme activities
in experimental ochratoxin A-induced porcine nephropathy: diagnostic
potential of phosphoenolpyruvate carboxykinase and gamma-glutamyl
transpeptidase activity. J. Toxicol. Environ. Health, 23, 1-14.
KUCZUK, M.H., BENSON, P.M., HEATH, H. & HAYES, W. (1978). Evaluation
of the mutagenic potential of mycotoxins using Salmonella typhimurium
and Saccharomyces cerevisiae. Mutat. Res., 53,11-20.
KUIPER-GOODMAN, T. & SCOTT, P.M. (1989). Risk Assessment of the
Mycotoxin Ochratoxin A. Biomed. Environ. Sci., 2, 179-248.
KUMAGAI, S. & AIBARA, K. (1982). Intestinal absorption and secretion
of ochratoxin A in the rat. Toxicol. Appl. Pharmacol., 64, 94-102.
KUMAGAI, S. (1985). Ochratoxin A: plasma concentration and excretion
into bile and urine in albumin-deficient rats. Food Chem. Toxicol.,
23, 941-943.
KUMAGAI, S. (1988). Effects of plasma ochratoxin A and luminal pH on
the jejunal absorption of Ochratoxin A in rats. Food Chem. Toxicol.,
26, 753-758.
LEA, T., STEIEN, K. & STORMER, F.C. (1989). Mechanism of Ochratoxin
A induced immunosuppression. Mycopathologia., 107, 153-160.
LUSTER, M.I., GERMOLEC, D.R., BURLESON, G.R., JAMESON, C.W.,
ACKERMANN, M.F., LAMM, K.R. & HAYES, H.T. (1987). Selective
immunosuppression in mice of natural killer cell activity by
ochratoxin A. Cancer Res., 47, 2259-2263.
MADSEN, A., MORTENSEN, H.P. & HALD, B. (1982). Feeding experiments
with ochratoxin A contaminated barley for bacon pigs. I. Influence on
pig performance and residues. Acta Agric. Scand., 32, 225-239.
MANOLOVA, Y., MANOLOV, G., PARVANOVA, L., PETKOVA-BOCHAROVA, T.,
CASTEGNARO, M. & CHERNOZEMSKY, I.N. (1990). Induction of
characteristic chromosomal aberrations, particularly x-trisomy, in
cultured human lymphocytes treated by ochratoxin A; a mycotoxin
implicated in Balkan endemic nephropathy. Mutat. Res., in press.
MEISNER, H. & SELANIK, P. (1979). Inhibition of renal gluconeogenesis
in rats by ochratoxin. Biochem. J., 180, 681-684.
MEISNER, H., CIMBALA, M.A. & HANSON, R.W. (1983). Decrease of renal
phospho-enolpyruvate carboxykinase RNA and poly(A) RNA level by
ochratoxin A. Arch. Biochem. Biophys., 223, 264-270.
MEISNER, H. & KROGH, P. (1986). Phosphoenolpyruvate carboxykinase as
a selective indicator of ochratoxin A induced nephropathy. Dev.
Toxicol. Environ. Sci., 14, 199-206.
MEISNER, H. & POLSINELLI, L. (1986). Changes in renal mRNA species
abundance by ochratoxin A. Biochem. Pharmacol., 35, 661-665.
MORÉ, J. & GALTIER, P. (1974). Toxicité de l'ochratoxine A. I. Effet
embryotoxique et tératogène chez le rat. Ann. Réch. Vet., 5,
167-178.
MORÉ, J. & GALTIER, P. (1975). Toxicité de l'ochratoxine A. II.
Effets du traitement sur la descendance (F1 et F2) de rattes
intoxiquées. Ann. Rech. Vét., 6, 379-389.
MORI, H., KAWAI, K., OHBAYASHI, F., KUNIYASU, T., YAMAZAKI, M.,
HAMASAKI, T. & WILLIAMS, G.M. (1984). Genotoxicity of a variety of
mycotoxins in the hepatocyte primary culture/DNA repair test using rat
and mouse hepatocytes. Cancer Res., 44, 2918-2923.
MOROI, K., SUZUKI, S., KUGA, T., YAMAZAKI, M. & KANISAWA, M. (1985).
Reduction of ochratoxin A toxicity in mice treated with phenylalanine
and phenobarbital. Toxicol. Lett., 25, 1-5.
MORTENSEN, H.P., HALD, B., LARSEN, A.E. & MADSEN, A. (1983a).
Ochratoxin A contaminated barley for sows and piglets. Pig performance
and residues in milk and pigs. Acta Agric. Scand., 33, 349-352.
MORTENSEN, H.P., HALD, B. & MADSEN, A. (1983b). Feeding experiments
with ochratoxin A contaminated barley for bacon pigs. 5. Ochratoxin A
in pig blood. Acta Agric. Scand., 33, 235-239.
MUNRO, I.C., MOODIE, C.A., KUIPER-GOODMAN, T., SCOTT, P.M. & GRICE,
H.C. (1974). Toxicologic changes in rats fed graded dietary levels of
ochratoxin A. Toxicol. Appl. Pharmacol., 28, 180-188.
NGAHA, E.O. (1985). Biochemical changes in the rat during
experimentally induced acute ochratoxicosis. Enzyme, 33, 1-8.
NTP (1989). NTP technical report on the toxicology and carcinogenesis
studies of ochratoxin A (CAS NO. 303-47-9) in F344/N rats (gavage
studies). NIH Publication No. 88-2813 (G. Boorman, Ed.), U.S.
Department of Health and Human Services National Institutes of Health,
Research Triangle Park, NC.
PARKER, R.W., PHILLIPS T.D., KUBENA, L.F., RUSSELL, L.H. &
HEIDELBAUGH, N.D. (1982). Inhibition of pancreatic carboxypeptidase
A: a possible mechanism of interaction between penicillic acid and
ochratoxin A. J. Environ. Sci. Health, B17, 77-91.
PATTERSON, D.S.P., ROBERTS, B.A. & SMALL, B.J. (1976). Metabolism of
ochratoxins A and B in the pig during early pregnancy and the
accumulation in body tissue of ochratoxin A only. Food Cosmet.
Toxicol., 14, 439-442.
PETKOVA-BOCHAROVA, T., CHERNOZEMSKY, I.N. & CASTEGNARO, M. (1988).
Ochratoxin A in human blood in relation to Balkan endemic nephropathy
and urinary system tumours in Bulgaria. Food Addit. Contam., 5,
299-301.
PETTERSSON, H., KIESSLING, K.H. & CISZUK, P. (1982). Degradation of
ochratoxin A in rumen. In: Proceedings, V International IUPAC
Symposium Mycotoxins Phycotoxins, September 1-3, 1982, Vienna,
Austria, pp. 313-316. Austrian Chem. Soc., Vienna.
PITOUT, M.J. (1969a). The hydrolysis of ochratoxin A by some
proteolytic enzymes. Biochem. Pharmacol., 18, 485-491.
PITOUT, M.J. (1969b). A rapid spectrophotometric method for the assay
of carboxypeptidase A. Biochem. Pharmacol., 18, 1829-1836.
PITOUT, M.J. & NEL, W. (1969). The inhibitory effect of ochratoxin A
on bovine carboxypeptidase A in vitro. Biochem. Pharmacol., 18,
1837-1843.
PRIOR, M.G. & SISODIA, C.S. (1982). The effects of ochratoxin A on
the immune response of Swiss mice. Can. J. Comp. Med., 46, 91-96.
RADOVANOVIC, Z (1989). Aetiology of Balkan nephropathy: a reappraisal
after 30 years. Europ. J. Epidemiol., 5, 372-376.
RAO, C.N. (1987). Obstructive uropathy in group caged male B6C3F1
mice on a 24-month carcinogenicity study. (letter). Lab. Anim. Sci.,
37, 8-9.
REISS, J. (1986). Detection of genotoxic properties of mycotoxins
with the SOS chromotest. Naturwiss., 73, 677-678.
RÖSCHENTHALER, R., CREPPY, E.E. & DIRHEIMER, G. (1984). Ochratoxin A:
On the mode of action of a ubiquitous mycotoxin. J. Toxicol., 3,
53-86.
ROTH, A., CHAKOR, K., CREPPY, E.E., KANE, A., RÖSCHENTHALER, R. &
DIRHEIMER, G. (1988). Evidence for an enterohepatic circulation of
ochratoxin A in mice. Toxicology, 48, 293-308.
ROTH, A., CREPPY, E.E., KANE, A., BACHA, H., STEYN, P.S.,
RÖESCHENTHALER, R. & DIRHEIMER, G. (1989). Influence of ochratoxin B
on the ochratoxin A inhibition of phenylalanyl-tRNA formation in
vitro and protein synthesis in hepatoma tissue culture cells.
Toxicol. Lett., 45, 307-313.
RUPI, V., LIKER, B., MUZI, S., BOGDANI, I.C. & BALZER, I. (1978).
The effects of ochratoxin A in feed on the blood content of lipids and
proteins in chickens. Arh. Hig. Rada. Toxsikol., 29, 139-145. [in
Serbo-Croatian]
SINGH, J. & HOOD, R.D. (1985). Maternal protein deprivation enhances
the teratogenicity of ochratoxin A in mice. Teratology, 32,
381-388.
SOKOL, P.P., RIPICH, G., HOLOHAN, P.D. & ROSS, C.R. (1988). Mechanism
of ochratoxin A transport in kidney. J. Pharmacol. Exp. Ther., 246,
460-465.
SREEMANNARAYANA, O., FROHLICH, A.A., VITTI, T.G., MARQUARDT, R.R. &
ABRAMSON, D. (1988). Studies of the tolerance and disposition of
ochratoxin A in young calves. Anim. Sci., 66, 1703-1711.
STEIN, A.F., PHILLIPS, T.D., KUBENA, L.F. & HARVEY, R.B. (1985).
Renal tubular secretion and reabsorption as factors in ochratoxicosis:
Effects of probenecid on nephrotoxicity. J. Toxicol. Environ.
Health, 16, 593-605.
STETINA, R. & VOTAVA, M. (1986). Induction of DNA single-strand
breaks and DNA synthesis inhibition by patulin, ochratoxin A,
citrinin, and aflatoxin B, in cell lines CHO and AWRF. Folia Biol.,
32, 128-144.
STOJKOVI, R., HULT, K., GAMULIN, S. & PLESTINA, R. (1984). High
affinity binding of ochratoxin A to plasma constituents.
Biochem.Intern., 9, 33-38.
STONARD, M.D., GORE, C.W., OLIVER, G.J.A. & SMITH, I.K. (1987).
Urinary enzymes and protein patterns as indicators of injury to
different regions of the kidney. Fund. Appl. Toxicol., 9, 339-351.
STOREN, O., HELGERUD, P., HOLM, H. & STORMER, F.C. (1982a). Formation
of (43)-4-hydroxyochratoxin A and ochratoxin B from ochratoxin A by
rats. In: Proceedings, V International IUPAC Symposium Mycotoxins and
Phycotoxins, September l-3,1982, Vienna, Austria, pp. 321-324.
Austrian Chem. Soc., Vienna.
STOREN, O., HOLM, H. & STORMER, F.C. (1982b). Metabolism of
ochratoxin A by rats. Appl. Environ. Microbiol., 44, 785-789.
STORMER, F.C., HANSEN, C.E., PEDERSEN, J.I., HVISTENDAHL, G. & AASEN,
A.J. (1981). Formation of (4R)- and (4S)-4-hydroxyochratoxin A from
ochratoxin A by liver microsomes from various species. Appl.
Environ. Microbiol., 42, 1051-1056.
STORMER, F.C., STOREN, O., HANSEN, C.E., PEDERSEN, J.I. & AASEN, A.J.
(1983). Formation of (4R)- and (4S)-4-hydroxchratoxin A and
10-hydroxyochratoxin A from ochratoxin A by rabbit liver miyorosomes.
Appl. Environ. Microbial., 45, 1183-1187.
STORMER, F.C., KOLSAKER,P., HOLM, H., ROGSTAD, S. & ELLING, F. (1985).
Metabolism of ochratoxin B and its possible effects upon the
metabolism and toxicity of ochratoxin A in rats. Appl. Environ.
Microbial., 49, 1108-1112.
SUBRAMANIAN, S., KANTHASAMY, A., BALASUBRAMANIAN, N., SEKAR, N. &
GOVINDASAMY, S. (1989). Ochratoxin A toxicity on carbohydrate
metabolism in rats. Bull. Environ. Contam. Toxicol., 43, 180-184.
SUZUKI, S., KOZUKA, Y., SATOH, T. & YAMAZAKI, M. (1975). Studies on
the nephrotoxicity of ochratoxin A in rats. Toxicol. Appl.
Pharmacol., 34, 479-490.
SUZUKI, S., SATOH, T. & YAMAZAKI, M. (1977). The pharmacokinetics of
ochratoxin A in rats. Jpn. J. Pharmacol., 27, 735-744.
SUZUKI, S., MOROI, K., KANISAWA, M. & SATOH, T. (1986). Effects of
drug metabolizing enzyme inducers on carcinogenesis and toxicity of
ochratoxin A in mice (abstract). Toxicol. Lett., 31(suppl.), 206.
UUENO, Y., AND KUBOTA, K. (1976). DNA-attacking ability of
carcinogenic mycotoxins in recombination-deficient mutant cells of
Bacillus subtillis. Cancer Res., 36, 445-451.
UMEDA, M., TSUTSUI, T., & SAITO, M. (1977). Mutagenicity and
inducibility of DNA single-strand breaks and chromosome aberrations by
various mycotoxins. Gann, 68, 619-625.
WARD, J.M., GOODMAN, D.G., SQUIRE, R.A., CHU, K.C. & LINHART, M.S.
(1979). Neoplastic and nonneoplastic lesions in aging (C57BL/6N x
C3H/HeN)F1 (B6C3F1) mice. J. Nat. Cancer Inst., 63, 849-854.
WEHNER, F.C., THIEL, P.G., VAN RENSBURG, S.J., & DEMASIUS, I.P.C.
(1978). Mutagenicity to Salmonella typhimurium of some Aspergillus
and Penicillium mycotoxins. Mutat. Res., 58, 193-203.
R1 R2 R3 R3 R5
Phenylalanyl Cl H H H Ochratoxin A
Phenylalanyl H H H H Ochratoxin B
Phenylalanyl ethyl ester Cl H H H Ochratoxin C
Phenylalanyl methyl ester Cl H H H Ochratoxin A methyl ester
Phenylalanyl methyl ester H H H H Ochratoxin B methyl ester
Phenylalanyl ethyl ester H H H H Ochratoxin B ethyl ester
OH Cl H H H Ochratoxin alpha
OH H H H H Ochratoxin ß
Phenylalanyl Cl H OH H 4R-Hydroxyochratoxin A
Phenylalanyl Cl OH H H 4S-Hydroxyochratoxin A
Phenylalanyl Cl H H OH 10-Hydroxyochratoxin A
Fig. 1 Chemical structures of ochratoxin A and related metabolites
2.1.1.1 Absorption
It has been suggested that in most species OA is absorbed from
the stomach, aided by the acidic properties of the mycotoxin
(pKa=7.1) (Galtier, 1978; Roth et al., 1988).
However, in studies with ligated gastro-intestinal loops, the
small intestine was found to be the major site of absorption, with
maximal absorption from the proximal jejunum. Absorption from the
jejunum can take place against a concentration gradient, and is
dependent on the pH at the mucosal surface of the jejunum. OA so
transferred is in lipid soluble, non-ionized form (Kumagai & Aibara,
1982; Kumagai, 1988).
Recent studies, with a low dose of 3H-OA given by intubation
to mice, were interpreted by the authors as indicating rapid
absorption of OA from the stomach (Roth et al., 1988), but the
reviewers felt that the data could also be interpreted as supporting
intestinal absorption of OA as the major route, based on rapid
transit of OA from the stomach to the intestine. These authors also
found that secondary distribution peaks of OA in the intestinal
content and serum may be a consequence of enterohepatic circulation
since the biliary excretion of OA is very efficient (Roth et al.,
1988, Fuchs et al., 1988).
The overall percentage of OA absorbed is 66%, 56%, 56%, and
40%, respectively, for the pig, rat, rabbit and chicken (Galtier et
al., 1981; Suzuki et al., 1977).
Phenylalanine, given to mice by gavage together with OA in a
10:1 molar ratio, appeared to increase absorption of OA from the
stomach and intestine, and increase gastrointestinal transit. This
resulted in 8-fold and 4-fold higher levels of OA in serum and
liver, respectively, during the first 12 hours (Roth et al.,
1988).
OA that has been transferred across the intestinal mucosa
reaches the liver via the portal vein (Kumagai & Aibra, 1982; Storen
et al., 1982a).
Its relative bioavailability, estimated from a comparison of
the maximal serum concentration after oral and intravenous exposure,
was estimated to be very low in fish, but 44 and 97% for several
mammalian species investigated (Hagelberg et al., 1989).
Once it reaches the blood, OA readily binds to serum albumin
(Galtier et al., 1980), and other serum macromolecules (Hult &
Fuchs, 1986). Red blood cells contained only traces of OA (Galtier,
1978).
The association constants for OA binding to serum albumins were
7.1 x 10⁴ M-1, 5.1 x 10⁴ M-1 and 4.0 x 10⁴ M-1 for porcine,
chicken and rat albumins respectively (Galtier et al., 1981).
The fraction of OA bound to serum albumin and other serum
macromolecules constitutes a mobile reserve of mycotoxin which can
be available for release to the tissues for a long time (Galtier,
1978;; Hult et al., 1982).
Studies with albumin deficient rats have shown that the primary
effect of OA binding or serum albumin is to retard its elimination
by limiting transfer of OA from the blood stream to hepatic and
renal cells (Kumagai, 1985).
In studies on the stability of OA bound to porcine albumin, the
acidic drug phenylbutazone displaced OA from serum albumin so that
more free toxin was available. In vivo studies in male rats
showed greater toxicity of OA in the presence of phenylbutazone,
with a significant decrease in the LD50 value from 33.4 to 21.1
mg/kg bw (Galtier et al., 1980).
OA was found to have higher affinity for an as yet
unidentified serum macromolecule (MW=20,000) with association
constants of 2.3 x 10¹⁰ M-1 and 0.59 x 10¹⁰ M-1 in human and
porcine sera respectively. Saturation of this specific binding
macromolecule occurs at low levels of OA, 10 to 20 ng per ml serum.
Significant serum albumin binding takes place at higher
concentrations of OA, with saturation taking place above several
hundred µg of OA per ml serum (Stojkovic et al., 1984; Hult &
Fuchs, 1986).
Binding constants of OA to two identified plasma proteins and
the fraction of unbound toxin in the sera of different species were
also determined. The latter values were 0.02% (man, rat), 0.08%
(monkey), 0.1% (mouse, pig), and 22% (fish) (Hagelberg et al.,
1989).
2.1.1.2 Tissue residues and half lives of OA in various species
Once OA has been absorbed, tissue and plasma residues of OA and
its metabolites depend on a number of factors such as: the length of
time of feeding, the dose, the use of naturally contaminated grain
versus crystalline OA, the route, the degree of serum binding, the
half life of OA, and the length of time on an OA-free diet prior to
sacrifice. These factors are of importance in assessing data on the
natural occurrence of residues in animal tissues (Kuiper-Goodman &
Scott, 1989).
With a single oral exposure, maximum serum levels of OA were
found within 10 to 48 hours in the pig and rat (Mortensen et al.,
1983b; Suzuki et al., 1977; Galtier, 1978; Galtier et al.,
1981), at 2 to 4 hours in the ruminant calf (Sreemannarayana et
al., 1988), and more rapidly in rabbits and chickens, 1 and 0.33
hrs, respectively (Galtier et al., 1981). Maximum tissue residues
were also found within 48 hours in the rat.
Wide species differences in the serum half life of OA have been
reported. After oral administration in the monkey (Macaca mulata),
510 hr (Hagelberg et al., 1989), in the pig, 72-120 hours (Galtier
et al., 1981; Mortensen et al., 1983a), in the pre-ruminant calf
77 hours (Sreemannarayana et al., 1988), in rats 55-120 hours
(Galtier et al., 1979; Ballinger et al., 1986; Hagelberg et
al., 1989), in mice 24-39 hours (Fukui et al., 1981), in quail
6.7 hours (Hagelberg et al., 1989) and in chickens 4.1 hour
(Galtier et al., 1981).
In the above species which were so tested, the serum half life
was longer after intravenous administration of OA (Hagelberg et
al., 1989). Differences in serum half life could be related in
part to differences in absorption (Galtier et al., 1981);
differences in peak plasma values (see above); and species
differences in degree of binding to serum macromolecules, including
albumin.
The disappearance rate of OA from blood was slower than from
kidney, liver and other tissues in the pig (Hult et al., 1979).
Whole body autoradiography using a single i.v. dose of 14C-
labeled OA in mice (approximately 200 µg/kg bw), showed that OA
persisted for a long time (> 4 days) in the blood. This was
attributed to OA being present mainly in bound form at this low dose
level (Fuchs et al., 1988).
Preliminary observations indicated no specific binding of OA to
macromolecules in porcine kidney cytosol (Stojkovic et al., 1984).
Tissue distribution in pigs, rats, chickens and goats generally
follows the order kidney > liver > muscle > fat (Harwig et al.,
1983), or in some recent studies kidney > muscle > liver > fat
(Mortensen et al., 1983b; Madsen et al., 1982).
Very few data are available on the metabolic disposition of OA
in humans. It has been suggested that OA in humans has a long serum
half life, based on the strong binding of OA to human serum
macromolecules (Bauer & Gareis, 1987; Hagelberg et al., 1989).
2.1.1.3 Excretion
Both biliary excretion and glomerular filtration play an
important role in the plasma clearance in OA in rats. This can be
related to its molecular weight of 403.8, since for this species
both pathways are used for substances with molecular weights between
350 and 450. Thus in the rat both the urinary and faecal excretory
routes are important, the relative contribution of each depending on
factors such as route of administration and dose (Kuiper-Goodman &
Scott, 1989).
With different species the relative contribution of each
excretory route is also influenced by the degree of serum
macromolecular binding and differences in degree of enterohepatic
recirculation of OA (Hagelberg et al., 1989).
In rats, the major excretory products were Oalpha (Fig. 1)
(both in urine and foeces), OA and the 4R-OH-OA epimer, and in the
urine these represented 25-27%, 6%, and 1-1.5% of the administered
dose respectively (Storen et al., 1982b).
Up to 33% of radioactivity of an orally administered dose of OA
was excreted into the bile of rats up to 6 hours after dosing; only
trace amounts of Oalpha were detected in the bile (Suzuki et al.,
1977).
Biliary excretion of OA was increased and urinary excretion of
OA and Oalpha was decreased in mice pretreated with phenobarbital
(Moroi et al., 1985).
When OA was administered to rats by i.p. injection, only traces
of OA and Oalpha were identified in faeces, whereas after oral
administration 12% and 9% of OA and Oalpha were found in faeces
(Storen et al., 1982b).
In pre-ruminant and ruminant calves 85-90% of orally
administered OA was excreted as Oalpha, most of it in the urine
(Sreemannarayana et al., 1988).
2.1.1.4 Metabolic Disposition during pregnancy
2.1.1.4.1 Mouse
Whole body autoradiography studies by i.v. route, using high
doses of 14C-labeled OA, showed that OA could cross the placenta
more readily at days 8 and 9 than at day 10 of gestation, with
radioactive label appearing within 20 minutes in the uterine wall,
placental and fetal tissues. OA given to mice later during
gestation (day 17) resulted in very low fetal radioactive label
(Appelgren & Arora, 1983a, 1983b).
Differences in fetal uptake of OA during different times of
gestation were suggested to be due to differences in the placenta,
which was considered to be completely developed by day 9 of
gestation. After i.p. injection of OA at days 11 or 13 of
gestation, fetal residues appeared more slowly, and reached maximum
values at 30 to 48 hours after dosing. Residues in the placenta
were high around 2 to 6 hours after injection and then decreased
more slowly than from other tissues. Serum half lives of OA were 29
and 24 hours at days 11 and 13 of gestation respectively. The
authors considered the embryo as a "deep compartment" (Fukui et
al., 1987).
2.1.1.4.2 Rat
3H-labeled OA given s.c. to rats at day 12 of gestation also
showed a delayed fetal uptake of OA, with maximum residues appearing
at 48 to 72 hours after dosing, and representing approximately 0.1%
of the administered dose (Ballinger et al., 1986).
2.1.1.4.3 Pig
OA given at 0.38 mg/kg bw to pregnant sows from day 21 to 28 of
pregnancy did not cross the placenta (Patterson et al., 1976).
Similarly, no residues were found in piglets when low levels of
OA, 7-16 µg/kg bw, were fed during the whole period of gestation
(Mortensen et al., 1983a).
However, in more recent studies, in utero transmission of OA
to 6 piglets was observed in a sow which had been fed naturally
contaminated feed; blood levels in newborn piglets were 0.075 - 0.12
ng OA/ml compared to 0.20 ng/ml in the blood of the sow (Barnikol &
Thalmann, 1988).
2.1.2 Biotransformation
OA is hydrolyzed to the non-toxic Oalpha (Fig. 1) at various
sites. In rodents detoxification by hydrolysis to Oalpha is a
function of the bacterial microflora in the rat caecum (Galtier,
1978). The enzymes responsible for hydrolysis to Oalpha are
carboxypeptidase A and chymotrypsin, both in the cow and rodent
(Pitout, 1969a, 1969b; Pitout & Nel, 1969), with other mycotoxins
such as penicilloic acid inhibiting this reaction (Parker et al.,
1982).
Studies with rat tissue homogenates have shown that the
duodenum, ileum and pancreas also have a high capacity to carry out
this reaction, whereas the activity in the liver and kidney was low
(Suzuki et al., 1977), or non-existent in rat hepatocytes (Hansen
et al., 1982) and rabbit and rat liver (Stormer et al., 1983;
Kanisawa et al., 1979).
Distribution studies in rats with 14C-labeled OA showed that
most radioactivity was due to OA, indicating that major efficient
metabolism of OA is lacking in most tissues other than the intestine
(Galtier et al., 1979).
In vitro incubation studies with the contents from the four
stomachs of the cow indicated effective hydrolysis of OA to Oalpha
by the cow's ruminant protozoa; assuming a similar reaction velocity
in vivo, it was estimated that up to 12 mg OA per kg feed can be
degraded (Hult et al., 1976; Pettersson et al., 1982), so that
this species is assumed to be relatively resistant to the effects of
OA in the feed. Similarly sheep have a good capacity to detoxify OA
before it reaches the blood (Kiesling et al., 1984).
It has been suggested, from studies conducted in mice, that OA
circulates from the liver into the bile and into the intestine,
where it is hydrolyzed to Oalpha (Moroi et al., 1985).
About 25-27% of OA, given either i.p. or orally to rats, was
present as Oalpha in the urine. Its presence in rat urine can be
explained by reabsorption from the intestine following its formation
in the intestine (Storen et al., 1982b) .
A similar mechanism of intestinal reabsorption of Oalpha has
recently been suggested for ruminant calves (Sreemannarayana et
al., 1988).
Other minor urinary metabolites of OA are 4-OH-(4R-and
4S)epimers (Fig. 1) produced in rat and rabbit liver (Stormer et
al., 1981) and rat kidney (Stein et al., 1985) under the
influence of cytochromes P-450 (Stormer et al., 1981; 1983). The
4R-OH-OA epimer, which is considered less toxic than OA, is the
major of these two metabolites formed from OA in human and rat liver
microsomal systems (Stormer et al., 1981), whereas the 4S-OH-OA
epimer is more prevalent with pig liver microsomes. No data are
available on its toxicity (Moroi et al., 1985).
The 10-OH derivative (Fig. 1) was formed from OA with a rabbit
liver microsomal system (Stormer et al., 1983). OC (Fig. 1), a
metabolite of OA produced in rumen fluid, is equally as toxic as OA
(cited by Galtier et al., (1981)). OB (Fig. 1), a dechloro
derivative of OA, may co-occur with OA in cereal products. In the
rat it is less toxic than OA and is metabolized to 4-OH-OB and Oß
(Stormer et al., 1985).
OB was not found to act as an antagonist to OA, with respect to
the effects of OA on the formation of phenylalanyl-tRNA and protein
synthesis (Roth et al., 1989).
Many researchers have considered that the toxicity of OA was
due to one of its metabolites. From the research findings cited
above, however, it appears that in the rat OA itself, rather than
one of the metabolites mentioned above, may be the active toxic
agent, since the known metabolites are less toxic than or equally
toxic to OA itself. This agrees with findings in mice where the
LD50 of OA increased 1.5- to 2-fold after feeding phenobarbital at
500 mg/kg diet for one week prior to oral or i.p. administration
(Moroi et al., 1985).
Similarly, pretreatment with sodium phenobarbital (80 mg/kg bw
by gavage) for 5 days, or 3-methylcholanthrene (20 mg/kg bw by
gavage) for 2 days resulted in increased LD50 values for OA given
by gavage. For phenobarbital the difference was, however, less
large at 144 hours post dosing with OA, compared to the 48-hr LD50.
The administration of piperonyl butoxide, an inhibitor of microsomal
mono-oxygenases, decreased the 144-hr LD50 of OA from 40 to 18.9
mg/kg bw (Chakor et al., 1988).
On the other hand, preliminary studies with mice showed that
simultaneous feeding of phenobarbital slightly increased the
incidence of liver tumours seen after OA alone, and that mice
developed large and multiple hepatomas (Suzuki et al., 1986).
2.1.3 Effects on enzymes and other biochemical parameters
The biochemistry and molecular aspects of the action of OA in
both prokaryotes and eukaryotes were recently reviewed
(Röschenthaler et al., 1984). It was noted that not all findings
are consistent, due to limitations in experimental models and
procedures as well as interfering factors, especially in more
complex organisms. Based on work in prokaryotes (Konrad &
Röschenthaler, 1977), eukaryotic microorganisms (Creppy et al.,
1979b) mammalian cell cultures (Creppy et al., 1980a; 1983b) and
on in vivo animal studies (Creppy et al., 1980b; 1984), it is
established that the primary effect of OA is inhibition of protein
synthesis. Secondary to this, RNA and DNA synthesis may be
inhibited.
The inhibition of protein synthesis is specific and occurs at
the post-transcription level, with OA having a direct effect on the
translation step in protein synthesis. This involves a competitive
inhibition of phenylalanine-tRNAPhe synthetase, so that amino-
acylation and peptide elongation are stopped. This reaction is
fundamental for all living organisms. In yeast, the first part of
this reaction, phenylalanine dependent pyrophosphate exchange, was
inhibited 5 times more than transfer to tRNA, the second part. In
this reaction OA may be regarded as an analogue of phenylalanine,
and in cell cultures the competitive inhibition could be reversed by
an increase in phenylalanine concentration (Creppy et al., 1979a).
Similarly, in mice, the lethality of an acute dose of 0.8 mg OA
injected i.p. was completely prevented by the simultaneous injection
of 1 mg phenylalanine (Creppy et al., 1980b).
In yeast the rR-OH-OA epimer, a metabolite of OA, had a
similar effect to that of OA on protein synthesis, but Oalpha,
lacking the phenylalanine moiety, had no effect (Creppy et al.,
1983b).
Analogues of OA in which phenylalanine has been replaced by
other amino acids, i.e., tyrosine, have similar inhibitory effect on
the respective amino acid specific tRNA synthetases (Creppy et al.,
1983a).
The binding affinity of phenylalanine-tRNAPhe synthetase for
OA is lower than for phenylalanine and ranges from 1/300 in yeast
(KM = 1.3 mM for OA and 3.3 µM for phenylalanine) (Creppy et al.,
1983b), to 1/20 in rat liver (Km = 0.28 mM for OA and 6 µM for
phenylalanine) (Röschenthaler et al., 1984). Despite these
differences in binding affinity, the inhibition of phenylalanine-
tRNAPhe by OA is very effective, since OA is more readily
concentrated by cells than phenylalanine. In HTC cells the
concentration of OA inside the cells was 200- to 300-fold that in
the medium (Creppy et al., 1983b).
There was a dose related inhibition of protein synthesis in
mice given OA i.p. at a dose of 1 mg/kg bw or more. The degree of
inhibition of protein synthesis, 5 hours after administration of 1
mg OA/kg bw, was found to vary within different organs, and for
liver, kidney, and spleen was 26%, 68% and 75% as compared to
controls (Creppy et al., 1984).
It is possible that OA also acts on other enzymes which use
phenylalanine as a substrate, but no direct effect of OA on the
activity of other isolated enzyme systems has been demonstrated
(Röschenthaler et al., 1984).
However, in kidney slices from rats, two days after feeding 2
mg/kg bw OA, the activity of renal phosphoenolpyruvate
carboxykinase, a key enzyme in the gluconeogenic pathway, was
lowered by 50% (Meisner and Krogh, 1986). It was found that the
inhibition was indirectly due to a specific degradation of mRNA
coding for the above enzyme. This effect was not seen in rat liver
(Meisner et al., 1983).
2.2 Toxicological studies
2.2.1 Acute toxicity studies
A comparison of LD50 values in different species and using
different routes of exposure is shown in Table 1. These results
indicate that in acute toxicity studies with OA, the dog and pig
were the most sensitive species, and rats and mice were the least
sensitive. Simultaneous oral administration of 100 mg/kg bw
phenylalanine to mice increased the oral LD50 from 46 mg/kg bw to
71 mg/kg bw (Moroi et al., 1985). As is the case with many
xenobiotics, the neonate rat was considerably more susceptible than
the adult rat.
Table 1: LD50 values for ochratoxin A in various speciesa
LD50 values (mg/kg body weight)
Species Oral i.p. i.v.
Mouse 46-58.3 22-40.1 25.7-33.8
Rat 20-30.3 12.6 12.7
Rat neonate 3.9
Dog 0.2
Pig 1
Chicken 3.3
a Based on literature compilations in
Harwig et al., (1983) and NIOSH (1986).
Histopathological and electron microscopic studies were
conducted in groups of 10 male Long Evans and Sprague-Dawley rats
administered by gavage a single dose of 0, 17, or 22 mg/kg bw
benzene free OA in 0.1 M sodium bicarbonate and examined for up to
48 hours afterwards. The earliest changes were multifocal
haemorrhages in many organs, and fibrin thrombi in the spleen, the
choroid plexus of the brain, liver, kidney and heart suggesting
disseminated intravascular coagulation. This was postulated to be
due to the activation of extrinsic and intrinsic systems of
coagulation. Other changes were hepatic and lymphoid necrosis,
enteritis with villous atrophy affecting the jejunum most severely,
and nephrosis. Myocardial changes were thought to be related to
shock and subsequent ischemic injuries (Albassam et al., 1987).
2.2.2 Short term studies
OA has been demonstrated to have a nephrotoxic effect in all
monogastric mammalian species which have been tested so far (Kuiper-
Goodman & Scott, 1989). For their risk assessment of OA, these
authors summarized the results of about 12 short studies in rats,
dogs and pigs (see Table 2, adapted from their report). The most
relevant of these studies are presented here.
2.2.2.1 Rat
Groups of 10 male weanling Wistar rats were fed semi-purified
diets containing 0, 2.4, 4.8, 9.6, or 24 mg/kg OA, equivalent to 0,
0.24, 0.48, 0.96, and 2.4 mg/kg bw/day, for 14 days. At the two
highest dose levels there was growth retardation, reduced food
consumption, and an increased serum BUN. At the highest dose level
relative kidney weight was increased. Renal pathology, involving
degenerative changes in the entire tubular system, and a decrease in
urine volume were seen at all dose levels. Increased eosinophilia
and karyomegaly in cells of the proximal convoluted tubules were
noted at all dose levels (Munro et al., 1974).
Similar results were seen when OA was administered to groups of
4 to 6 adult Sprague-Dawley and Wistar rats by intraperitoneal
injection for 5 to 7 days at dose levels of 0, 0.75, and 2 mg/kg
bw/day. Decreased body weight, increased urine flow, increased
urinary protein, increased urinary glucose, and impaired urinary
transport of organic substances were seen at all dose levels.
Sprague-Dawley rats were found to be more sensitive than Wistar
rats, and males were more sensitive than females. It was suggested
that the increased urinary protein indicated interference with
protein reabsorption by cells of the convoluted tubules (Berndt &
Hayes, 1979).
Groups of 5 weanling male and female Fischer F344/N rats were
administered OA in corn oil by gavage at dose levels of 0, 1, 4 or
16 mg/kg bw 5 days per week for a total of 12 doses over a 16 day
period. All rats that received 16 mg/kg bw OA had diarrhoea and
nasal discharge, and died before the end of the study. Increased
relative weights of kidneys, heart and brain, thymus atrophy,
forestomach necrosis and/or hyperplasia, and haemorrhage of adrenal
glands were seen at doses above 1 mg/kg bw. Bone marrow hypoplasia
and nephropathy were seen at all dose levels, and involved renal
tubular degenerative and regenerative changes (NTP, 1989). Groups
of 15 weanling rats were administered OA in 0.1 M sodium bicarbonate
by gavage at dose levels of 0 or 100 µg/rat (equivalent to 1.25
mg/kg bw/day) for 8 weeks. Fasting blood samples of OA treated rats
contained about twice the level of glucose as control rats. After a
glucose tolerance test, insulin levels did not reach the level seen
in control rats. Total carbohydrates and glycogen in liver tissue
of treated rats were reduced, in agreement with earlier observations
(Kuiper-Goodman, personal observations; Suzuki et al., 1975).
Activities of glycolytic enzymes were reduced, whereas gluconeogenic
enzymes were increased. The diabetogenic effect of OA was thought
to be due to inhibited synthesis and/or release of insulin from
pancreatic cells, thereby suppressing glycolysis, glycogenesis, and
enhancing gluconeogenesis and glycogenolysis (Subramanian et al.,
1989).
Semi-purified diets containing 0, 0.2, 1, or 5 mg OA/kg,
equivalent to 0, 0.015, 0.075, or 0.37 mg OA/kg bw/day, were fed to
groups of 15 weanling Wistar rats of both sexes for 90 days. At this
time, 8 animals from each group were sacrificed, and the remaining
rats were subsequently fed control diet for an additional 90 days.
No changes in BUN, urinalysis, or haematological parameters were
seen at any of the dosage levels. After 90 days at the two highest
dietary levels, relative kidney weights were reduced in both sexes,
but returned to control values after the 90-day recovery period,
except for males that had received the highest dose level. Dose
related changes in morphological parameters were seen after 90 days
of treatment at doses as low as 0.2 mg/kg in the diet and involved
karyomegaly and increased eosinophilia in cells of the proximal
convoluted tubules. The authors considered the latter change a
phenomenon of ageing which had been accelerated by OA
administration. Desquamation of proximal tubular cells, autolysis,
changes in rough endoplasmic reticulum (RER), smooth endoplasmic
reticulum (SER), and tubular basement membrane thickening up to 4 µm
were noted at the highest dose level after 90 days of treatment. In
animals from the highest dose group that were subsequently given
control diet for 90 days, karyomegaly and tubular basement membrane
thickening persisted, but otherwise the kidneys appeared normal
(Munro et al., 1974).
Groups of 10 male and female weanling Fischer F344/N rats were
administered OA in corn oil by gavage at doses of 0, 0.0625, 0.125,
0.25, 0.50 and 1 mg/kg bw for 5 days per week for 91 days. Growth
retardation and a reduced relative kidney weight were seen in males
at the two highest dose levels. The NOEL for kidney tubular
necrosis was 0.0625 mg/kg bw, but karyomegaly, with dose related
severity, was observed in proximal tubules at all dose levels. Less
severe renal changes consisting of tubular atrophy were seen at
lower doses (NTP, 1989).
Table 2: Subacute and Subchronic Toxicity of Ochratoxin A
Species, N Route mg/kg b.w./day Time NOEL Effects Reference
Strain, sex [mg/kg in diet] (days) (mg/kg b.w.)
[Age]
Rat, Wistar, 10 Diet 0.24-2.4 14 -0.48 Growth retardation Munro et al.,
M, [Weanling] [2.4-24] -0.48 increased serum BUN 1974
-0.96 increased kidney wt.
<0.24 Decreased urine vol.
<0.24 Kidney pathology
Rat, Wistar, 15 Diet 0.015-0.37 90 approx. 0.075 Reduced weight gain. Munro et al.,
M.F [Weanling] [0.2-5] -0.016 Reduced kidney wt. No 1974
>0.37 change in BUN,
urinalysis,
haematology.
Desquamation, increase
in SER, changes in RER,
basement membrane
thickening of PCT
cells. Increased
eosinophilia and
karyomegaly in PCT cells
Rat, Wistar, M 5 Gavage 5.15 3 <5 Reduced p-amine hippuric Suzuki et al.,
[Adult] acid clearance, basement 1975
membrane thicking
Rat, Wistar, M 10 Gavage 0.5-2 10 1 Increased BUN. Hatey & Galtier,
[Adult] <0.5 Increased urine volume 1977
Table 2 (contd)
Species, N Route mg/kg b.w./day Time NOEL Effects Reference
Strain, sex [mg/kg in diet] (days) (mg/kg b.w.)
[Age]
Rat, Sprague- 4-6 i.p. 0.475-2 5-7 <0.75 Decreased body weight, Berndt & Hayes,
Dawley and Increased urine flow. 1979
Wistar, M,F Decreased urine
[Adult] osmolality. Increased
urinary protein.
Increased urinary
glucose. Impaired
urinary transport of
organic substances,
(Sprague-Dawley more
sensitive than Wistar,
females less sensitive)
Rat, Wistar, M 14 Gavage 4 4-10 Decreased factors Galtier et al.,
[Adult] <4 II, VI, X. Decreased 1979a
plasma fibrinogen.
Decreased thrombocyte,
megakaryocyte counts
Rat, Wistar, M 9 Gavage 4 10 <4 Hypothermia cachexia, Galtier et al.,
[Adult] tremors, diarrhoea 1980
Rat, Wistar, M 3 Gavage 0.145 56-84 <0.145 Decrease in kidney Kane et al.,
[Adult] approx. 2 enzymes. Increase in 1986a
urinary enzymes
Table 2 (contd)
Species, N Route mg/kg b.w./day Time NOEL Effects Reference
Strain, sex [mg/kg in diet] (days) (mg/kg b.w.)
[Age]
Rat, F344/N, M,F 5 Gavage 1-6 16 1 Increased relative NTP (1989)
[Weanling] (12 kidney, heart, and brain
doses) weight.
1 Thymus atrophy.
1 Forestomach necrosis.
1 Adrenal gland
Haemorrhage.
<1 Bone marrow hyplasia.
<1 Kidney nephropathy
Rat, F344/N M,F 10 Gavage 0.06-1 91 0.125,M Growth retardation NTP (1989)
[Weanling] 0.125,M Reduced relative kidney
weight
0.062 Kidney tubular necrosis
<0.062 Karyomegaly
Dog, Beagle, M. 3-6 Cap. 0.1-0.2 14 >0.2 No change in kidney Kitchen et al.,
[Young] function 1977b
<0.1 Kidney tubular Kitchen et al..
necrosis 1977b
<0.1 Proximal tubes, EM Kitchen et al.,
changes 1977a
<0.1 Thymus, lymphoid necrosis Kitchen et al.,
1977c
functions 1988
Table 2 (contd)
Species, N Route mg/kg b.w./day Time NOEL Effects Reference
Strain, sex [mg/kg in diet] (days) (mg/kg b.w.)
[Age]
Pig. F 3-6 Diet approx. 0.008- 5-90 <0.008 Renal enzyme changes; Elling, 1979b;
[8-12 weeks] [0.2 0.2, 1.5] changes in renal Krogh et al.,
Note: number of animals per group.
2.2.2.2 Dog
Groups of 3 to 6 young Beagle dogs were administered OA by
capsule at dose levels of 0, 0.1 and 0.2 mg/kg bw/day for 14 days.
At these dose levels no changes were observed in kidney function,
but kidney tubular necrosis and ultrastructural changes in proximal
tubules were observed at all dose levels. Necrosis of lymphoid
tissues of the thymus and tonsils was also seen at all dose levels
(Kitchen et al., 1977a,b,c).
2.2.2.3 Pig
In a series of experiments, groups of 3 to 6 female pigs were
administered OA at levels of 0, 0.2, 1, and 5 mg/kg feed, equivalent
to approximately 0, 0.008, 0.04 and 0.2 mg/kg bw/day, for periods of
5 days, 8 and 12 weeks, and up to 2 years. A decrease in kidney
function (see 2.2.6), nephropathy and reduction in kidney enzymes
were reported. Progressive nephropathy but no renal failure was
seen in female pigs given feed containing 1 mg OA/kg feed for 2
years. No 2-year toxicity studies in male pigs have been reported.
(Krogh & Elling, 1977; Elling, 1979a, 1979b, 1983; Elling et al.,
1985; Krogh et al., 1988).
2.2.3 Long-term/carcinogenicity studies
2.2.3.1 Mouse
Diets containing 0 or 40 mg/kg OA, equivalent to an intake of
approximately 5.6 mg/kg bw/day, were fed to groups of 10 ddY male
adult mice for 44 weeks, followed by 5 weeks of basal diet. Of the
9 surviving OA-fed mice, 5 had hepatic cell tumours, 9 had renal
cystic adenomas, and 2 had solid renal cell tumours (terminology as
used by the authors). No liver or renal tumours were observed in
control mice, and no data on the incidence of these tumours in
historical controls of this strain of mice were presented. It was
not clearly indicated whether liver tumours were benign or malignant
(Kanisawa & Suzuki, 1978).
A second study from the same laboratory confirmed the results
of the above study. Diets containing 0 or 25 mg/kg, equivalent to
an intake of approximately 3.5 mg/kg bw/day were fed to groups of 20
6-week old male DDD mice for 70 weeks. All of the 20 surviving OA-
treated mice had renal cystic adenomas, 6 had solid renal tumours,
and 8 had hepatic cell tumours. One of the 17 control mice had a
hepatic cell tumour (Kanisawa, 1984).
A third study from the same laboratory was not a lifetime
exposure study. Diets containing 0 or 50 mg/kg OA, equivalent to an
intake of approximately 7 mg/kg bw/day, were fed to groups of 16
adult male ddY mice for periods of 5 to 30 weeks, followed by a
control diet for the remainder of the study (total length of study
was 70 weeks). The length of time on control diet ranged from 65
down to 40 weeks. No renal or liver tumours were observed in
control mice or in mice fed OA for 10 weeks or less. The incidences
of renal cell tumours were 3/15, 1/14, 2/15 and 4/17 after 15, 20,
25, and 30 weeks on an OA diet, respectively. The incidence of
renal cystic adenomas was not indicated. A significant increase in
liver tumours was observed after mice had been fed OA for 25 weeks
(5/15) and 30 weeks (6/17). These results indicated that the renal
and liver tumours persisted through long term subsequent feeding of
control diet (Kanisawa, 1984).
In these studies two types of renal tumours were distinguished
by the authors, papillary cyst adenomas (benign) and solid type
renal cell tumours which contained atypical cells, displayed
infiltrative growth, and which were interpreted by the present
reviewers as being malignant. Pre-neoplastic kidney lesions were
frequent and multiple, consisting of distended tubules with atypical
epithelial cells. No metastases attributable to the kidney or liver
tumours were found.
Diets containing 0, 1, or 40 mg/kg OA were fed to groups of 50
weanling B6C3F1 mice of each sex for 24 months. The test compound
contained about 84% OA, 7% OB, and 9% benzene. Inspections of dead
or moribund mice were made daily. The mice were examined, weighed,
and food consumption recorded weekly for the first 4 weeks, then
monthly. At the 40 mg/kg dietary level, body weights were decreased
by 25 and 33% in female and male mice respectively, indicating that
the Maximum Tolerated Dose (MTD) was exceeded, although no other
signs of toxicity were observed. Nephropathy, characterized by
cystic dilatation of renal tubules often with hyperplasia of the
lining epithelium, was seen only in mice fed diets containing 40
mg/kg OA, and was more severe in males than in females. There was
no nephropathy in males or females given a control diet, or diets
containing 1 mg/kg OA. Benign and malignant renal tumours were seen
only in male mice fed diets containing 40 mg/kg OA, and their
incidence was 53% and 28.6% respectively (combined incidence 63%).
No metastases attributable to renal tumours were found.
When compared to concurrent controls, the combined incidence of
hepatocellular adenomas and carcinomas was statistically significant
in both male and female mice administered 40 mg OA per kg diet;
however, for males the 20% incidence was within the historical
control range of 0-21.6% for this strain of mice (Ward et al.,
1979); for females the 14% incidence was greater than the incidence
of 0-3.9% for historical controls (Ward et al., 1979). The
authors noted that the OA used in their study contained 9% benzene,
a proven carcinogen, and thus the possibility of synergism must be
considered. The presence of renal tumours in males did not decrease
survival. In fact, survival of males in the control and 1 mg/kg
dietary groups at 18 months was only 75% and 65%, respectively,
compared to 98% in the 40 mg/kg dietary group, due to a high
incidence of fatal obstructive urinary tract disease (uropathy) in
the 0 and 1 mg/kg dietary dose groups, with an onset as early as 4
months (Bendele et al., 1985a).
The protective effect of the 40 mg/kg dietary level of OA may
have been due to a growth inhibitive effect on Gram positive
bacteria, and to the OA induced polyuria, as a result of renal
proximal tubular damage (Bendel & Carlton, 1980). Group caging and
fighting-related lesions of the prepuce/penis may have contributed
to the chronic uropathy (Rao, 1987).
2.2.3.2 Rat
Groups of 80 male and female Fischer F344/N rats were
administered OA by gavage in corn oil at 0, 21, 70, or 210 µg/kg
bw/day, 5 days per week for 9 months, 15 months or 103 weeks. The
rats were observed twice daily, and body weights and food
consumption were recorded weekly for the first 13 weeks, and then
monthly. Feed and water were available ad libitum. Groups of 15
rats of each sex were sacrificed after 9 and 15 months. At the
highest dose level, body weight was decreased from 4-7% between 18-
77 weeks for male rats, and between 6-89 weeks for female rats. No
compound related clinical signs were noted, and the results of
haematological and serum chemical analysis showed no effects of
biological significance. Urinalysis indicated a mild to moderate
change in the ability to concentrate urine, with no other changes in
kidney function (see 2.2.6).
The incidences of renal adenomas and renal carcinomas in males
administered 0, 21, 70, and 210 µg OA were 1/50, 1/51, 6/51 and
10/50 and 0/50, 0/51, 16/51 and 30/50 respectively. The combined
incidences of renal tubular cell adenomas and carcinomas were 36/50
and 20/51 at 210 µg and 70 µg respectively. At the highest dose
level many renal adenomas and carcinomas were multiple or bilateral.
There was a dose related increase in the number of males that were
dead or moribund (7, 19, 23, and 26, respectively, in the 0, 21, 70,
and 210 µg/kg bw dose groups) before the time of terminal sacrifice.
In the two highest dosage groups, decrease in survival was
attributed by the authors to the presence of kidney tumours since 15
out of 23, and 18 out of 26 rats which died had kidney tumours. As
well, a larger proportion of animals that died prior to the terminal
sacrifice had carcinomas that had become metastatic (3/8 and 11/15
at the mid- and high dose respectively) compared to animals killed
at terminal sacrifice (0/7 and 3/15 at the mid- and high dose
respectively). However in male rats given the low dose of OA, only
one kidney tumour was present, although the decrease in survival was
similar to that of the two higher doses. Lower survival in this
group must therefore be attributed to a non-neoplastic treatment-
related effect.
In females, the combined incidences of renal adenomas and
carcinomas were 0/50, 0/51, 2/50 and 8/50 for the 0, 21, 70, and 210
µg OA groups, respectively.
The significance of the OA-induced rat renal carcinoma is
increased by the presence of a high frequency of metastases,
attributed to renal cell carcinomas, mainly in the lungs and lymph
nodes.
In high dose female rats there was also an increased incidence
in multiplicity of fibroadenomas in the mammary gland (14/50
compared to 4-5/50 in controls and lower doses).
Non-neoplastic lesions involved mainly the kidney. Chronic
diffuse nephropathy, common to old rats, was seen with about the
same incidence in all groups of males and females, but the extent
and grade were not reported.
At the two highest dose levels karyomegaly or karyocytomegaly
(large kidney epithelial cells with giant polyploid nuclei and
prominent nucleoli) was seen in all males and females, and it was
the most consistent finding at the two highest dose levels in the
interim 9- and 15-month sacrifices, as well as in the 13-week NTP
preliminary study (NTP, 1989).
2.2.4 Reproduction studies
No adequate reproduction studies with OA have been reported to
date.
2.2.5 Special studies on embryotoxicity/teratogenicity
2.2.5.1 Mouse
Groups of 4 to 26 pregnant CBA mice were administered a single
dose of OA in corn oil by gavage at dose levels of 0, 1, 2, or 4
mg/kg bw on days 8 or 9 of gestation (vaginal plug day = post
conception day 1), or of 4 mg/kg bw on days -2 (2 days prior to
mating), 2, 4, 6, 7, 10, and 14 of gestation and observed until day
19. At this time the number of viable and dead fetuses and the
number of resorption sites were determined, and fetuses were weighed
and examined for morphological changes. No mention was made of
whether maternal toxicity was present. Prenatal survival was
decreased for groups that had received 4 mg/kg bw on days 7 (24%
deaths), 8 (17.3% deaths), and 9 (22.2% deaths) of gestation. Overt
craniofacial anomalies were produced only by exposure on days 8 or
9, and their incidence, multiplicity, and severity increased with
increasing dosage, the peak effect being on day 9. The incidences
of malformed pups among surviving pups were 0%, 0%, 8.1%, and 16.4%
for mice administered 0, 1, 2, or 4 mg/kg bw on day 8 of gestation,
and 0%, 29.3%, 41.8%, and 91.1% for mice administered these same
dosages on day 9 of gestation. The mean number of malformations per
fetus was approximately 0.3 and 2.3 on days 8 and 9 of gestation in
the 4 mg/kg dose group, and 1.7 and 3.9 respectively when
administered 8 mg/kg bw (separate study). The central nervous
system, the eye and the axial skeleton were mainly affected. The
most important malformations were those affecting the craniofacial
structures, including aplasia and dysplasia of the upper facial
structures, such as exencephaly, microcephaly, blunt jaws,
anophthalmia, microphthalmia, median cleft face. On day 9 of
gestation at the 4 mg/kg dose level, the incidences for the various
major anomalies were exencephaly (89.3%), anophthalmia (44.6%),
microphthalmia (26.8%), open eye lids (16.1%), agenesis of external
nares (21.4%), cleft lip (7.1%), median cleft face (8.9%), and
malformed jaws/short maxilla with protruding tongue (41.1%). The
craniofacial anomalies were thought to arise from a failure of
closure of the neurocranium, resulting in abnormal configuration,
position and size of the bones of the base and lateral walls of the
skull (Arora & Frölen, 1981).
The effects of protein deprivation on the teratogenic effects
of OA were studied in groups of 10 to 13 CD-1 mice, maintained on
diets providing 26% (control), 16%, 8%, and 4% purified protein
(casein), following mating and throughout gestation. A single dose
of OA in 0.1 N sodium bicarbonate was administered by gavage at dose
levels of 0, 2, or 3 mg/kg bw on day 8 of gestation (vaginal
plug=day 1), and the mice were sacrificed at day 18 of gestation for
teratologic examination. Dams were monitored twice daily and food
consumption was monitored. Protein diets and water were available
ad libitum.
OA treatment did not affect maternal food consumption, but in
some of the 3 mg OA groups (26% and 4% protein) maternal deaths were
significantly more frequent (5 and 4 respectively versus 0 in the
two OA free groups). There were also 9 maternal deaths in the 4%
protein group given 2 mg OA/kg. The percentage of litters with
grossly malformed fetuses and the percentage of malformed fetuses
(in brackets) for each of the 4 protein diets (26, 16, 8, and 4%,
respectively were 58 (25), 50 (17), 75 (45), and 100 (81.3) at 3 mg
OA/kg bw, 25 (5), 50 (21), 30 (12.6), and 100 (77.7) at 2 mg OA/kg
bw, and 0 (0), 0 (0), 18 (3), and 31 (9.8) at 0 mg OA/kg bw. Fetal
weights were reduced as a result of OA and protein deprivation.
Cranofacial malformations were the most common, but at lower protein
levels gross malformations affecting limbs and tail were also seen
(Singh & Hood, 1985).
2.2.5.2 Rat
Five groups of 12 to 20 pregnant Wistar rats were administered
a total of 5 mg/kg bw OA in 0.16 M sodium bicarbonate by gavage as
follows: at each of days 8 and 9 of gestation (vaginal plug=day 1)
single doses of 2.5 mg/kg bw, on each of days 8 to 11 of gestation
doses of 1.25 mg/kg bw, on each of days 8 to 13 of gestation doses
of 0.83 mg/kg bw, and on each of days 8 to 15 of gestation doses of
0.63 mg/kg bw, or vehicle control. In a similar way, three groups
of 20 rats were administered single doses of 2.5 mg OA/kg bw on each
of days 8 and 9 of gestation, or on each of days 8 to 10 of
gestation doses of 1.67 mg OA/kg bw, or vehicle control. Rats were
sacrificed on day 20 of gestation. There were no significant
differences in the number of implantations per female for the
various groups. Females that had received the same total amount of
OA, divided into fewer single doses, and early in gestation were
most affected. There was a single-dose related increase in the
number of resorptions per female, and decreases in the mean number
of fetuses per female, mean fetal weight, and mean placental weight.
A high single-dose related incidence of fetal haemorrhages (seen at
the 2 times 2.5 and 4 times 1.25 mg/kg dose levels) and celosome
with or without oedema were considered teratogenic responses (Moré &
Galtier, 1974).
In a follow-up study from the same laboratory a similar
protocol for OA administration was used, but rats were observed
until 82 days after birth. There was a single-dose related decrease
in the mean number of new-born rats, mean number of rats alive at 4
days, and the viability index, but not in the lactation index. In
the group given 2.5 mg OA/kg bw twice, the mean body weights in male
and female offspring at 82 days were reduced by 12 and 8%,
respectively. In 26% of male offspring of that group hydrocephalus
was observed on day 15 after birth, and 40% of these animals died by
20 days after birth. A second generation was bred to look for
residual maternal or paternal effects of OA, and without further
administration of OA. No differences in reproductive parameters
were noted, and details were not given (Moré & Galtier, 1975).
Levels as low as 0.5 mg OA/kg b.w. given by gavage to rats on
days 11 to 14 of gestation caused learning deficits in pups which
were tested over a 26-week period (Kihara et al., 1984).
Other studies on the teratogenicity in mice and rats given OA
by i.p. or s.c. route were reviewed by Kuiper-Goodman & Scott
(1989).
2.2.6 Special studies on nephrotoxicity
As seen in the short-term studies, kidney function and
morphology are greatly affected at higher dose levels of OA as
indicated by increases in kidney weight, urine volume, blood urea
nitrogen (BUN) (Hatey & Galtier, 1977), urinary glucose and
proteinuria (Berndt and Hayes, 1979). The latter two findings
indicate that the site of reabsorption, i.e. the proximal convoluted
tubules, is damaged. NOELs for changes in renal function depend on
the species and on the parameter tested.
At lower dose levels of OA, no increases in BUN, creatinine or
glucose were found in the urine of male and female rats given 210
µg/kg b.w./day by gavage for 6-12 months, but a mild to moderate
decreased ability to concentrate urine was seen. The NOEL for this
effect was 70 µg/kg b.w. for male rats and 21 µg/kg b.w. for female
rats (NTP, 1989).
Different groups of investigators have shown that this specific
toxic effect is due to an OA induced defect on the organic anion
transport mechanism located on the brush border of the proximal
convoluted tubular cells and basolateral membranes (Endou et al.,
1986; Sokol et al., 1988).
The organic ion transport system is also the mechanism by which
OA enters proximal tubular cells (Friis et al., 1988; Sokol et
al., 1988).
The middle (S2) and terminal (S3) segments of the proximal
tubule of isolated nephron segments were found to be the most
sensitive to the toxic effects of OA (0.05 mM), as shown by a
significant decrease in cellular ATP and a dose related decrease in
mitochondrial ATP content (Jung & Endou, 1989).
Several investigators have measured the effect of OA on the
release of enzymes from the kidney into the urine. Changes in
enzyme and protein pattern can be used to distinguish different
types of renal injury (Stonard et al., 1987).
Subcutaneous doses of OA, at a dose level of 10 mg/kg bw for 5
days, decreased first the level of muramidase, followed by decreases
in the levels of lactate dehydrogenase, alkaline phosphatase,
glutamate dehydrogenase, and acid phosphatase in the kidney (Ngaha,
1985).
The levels of alanine peptidase, leucine amino peptidase and
alkaline phosphatase were decreased by 60%, 50%, and 35%
respectively in isolated kidney tubules in the presence of 0.1 mM OA
(Endou et al., 1986).
In male rats, given 0.1 to 2 mg/kg bw OA by oral route for 2 to
5 days, phosphoenolpyruvate carboxykinase (PEPCK) activity decreased
by 50 to 70% at the highest dose level (Meisner et al., 1983;
Meisner & Krogh, 1986); the minimum effect level (MEL) for rats was
0.1 mg/kg bw (Meisner & Polsinelli, 1986); at 2 mg/kg bw other
enzymes such as pyruvate carboxylase, malate dehydrogenase,
hexokinase and gamma-glutamyl transpeptidase were not affected
(Meisner & Selanik, 1979).
More recently, it was shown that in rats given OA by gavage at
a dose level of 0.145 mg/kg bw every 48 h (equivalent to about 2
mg/kg diet) for 8 to 12 weeks, the level of lactate dehydrogenase,
alkaline phosphatase, leucine amino peptidase, and gamma-glutamyl
transferase decreased significantly. The latter three enzymes are
located in the brush border of the proximal convoluted tubules,
indicating damage at that site. Concomitant with the decrease of
enzyme activity in the kidney was the appearance of these enzymes in
the urine. A late event was the urinary increase in N-acetyl ß-D-
glucosidase, a lysosomal enzyme. The activity of this enzyme in the
kidney was not affected (Kane et al., 1986a). The late appearance
of this enzyme may indicate active regeneration and the exfoliation
of necrotic proximal convoluted tubular cells releasing lysosomal
enzymes (Stonard et al., 1987).
In the above study, para-aminohippurate clearance was reduced
initially by 56% at 2 weeks and 8% at 12 weeks of dosing, indicating
damage followed by regeneration.
Pigs are very sensitive to the effect of OA on renal enzyme
activity. In kidneys of pigs fed 0.2 to 1 mg/kg OA in the diet
(equivalent to about 0.008 to 0.041 mg/kg bw/day), a dose related
decrease in the activity of PEPCK and gamma-glutamyl transpeptidase
was accompanied by a dose related decrease of renal function, as
indicated by a reduction of maximal tubular excretion of para-
aminohippurate per clearance of inulin and an increase in glucose
excretion. Only cytosolic PEPCK activity was inhibited, with
mitochondrial PEPCK activity not affected by OA (Meisner & Krogh,
1986; Krogh et al., 1988).
2.2.7 Special studies on genotoxicity
The genotoxicity of OA was recently reviewed (Bendele et al.,
1985b; Kuiper-Goodman & Scott 1989). The following is taken from
the latter review. OA has been shown to be non-mutagenic in various
microbial and mammalian gene mutation assays, both with and without
exogenous metabolic activation. A single positive result in a
bacterial assay was attributed to the presence of 15% OB in the OA
(Kuczuk et al., 1978) (Table 3).
While evidence for DNA damage/repair in microbial systems has
been negative, a weakly positive response was found for induction of
unscheduled DNA synthesis (UDS) in ACI strain rat and C3H strain
mouse primary hepatocytes, each treated at 2 dose levels for 20
hours with OA (purity not stated) (Mori et al., 1984) (Table 3).
The positive results were reported at approximately 0.4 and 4.0
µg/ml, respectively; OA was cytotoxic at 4.0 and 40.0 µg/ml,
respectively.
On the other hand, Bendele et al., (1985b) tested 2 lots of
highly purified OA over a 7 1/2 log concentration range, and used 15
dose levels (treatment duration not stated) for induction of UDS in
Fischer 344 primary rat hepatocytes. They found that OA was
cytotoxic at ±0.05 µg/ml concentration, and that OA did not induce
UDS at dose levels up to cytotoxic doses.
OA has caused a small but significant dose-related increase in
sister chromatid exchange (SCE) in CHO cells in the presence, but
not in the absence, of rat liver S9 activation (NTP, 1989).
Negative effects on SCE frequency were found in HPBL cells
(Cooray, 1984) and in an in vivo assay (Bendele et al., 1985b).
OA did not induce chromosome aberrations in CHO cells (NTP,
1989) (Table 3).
OA has caused DNA damage (single strand breaks) in vitro in
CHO cells, rat fibroblasts (Stetina & Votava, 1986) and in mouse
spleen cells (Creppy et al., 1985).
DNA strand breaks were induced by OA treatment in vivo in
mouse spleen, kidney and liver cells, and rat kidney and liver cells
after a single i.p. injection, at fairly high dose levels (Creppy
et al., 1985), or after gavage treatment for 12 weeks at levels
equivalent to low (4 mg/kg) dietary concentrations (Kane et al.,
1986b) (Table 3).
2.2.8 Special studies on immune response
Several studies have shown that OA affects structural
components of the immune system in several species. In chickens fed
2-4 mg OA/kg in the diet for 20 days, OA was found to decrease the
lymphoid cell population of immune organs (Dwivedi & Burns, 1984a).
The size of the mouse thymus was reduced to 33% of controls
after four i.p. injections of 20 mg OA/kg bw on alternate days, a
dose which caused minimal nephrotoxicity. There was also bone
marrow depression, as shown by a dose-related and significantly
(p<0.01) decreased marrow cellularity, including a reduction of
bone marrow macrophage-granulocyte progenitors, a decrease in the
number of haematopoietic stem cells and a significant decrease in
erythropoiesis as measured by 59Fe uptake; increased phagocytosis
by macrophages was also observed (Boorman et al., 1984).
Residual damage, 3 weeks post exposure, was demonstrated by an
increased sensitivity to irradiation, even though bone marrow
cellularity and the peripheral blood count had returned to normal
(Hong et al., 1988; NTP, 1989).
Bone marrow hypocellularity and a reduction in thymic size were
also seen in Fischer rats given 1 or 4 mg OA/kg bw/day by gavage for
16 days (NTP, 1989).
Necrosis of germinal centers in the spleen and lymph nodes was
seen in Wistar rats given a single dose of 5 - 50 mg OA/kg bw
(Kanisaw et al., 1977), and in dogs given OA by capsule at doses
of 0.1-0.2 mg/kg bw/day for 14 days (Kitchen et al., 1977c).
It is possible that the effects of OA on the bone marrow and
lymphatic cell population reflect the sensitivity of these cells to
inhibition of protein synthesis induced by OA. These effects on the
structural components of the immune system indicated that OA was
likely to have an effect on immune function.
Several studies have shown that OA affects both humoral and
cell-mediated immunity. In chickens fed OA at 5 mg/kg diet for 56
days, the content of alpha1 alpha2, beta and gamma globulin in
blood plasma was reduced (Rupic et al., 1978).
In chickens, fed 2-4 mg OA per kg diet for 20 days, there was a
depression of IgG, IgA and IgM in lymphoid tissues and serum
(Dwivedi & Burns, 1984b), and complement activity was slightly
affected when fed at 2 mg OA per kg diet for 5-6 weeks (Campbell et
al., 1983).
OA also reduced IgG and increased IgM in the bursa of Fabricius
in chick embryos that had been injected with 2.5 µg OA/embryo on day
13. This did not however affect immunocompetence, as seen after
challenge of the hatched chickens with E. coli at 1, 2 and 4 weeks
of age, indicating that the effect on immunoglobulins may have been
transient (Harvey et al., 1987b).
OA administered to 8-10 week old Swiss mice at 5 mg/kg bw/day
by i.p. injection for 50 days, reduced the antibody response to
Brucella abortus, a cell mediated immune response, and this was
postulated to be due to a suppression of IgM synthesis (Prior &
Sisodia, 1982).
The same treatment also reduced mitogen (con A)-induced blast
formation in mouse spleen derived lymphocytes (Prior & Sisodia,
1982).
Table 3: Results of Genotoxicity Tests with Ochratoxin A
Dose
Endpoint Organism/ Details Activation Value Units Result Comment Reference
cell type
Microbial
Prokaryotes
Gene S. typhimurium TA98, +/- 0.4-400 µg/plate -/- Highly Wehner et al., 1978
mutation 100, variable Kuzuk et al., 1978
1535, TA 100
1537, controls,
1538 not tested to
cytotoxicity
Gene S. typhimurium TA100, +/- approx. 198 µg/plate -/- Mouse Bartsch et al., 1980
mutation 1538 liver and
rat liver
activation
Gene S. typhimurium TA98, +/- 50-600 µg/plate -/- Tested to Bendele et al.,
mutation 100, cytotoxicity/ 1985b)
1535, solubility
1537,
1538
Gene S. typhimurium TA98, +/- 0.1-100 µg/ml -/- Non Bendele et al., 1985b
mutation 100, (in log- quantitative
1535, arithmic assay
1537, gradients)
1538,
G46,
C3076,
D3052
Table 3 (contd)
Dose
Endpoint Organism/ Details Activation Value Units Result Comment Reference
cell type
Gene S. typhimurium TA1538, + 0.1-500 µg/plate + Positive > Kuczuk et al., 1978
mutation (OA:OB = 100 µg/plate
17.3)
Gene S. typhimurium TA97, +/- 1-100 µg/plate -/- Hamster or NTP, 1989
mutation 98, rat liver
100, activation
1535
DNA damage/repair
DNA repair E. coli SOS +/- 1-2 mg/100 µl -/- Qualitative Reiss (1986);
colorimetric; Auffray & Bouti-
spot test bonnes (1986)
DNA repair E. coli WP2 +/- Gradient Not -/- Qualitative Bendele et al.,
plate stated assay (1985b)
DNA damage B. subtilis rec 20-100 µg/disk - Inhibition Ueno & Kubota
zone (1976)
Eukaryotes -
-
Gene mutation S. cerevisiae D3 - 200 µg/plate Kuczuk et al., 1978
+ 75 µg/plate
Mammalian In vitro
Gene mutation Mouse lymphoma TK +/- 0.1-12.5 µg/ml -/- >12.5 µg/ml, Bendele et al., 1985b
cytotoxic
Table 3 (contd)
Dose
Endpoint Organism/ Details Activation Value Units Result Comment Reference
cell type
Gene mutation C3H mouse 8-AG 5-10 µg/ml -/- 10 µg/ml, Umeda et al., 1977b
mammary cytotoxic
carcinoma
DNA damage/repair
UDS, repair Rat primary Fisher 344 - 0.000025- µg/ml - >0.05 µg/ml Bendele et al., 1985b
hepatocytes strain 500; 2 lots cytotoxic
tested, 15
doses
UDS, repair Rat primary ACI strain - 0.4, 4.0 µg/ml + At approx. Mori et al., 1984
hepatocytes (weak) 0.4 µg/ml;
cytotoxic; at
approx. 4
µg/ml
UDS, repair Mouse primary C3H strain - 4.0, 40.0 µg/ml + At 4.0 µg/ml; Mori et al., 1984
hepatocytes (weak) cytotoxic at
40 µg/ml
SCE Human, HPBL +/- 5-10 µg/ml - Mitotic Cooray (1984)
inhibition at
10 µg/ml
SCE CHO cells 26 h with - 0.5-5 µg/ml - NTP (1989)
OA
Table 3 (contd)
Dose
Endpoint Organism/ Details Activation Value Units Result Comment Reference
cell type
SCE CHO cells 2 h with OA + 5-160 µg/ml + SCE frequency NTP (1989)
(weak, up to 37%
dose above control
related)
Chromosome CHO cells 8-10 h with - 30-160 µg/ml - NTP (1989)
aberration OA
2 h with OA + 100-300 µg/ml - NTP (1989)
DNA strand CHO cells; rat Alkaline 200 µg/ml + 1.2 breaks/109 Stetina & Votava
break fibroblasts elution Da (1986)
DNA damage Mouse spleen 48 h 10 µg/ml + replicated 6 Creppy et al., 1985
PHA stimulated treatment (dose times in pairs
at 1-10 related)
µg/ml
In vivo
SCE Chinese Gavage, mg/kg - >100 mg/kg Bendele et al., 1985b
hamster, bone 25-400 body wt. body wt.
marrow cytotoxic
DNA damage Balb/c mouse
single strand Spleen 4, 16, i.p. 2500 µg/kg + Max. response Creppy et al., 1985
breaks 24 h after body wt at 24 h
treatment
Table 3 (contd)
Dose
Endpoint Organism/ Details Activation Value Units Result Comment Reference
cell type
Kidney 24, 48 h i.p. 2500 µg/kg + Max. response Creppy et al., 1985
after body wt at 24 h
treatment
Liver 24, 48, i.p. 2500 µg/kg + Max. response Creppy et al., 1985
72 h after body wt at 48 h;
Recovery at
72 h
DNA damage- Wistar rat 6-12 weeks Gavage 144 µg/kg both+ No recovery Kane et al., 1986b
single strand kidney, liver (289 µg/kg body wt seen between
breaks body wt treatments
every 48 h
equiv. to
4 ppm in
diet)
Chromosome human 48hr +/- 4.5 µg/ml +/+ 4.5-5 fold Manolova et al., 1990
aberration lymphocytes increase in
aberrationsa
a Aberrations on x chromosomes of similar types to those previously detected in lymphocytes from patients suffering from
endemic nephropathy.
In the above-mentioned mouse studies, immune response to sheep
red blood cells (SRBC), measured as the number of antibody forming
cells in the spleen using the indirect plaque assay, was not
affected. When OA was administered at 4 mg/kg diet (equivalent to
about 0.5 mg/kg bw), a dose which is about 10-fold lower and close
to that which can be found to occur naturally, none of these
responses were affected (Prior & Sisodia, 1982).
In contrast to these studies, very low levels of OA (1 µg
kg/bw) given once by i.p. route to BALB mice, 8-12 weeks of age, had
an immuno-suppressive effect on both IgM and IgG response to a
single injection of SRBC in the standard plaque counting assay for
the estimation of antibody producing spleen lymphocytes (Creppy et
al., 1982).
No explanation, other than differences in route of exposure, is
available for the differences in response to SRBC between these
studies and those of Prior and Sisodia.
A reduction in blast cell formation was also seen in human
peripheral lymphocytes treated with 5-20 µg OA/ml (Cooray, 1984).
At even lower concentrations of OA, similar and dose related
inhibition of con-A-induced blastogenesis of porcine blood
lymphocytes was observed, with concentrations of >1 µg, 0.5 µg, and
0.06 µg OA/ml causing almost complete, 50% and 10% inhibition,
respectively (Holmberg et al., 1988).
PHA-induced proliferation of highly purified human t-
lymphocytes was inhibited by 12.5 to 50 µM concentrations of OA
(equivalent to 5-20 µg OA/ml). This was attributed to a low
interleukin-2 receptor expression and/or production. OA also
impaired the ability of purified human B-lymphocytes to proliferate
in response to anti-µ antibodies in the presence of BCGF-1 (Lea et
al., 1989). The immunosupressive effects of OA could be prevented
by i.p. administration of phenylalanine at 10 µg/kg b.w. (Haubeck
et al., 1981; Creppy et al., 1982). Thus the immunosuppressive
action of OA could be due to its action on protein synthesis,
although the dose employed was very low. Immunocompetent cells
require activation, differentiation and proliferation, and all these
steps could be affected if protein synthesis in lymphocytes is
inhibited.
The OA metabolite, 4R-OH-OA, was found to be almost as
effective as OA, and Oalpha was found to be ineffective (Creppy et
al., 1983c).
Protein synthesis inhibition occurred in lymphocytes in culture
at 0.5 mg OA/ml after 2 hrs, and in hepatoma cells at 10-15 mg/ml,
compared to an in vivo immunosuppressive dose in the above studies
of 1 µg/kg bw (Creppy et al., 1982).
Female B6C3F1 mice, 6-8 weeks of age, administered OA at 3.4,
6.7, and 13.4 mg/kg bw by gavage or i.p. injection (6 doses over 12
days) had decreased natural killer (NK) cell activity. OA also
caused an increase in the growth of transplantable tumor cells
without altering T-cell- or macrophage-mediated antitumor activity.
Suppression of NK activity appears to be due to a decreased
production of basal interferon; OB was much less toxic in this
system (Luster et al., 1987).
2.3 Observations in humans
Chronic human nephropathy, endemic in the Balkan area, has been
associated with OA exposure, as indicated by the presence of OA
residues in local foodstuffs as well as in the blood of patients
with nephropathy. In the last 10 years, direct evidence of human
exposure to OA has been obtained in six countries (Table 4).
Published surveys have shown up to 40 ng/ml OA in human blood serum.
In a preliminary study on lymphocytes from healthy women, OA
treatment at 6 ng/ml resulted in an increased frequency of numerical
chromosome aberrations, mainly affecting the X chromosome (Manolova
et al., 1990)
In Bulgaria, a significant proportion of serum samples from
patients with endemic nephropathy and/or urinary system tumours
contained more than 2 ng OA/ml serum compared to samples from people
in a non-endemic area (Petkova-Bocharova et al., 1988).
A survey conducted in 1980 in Yugoslavia showed a higher upper
range of OA in serum in a hyper-endemic village than in a non-
endemic village, although the incidence of positive samples (> 1
ng/ml serum) was about the same in both villages, 6% and 7.8%
respectively. In 1979, the incidence of positive OA samples in the
same hyper-endemic village was 16.6%, whereas the non-endemic
village had an incidence of 7.8% positive samples (Hult et al.,
1982).
Since that time, one exceptionally high level of 1800 ng/ml
serum has also been found. Thus it is apparent that there are
fluctuations in human serum OA levels, that probably reflect local,
seasonal or yearly fluctuations in the level of OA in food. Further
long term studies are underway to investigate serum levels of OA in
Yugoslavia (Hult & Fuchs, 1986).
The mean level of OA in Polish human sera was estimated as 0.27
ng/ml, and the average daily human exposure from food was estimated
to be 0.448 ng/kg (Golinski & Grabarkiewicz-Szcaesna, 1989).
Table 4 Occurrence of Ochratoxin in Humans
Sample Location Incidence Ochratoxin A Reference
level(s),
ng/g or ng/ml
Blood serum Bulgaria 26% 1-35 Petkova-Bocharova
(from patients with et al., 1988
urinary system
tumours and/or
endemic nephropathy)
Blood serum Bulgaria 7.7% 1-2 Petkova-Bocharova
(from non-endemic et al., 1988
area)
Blood serum Yugoslavia 25/420 1-40 Hult et al.,
(from village with 1982a,b
endemic nephropathy)
Blood serum Yugoslavia 17/219 1-10 Hult et al.,
(from non-endemic 1982a,b
village)
Blood serum Poland 9/216 1.3-4.8 Goliski &
Grabarkiewicz -
Szczesna, 1985
Blood serum Germany (FRG) 173/306 0.1-14.4 Bauer & Gareis,
(1977, 1985) 1987
Kidneys Germany (FRG) 3/46 0.1-0.3 Bauer & Gareis,
(1982, 1983) 1987
Table 4 (contd)
Sample Location Incidence Ochratoxin A Reference
level(s),
ng/g or ng/ml
Milk (1986) Germany (FRG) 4/36 0.017-0.03 Bauer & Gareis,
1987; Gareis et
al., 1988
Blood serum Denmark ? <0.1-9.7 Hald, 1989
(obtained from mean 1.5-2.3
blood bank
(1986, 1987)
Blood serum Czechoslovakia 35/143 <0.1-1.26 Fukal & Reisnerova,
1990
? - incidence not given
A high incidence of OA in human blood serum, as well as kidneys
and milk, reported in the Federal Republic of Germany reflects the
use of a very sensitive analytical method (sensitivity = 0.1 ng/ml
serum) (Bauer & Gareis, 1987; Gareis et al., 1988). It also
reflects continuous and widespread exposure of humans to OA.
Mean serum levels in 96 randomly collected Danish human blood
bank samples collected during 1986 and 1987 were 1.5 to 2.3 ng/ml,
and ranged from < 0.1 (detection limit) to 9.7 ng/ml (incidence not
reported) (Hald, 1989).
The maximum level of OA detected in human sera obtained from
two hospitals in Czechoslovakia was 1.26 ng/ml (Fukal & Reisnerova,
1990).
About one third of the patients dying from Balkan endemic
nephropathy (BEN) have been reported to have papillomas and/or
carcinomas of the renal pelvis, ureter or bladder. In one endemic
area in Bulgaria the relative risk of patients with BEN developing
urinary tract tumours is 90-fold higher than in the population from
non-endemic areas (Castegnaro & Chernozemsky, 1987).
Besides a possible association with OA, genetic factors may
also be involved in this disease. More analytical epidemiology
studies, and studies on oncogene activation in urothelial neoplasms
are required (Castegnaro & Chernozemsky, 1987; Radovanovic, 1989).
3. COMMENTS
The Committee reviwed studies on the metabolic disposition and
toxicology of OA, as well as limited information on the association
of OA exposure and chronic human nephropathy, endemic in Yugoslavia,
Bulgaria and Rumania.
Metabolic studies indicated that OA is absorbed mainly from the
proximal jejunum and stomach. Absorption varied from 40-60% and
serum half-life ranged from 4 to > 500 hours, depending on the
species. In blood, OA was predominantly bound to serum albumin and
other yet unidentified macromolecules, Tissue distribution of OA
residues followed the order kidney > liver > muscle > fat. OA
was excreted via the urine and faeces. Cows and sheep had a high
capacity to hydrolyse OA to the relatively non-toxic ochratoxin
alpha.
The underlying mechanism of the toxic action of OA is believed
to be specific competitive inhibition of phenylalanine-tRNA ligase
(phenylalanyl-tRNA synthetase).
Acute toxicity studies indicated that the pig and dog were the
most sensitive species and that the cause of death was attributed to
widespread multifocal haemorrhages, intravascular coagulation and
necrosis of the liver, kidney and lymphoid organs. Short-term
studies in rats, dogs and pigs showed that the dominant pathological
effects were found in the kidneys. Progressive nephropathy was
observed in each species, characterized by a deterioration in
kidney function and, histologically, by karyomegaly and necrosis of
tubular cells, and thickening of tubular basement membranes. The
severity of the effects depended on the dose and sensitivity of the
animal species used. Long-term studies with mice and rats
demonstrated that, in addition to nephropathy, there was a dose
related incidence of benign and malignant tumours. Rats appeared to
be more sensitive than mice. The majority of the genotoxicity
assays on OA were negative.
OA also exhibited teratogenic activity in rats and mice with
the CNS being the predominant target tissue.
4. EVALUATION
In experimental animals treated with ochratoxin A, both humoral
and cell-mediated immunity as well as structural components of the
immune system were adversely affected.
The effects of ochratoxin A that were considered to be most
significant by the Committee are summarized in Table 5. The kidney
appeared to be the primary target organ and the most sensitive
species was the pig. As no-observed-effect levels were frequently
not demonstrated and since the effects were observed in a small
proportion of the pig's lifetime, the Committee concluded that, in
assessing the tolerable intake of ochratoxin A, a 500-fold margin of
safety should be applied to the lowest-observed-effect levels of
0.008 mg per kg of body weight per day. On this basis, a
provisional tolerable weekly intake of 112 ng per kg of body weight
was established.
Chronic human nephropathy, endemic in some areas of the
Balkans, has been lined with exposure to ochratoxin A, as indicated
by the presence of ochratoxin A residues in local foodstuffs as well
as in the blood of inhabitants. On the other hand, some individuals
and village populations have had detectable ochratoxin A residues in
the blood, but have shown no evidence of nephropathy. This suggests
that either the effects of ochratoxin A are delayed or the disease
is caused by more than one factor. About one-third of those dying
with Balkan endemic nephropathy have had papillomas and/or
carcinomas of the renal pelvis, ureter or bladder. No quantitative
estimates of ochratoxin A dietary intake were available.
Data on the occurrence of ochratoxin A have demonstrated
significant levels in a variety of foods although the overall
incidence of positive samples is low. As a result, it is extremely
difficult to estimate total dietary exposure to ochratoxin A for the
general population, although worst-case intakes of the order of 1 to
5 ng per kg of body weight per day have been estimated in
populations when there is no evidence of nephropathy.
The Committee was informed that the occurrence of elevated
ochratoxin A levels in foodstuffs in areas with endemic nephropathy
was associated with poor conditions for grain storage; this factor
has been recognized as being important in the production of
ochratoxin A.
The Committee therefore recommended that efforts be made to
highlight the need for instituting proper storage conditions for
grain and grain products. Furthermore, monitoring of appropriate
ochratoxin A residues should be undertaken to obtain better
estimates of dietary exposure and to identify populations at greater
risk with a view to implementing preventive measure. The Committee
also encouraged further studies to elucidate the role of ochratoxin
A and other mycotoxins in nephropathy in pigs and humans, the
mechanism of induction of tumours, and the role of phenylalanine in
antagonizing the adverse effects of ochratoxin A.
Table 5
Summary of effects observed in laboratory animal studies, following
oral administration of ochratoxin A
Effect Species Duration of Lowest-observed- No-observed-
treatment effect level effect level
(mg/kg bw/day) (mg/kg bw/day)
Deterioration Pig 90 days 0.008 -a
in renal
function
Karyomegaly of Rat 90 days 0.015 -a
the proximal
tubular cells
Progressive Pig 2 years 0.04 0.008
nephropathy
Overt fetal Mouse -b 1 -a
craniofacial
anomalies
Kidney tumours Mouse 2 years 4.4 0.13
Rat 2 years 0.07 0.02
Necrosis of Dog 14 days 0.1 -a
lymphoid
tissues of
thymus and
tonsils
Table 5 (contd)
Effect Species Duration of Lowest-observed- No-observed-
treatment effect level effect level
(mg/kg bw/day) (mg/kg bw/day)
Decreased Mouse 50 days -c 0.5
antibody
response
a No-observed-effect levels were not demonstrated in these studies.
b Results refer to a teratogenicity study in which ochratoxin A was
administered on day 9 of gestation.
c Only one dose level was used.
5. REFERENCES
ALBASSAM, M.A., YONG, S.I., BHATNAGAR, R., SHARMA, A.K. & PRIOR,
M.G. (1987). Histopathologic and electron microscopic studies on
the acute toxicity of ochratoxin A in rats. Vet. Pathol., 424,
427-435.
APPELGREN, L.E. & ARORA, R.G. (1983a). Distribution of
14C-labelled ochratoxin A in pregnant mice. Food Chem. Toxicol.,
21, 563-568.
APPELGREN, L.E. & ARORA, R.G. (1983b). Distribution studies of
14C-labelled aflatoxin B1 and ochratoxin A in pregnant mice.
Vet. Res. Commun., 7, 141-144.
ARORA, R.G. (1985). Experimental mycotoxicosis: some observations
on the teratopathological effects of a single dose of aflatoxin B1
and ochratoxin A in CBA/CA mice. In: Trichothecenes and Other
Mycotoxins. (J. Lacey, Ed.), pp. 537-544. John Wiley & Sons,
Chichester, U.K.
ARORA, R.G., FRÖLEN, H. & NILSSON, A. (1981). Interference of
mycotoxins with prenatal development of the mouse. 1. Influence of
aflatoxin B1, ochratoxin A, and zearalenone. Acta Vet. Scand.,
22, 524-534.8
ARORA, R.G. & FRÖLEN, H. (1981). Interference of mycotoxins with
prenatal development of the mouse. 2. Ochratoxin A induced
teratogenic effects in relation to the dose and stage of gestation.
Acta Vet. Scand., 22, 535-552.
AUFFRAY, Y. & BOUTIBONNES, P. (1986). Evaluation of the genotoxic
activity of some mycotoxins using Escherichia coli, in the SOS
spot test. Mutat. Res., 171, 79-82.
BALLINGER, M.B., PHILLIPS, T.D. & KUBENA, L.F. (1986). Assessment
of the distribution and elimination of ochratoxin A in the pregnant
rat. 1. Food Safety, 8, 11-24.
BARNIKOL, H. & THALMANN, A. (1988). Klinische Beobachtungen beim
Schwein in Zusammenhang mit den Mykotoxinen Ochratoxin A und
Zearalenon. Tierärztl. Umsch., 43, 74-82.
BARTSCH, H., MALAVEILLE, C., CAMUS, A.M., MARTEL-PLANCHE, G., BRUN,
G., HAUTELFEVILLE, A., SABADIE, N., BARBIN, A., KUOKI, T., DREVON,
C., PICCOLI, A. & MONTESANO, R. (1980). Validation and comparative
studies on 180 chemicals with S. typhimurium strains and V79
Chinese hamster cells in the presence of various metabolizing
systems. Mutat. Res., 76, 1-50.
BAUER, J. & GAREIS, M. (1987). Ochratoxin A in der
Nahrungsmittelkette. Z. Veterinärmed. B., 34, 613-627.
BENDELE, A.M., CARLTON, W.W., KROGH, P. & LILLEHOJ, E.B. (1985a).
Ochratoxin A carcinogenesis in the (C57BL/6J x C3H)F1 mouse. J.
Natl. Cancer Inst., 75, 733-742.
BENDELE, A.M., NEAL, S.B., OBERLY, T.J., THOMPSON, C.Z., BEWSEY,
B.J., HILL, L.E., REXROAT, M.A., CARLTON, W.W. & PROBST, G.S.
(1985b). Evaluation of ochratoxin A for mutagenicity in a battery
of bacterial and mammalian cell assays. Food Chem. Toxicol., 23,
911-918.
BENDELE, A.M. & CARLTON, W.W. (1986). Incidence of obstructive
uropathy in male B6C3F1 mice on a 24-month carcinogenicity study
and its apparent prevention by ochratoxin A. Lab. Anim. Sci., 36,
282-285.
BERNDT, W.O. & HAYES, A.W. (1979). In vivo and in vitro changes
in renal function caused by ochratoxin A in the rat. Toxicology,
12, 5-17.
BOORMAN, G.A., HONG, H.L., DIETER, M.P., HAYES, H.T., POHLAND, A.E.,
STACK, M. & LUSTER, M.I. (1984). Myelotoxicity and macrophage
alteration in mice exposed to ochratoxin A. Toxicol. Appl.
Pharmacol., 72, 304-312.
CAMPBELL, M.L.,JR, MAY, J.D., HUFF, W.E. & DOERR, J.A. (1983).
Evaluation of immunity of young broiler chickens during simultaneous
aflatoxicosis and ochratoxicosis. Poult. Sci., 62, 2138-2144.
CASTEGNARO, M. & CHERNOZEMSKY, I. (1987). Endemic nephropathy and
urinary tract tumors in the Balkans. Cancer Res., 47, 3608-3609.
CHAKOR, K., CREPPY, E.E., & DIRHEIMER, G. (1988). In vivo studies
on the relationship between hepatic metabolism and toxicity of
ochratoxin A. Arch. Toxicol., Suppl., 12, 201-204.
COORAY, R. (1984). Effects of some mycotoxins on mitogen-induced
blastogenesis and SCE frequency in human lymphocytes. Food Chem.
Toxicol., 22, 529-534.
CREPPY, E.E., LUGNIER, A.A.J., BECK, G., RÖSCHENTHALER, R. &
DIRHEIMER, G. (1979a). Action of ochratoxin A on cultured hepatoma
cells reversion of inhibition by phenylalanine. FEBS Lett., 104,
287-290.
CREPPY, E.E., LUGNIER, A.A.J., FASOLO, F., HELLER, K.,
RÖSCHENTHALER, R. & DIRHEIMER, G. (1979b). In vitro inhibition of
yeast phenylalanyl-tRNA synthetase by ochratoxin A. Chem. Biol.
Interact., 24, 257-262.
CREPPY, E.E., LORKOWSKI, G., BECK, G., RÖSCHENTHALER, R. &
DIRHEIMER, G. (1980a). Combined action of citrinin and ochratoxin A
on hepatoma tissue culture cells. Toxicol. Lett., 5, 375-380.
CREPPY, E.E., SCHLEGEL, M., RÖSCHENTHALER, R. & DIRHEIMER, G.
(1980b). Phenylalanine prevents acute poisoning by ochratoxin A in
mice. Toxicol. Lett., 6, 77-80.
CREPPY, E.E., LORKOWSKI, G., RÖSCHENTHALER, R. & DIRHEIMER, G.
(1982). Kinetics of the immunosuppressive action of ochratoxin A on
mice. In: Proceedings, V International IUPAC Symposium Mycotoxins
and Phycotoxins, September 1-3, 1982, Vienna, pp. 289-292.
Austrian Chem. Soc., Vienna.
CREPPY, E.E., KERN, D., STEYN, P.S., VLEGGAAR, R., RÖSCHENTHALER, R.
& DIRHEIMER, G. (1983a). Comparative study of the effect of
ochratoxin A analogues on yeast aminoacyl-tRNA synthetases and on
the growth and protein synthesis of hepatoma cells. Toxicol.
Lett., 19, 217-224.
CREPPY, E.E., STORMER, F.C., KERN, D., RÖSCHENTHALER, R. &
DIRHEIMER, G. (1983b). Effect of ochratoxin A metabolites on yeast
phenylalanyl-tRNA synthetase and on the growth and in vivo protein
synthesis of hepatoma cells. Chem. Biol. Interact., 47, 239-247.
CREPPY, E.E., STORMER, F.C., RÖSCHENTHALER, R. & DIRHEIMER, G.
(1983c). Effects of two metabolites of ochratoxin A, (43)-4-hydroxy
ochratoxin A and ochratoxin-alpha, on immune response in mice.
Infect. Immun., 39, 1015-1018.
CREPPY, E.E., RÖSCHENTHALER, R. & DIRHEIMER, G. (1984). Inhibition
of protein synthesis in mice by ochratoxin A and its prevention by
phenylalanine. Food Chem. Toxicol., 22, 883-886.
CREPPY, E.E., KANE, A., DIRHEIMER, G., LAFARGE-FRAYSSINET, C.,
MOUSSET, S., & FRAYSSINET, C. (1985). Genotoxicity of ochratoxin A
in mice: DNA single-strand break evaluation in spleen, liver and
kidney. Toxicol. Lett., 28, 29-35.
DWIVEDI, P. & BURNS,R.B. (1984a). Pathology of ochratoxicosis A in
young broiler chicks. Res. Vet. Sci., 36, 92-103.
DWIVEDI, P. & BURNS, R.B. (1984b). Effect of ochratoxin A on
immunoglobulins in broiler chicks. Res. Vet. Sci., 36, 117-121.
ELLING, F. (1979a). Enzyme histochemical studies of ochratoxin
A-induced mycotoxic porcine nephropathy. (abstract). In: 6th
International Symposium Animal, Plant Microbial Toxins. Vol 17.
ELLING, F. (1979b). Ochratoxin A-induced mycotoxic porcine
nephropathy: alterations in enzyme activity in tubular cells. Acta
Pathol. Microbiol. Scand., 87, 237-243.
ELLING, F. (1983). Feeding experiments with ochratoxin
A-contaminated barley to bacon pigs. IV. Renal lesions. Acta.
Agric. Scand., 33, 153-159.
ELLING, F., NIELSEN, J.P., LILLEHOJ, E.B., THOMASSEN, M.S. &
STORMER, F.C. (1985). Ochratoxin A-induced porcine nephropathy:
enzyme and ultrastructure changes after short-term exposure.
Toxicol., 23, 247-254.
ENDOU, H., KOSEKI, C., YAMADA, H. & OBARA, T. (1986). Evaluation of
nephrotoxicity using isolated nephron segments. Dev. Toxicol.
Environ. Sci., 14, 207-216.
FRIIS, C., BRINN, R., & HALD, B. (1988). Uptake of ochratoxin A by
slices of pig kidney cortex. Toxicology, 52, 209-217.
FUCHS, R., RADI, B., PERAICA, M., HULT, K. & PLESTINA, R. (1988).
Enterohepatic circulation of ochratoxin A in rats. Period. Biol.,
90, 39-42.
FUKAL, L. & REISNEROVA, H. (1990). Monitoring of aflatoxins and
ochratoxin A in Czechoslovak human sera by immunoassay. Bull.
Environ. Contam. Toxicol., 44, 345-349.
FUKUI, Y., HOSHINO, K., KAMEYANA, Y., YASUI, T., TODA, C. & NAGANO,
H. (1987). Placental transfer of ochratoxin A and its cytotoxic
effect on the mouse embryonic brain. Food Chem. Toxicol., 25,
17-24.
GALTIER, P. (1978). Contribution of pharmacokinetic studies to
mycotoxicology - ochratoxin A. Vet. Sci. Commun., 1, 349-358.
GALTIER, P., CHARPENTEAU, J.L., ALVINERIE, M. & LABOUCHE, C. (1979).
The pharmacokinetic profile of ochratoxin A in the rat after oral
and intravenous administration. Drug Metabol. Dispos., 7,
429-434.
GALTIER, P., CAMGUILHEM, R. & BODIN, G. (1980). Evidence for in
vitro and in vivo interaction between ochratoxin A and three
acidic drugs. Food Cosmet. Toxicol., 18, 493-496.
GALTIER, P., ALVINERIE, M. & CHARPENTEAU, J.L. (1981). The
pharmacokinetic profiles of ochratoxin A in pigs, rabbits and
chickens. Food Cosmet. Toxicol., 19, 735-738.
GAREIS, M., MÄRTLBAUER, E., BAUER, J. & GEDEK, B. (1988). Bestimmung
von Ochratoxin A in Muttermilch. Z. Lebensm. Unters. Forsch., 186,
114-117.
GOLINSKI, P. & GRABARKIEWICZ-SZCZESNA, J. (1989). A trial of
determination of the daily dose of ochratoxin A consumed by humans in
Poland. Rocz. Panstw. Zakl. Hig., 40, 50-52. (in Polish]
HAGELBERG, S., HULT, K. & FUCHS, R. (1989). Toxicokinetics of
ochratoxin A in several species and its plasma-binding properties.
J. Appl. Toxicol., 9, 91-96.
HALD, B. (1989). Human exposure to ochratoxin A. Bioact. Molec.,
10, 57-67.
HANSEN, C.E., DUELAND, S., DREVON, C.A. & STORMER, F.C. (1982).
Metabolism of ochratoxin A by primary cultures of rat hepatocytes.
Appl. Environ. Microbiol., 43, 1267-1271.
HARVEY, R.B., KUBENA, L.F., NAQI, S.A., GYIMAH, J.E., CORRIER, D.E.,
PANIGRAHY, B. & PHILLIPS, T.D. (1987b). Immunologic effects of low
levels of ochratoxin A in ovo: utilization of a chicken embryo
model. Avian Dis., 31, 787-791.
HARWIG, J., KUIPER-GOODMAN, T. & SCOTT, P.M. (1983). Microbial food
toxicants: ochratoxins. In: Handbook of Foodborne Diseases of
Biological Origin. (M. Rechcigl, Ed.), pp 193-238. CRC Press, Boca
Raton, FL.
HATEY, F. & GALTIER, P. (1977). Toxicité a court terme de
l'ochratoxine A chez le rat; quelques manifestations biochimiques de
l'intoxication. Ann. Rech. Vét., 8, 7-12.
HAUBECK, H.D., LORKOWSKI, G., KOLSH, E. & RÖSCHENTHALER, R. (1981).
Immunosuppression by ochratoxin A and its prevention by phenylalanine.
Appl. Environ. Microbiol., 41, 1040-1042.
HOLMBERG, T., THUVANDER, A. & HULT, K. (1988). Ochratoxin A as a
suppressor of mitogen-induced blastogenesis of porcine blood
lymphocytes. Acta Vet. Scand., 29, 219-223.
HONG, H.H.L., JAMESON, C.W. & BOORMAN, G.A. (1988). Residual
haematopoietic effect in mice exposed to ochratoxin A prior to
irradiation. Toxicology, 53, 57-67.
HULT, K., TEILING, A. & GATENBECK, S. (1976). Degradation of
ochratoxin A by a ruminant. Appl. Environ. Microbiol., 32, 443-444.
HULT, K., HÖKBY, E., HÄGGLUND, U., GATENBECK, S., RUTQVIST, L. &
SELLYEY, G. (1979). Ochratoxin A in pig blood: method of analysis and
use as a tool for feed studies. Appl. Environ. Microbiol., 38,
772-776.
HULT, K., PLESTINA, R., HABAZIN-NOVAK, V., RADI, B. & CEOVI, S.
(1982). Ochratoxin A in human blood and Balkan endemic nephropathy.
Arch. Toxicol., 51, 313-321.
HULT, K. & FUCHS, R. (1986). Analysis and dynamics of ochratoxin A in
biological systems. In: Mycotoxins and Phycotoxins. Sixth
International IUPAC Symposium Mycotoxins and Phycotoxins. Pretoria,
Rep. of South Africa, July 22-25, 1985. (P.S. Steyn and R. Vleggaar,
Eds.), pp. 365-376. Elsevier Science Publishers B.V., Amsterdam.
IARC (International Agency for Research on Cancer). (1976).
Ochratoxin A. In: IARC Monographs on the Evaluation of Carcinogenic
Risk of Chemicals to Man. Vol. 10. Some Naturally Occurring
Substances pp.191-197. International Agency for Research on Cancer,
Lyon, France.
JUNG, K.Y., & ENDOU, H. (1989). Nephrotoxicity assessment by
measuring cellular ATP content. II. Intranephron site of ochratoxin A
nephrotoxicity. Toxicol. Appl. Pharmacol., 100, 383-390.
KANE, A., CREPPY, E.E., Röschenthaler, R. & Dirheimer, G. (1986a).
Changes in urinary and renal tubular enzymes caused by subchronic
administration of ochratoxin A in rats. Toxicology, 42, 233-243.
KANE, A., CREPPY, E.E., ROTH, A., RÖSCHENTHALER, R. & DIRHEIMER, G.
(1986b). Distribution of the [H3]-label from low doses of
radioactive ochratoxin A ingested by rats, and evidence for DNA
single-strand breaks caused in liver and kidneys. Arch. Toxicol.,
58, 219-224.
KANISAWA, M., SUZUKI, S., KOZUKA, Y. & YAMAZAKI, M. (1977).
Histopathological studies on the toxicity of ochratoxin A in rats 1.
Acute oral toxicity. Toxicol. Appl. Pharmacol., 41, 55-64.
KANISAWA, M. & SUZUKI, S. (1978). Induction of renal and hepatic
tumors in mice by ochratoxin A; a mycotoxin. Gann., 69, 599-600.
KANISAWA, M., SUZUKI, S. & MOROI, K. (1979). Ochratoxin-alpha, is it
an inducing factor of acute enteritis by ochratoxin A? In: 6th
International Symposium Animal, Plant, Microbial Toxins, Uppsala,
Sweden.
KANISAWA, M. (1984). Synergistic effect of citrinin on hepatorenal
carcinogenesis of OA in mice. In: Toxigenic Fungi - Their Toxins and
Health Hazard (H. Kurata and Y. Ueno, Eds.), pp. 245-254. Kodansha,
Tokyo and Elsevier, Amsterdam.
KIESSLING, K.H., PETTERSSON, H., SANDHOLM, K. & OLSEN, M. (1984).
Metabolism of aflatoxin, ochratoxin, zearalenone, and three
trichothecenes by intact rumen fluid, rumen protozoa, and rumen
bacteria. Appl. Environ. Microbiol., 47, 1070-1073.
KIHARA, T., NAKAGAWA, K., YAMAMOTO, Y. & TANIMURA, T. (1984).
Behavioural teratological study of rat offspring exposed to ochratoxin
A in utero by using cross-fostering. (abstract). Teratology, 30,
10A.
KITCHEN, D.N., CARLTON, W.W. & HINSMAN, E.J. (1977a). Ochratoxin A
and citrinin induced nephrosis in beagle dogs III. Terminal renal
ultrastructural alterations. Vet. Pathol., 14, 392-406.
KITCHEN, D.N., CARLTON, W.W. & TUITE, J. (1977b). Ochratoxin A and
citrinin induced nephrosis in beagle dogs. I. Clinical and
clinicopathological features. Vet. Pathol., 14, 154-172.
KITCHEN, D.N., CARLTON, W.W. & TUITE, J. (1977c). Ochratoxin A and
citrinin induced nephrosis in beagle dogs. II. Pathology. Vet.
Pathol., 14, 261-272.
KONRAD, I. & RÖSCHENTHALER, R. (1977). Inhibition of phenylalanine
tRNA synthetase from Bacillus subtillis by ochratoxin A. FEBS
Lett., 83, 341-347.
KROGH, P. & ELLING, F. (1977). Mycotoxic nephropathy. Vet. Sci.
Commun., 1, 51-63.
KROGH, P., GYRD-HANSEN, N., HALD, B., LARSEN, S., NEILSEN, J.P.,
SMITH, M., IVANOFF, C. & MEISNER, H. (1988). Renal enzyme activities
in experimental ochratoxin A-induced porcine nephropathy: diagnostic
potential of phosphoenolpyruvate carboxykinase and gamma-glutamyl
transpeptidase activity. J. Toxicol. Environ. Health, 23, 1-14.
KUCZUK, M.H., BENSON, P.M., HEATH, H. & HAYES, W. (1978). Evaluation
of the mutagenic potential of mycotoxins using Salmonella typhimurium
and Saccharomyces cerevisiae. Mutat. Res., 53,11-20.
KUIPER-GOODMAN, T. & SCOTT, P.M. (1989). Risk Assessment of the
Mycotoxin Ochratoxin A. Biomed. Environ. Sci., 2, 179-248.
KUMAGAI, S. & AIBARA, K. (1982). Intestinal absorption and secretion
of ochratoxin A in the rat. Toxicol. Appl. Pharmacol., 64, 94-102.
KUMAGAI, S. (1985). Ochratoxin A: plasma concentration and excretion
into bile and urine in albumin-deficient rats. Food Chem. Toxicol.,
23, 941-943.
KUMAGAI, S. (1988). Effects of plasma ochratoxin A and luminal pH on
the jejunal absorption of Ochratoxin A in rats. Food Chem. Toxicol.,
26, 753-758.
LEA, T., STEIEN, K. & STORMER, F.C. (1989). Mechanism of Ochratoxin
A induced immunosuppression. Mycopathologia., 107, 153-160.
LUSTER, M.I., GERMOLEC, D.R., BURLESON, G.R., JAMESON, C.W.,
ACKERMANN, M.F., LAMM, K.R. & HAYES, H.T. (1987). Selective
immunosuppression in mice of natural killer cell activity by
ochratoxin A. Cancer Res., 47, 2259-2263.
MADSEN, A., MORTENSEN, H.P. & HALD, B. (1982). Feeding experiments
with ochratoxin A contaminated barley for bacon pigs. I. Influence on
pig performance and residues. Acta Agric. Scand., 32, 225-239.
MANOLOVA, Y., MANOLOV, G., PARVANOVA, L., PETKOVA-BOCHAROVA, T.,
CASTEGNARO, M. & CHERNOZEMSKY, I.N. (1990). Induction of
characteristic chromosomal aberrations, particularly x-trisomy, in
cultured human lymphocytes treated by ochratoxin A; a mycotoxin
implicated in Balkan endemic nephropathy. Mutat. Res., in press.
MEISNER, H. & SELANIK, P. (1979). Inhibition of renal gluconeogenesis
in rats by ochratoxin. Biochem. J., 180, 681-684.
MEISNER, H., CIMBALA, M.A. & HANSON, R.W. (1983). Decrease of renal
phospho-enolpyruvate carboxykinase RNA and poly(A) RNA level by
ochratoxin A. Arch. Biochem. Biophys., 223, 264-270.
MEISNER, H. & KROGH, P. (1986). Phosphoenolpyruvate carboxykinase as
a selective indicator of ochratoxin A induced nephropathy. Dev.
Toxicol. Environ. Sci., 14, 199-206.
MEISNER, H. & POLSINELLI, L. (1986). Changes in renal mRNA species
abundance by ochratoxin A. Biochem. Pharmacol., 35, 661-665.
MORÉ, J. & GALTIER, P. (1974). Toxicité de l'ochratoxine A. I. Effet
embryotoxique et tératogène chez le rat. Ann. Réch. Vet., 5,
167-178.
MORÉ, J. & GALTIER, P. (1975). Toxicité de l'ochratoxine A. II.
Effets du traitement sur la descendance (F1 et F2) de rattes
intoxiquées. Ann. Rech. Vét., 6, 379-389.
MORI, H., KAWAI, K., OHBAYASHI, F., KUNIYASU, T., YAMAZAKI, M.,
HAMASAKI, T. & WILLIAMS, G.M. (1984). Genotoxicity of a variety of
mycotoxins in the hepatocyte primary culture/DNA repair test using rat
and mouse hepatocytes. Cancer Res., 44, 2918-2923.
MOROI, K., SUZUKI, S., KUGA, T., YAMAZAKI, M. & KANISAWA, M. (1985).
Reduction of ochratoxin A toxicity in mice treated with phenylalanine
and phenobarbital. Toxicol. Lett., 25, 1-5.
MORTENSEN, H.P., HALD, B., LARSEN, A.E. & MADSEN, A. (1983a).
Ochratoxin A contaminated barley for sows and piglets. Pig performance
and residues in milk and pigs. Acta Agric. Scand., 33, 349-352.
MORTENSEN, H.P., HALD, B. & MADSEN, A. (1983b). Feeding experiments
with ochratoxin A contaminated barley for bacon pigs. 5. Ochratoxin A
in pig blood. Acta Agric. Scand., 33, 235-239.
MUNRO, I.C., MOODIE, C.A., KUIPER-GOODMAN, T., SCOTT, P.M. & GRICE,
H.C. (1974). Toxicologic changes in rats fed graded dietary levels of
ochratoxin A. Toxicol. Appl. Pharmacol., 28, 180-188.
NGAHA, E.O. (1985). Biochemical changes in the rat during
experimentally induced acute ochratoxicosis. Enzyme, 33, 1-8.
NTP (1989). NTP technical report on the toxicology and carcinogenesis
studies of ochratoxin A (CAS NO. 303-47-9) in F344/N rats (gavage
studies). NIH Publication No. 88-2813 (G. Boorman, Ed.), U.S.
Department of Health and Human Services National Institutes of Health,
Research Triangle Park, NC.
PARKER, R.W., PHILLIPS T.D., KUBENA, L.F., RUSSELL, L.H. &
HEIDELBAUGH, N.D. (1982). Inhibition of pancreatic carboxypeptidase
A: a possible mechanism of interaction between penicillic acid and
ochratoxin A. J. Environ. Sci. Health, B17, 77-91.
PATTERSON, D.S.P., ROBERTS, B.A. & SMALL, B.J. (1976). Metabolism of
ochratoxins A and B in the pig during early pregnancy and the
accumulation in body tissue of ochratoxin A only. Food Cosmet.
Toxicol., 14, 439-442.
PETKOVA-BOCHAROVA, T., CHERNOZEMSKY, I.N. & CASTEGNARO, M. (1988).
Ochratoxin A in human blood in relation to Balkan endemic nephropathy
and urinary system tumours in Bulgaria. Food Addit. Contam., 5,
299-301.
PETTERSSON, H., KIESSLING, K.H. & CISZUK, P. (1982). Degradation of
ochratoxin A in rumen. In: Proceedings, V International IUPAC
Symposium Mycotoxins Phycotoxins, September 1-3, 1982, Vienna,
Austria, pp. 313-316. Austrian Chem. Soc., Vienna.
PITOUT, M.J. (1969a). The hydrolysis of ochratoxin A by some
proteolytic enzymes. Biochem. Pharmacol., 18, 485-491.
PITOUT, M.J. (1969b). A rapid spectrophotometric method for the assay
of carboxypeptidase A. Biochem. Pharmacol., 18, 1829-1836.
PITOUT, M.J. & NEL, W. (1969). The inhibitory effect of ochratoxin A
on bovine carboxypeptidase A in vitro. Biochem. Pharmacol., 18,
1837-1843.
PRIOR, M.G. & SISODIA, C.S. (1982). The effects of ochratoxin A on
the immune response of Swiss mice. Can. J. Comp. Med., 46, 91-96.
RADOVANOVIC, Z (1989). Aetiology of Balkan nephropathy: a reappraisal
after 30 years. Europ. J. Epidemiol., 5, 372-376.
RAO, C.N. (1987). Obstructive uropathy in group caged male B6C3F1
mice on a 24-month carcinogenicity study. (letter). Lab. Anim. Sci.,
37, 8-9.
REISS, J. (1986). Detection of genotoxic properties of mycotoxins
with the SOS chromotest. Naturwiss., 73, 677-678.
RÖSCHENTHALER, R., CREPPY, E.E. & DIRHEIMER, G. (1984). Ochratoxin A:
On the mode of action of a ubiquitous mycotoxin. J. Toxicol., 3,
53-86.
ROTH, A., CHAKOR, K., CREPPY, E.E., KANE, A., RÖSCHENTHALER, R. &
DIRHEIMER, G. (1988). Evidence for an enterohepatic circulation of
ochratoxin A in mice. Toxicology, 48, 293-308.
ROTH, A., CREPPY, E.E., KANE, A., BACHA, H., STEYN, P.S.,
RÖESCHENTHALER, R. & DIRHEIMER, G. (1989). Influence of ochratoxin B
on the ochratoxin A inhibition of phenylalanyl-tRNA formation in
vitro and protein synthesis in hepatoma tissue culture cells.
Toxicol. Lett., 45, 307-313.
RUPI, V., LIKER, B., MUZI, S., BOGDANI, I.C. & BALZER, I. (1978).
The effects of ochratoxin A in feed on the blood content of lipids and
proteins in chickens. Arh. Hig. Rada. Toxsikol., 29, 139-145. [in
Serbo-Croatian]
SINGH, J. & HOOD, R.D. (1985). Maternal protein deprivation enhances
the teratogenicity of ochratoxin A in mice. Teratology, 32,
381-388.
SOKOL, P.P., RIPICH, G., HOLOHAN, P.D. & ROSS, C.R. (1988). Mechanism
of ochratoxin A transport in kidney. J. Pharmacol. Exp. Ther., 246,
460-465.
SREEMANNARAYANA, O., FROHLICH, A.A., VITTI, T.G., MARQUARDT, R.R. &
ABRAMSON, D. (1988). Studies of the tolerance and disposition of
ochratoxin A in young calves. Anim. Sci., 66, 1703-1711.
STEIN, A.F., PHILLIPS, T.D., KUBENA, L.F. & HARVEY, R.B. (1985).
Renal tubular secretion and reabsorption as factors in ochratoxicosis:
Effects of probenecid on nephrotoxicity. J. Toxicol. Environ.
Health, 16, 593-605.
STETINA, R. & VOTAVA, M. (1986). Induction of DNA single-strand
breaks and DNA synthesis inhibition by patulin, ochratoxin A,
citrinin, and aflatoxin B, in cell lines CHO and AWRF. Folia Biol.,
32, 128-144.
STOJKOVI, R., HULT, K., GAMULIN, S. & PLESTINA, R. (1984). High
affinity binding of ochratoxin A to plasma constituents.
Biochem.Intern., 9, 33-38.
STONARD, M.D., GORE, C.W., OLIVER, G.J.A. & SMITH, I.K. (1987).
Urinary enzymes and protein patterns as indicators of injury to
different regions of the kidney. Fund. Appl. Toxicol., 9, 339-351.
STOREN, O., HELGERUD, P., HOLM, H. & STORMER, F.C. (1982a). Formation
of (43)-4-hydroxyochratoxin A and ochratoxin B from ochratoxin A by
rats. In: Proceedings, V International IUPAC Symposium Mycotoxins and
Phycotoxins, September l-3,1982, Vienna, Austria, pp. 321-324.
Austrian Chem. Soc., Vienna.
STOREN, O., HOLM, H. & STORMER, F.C. (1982b). Metabolism of
ochratoxin A by rats. Appl. Environ. Microbiol., 44, 785-789.
STORMER, F.C., HANSEN, C.E., PEDERSEN, J.I., HVISTENDAHL, G. & AASEN,
A.J. (1981). Formation of (4R)- and (4S)-4-hydroxyochratoxin A from
ochratoxin A by liver microsomes from various species. Appl.
Environ. Microbiol., 42, 1051-1056.
STORMER, F.C., STOREN, O., HANSEN, C.E., PEDERSEN, J.I. & AASEN, A.J.
(1983). Formation of (4R)- and (4S)-4-hydroxchratoxin A and
10-hydroxyochratoxin A from ochratoxin A by rabbit liver miyorosomes.
Appl. Environ. Microbial., 45, 1183-1187.
STORMER, F.C., KOLSAKER,P., HOLM, H., ROGSTAD, S. & ELLING, F. (1985).
Metabolism of ochratoxin B and its possible effects upon the
metabolism and toxicity of ochratoxin A in rats. Appl. Environ.
Microbial., 49, 1108-1112.
SUBRAMANIAN, S., KANTHASAMY, A., BALASUBRAMANIAN, N., SEKAR, N. &
GOVINDASAMY, S. (1989). Ochratoxin A toxicity on carbohydrate
metabolism in rats. Bull. Environ. Contam. Toxicol., 43, 180-184.
SUZUKI, S., KOZUKA, Y., SATOH, T. & YAMAZAKI, M. (1975). Studies on
the nephrotoxicity of ochratoxin A in rats. Toxicol. Appl.
Pharmacol., 34, 479-490.
SUZUKI, S., SATOH, T. & YAMAZAKI, M. (1977). The pharmacokinetics of
ochratoxin A in rats. Jpn. J. Pharmacol., 27, 735-744.
SUZUKI, S., MOROI, K., KANISAWA, M. & SATOH, T. (1986). Effects of
drug metabolizing enzyme inducers on carcinogenesis and toxicity of
ochratoxin A in mice (abstract). Toxicol. Lett., 31(suppl.), 206.
UUENO, Y., AND KUBOTA, K. (1976). DNA-attacking ability of
carcinogenic mycotoxins in recombination-deficient mutant cells of
Bacillus subtillis. Cancer Res., 36, 445-451.
UMEDA, M., TSUTSUI, T., & SAITO, M. (1977). Mutagenicity and
inducibility of DNA single-strand breaks and chromosome aberrations by
various mycotoxins. Gann, 68, 619-625.
WARD, J.M., GOODMAN, D.G., SQUIRE, R.A., CHU, K.C. & LINHART, M.S.
(1979). Neoplastic and nonneoplastic lesions in aging (C57BL/6N x
C3H/HeN)F1 (B6C3F1) mice. J. Nat. Cancer Inst., 63, 849-854.
WEHNER, F.C., THIEL, P.G., VAN RENSBURG, S.J., & DEMASIUS, I.P.C.
(1978). Mutagenicity to Salmonella typhimurium of some Aspergillus
and Penicillium mycotoxins. Mutat. Res., 58, 193-203.