First draft prepared by
Dr J. van Engelen
Centre for Substances and Risk Assessment, National Institute of Public Health and the Environment, Bilthoven, Netherlands
The toxicity of chlorpropham was evaluated by the Joint Meeting in 1963 (Annex 1, reference 2) and 1965 (Annex 1, reference 3); an ADI could not be allocated at either Meeting. A full data package was submitted for consideration by the present Meeting.
(a) Absorption, distribution, and excretion
In a range-finding study, groups of two male and two female Sprague-Dawley rats received a single oral dose of 5, 100, 300, or 500 mg/kg bw of [ring-14C]chlorpropham dissolved in corn oil. The radiolabel in urine (including cage rinse) and faeces was determined for 3 days after dosing, and expired [14C]carbon dioxide was collected for 48 h from the group given 5 mg/kg bw. A gross profile of metabolites was established by high-performance liquid chromatography (HPLC) and/or thin-layer chromatography (TLC) in 24-h urinary and faecal samples from animals of each sex in all groups (see section on biotransformation). Males and females excreted an average of 0.02% and 0.01% of the administered dose as [14C]carbon dioxide in the expired air, respectively, within the first 24 h after dosing; no [14C]carbon dioxide was expired during the next 24 h. The group given 5 mg/kg bw excreted > 90% of the administered radiolabel in urine and faeces within 24 h, while mice at the higher doses excreted approximately 80%. Urine was the main route of excretion at all doses (73–92% of the dose after 72 h). Animals at 300 and 500 mg/kg bw excreted more activity in the faeces within 72 h (12–15% for males; 13–21% for females) than those at the lower doses (9–13% for males; 5–8% for females) (Robinson & Liu, 1991).
In a study performed according to GLP and to FIFRA Guideline 40 CFR 158.340 reference 85-1 (essentially the same as OECD Guideline No. 417), four groups of five male and five female Sprague-Dawley rats received a single oral dose of 5 or 200 mg/kg bw of [ring- 14C]chlorpropham in corn oil, oral doses of 5 mg/kg bw per day of unlabelled chlorpropham in corn oil for 14 days followed by 5 mg/kg bw of [ring- 14C]chlorpropham in corn oil on day 15 or a single intravenous injection of 0.5 mg/kg bw of [ring- 14C]chlorpropham in 0.9% NaCl. A control group of two male and two female rats received a single oral dose of the vehicle. Urine (including cage rinse) and faeces were collected for 7 days after dosing with the labelled compound, and then the animals were killed. Radiolabel was determined in excreta, several tissues, blood, plasma, and carcass. Over the 7 days after dosing, 89–97% of the adminstered radiolabel was excreted in urine and 4–7% in faeces, mostly within the first 24 h. The excretion pattern was not affected by route of administration, sex, or the frequency or size of the dose. The percentages recovered are shown in Table 1. No radiolabel was detected in brain, pancreas, testis, bone, fat, uterus, or seminal vesicles in any of the treated groups 7 days after dosing. In the group treated with 0.5 mg/kg bw intravenously, no radiolabel was detected in any of the other tissues examined or in blood or plasma (limit of detection not reported). The amounts of radiolabel in blood, plasma, and other tissues in these groups are shown in Table 1 (Robinson & Liu, 1991).
Table 1. Excretion of radiolabel by Wistar rats given chlorpropham labelled on the ring or chain
|
Route |
Dose (mg/rat) |
14 C label |
Per cent of administered dose |
||||||
|
Urine |
Faeces |
14 CO2 |
|||||||
|
0–24 h |
24–48 h |
48–72 h |
72–96 h |
Total |
(0–96 h) |
(0–96 h) |
|||
|
Oral |
3.5 |
Ring |
78 |
5.2 |
0.8 |
0.3 |
84 |
4.5 |
ND |
|
Intraperitoneal |
3.3 |
Ring |
61 |
19 |
6.2 |
1.4 |
88 |
0.2 |
ND |
|
Oral |
3.5 (neomycin pretreated) |
Ring |
70 |
2.8 |
0.6 |
0.2 |
73 |
10 |
ND |
|
Oral |
3.5 |
Chain |
44 |
2.6 |
0.34 |
0.19 |
47 |
3.2 |
20 |
|
Intraperitoneal |
3.3 |
Chain |
44 |
5.7 |
1.3 |
0.2 |
51 |
0.7 |
17 |
|
Oral |
3.5 (neomycin pretreated) |
Chain |
38 |
3.2 |
0.68 |
0.47 |
43 |
9.2 |
14 |
From Bobik et al. (1972)
ND, not determined
Bobik et al. (1972) reported the results of two studies that were not performed according to GLP or any guideline. In the first, groups of six male Wistar rats weighing about 250 g each received an oral dose of 3.5 mg of [14C-ring]- or [14C-side-chain (isopropyl)]chlorpropham (purity, > 98.5%) as a suspension in methylcellulose mucilage or an intraperitoneal dose of 3.3 mg of [14C-ring]- or [14C-isopropyl]chlorpropham in 50% aqueous ethanol. Groups of three animals were given neomycin 24 h before the oral dose of labelled chlorpropham to examine the possibility that chlorpropham might be hydrolysed to isopropanol in the gut by neomycin-susceptible microflora. Excretion of radiolabel in urine, faeces, and expired carbon dioxide was determined (Table 1). In the second study, three male Wistar rats given a single intravenous dose of 1.0 mg of [14C-ring]- or [14C-isopropyl]chlorpropham (purity, > 98.5%) excreted 40 and 38%, respectively, of the administered radiolabel in bile within 6 h. The extensive (about 40%) biliary excretion seen in this study combined with the low faecal excretion in the first study indicated almost complete reabsorption of biliary metabolites.
Fang et al. (1974) reported the results of five studies of excretion and distribution that were not performed according to GLP or any guideline. In the first, groups of two to four adult female Wistar rats weighing an average of 270 g received a single oral dose of 0.94, 11, 21, or 51 mg of [14C-side-chain (isopropyl)]chlorpropham (purity, > 99%) or 0.91 or 21 mg of [14C-ring]-chlorpropham (purity, > 99%) in corn oil by oral gavage, providing doses ranging from 4 to 200 mg/kg bw. Excretion of radiolabel in urine, faeces, and carbon dioxide was determined for 72 h after dosing (see Table 2). No difference in excretion pattern was seen by dose.
Table 2. Excretion of radiolabel by rats given chlorpropham labelled in the ring or chain
|
Dose (mg/rat) |
14 C label |
Per cent of administered dose |
||||||
|
Urine |
Faeces |
CO2 |
||||||
|
0–24 h |
24–48 h |
48–72 h |
0–24 h |
24–48 h |
48–72 h |
0–72 h |
||
|
0.94 |
Chain |
45 |
3.0 |
1.1 |
3.1 |
0.4 |
0 |
44 |
|
11 |
Chain |
52 |
6.6 |
1.1 |
1.5 |
1.3 |
0.3 |
34 |
|
21 |
Chain |
60 |
3.1 |
0.7 |
4.7 |
0.6 |
0.2 |
27 |
|
51 |
Chain |
52 |
5.1 |
1.1 |
5.7 |
0.9 |
0.2 |
31 |
|
Mean |
Chain |
51 |
4.1 |
1.0 |
3.6 |
0.8 |
0.2 |
35 |
|
0.91 |
Ring |
76 |
3.9 |
0.5 |
8.7 |
0.7 |
0.2 |
0 |
|
21 |
Ring |
80 |
3.4 |
0.7 |
3.9 |
1.7 |
0.4 |
0 |
|
Mean |
Ring |
78 |
3.7 |
0.6 |
6.3 |
1.2 |
0.2 |
0 |
From Fang et al. (1974)
Seven adult female Wistar rats weighing an average of 270 g received a single oral dose of 0.91 mg of [14C-ring]chlorpropham (purity, > 99%) in corn oil and were killed after 0.5, 1, 2, 4, 6, 12, and 24 h. Determination of radiolabel in dry tissues showed peaks 1–2 h after dosing, except in the intestine, where the concentration declined rapidly. The greatest activity was detected in kidney, intestine, liver, blood, and lungs. Significant amounts of radiolabel crossed the blood–brain barrier and accumulated in the brain. The half-lives were 11 h in brain, 8.9 h in fat, 8.1 h in liver, 6.2 h in kidney, 4.6 h in muscle, 4.3 h in intestine, 4.1 h in lung, 3.7 h in heart, 3.6 h in blood, 3.2 h in spleen, and 2.5 h in stomach.
Five pregnant rats (stage of gestation not reported; average weight, 340 g) received a single oral dose of 0.25 mg of [14C-ring]chlorpropham (purity, > 99%) and were killed 2, 4, 6, 12, and 24 h after dosing. Radiolabel was determined in tissues and fetuses. The distribution in tissues was similar to that in non-pregnant rats. The radiolabel was readily transferred to fetuses, where the amounts declined more slowly than in the kidneys, liver, lung, and blood of the dams.
Three nursing rats received, just after parturition, a single oral dose of 0.25 mg of [14C-ring]chlorpropham (purity, > 99%), and radiolabel was determined in the tissues of the pups up to 7 days after dosing. Activity was found in milk in the stomach on days 1–3 and in blood, liver, kidney, intestine, brain, and carcass on days 1–4. By day 7, no radiolabel was detected in any tissue. The radiolabel was evenly distributed throughout all tissues, in contrast to the situation in adult rats. Considerable differences were seen in tissues of pups from different litters.
Seven of the adult female Wistar rats that had received a single oral dose of 0.91 mg of [14C-ring]chlorpropham in corn oil and were killed after 0.5, 1, 2, 4, 6, 12, and 24 h, respectively, were used to study the intracellular distribution of 14C in liver and kidneys. In the liver, about 30 and 50% of the 14C present was in the nuclear and soluble fractions, respectively, 1 h after dosing. After 24 h, the amount of 14C in the soluble fraction had decreased to 7% and that in the nuclear fraction had increased to 63% of the 14C present. The proportions in the mitochondrial and microsomal fractions remained at approximately 10% of the total throughout the 24 h after dosing. In the kidneys, more 14C was found in the soluble fraction and less in the other fractions. The effect of elapsed time on the distribution of radiolabel between subcellular fractions was comparable to that in the liver.
Rats
In a range-finding study, groups of two male and two female rats received a single oral dose of 5, 100, 300, or 500 mg/kg bw of [14C-ring]chlorpropham in corn oil. The gross metabolic profile was determined by HPLC and/or TLC in 24-h urinary and faecal samples fom all animals. The distribution of metabolites in urine from animals given 100 mg/kg bw or more was different from that of rats given 5 mg/kg bw. At the lowest dose, chlorpropham represented a major peak in faeces from females but not in those from males, while no major peak was seen in either males or females at higher doses. Twelve metabolites were identified in urine and faeces from animals at 500 mg/kg bw, and two were identified partially (Robinson & Liu, 1991).
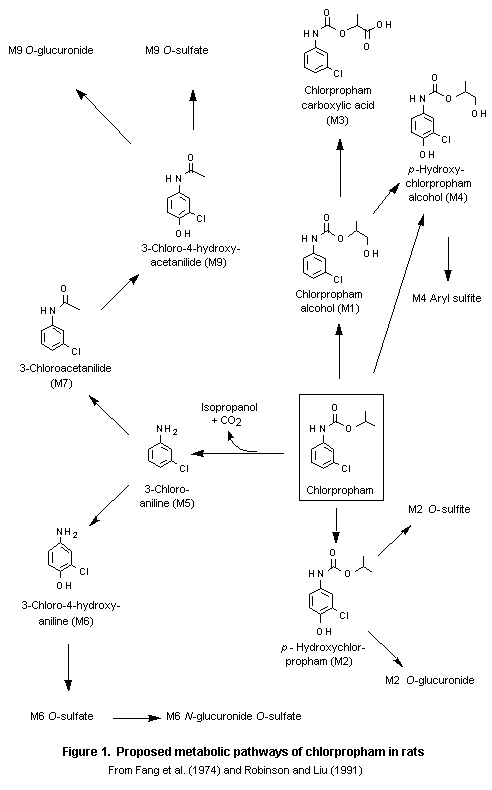
Four groups of five male and five female rats received a single oral dose of 5 or 200 mg/kg bw of [14C-ring]chlorpropham in corn oil or daily oral doses of unlabelled chlorpropham at 5 mg/kg bw in corn oil for 14 days followed by the same dose of [14C-ring]chlorpropham on day 15 or a single intravenous injection of 0.5 mg/kg bw of [14C-ring]chlorpropham in 0.9% NaCl. Urine and faeces collected over the first 24 h were analysed for metabolites. The study was performed according to GLP and to FIFRA Guideline 40 CFR 158.340 reference no. 85-1 (essentially the same as OECD Guideline No. 417). A total of 21 metabolites were detected, 13 of which accounted for 88–95% of the administered dose (see Table 3), mainly in the urine. No appreciable difference in the total profile of metabolites was seen according to dose or sex. In the urine, aryl-O-sulfate conjugates accounted for 58–70% of the administered dose. The main metabolites were M2-O-sulfate (mean percentage of administered dose, 39%), M9-O-sulfate (16%), and M2 (14%). Most of the radiolabel in faeces was in the form of free metabolites. Unchanged chlorpropham was detected in some faecal samples but not in urine. Three major metabolic pathways were proposed (see Figure 1), involving aromatic hydroxylation, oxidation of the isopropyl side-chain, and carbamate hydrolysis followed by rearrangement to 3-chloroaniline.
Table 3. Distribution of chlorpropham and its metabolites in urine and faeces of rats treated orally
|
Code |
Compound |
Mean per cent of administered dose |
|
|
Chlorpropham |
0.3 |
|
M1 |
Chlorpropham alcohol |
0.4 |
|
M3 |
Chlorpropham carboxylic acid |
4.0 |
|
M4 |
para-Hydroxychlorpropham alcohol |
1.7 |
|
|
M4 aryl sulfate |
6.2 |
|
M2 |
para-Hydroxychlorpropham |
14 |
|
|
M2 O-sulfate |
39 |
|
|
M2 O-glucuronide |
1.7 |
|
M5 |
3-Chloroaniline |
0.6 |
|
|
3-Chloro-4-hydroxyaniline sulfate (M6 O-sulfate) |
2.4 |
|
|
3-Chloro-4-hydroxyaniline N-glucuronide O-sulfate |
1.1 |
|
M9 |
3-Chloro-4-hydroxyacetanilide |
1.0 |
|
|
M9 O-sulfate |
16 |
|
|
M9 O-glucuronide |
0.7 |
|
|
Unknown (8 metabolites) |
1.0 |
|
|
All sulfate conjugates |
64 |
|
|
Parent compound plus metabolites |
90 |
From Robinson & Liu (1991)
Bobik et al. (1972) reported that M2 was the main metabolite excreted in the urine of adult male rats given [14C-isopropyl]chlorpropham (purity, > 98.5%) orally or intraperitoneally, accounting for two-thirds of the radiolabel in urine. They also reported that 4’-hydroxychlorpropham accounted for 28% of the radiolabel excreted in 6-h bile after a single intravenous dose of 1.0 mg of [14C-ring]- or [14C-isopropyl]chlorpropham. Neither study was performed according to GLP.
Fang et al. (1974) determined metabolites in urine from adult female Wistar rats given [14C-ring]- or [14C-isopropyl]chlorpropham orally or intraperitoneally (see above). Hydroxylation of the ring was found to be the main reaction in metabolic conversion, and the resulting M2 was conjugated with sulfate. Hydroxylation of the isopropyl moiety yielded both mono- and dihydroxy derivatives of the alkyl chain, which probably underwent further oxidation. Hydrolytic cleavage yielded the corresponding amine, carbon dioxide, and 2-propanol. The relative amounts of the metabolites formed were not affected by dose. The study was not performed according to GLP.
Livestock
In a study carried out according to GLP and FIFRA Guideline 40 CFR 158.240, reference 171-4, two lactating goats weighing 39–48 kg were given a daily oral dose of 75 mg of [14C-ring]chlorpropham plus lactose by capsule for 7 days, providing 1.6–1.9 mg/kg bw per day. A control goat received lactose only by capsule. Urine and faeces were collected daily and milk twice daily during treatment and before necropsy, and blood samples were taken on days 1, 3, and 5 of treatnment and before necropsy. The animals were killed 24 h after the last dose, and liver, kidney, heart, loin muscle, leg muscle, and omental and peripheral fat were collected for analysis. The mean amounts of radiolabel excreted in urine, faeces, and milk over 7 days, up to 24 h after the last dose, represented 99, 6.0, and 1.2% of the cumulative dose, respectively; about 1% was transferred to milk and liver and one or two orders of magnituse less to fat and muscle. The amount of radiolabel in milk, expressed as milligrams of chlorpropham equivalents per kilogram, was fairly constant throughout treatment, with maximum concentrations of 0.32–0.44 mg/kg of milk in the two goats. The concentration of radiolabel in tissues was highest in liver (0.18–0.32 mg/kg), followed by kidney (0.051 mg/kg); that in heart, muscle, and fat was below the limit of detection (0.030 mg/kg). The mean concentration in blood was below the limit of detection (0.030 mg/kg) on day 1, < 0.030–0.046 mg/kg on day 3, 0.059 mg/kg on day 5, and 0.092 mg/kg on day 7. In milk, the metabolites were M2 O-sulfate (81% of total residue), M4 aryl sulfate (5.0%), M9 O-sulfate (4.5%), M2 O-glucuronide (3.7%), and M2 (0.89%). In liver, the metabolites were M2 (3.2%), 3-chloroacetanilide (M7; 2.0%), and M4 (1.0%). In kidney, the metabolites were M2 O-sulfate (16%), M4 O-sulfate (4.1%), M9 (3.8%), M2 O-glucuronide (3.5%), and an unknown metabolite, which was also detected in rat urine (3.7%). In fat, mainly chlorpropham (88%) was detected. Metabolites in excreta and blood were not reported.
These results indicate that chlorpropham is readily metabolized, initially by hydrolysis and hydroxylation (oxidation), and is then converted to conjugated metabolites. A small amount of both the parent compound and 3-chloroaniline was tightly and/or irreversibly bound to endogenous macromolecules (4% and 8% of radiolabel in liver and kidney, repectively). The metabolic scheme is shown in Figure 2 (Wu, 1991a).
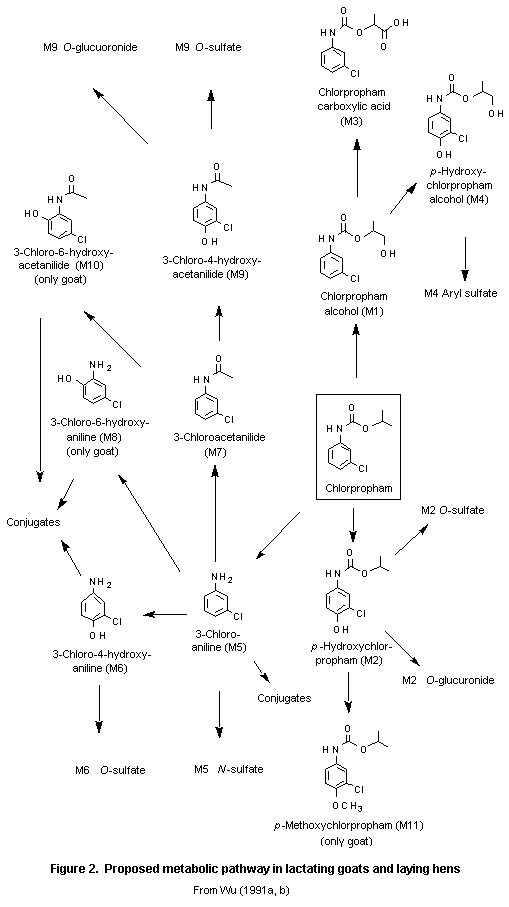
In a study carried out according to GLP and FIFRA Guideline 40 CFR 158.240, reference 171-4, 10 white Leghorn laying hens weighing 1.4–1.8 kg were given a daily oral dose of 6 mg of [14C-ring]chlorpropham plus lactose by capsule for 7 days, representing 3.3–4.2 mg/kg bw. Five control hens received lactose only by capsule. During treatment, excreta were collected once daily and eggs twice daily. All hens were killed 8 h after the last dose, and blood, breast and thigh muscle, fat, heart, gizzard, kidney, liver, skin, eggs (white and yolk), and blood were collected for analysis. During treatment and 8 h after the last dose, a total of 83% of the cumulative dose was recovered from excreta and 0.03% from total egg production, with 0.01% in egg white and 0.02% in yolk. No radiolabel was detected in egg yolk during the first 3 days, but the concentration increased steadily from 0.10 mg/kg on day 4 to 0.23 mg/kg on day 7, when a steady state had not yet been reached. In egg white, the concentration ranged from 0.007 to 0.074 mg/kg, and a plateau was reached on day 6. The concentrations in liver and kidney, were 0.47 and 0.46 mg/kg, and those in skin and fat were 0.15 and 0.19 mg/kg, respectively. Low concentrations were found in gizzard, heart, and blood (0.089, 0.039, and 0.094 mg/kg, respectively), while those in thigh and breast muscle were 0.015 and 0.006 mg/kg, respectively.
The main metabolites (expressed as per cent of total residue) were M6 O-sulfate (22%) and M2 O-sulfate (7.7%) in egg white; M6 O-sulfate (32%) and chlorpropham (20%) in egg yolk; M2 O-sulfate (4.3%), M2 (3.7%), chlorpropham (0.51%), and enzyme- or acid-releasable 3-chloro-4-hydroxyaniline-related metabolites (64%) in liver; M2 O-glucuronide (9.2%), M9 O-glucuronide (8.1%), chlorpropham (7.4%), M4 (5.0%), M9 O-sulfate (3.7%), M6 (3.4%), M6 O-sulfate (3.4%), M3 (3.0%), M9 (0.40%), and enzyme- or acid-releasable 3-chloro-4-hydroxyaniline-related metabolites (25%) in kidney; chlorpropham (92%) in fat; and chlorpropham (68%) and M2 O-sulfate (19%) in skin.
These results indicate that chlorpropham is readily metabolized, initially by hydrolysis and hydroxylation (oxidation), and then converted to conjugated metabolites (Wu, 1991b).
(c) Effects on enzymes and other biochemical parameters
Bobik et al. (1972) reported that studies of the hydrolysis of chlorpropham by supernatants (10 000 x g) of liver and kidney homogenates from untreated and phenobarbital-pretreated rats showed that the liver was a possible site of this reaction. Phenobarbital pretreatment had no effect.
Additional data on metabolism in rat hepatocytes are cited from a review, as the original publication was not submitted. After incubation of rat hepatocytes with chlorpropham, 33% of the dose remained unchanged. 4'-Hydroxychlorpropham sulfate conjugate and 4’-hydroxychlorpro-pham glucuronide conjugate accounted for 35 and 20% of the dose, respectively; 3% of the dose was present as free 4’-hydroxychlorpropham. About 10% of the dose was split hydrolytically, yielding 2% 3-chloroaniline, which was further metabolized to 3-chloroacetanilide, representing 5% of the dose (Ministry of Agriculture, Fisheries and Food, 1993).
These studies are summarized in Table 4.
Table 4. Summary of results of studies of the acute toxicity of chlorpropham
|
Species |
Strain |
Sex |
Route |
LD50 or LC50 |
Reference |
|
Rata |
Sprague-Dawley |
M/F |
Oral |
4200 |
Krohmer (1990a) |
|
Ratb |
Wistar |
M/F |
Oral |
> 2000 |
Pels Rijcken (1996a) |
|
Ratc |
Wistar |
M/F |
Dermal (24 h) |
> 2000 |
Pels Rijcken (1996b) |
|
Ratd |
Wistar |
M/F |
Inhalation |
> 0.47 |
Debets (1985) |
|
Rabbite |
New Zealand white |
M/F |
Dermal (24 h) |
> 2000 |
Krohmer (1990b) |
|
Rabbitf |
New Zealand white |
M/F |
Dermal (4 h) |
Not irritating |
Krohmer (1990c) |
|
Rabbitg |
New Zealand white |
M/F |
Dermal (4 h) |
Not irritating |
Pels Rijcken (1996c) |
|
Rabbith |
New Zealand white |
M/F |
Eye |
Not irritating |
Krohmer (1990d) |
|
Rabbiti |
New Zealand white |
M |
Eye |
Not irritating |
Pels Rijcken (1996d) |
|
Guinea-pigj |
Hartley albino |
F |
Buehler test |
Not sensitizing |
Krohmer (1990e) |
|
Guinea-pigk |
Hartley albino |
Not reported |
Open epicutaneous |
Not sensitizing |
Dickhaus & Heisler (1989) |
|
Guinea-pigl |
Hartley albino |
F |
Split adjuvant test |
Sensitizing |
Weterings (1985) |
|
Guinea-pigm |
Hartley albino |
F |
Magnusson Kligman test |
Not sensitizing |
Ministry of Agriculture, Fisheries, and Food (1993) |
a
Test material: chlorpropham as liquid; purity, 97.1%; by gavage in corn oilb
Test material: technical-grade chlorpropham; minimum purity, 98%; ground to powder; by gavage in corn oilc
Test material: technical-grade chlorpropham; minimum purity, 98%; ground to powder; dermal application under a semi-occlusive dressing in corn oild
Test material: aerosol of chlorpropham; purity, 99.3% (maximum mean aerodynamic diameter, 1.6 µm) in luthrol; nominal concentration, 4.8 mg/L, head–nose-onlye
Test material: chlorpropham, purity unknown, liquid; dermal application under occlusion in corn oilf
Test material: chlorpropham, purity unknown, liquid; dermal application of 0.5 ml on intact skin under occlusion; observations at 0.75, 24, 48, and 72 hg
Test material: technical-grade chlorpropham, minimum purity, 98%; ground to powder; dermal application of 0.5 g moistened with water on intact skin under a semi-occlusive dressing; observations at 1, 24, 48, and 72 hh
Test material: chlorpropham, purity unknown, ground to powder; 100 mg into conjunctival sac; observations at 1, 24, 48, and 72 hi
Test material: technical-grade chlorpropham, minimum purity, 98%, ground to powder; 57 mg associated with approximately 0.1 ml into conjunctival sac; observations at 1, 24, 48, and 72 hj
Test material: 400 mg finely powdered chlorpropham; purity, 97.1% for induction and challenge; positive control, 1-chloro-2,4-dinitrobenzenek
Test material: undiluted technical-grade chlorpropham, purity not given, applied as a waxy mass; induction during 5 days/week for 3 weeks (duration per day not reported); 24-h challenge 14 days after last challenge application; no positive control group; 15 instead of 20 animals usedl
Test material: 0.2 ml of 25% chlorpropham (purity, 99%) in petrolatum for induction; 0.1 ml of 25% chlorpropham (purity, 99%) in petrolatum for challenge; no positive controlm
Test material: 0.1 ml of 5% (w/v) chlorpropham (purity, 99.7%) in propylene glycol on day 1 for induction, followed by injection of 0.1 ml Freund's complete adjuvant with 0.1 ml propylene glycol and injection of 0.1 ml of 10% (w/v) chlorpropham in propylene glycol. On day 6, the skin of the shoulder was treated with 10% sodium dodecyl sulfate in petrolatum. On day 7, the treated group received the last induction of 0.5 ml of 25% (w/v) chlorpropham in propylene glycol, applied under an occlusive patch on the shoulder for 48 h. The first challenge was given on day 21. Each animal was given a dermal application of 0.05 ml of 0, 2.5, 10, or 25% (w/v) chlorpropham in propylene glycol for 24 h. Observations were made at 24 and 48 h thereafter. As the results for some test sites were unclear, the challenge was repeated on day 28 on the opposite flank.After oral administration to rats, the mortality rate was 10%, 60%, 60%, and 90% at 3000, 4000, 5000, and 6000 mg/kg bw, respectively, and death occurred 6–72 h after dosing. The signs of toxicity were hypoactivity, lethargy, ataxia, and salivation (Krohmer, 1990a). In a limit test in rats, no deaths occurred. Lethargy and uncoordinated movements were seen in all animals and hunched posture and piloerection in one female on day 1, but the signs had disappeared by day 2. No effect on body-weight gain was seen, and no macroscopic changes were observed (Pels Rijcken, 1996a).
No deaths or signs of systemic or local respiratory toxicity were observed after exposure of rats by inhalation. The mean body-weight gain was unchanged during the first week of observation but increased during the second week. No macroscopic changes were observed (Debets, 1985).
In a study of dermal application, no deaths occurred. Red staining of the neck was seen in one female on day 9 (Pels Rijcken, 1996b). Very slight, transient erythema was observed in three of five males and three of five females 30 min after the end of a 24-h dermal application of chlorpropham to rats (Krohmer, 1990b). In a study of dermal irritation (Krohmer, 1990c), one female rabbit showed very slight erythema (score 1 on the Draize scale) 24 h after removal of the patch, but the reaction had disappeared after 48 h. No oedema was seen. In another study (Pels Rijcken, 1996c), very slight skin erythema was seen in all three rabbits after 1 h, accompanied by very slight oedema in one animal. After 24, 48, and 72 h, very slight erythema was seen in three, two, and none of the animals, respectively; no oedema was observed.
In a study of ocular irritation (Krohmer, 1990d), effects were noted (score 1) on corneal opacity and area at 24 and 48 h in one rabbit, and conjunctival redness and discharge were seen in the same animal after 24 h. No effects were seen at 72 h. In another study (Pels Rijcken, 1996d), grade 1 irritation of the conjunctivae, consisting of redness, chemosis, and/or discharge, was seen 1 h after instillation. The effects had disappeared within 24 h in two animals and within 72 h in one animal.
Chloropham had no effect in a Buehler test (Krohmer, 1990e), an open epicutaneous test (Dickhaus & Heisler, 1989), or a Magnusson Kligman test for skin sensitization (Ministry of Agriculture, Fisheries and Food, 1993). In a split adjuvant test, challenge on day 21 elicited positive reactions in three of 20 guinea-pigs, and a weak reaction, extending beyond the exposed skin area, was seen in another four animals. Challenge on day 28 resulted in positive reactions in six animals (Weterings, 1985).
(b) Short-term studies of toxicity
28-day study in rats treated orally
In a 28-day study, performed according to GLP and OECD Guideline 407, groups of five male and five female Wistar rats (aged about 6 weeks) received diets containing technical-grade chlorpropham (purity, 98.6%) at a concentration of 0, 600, 3000, or 15 000 mg/kg, equal to 0, 63, 350, and 2200 mg/kg bw per day for males and 0, 67, 360, and 2400 mg/kg bw per day for females. The values for intake of the test substance in mg/kg bw per day should be interpreted with care, however, as food scatter resulted in overestimates. After correction for food scatter, the intake during week 2 was 0, ± 60, ± 300, and ± 1400 mg/kg bw per day. The weight of the thyroid was not determined.
Animals at the highest dose showed decreased food consumption and significantly decreased growth. Haematological determinations showed significant decreases in red blood cell count, haemoglobin concentration, and erythrocyte volume fraction at all doses. The anaemia resulted in increased haemosiderosis in tissues at the two higher doses. New (immature) red blood cells were formed, as indicated by increased numbers of reticulocytes at all doses. Significantly increased cholesterol, serum bilirubin, and albumin concentrations were observed at the highest dose. The weights of the liver (at 15 000 mg/kg of diet) and spleen (at 3000 and 15 000 mg/kg of diet) were significantly increased. The leukocytes were small at all doses and were extremely small at the highest dose. Macroscopic examination showed enlarged and/or black, discoloured spleens in all animals at the two higher doses. Two males and three females at the highest dose had red–brown or black–brown discoloured kidneys. Microscopic examination of the spleen revealed increased haematopoiesis and haemosiderosis, slight to moderate congestion, and follicular atrophy in all animals at the two higher doses. The livers of all animals at the highest dose showed multiple foci of erythropoiesis. In the kidneys of all animals at this dose, intracytoplasmic hyaline resorption bodies were seen in the tubules, the effect being more pronounced in males than in females. A NOAEL could not be identified in this study. The lowest dose of 600 mg/kg of diet (equivalent to 60 mg/kg bw per day) was a LOAEL. The author claimed that the NOAEL was 600 mg/kg of diet, as the observed anaemia was only minimal at this dose and no concurrent changes were observed in spleen or liver (see Table 5) (Schoenmakers et al., 1998a).
Table 5. Results of 28-day study in rats treated with chlorpropham in the diet
|
Effect |
Dose (mg/kg bw per day) |
|||
|
|
0 |
63 |
67 |
|
|
Male |
Female |
Male |
Female |
|
|
Death |
|
|
|
|
|
Clinical signs |
|
|
|
|
|
Alopecia |
|
|
Increase |
Increase |
|
Body weight |
|
|
|
|
|
Body-weight gain |
|
|
|
|
|
Food consumption |
|
|
|
|
|
Food scatter |
|
|
|
|
|
Haematology |
|
|
|
|
|
Erythrocyte count |
|
|
|
Decrease* |
|
Haemoglobin |
|
|
|
Decrease* |
|
Erythrocyte volume fraction |
|
|
|
Decrease* |
|
Mean corpuscular volume |
|
|
|
|
|
Mean corpuscular haemoglobin |
|
|
|
|
|
Mean corpuscular haemoglobin concentration |
|
|
|
|
|
Leukocyte count |
d |
d |
d |
d |
|
Red cell distribution width (%) |
|
|
|
|
|
Reticulocyte count |
|
|
Increase* |
Increase* |
|
Clinical chemistry |
|
|
|
|
|
Bilirubin concentration |
|
|
|
|
|
Cholesterol concentration |
|
|
|
|
|
Proteins concentration |
|
|
|
|
|
Albumin concentration |
|
|
|
|
|
Sodium concentration |
|
|
Decrease* |
|
|
Calcium concentration |
|
|
Decrease* |
Decrease* |
|
Phosphorus concentration |
|
|
|
|
|
Organ weights |
|
|
|
|
|
Liver |
|
|
|
|
|
|
|
|
|
|
|
Spleen |
|
|
Increaseg,h |
Increaseg,h |
|
|
|
|
|
|
|
Macroscopy |
|
|
|
|
|
Kidneys (red–brown or black–brown discoloured) |
|
|
|
|
|
Spleen (enlarged and/or black discoloured) |
|
|
|
|
|
Microscopy |
|
|
|
|
|
Liver, erythropoiesis, multifocal, grade 1 |
|
|
|
|
|
Kidneys, intracytoplasmic hyaline resorption bodies in tubules |
|
|
|
2/5 |
|
Spleen |
|
|
|
|
|
Haematopoiesis, grade 1 |
5/5 |
5/5 |
5/5 |
4/5 |
|
Haematopoiesis, grade 2 |
|
|
|
1/5 |
|
Haemosiderosis, grade 1 |
5/5 |
5/5 |
5/5 |
5/5 |
|
Haemosiderosis, grade 2 |
|
|
|
|
|
Congestion, grade 1 |
|
|
|
|
|
Congestion, grade 2 |
|
|
|
|
|
Follicular atrophy, grade 1 |
|
|
|
|
|
Follicular atrophy, grade 2 |
|
|
|
|
Table 5 (continuted)
|
Effect |
Dose (mg/kg bw per day) |
Dose-related effect |
|||
|
|
350 |
360 |
2200 |
2400 |
|
|
Male |
Female |
Male |
Female |
|
|
|
Death |
|
|
|
1/5a |
|
|
Clinical signs |
|
|
|
|
|
|
Alopecia |
|
|
Increaseb |
Increaseb |
|
|
Body weight |
|
|
Decrease* |
Decrease* |
|
|
Body-weight gain |
|
|
Decrease* |
Decrease* |
|
|
Food consumption |
|
|
Decreasec |
Decreasec |
|
|
Food scatter |
Increase |
Increase |
Increase |
Increase |
Males and females |
|
Haematology |
|
|
|
|
|
|
Erythrocyte count |
Decrease* |
Decrease* |
Decrease* |
Decrease* |
Males and females |
|
Haemoglobin |
Decrease* |
Decrease* |
Decrease* |
Decrease* |
Males and females |
|
Erythrocyte volume fraction |
Decrease* |
Decrease* |
Decrease* |
Decrease* |
Males and females |
|
Mean corpuscular volume |
Increase* |
Increase |
Increase* |
Increase* |
Males |
|
Mean corpuscular haemoglobin |
|
|
Increase |
Increase* |
|
|
Mean corpuscular haemoglobin concentration |
Decrease* |
Decrease* |
|
|
|
|
Leukocyte count |
d |
d |
d |
d |
|
|
Red cell distribution width (%) |
|
|
Increase* |
|
|
|
Reticulocyte count |
Increase* |
Increasee |
Increasee |
Increasef |
Males and females |
|
Clinical chemistry |
|
|
|
|
|
|
Bilirubin concentration |
|
|
Increase* |
Increase* |
|
|
Cholesterol concentration |
|
|
Increase* |
Increase* |
|
|
Proteins concentration |
|
|
|
Increase* |
|
|
Albumin concentration |
|
|
|
Increase* |
|
|
Sodium concentration |
|
|
|
|
|
|
Calcium concentration |
Decrease* |
|
Decrease* |
|
|
|
Phosphorus concentration |
|
Decrease* |
Decrease* |
Decrease* |
|
|
Organ weights |
|
|
|
|
|
|
Liver |
|
|
Increase*,g,h |
Increaseg |
|
|
|
|
|
|
Increase*,h |
|
|
Spleen |
Increaseg |
Increase*g,h |
Increase*g,h |
Increase*g,h |
Males and females |
|
|
|
|
Increase*h |
|
|
|
Macroscopy |
|
|
|
|
|
|
Kidneys (red–brown or black–brown discoloured) |
|
|
2/5 |
3/5 |
|
|
Spleen (enlarged and/or black discoloured) |
5/5 |
5/5 |
5/5 |
5/5 |
|
|
Microscopy |
|
|
|
|
|
|
Liver, erythropoiesis, multifocal, grade 1 |
2/5 |
|
5/5 |
5/5 |
|
|
Kidneys, intracytoplasmic hyaline resorption bodies in tubules |
|
5/5 |
5/5 |
|
|
|
Spleen |
|
|
|
|
Males and females |
|
Haematopoiesis, grade 1 |
|
|
|
|
|
|
Haematopoiesis, grade 2 |
5/5 |
5/5 |
5/5 |
5i/5 |
|
|
Haemosiderosis, grade 1 |
2/5 |
|
|
|
|
|
Haemosiderosis, grade 2 |
3/5 |
5/5 |
5/5 |
5/5 |
|
|
Congestion, grade 1 |
5/5 |
5/5 |
|
5/5 |
|
|
Congestion, grade 2 |
|
|
5/5 |
|
|
|
Follicular atrophy, grade 1 |
5/5 |
5/5 |
2/5 |
1/5 |
|
|
Follicular atrophy, grade 2 |
|
|
3/5 |
4/5 |
|
From Schoenmakers et al. (1998a)
* Statistically significant
a
Accidentally after blood samplingb
Considered to be within normal biological variationc
Corrected for food scatterd
Leukocytes were small in all treated animals and extremely small in those given 15 000 mg/kg of diet, so no automated counting could be performed.e
One sample partly clottedf
Two samples partly clottedg
Absoluteh
Relativei
1/5 grade 314–28-day studies in dogs treated orally
In a 14-day range-finding study in dogs performed according to OECD Guideline 409, groups of two male and two female beagles aged about 7 months received a gelatin capsule containing technical-grade chlorpropham (purity, 98.6%; ground to powder) at a dose of 0, 25, 125, or 625 mg/kg bw daily 1 h after feeding in the morning, for 14 days. The dogs were offered 0.3 kg of standard maintenance pelleted food once daily and water ad libitum. No deaths occurred. One male and one female at 625 mg/kg bw per day vomited after dosing and showed retching, nausea, excessive salivation, and shaking of the head. At this dose, orange staining of the faeces was seen in all animals from day 9 onwards. No effect on body weight or body-weight gain was seen, and food consumption was normal in all groups. Evaluation of 12 haematological parameters before treatment and after 14 days showed decreased red blood cell count, haemoglobin concentration, erythrocyte volume fraction, and mean corpuscular volume in one male (the only one of the two male dogs analysed) and both female dogs at the highest dose. At this dose, the red cell distribution width was increased in one female and the platelet count in both females. A high leukocyte count in one female at this dose was considered to be incidental. Evaluation of 22 clinical chemical parameters before treatment and after 14 days showed increased bilirubin, cholesterol, phospholipid, and triglyceride concentrations in all animals at the highest dose, whereas increases in cholesterol, phospholipid, and triglyceride concentrations at 125 and 25 mg/kg bw per day were marginal and were considered to be of no biological relevance. At 625 mg/kg bw per day, one male and both females had decreased glucose concentrations. High lactate dehydrogenase activity seen in one male at this dose may have been incidental. The absolute and relative weights of the liver, spleen, and thyroid were increased in males and females at the highest dose, whereas the increases in thyroid weights at 125 and 25 mg/kg bw per day were slight and appeared to be of no biological relevance. Macroscopic examination showed enlarged, black discoloured spleens in one male and both females at the highest dose. Yellowish contents of the small intestines was seen in both females at 625 mg/kg bw per day and one female at 125 mg/kg bw per day. Microscopy of the thyroid gland showed follicular-cell hyperplasia in males and females at the highest dose. The spleens of males and females at this dose showed moderate congestion. The NOAEL was 125 mg/kg bw per day on the basis of changes in haematological parameters, organ weights, and histopathological appearance at the next dose (Schoenmakers & Nesselrooy, 1998). The Meeting noted that reticulocytes in blood were not counted and that OECD Guideline 409 requires groups of four male and four female animals. As only two animals of each sex were used, the effects observed could not be analysed statistically, and only the biological significance of the effects could be evaluated.
In a 28-day range-finding study performed according to GLP and FIFRA Guideline 40 CFR 158.340, reference 83-1, groups of one male and one female beagle dogs (aged about 7 months) received diets containing chlorpropham (purity, 97.1%) at concentrations providing doses of 0, 5, 50, and 500 mg/kg bw per day for 28 days. The test substance was melted at 45–47 °C and used as a liquid, or was allowed to recrystallize, ground to a fine powder, and used as a solid. It was dissolved in corn oil and mixed into the diet. The control diet contained the same amount of corn oil. Fresh diets were prepared weekly and were analysed for chlorpropham. Physical examinations, including ophthalmoscopy, before treatment and before termination showed no abnormalities. No treatment-related deaths or adverse clinical signs of systemic toxicity were seen. At the highest dose, food consumption was negligible during week 1, probably because of unpalatability, was normal during week 2, and decreased progressively during weeks 3 and 4. As a consequence, the intake of the compound at the highest dose was reduced considerably. Marked body-weight loss was seen among animals at the highest dose during week 1 and also after 4 weeks of treatment. Examination of 13 haematological parameters and 19 clinical chemical parameters in all dogs before treatment and during week 4 showed decreased haemoglobin concentration and erythrocyte volume fraction, decreased numbers of platelets, and increased mean corpuscular haemoglobin and haemoglobin concentration in animals at the highest dose and a dose-related increase in serum cholesterol concentration at all doses. Analysis of 13 parameters in urine from animals before treatment and before necropsy revealed no changes. Determination of absolute organ weights and organ:body weight ratios for brain, spleen, liver, kidney, testis with epididymides, and ovaries showed decreased absolute and relative weights of the spleen in animals at 50 and 500 mg/kg bw per day. Macroscopic examination showed no treatment-related changes. The liver, kidneys, spleen, and thyroids and all macroscopically abnormal tissues were examined histologically. The spleen showed slightly increased atrophy in animals at 500 mg/kg bw per day, and the thyroid glands showed moderate and marked activity in animals at 50 and 500 mg/kg bw per day, respectively, and slight activity at 5 mg/kg bw per day and in the control group. The NOAEL was 5 mg/kg bw, on the basis of decreased spleen weight and increased activity in the thyroid gland at 50 mg/kg bw per day (Wedig, 1990a). The Meeting noted that the thyroids were not weighed and the adrenal glands of the control group and animals at the highest dose were not weighed and the testes, adrenals, and heart were not examined histologically.
90-day study in mice treated orally
In a study in mice performed according to GLP and FIFRA Guideline 40 CFR 158.135, reference 82-1 (essentially the same as OECD Guideline No. 408, except for a lack of clinical chemical investigations), five groups of 15 male and 15 female CD-1 mice aged 6 weeks received diets containing chlorpropham (purity, 96.2% during weeks 1–3 and 97.1% during weeks 4–13) at concentrations providing a dose of 0, 100, 210, 420, or 840 mg/kg bw per day for 90 days. The test substance was used as a solid, dissolved in corn oil, and mixed into the diet. The control diet contained the same amount of corn oil. Fresh diets were prepared weekly and were analysed for chlorpropham in weeks 1, 2, 3, 4, 8, and 12.
One female at 100 and one at 840 mg/kg bw per day died from causes unrelated to treatment. All males at the highest dose had bluish extremities and darkening of the eyes; at the two higher doses, an increased number of animals with darkened blood was seen. Haematological examination showed significantly increased mean corpuscular haemoglobin and haemoglobin concentration and a significantly increased number of reticulocytes. Females at 420 mg/kg bw per day also had an increased number of reticulocytes, but the increase was not significant. Microscopic examination showed increased severity of haematopoiesis, quantitatively increased haemosiderosis in the spleen, and increased severity of bone-marrow cellularity at the highest dose. A quantitiative increase in haematopoiesis was also seen in the liver at this dose. The NOAEL was 420 mg/kg bw per day on the basis of the number of animals with dark blood and the increased number of reticulocytes in females at 420 mg/kg bw per day. The results are shown in Table 6. The darker blood and bluish extremities seen at the highest dose suggested methaemoglobinaemia, which can be caused by metabolites of chlorpropham such as chloroaniline and chloroacetanilide; however, neither methaemoglobin nor Heinz bodies were investigated in blood (Krohmer, 1990f).
Table 6. Results of 90-day study in mice treated with chlorpropham in the diet
|
Effect |
Dose (mg/kg bw per day) |
|||
|
0 |
100 |
|||
|
Male |
Female |
Male |
Female |
|
|
Death |
No treatment-related effects |
|
|
|
|
Physical examination |
|
|
|
|
|
Ophthalmoscopy |
|
|
|
|
|
Body-weight gain |
No treatment-related effects |
|
|
|
|
Food consumption |
No treatment-related effects |
|
|
|
|
Haematology |
|
|
|
|
|
Dark blooda |
0/15 |
0/15 |
0/15 |
0/14 |
|
Mean corpuscular volume |
|
|
|
|
|
Mean corpuscular haemoglobin concentration |
|
|
|
|
|
Reticulocyte count |
|
|
|
|
|
Organ weights |
|
|
|
|
|
Liver |
|
|
Increaseb |
|
|
|
|
|
|
|
|
Spleen |
|
|
Increased |
|
|
|
|
|
|
|
|
Macroscopy |
No treatment-related effects |
|
|
|
|
Microscopy |
|
|
|
|
|
Liver |
|
|
|
|
|
Focal inflammation and infiltration |
|
|
|
|
|
Minimal |
2/15 |
5/15 |
4/15 |
5/15 |
|
Minimal to slight |
|
|
|
|
|
Minimal haematopoiesis |
2/15 |
0/15 |
1/15 |
1/15 |
|
Spleen |
|
|
|
|
|
Haematopoiesis |
|
|
|
|
|
Minimal |
15/15 |
15/15 |
15/15 |
15/15 |
|
Slight |
|
|
|
|
|
Minimal haemosiderosis |
0/15 |
1/15 |
0/15 |
4/15 |
|
Bone-marrow cellularity |
|
|
|
|
|
Moderate |
15/15 |
15/15 |
15/15 |
15/15 |
|
Marked |
|
|
|
|
Table 6 (continued)
|
Effect |
Dose (mg/kg bw per day) |
|||||
|
210 |
420 |
840 |
||||
|
Male |
Female |
Male |
Female |
Male |
Female |
|
|
Death |
|
|
|
|
|
|
|
Physical examination |
|
|
|
|
All had bluish extremities from week 6–7 on |
|
|
Ophthalmoscopy |
|
|
|
|
All had dark eyes from week 6–7 on |
|
|
Body-weight gain |
|
|
|
|
|
|
|
Food consumption |
|
|
|
|
|
|
|
Haematology |
|
|
|
|
|
|
|
Dark blooda |
0/14 |
0/15 |
10/15 |
5/13 |
15/15 |
12/13 |
|
Mean corpuscular volume |
|
|
|
|
Increase* |
Increase* |
|
Mean corpuscular haemoglobin concentration |
|
|
|
Increase* |
Increase* |
|
|
Reticulocyte count |
|
|
|
Increase |
Increase* |
Increase |
|
Organ weights |
|
|
|
|
|
|
|
Liver |
Increaseb |
|
Increase*b |
|
Increaseb |
|
|
|
|
|
|
|
Increase*c |
|
|
Spleen |
Increase*b,d |
|
Increaseb,d |
|
Increase*b,c,d |
|
|
|
|
|
|
|
Increased |
|
|
Macroscopy |
|
|
|
|
|
|
|
Microscopy |
|
|
|
|
|
|
|
Liver |
|
|
|
|
|
|
|
Focal inflammation and infiltration |
|
|
|
|
|
|
|
Minimal |
4/15 |
6/15 |
6/15 |
|
3/15 |
3/15 |
|
Minimal to slight |
|
|
|
4/15 |
|
|
|
Minimal haematopoiesis |
1/15 |
1/15 |
2/15 |
2/15 |
4/15 |
9/15 |
|
Spleen |
|
|
|
|
|
|
|
Haematopoiesis |
|
|
|
|
|
|
|
Minimal |
15/15 |
15/15 |
15/15 |
15/15 |
|
|
|
Slight |
|
|
|
|
15/15 |
15/15 |
|
Minimal haemosiderosis |
2/15 |
2/15 |
2/15 |
1/15 |
6/15 |
9/15 |
|
Bone-marrow cellularity |
|
|
|
|
|
|
|
Moderate |
15/15 |
14/14 |
15/15 |
14/14 |
|
|
|
Marked |
|
|
|
|
15/15 |
15/15 |
From Krohmer (1990f)
* Statistically significant
a Dose-related in males and females
b Relative to brain weight
c Relative to body weight
d Absolute weight
In a study in mice performed according to GLP and to a protocol approved by the sponsor entitled ‘Protocol for a preliminary carcinogenicity study with chlorpropham techn. in mice’ (TNO protocol no. 470842/1926,1927), five groups of 10 male and 10 female CD-1 mice (mean body weight, 28 g for males and 23 g for females) received diets containing technical-grade chlorpropham (purity, 98.6%) at a concentration of 0, 0.1, 0.3, or 1.0% daily for 13 weeks, equal to mean daily intakes of 0, 190, 560, and 2100 mg/kg bw per day for males and 0, 290, 930, and 2800 mg/kg bw per day for females. The test substance was melted at 40–45 °C just before being mixed into the diet. After mixing, the diet was pelleted with skimmed milk powder and tap-water. Analyses for the content, homogeneity, and stability of the substance in the diet showed 10% lower concentrations than intended at all doses owing to the dilution with 10% water before pelleting. The assumption that most of the water would evaporate during or after pelleting turned out to be incorrect. In addition, the figures given for mean intakes of the substance were overestimates, especially for females, because of spillage. All animals were observed daily for clinical signs, general health, and deaths. Body weights and food consumption were determined weekly. After 13 weeks, haematological parameters, organ weights, and organ:body weight ratios were determined for all animals (see Table 7), and all animals were examined macroscopically. No histopathological examination was performed, but samples of adrenals, brainstem, cerebrum, cerebellum, heart, kidneys, liver, lungs (with trachea and bronchi), spleen, testis, thymus, and all gross lesions were preserved for possible future histopathological examination.
Table 7. Results of second 90-day study in mice treated with chlorpropham in the diet
|
Effect |
Dose (mg/kg bw per day) |
|||
|
0 |
190 |
290 |
||
|
Male |
Female |
Male |
Female |
|
|
Death |
No treatment-related effects |
|
|
|
|
Clinical signs |
|
|
|
|
|
Body-weight gain |
|
|
|
|
|
Food consumption |
No treatment-related effects |
|
|
|
|
Haematology |
|
|
|
|
|
Packed cell volume |
|
|
|
|
|
Erythrocyte count |
|
|
|
|
|
Methaemoglobin |
|
|
Increase* |
Increase |
|
Heinz bodies |
|
|
Increase* |
Increase* |
|
Reticulocyte count |
|
|
|
|
|
Organ weights |
|
|
|
|
|
Heart |
|
|
|
|
|
Kidney |
|
|
|
|
|
Liver |
|
|
|
|
|
Spleen |
|
|
|
|
|
Macroscopy |
|
|
|
|
|
Enlarged spleen |
|
|
|
|
Table 7 (continued)
|
Effect |
Dose (mg/kg bw per day) |
Dose-related effect |
|||
|
560 |
930 |
2100 |
2800 |
||
|
Male |
Female |
Male |
Female |
||
|
Death |
|
|
|
|
|
|
Clinical signs |
|
|
Pale skin |
|
|
|
Body-weight gain |
|
|
|
Decrease |
|
|
Food consumption |
|
|
|
|
|
|
Haematology |
|
|
|
|
|
|
Packed cell volume |
|
|
|
Decrease* |
|
|
Erythrocyte count |
|
|
Decrease |
Decrease* |
|
|
Methaemoglobin |
Increase* |
Increase* |
Increase* |
Increase* |
Males and females |
|
Heinz bodies |
Increase* |
Increase* |
Increase* |
Increase* |
Males and females |
|
Reticulocyte count |
|
|
Increase |
Increase* |
|
|
Organ weights |
|
|
|
|
|
|
Heart |
|
|
Increasea |
|
|
|
|
|
Increase*,b |
|
|
|
|
Kidney |
|
|
|
Increase*,b |
|
|
Liver |
|
|
Increase*,b |
Increase*,b |
|
|
Spleen |
|
|
Increase*,b |
Increase*,b |
|
|
Macroscopy |
|
|
|
|
|
|
Enlarged spleen |
|
|
1/10 |
2/10 |
|
From Jonker (1998)
* Statistically significant
a Absolute weight
b Relative to body weight
Males at the highest dose showed pale skin, and females at this dose had slightly lower body weights than control females after 13 weeks. A significant, dose-related increase in methaemoglobin concentration (by 1.6, 2.3, 4.5, and 8.4% in males and 2.2, 2.7, 3.6, and 6.4% in females at the four concentrations, respectively) and in the number of Heinz bodies (by 0.0, 7.4, 92, and 320/100 in males and 0.0, 2.6, 6.8, and 150/1000 in females at the four concentrations respectively) was seen at all doses. The weights of the spleen and liver were increased significantly at 1.0% in the diet. A NOAEL could not be established in this study. The LOAEL was 0.1%, equal to 190 mg/kg bw per day (Jonker, 1998).
90-day studies in rats treated orally
In a study in rats performed according to GLP and FIFRA Guideline 40 CFR 158.135, reference 82-1 (essentially the same as OECD Guideline No. 408), five groups of 10 male and 10 female Sprague-Dawley rats (body weight, 180–226 g for males and 138–174 g for females) received diets containing chlorpropham (purity, 96.2% in weeks 1–4 and 97.1% in weeks 5–13) to provide a dose of 0, 17, 70, 300, or 1200 mg/kg bw per day for 90 days. The substance was melted and used as a liquid or allowed to recrystallize, ground to a fine powder, and used as a solid. It was dissolved in corn oil and mixed into the diet. The control diet contained the same amount of corn oil. Diets were prepared weekly and were analysed for chlorpropham at weeks 1, 2, 3, 4, 8, and 12. In addition to the guidelines, physical examinations were performed weekly, serum thyroxine and serum cholinesterase were determined, urine was examined before termination, and red blood cell morphology was examined at termination. The stability of chlorpropham in the diet was not determined, but data on stability in the diet were provided in the 24-month study in rats (see below).
Significantly decreased body-weight gain was observed in animals at the highest dose. Effects on red blood cell morphology were seen at all doses, although the method used to measure changes is sensitive to artefacts. Biochemical analysis revealed treatment-related increases in cholesterol concentrations at the two higher doses. Decreases in cholinesterase activity seen in females at 70, 300, and 1200 mg/kg bw per day, which were significant only at the highest dose, were considered to be not toxicologically relevant as they were of small magnitude (see Table 8). Increased spleen weights, darkened, red or black spleens, and increased liver weights were observed among animals at the two higher doses. Microscopy showed increased haematopoiesis and pigmentation in the liver, increased haematopoiesis, haemosiderosis, and congestion in the spleen, and increased cellularity in the bone marrow at doses from 300 mg/kg bw per day and more. No effects were seen on serum thyroxine or thyroid histology. The changes in red blood cell morphology at 17 mg/kg bw per day were considered to be due to normal variations in the method, and a significant decrease in mean corpuscular haemoglobin concentration only in males at this dose, without changes in other parameters. was considered to be not biologically relevant. The NOAEL was 17 mg/kg bw per day (Wedig, 1990b). Although metabolites of chlorpropham such as chloroaniline and chloroacetanilide may induce methaemoglobinaemia, the presence of neither methaemoglobin nor Heinz bodies in blood was investigated.
Table 8. Results of 90-day study in Sprague-Dawley rats treated with chlorpropham in the diet
|
Effect |
Dose (mg/kg bw per day) |
|||||
|
0 |
17 |
70 |
||||
|
Male |
Female |
Male |
Female |
Male |
Female |
|
|
Death |
No treatment-related effects |
|
|
|
|
|
|
Physical examination |
No treatment-related effects |
|
|
|
|
|
|
Ophthalmoscopy |
No treatment-related effects |
|
|
|
|
|
|
Clinical signs |
No treatment-related effects |
|
|
|
|
|
|
Body-weight gain |
|
|
|
|
|
|
|
Food consumption |
No statistically significant treatment-related effects |
|
|
|
|
|
|
Haematology |
|
|
|
|
|
|
|
Haemoglobin |
|
|
|
|
|
|
|
Erythrocyte volume fraction |
|
|
|
|
|
|
|
Erythrocyte count |
|
|
|
|
|
|
|
Mean corpuscular haemoglobin |
|
|
|
|
|
|
|
Mean corpuscular volume |
|
|
|
|
|
|
|
Mean corpuscular haemoglobin concentration |
|
Decrease* |
|
Decrease* |
|
Decrease* |
|
Reticulocyte count |
|
|
|
|
Increase |
Increase |
|
Red cell morphology |
|
|
|
|
|
|
|
Crenated |
0/10 |
0/10 |
3/10 |
6/10 |
7/10 |
6/10 |
|
Target cells |
0/10 |
0/10 |
3/10 |
3/10 |
3/10 |
6/10 |
|
Macrocytic |
0/10 |
0/10 |
0/10 |
0/10 |
0/10 |
0/10 |
|
Anisocytosis |
0/10 |
0/10 |
1/10 |
0/10 |
0/10 |
0/10 |
|
Clinical chemistry |
|
|
|
|
|
|
|
Cholesterol concentration |
|
|
|
|
|
|
|
Total protein concentration |
|
|
|
|
|
|
|
Albumin concentration |
|
|
|
|
|
|
|
Albumin:globulin ratio |
|
|
|
|
|
|
|
Plasma cholinesterase activitya |
|
|
|
|
|
Decrease |
|
Urinary parameters |
No treatment-related effects |
|
|
|
|
|
|
Organ weights |
|
|
|
|
|
|
|
Liver |
|
|
|
|
|
|
|
Thyroid |
|
|
|
|
|
|
|
Spleen |
|
|
|
|
|
|
|
|
|
|
|
|
|
|
|
|
|
|
|
|
|
|
|
Macroscopy |
|
|
|
|
|
|
|
Dark-red or black spleen |
0/10 |
0/10 |
0/10 |
0/10 |
1/10 |
0/10 |
|
Microscopy |
|
|
|
|
|
|
|
Liver |
|
|
|
|
|
|
|
Minimal haematopoiesis |
|
|
|
|
1/10 |
|
|
Minimal pigment |
|
|
|
|
|
|
|
Spleen |
|
|
|
|
|
|
|
Haematopoiesis |
|
|
|
|
|
|
|
Minimal |
10/10 |
10/10 |
10/10 |
10/10 |
|
10/10 |
|
Minimal to slight |
|
|
|
|
10/10 |
|
|
Slight |
|
|
|
|
|
|
|
Haemosiderosis |
|
|
|
|
|
|
|
Minimal |
3/10 |
10/10 |
3/10 |
10/10 |
5/10 |
10/10 |
|
Minimum to slight |
|
|
|
|
|
|
|
Slight |
|
|
|
|
|
|
|
Congestion |
|
|
|
|
|
|
|
Minimum to slight |
|
|
|
|
|
|
|
Slight |
|
|
|
|
1/10 |
|
|
Bone-marrow cellularity |
|
|
|
|
|
|
|
Moderate |
10/10 |
10/10 |
10/10 |
10/10 |
10/10 |
10/10 |
|
Marked |
|
|
|
|
|
|
Table 8 (continued)
|
Effect |
Dose (mg/kg bw per day) |
Dose-related effect |
|||
|
300 |
1200 |
||||
|
Male |
Female |
Male |
Female |
||
|
Death |
|
|
|
|
|
|
Physical examination |
|
|
|
|
|
|
Ophthalmoscopy |
|
|
|
|
|
|
Clinical signs |
|
|
|
|
|
|
Body-weight gain |
|
|
Decrease* |
Decrease* |
|
|
Food consumption |
|
|
|
|
|
|
Haematology |
|
|
|
|
|
|
Haemoglobin |
Decrease* |
Decrease* |
Decrease* |
Decrease* |
Males and females |
|
Erythrocyte volume fraction |
Decrease |
Decrease* |
Decrease* |
Decrease* |
Males and females |
|
Erythrocyte count |
Decrease* |
Decrease* |
Decrease* |
Decrease* |
Males and females |
|
Mean corpuscular haemoglobin |
|
|
Increase* |
Increase* |
|
|
Mean corpuscular volume |
Increase* |
Increase* |
Increase* |
Increase* |
Males and females |
|
Mean corpuscular haemoglobin concentration |
|
Decrease* |
|
Males |
|
|
Reticulocyte count |
Increase* |
Increase* |
Increase* |
Increase* |
Males and females |
|
Red cell morphology |
|
|
|
|
|
|
Crenated |
9/10 |
10/10 |
10/10 |
9/10 |
Males and females |
|
Target cells |
9/10 |
9/10 |
10/10 |
9/10 |
Males and females |
|
Macrocytic |
0/10 |
0/10 |
1/10 |
3/10 |
|
|
Anisocytosis |
1/10 |
0/10 |
1/10 |
2/10 |
|
|
Clinical chemistry |
|
|
|
|
|
|
Cholesterol concentration |
|
Increase |
Increase* |
Increase* |
Females |
|
Total protein concentration |
|
|
Increase* |
|
|
|
Albumin concentration |
|
|
Increase* |
Increase |
|
|
Albumin:globulin ratio |
|
|
Increase* |
Increase |
|
|
Plasma cholinesterase activitya |
|
Decrease |
|
Decrease* |
|
|
Urinary parameters |
|
|
|
|
|
|
Organ weights |
|
|
|
|
|
|
Liver |
|
|
Increase*b,c,d |
Increase*b,c,d |
|
|
Thyroid |
|
|
|
Increase*d |
|
|
Spleen |
Increaseb,c |
Increase*b,c,d |
Increase*b,c,d |
Increase*b,c,d |
Males and females |
|
|
Increase*d |
|
|
|
|
|
Macroscopy |
|
|
|
|
|
|
Dark-red or black spleen |
3/10 |
6/10 |
5/10 |
10/10 |
Males and females |
|
Microscopy |
|
|
|
|
|
|
Liver |
|
|
|
|
|
|
Minimal haematopoiesis |
6/10 |
5/10 |
9/10 |
9/10 |
Males and females |
|
Minimal pigment |
1/10 |
3/10 |
8/10 |
10/10 |
Males and females |
|
Spleen |
|
|
|
|
|
|
Haematopoiesis |
|
|
|
|
Males and females |
|
Minimal |
|
|
|
|
|
|
Minimal to slight |
|
|
|
|
|
|
Slight |
10/10 |
10/10 |
10/10 |
10/10 |
|
|
Haemosiderosis |
|
|
|
|
Males and females |
|
Minimal |
|
|
|
|
|
|
Minimum to slight |
10/10 |
|
|
|
|
|
Slight |
|
10/10 |
10/10 |
10/10 |
|
|
Congestion |
|
|
|
|
Males and females |
|
Minimum to slight |
10/10 |
10/10 |
|
|
|
|
Slight |
|
|
10/10 |
10/10 |
|
|
Bone-marrow cellularity |
|
|
|
|
|
|
Moderate |
|
|
|
|
Males and females |
|
Marked |
10/10 |
10/10 |
10/10 |
10/10 |
|
From Wedig (1990b)
* Statistically significant
a
Mean values, 2042, 2047, 1814, 1805, and 1394 U/L at 0, 17, 70, 300, and 1200 mg/kg bw per day, respectively, representing 89, 88, and 68% of control values at 70, 300, and 1200 mg/kg bw per day, respectivelyb
Absolute weightc
Relative to brain weightd
Relative to body weightIn a study in rats performed according to GLP and OECD guideline 408, four groups of 10 male and 10 female HanIbm: Wistar rats (approximately 6 weeks of age) received diets containing chlorpropham (purity, 98.6%) at a concentration of 0, 120, 600, or 3000 mg/kg of diet daily for 90 days, equal to 0, 10, 47, and 220 mg/kg bw per day for males and 0, 11, 54, and 230 mg/kg bw per day for females. The test substance was ground to a fine powder in an electric grinder and then mixed with powdered feed. Water (approximately 11%) was added to aid pelleting. The pellets were dried for approximately 24 h at 35 ºC before storage. Control animals received similarly prepared pellets but without the test substance. Fresh diets were prepared weekly and were analysed in weeks 1, 6, and 12 for stability, homogeneity, and accuracy. In addition to the guidelines, functional observations (hearing ability, pupillary reflex, static righting reflex, hanging wire test, and activity test) were made during weeks 12–13 of treatment, and the formation of methaemoglobin and Heinz bodies was investigated. Greater food scatter was observed at the highest dose, probably because of unpalatibility; the intake values presented above are corrected for food scatter. Thyroid weights were not determined.
No changes were found in the tests for function. Significant decreases in red blood cell count, haemoglobin concentration, erythrocyte volume fraction, and mean corpuscular haemoglobin concentration and significant increases in mean corpuscular volume and mean corpuscular haemoglobin were seen in animals at the highest dose. Red blood cell counts were also significantly decreased at 600 mg/kg of diet. Significant, dose-related increases in methaemoglobin (by 0.0, 0.2, 0.8 and 3.6% in males and 0.1, 0.4, 1.4, and 5.3% in females at the four concentrations, respectively) and in the leukocyte count were seen in both males and females. At all doses, the reticulocyte counts were significantly increased, but with no dose–response relationship, the reported values at 600 and 120 mg/kg of diet being close to or within control values for this rat strain. Significant decreases in haemoglobin concentration and erythrocyte volume fraction in females at 120 mg/kg of diet, in the absence of a significant decrease at the next higher dose, were considered to be incidental. Increases in platelet counts, seen in males at the two higher doses and in females at all doses, with no dose–response relationship or statistical significance (except in males at 600 mg/kg of diet), were considered to be not biologically relevant. Significant changes in prothrombin time and partial thromboplastin time, with no dose–response relationship, were considered to be incidental. Clinical chemistry showed a significant increase in bilirubin concentration in animals at the highest dose. Dose–response relationships were not seen for other significant changes in clinical chemical parameters (total protein, albumin, sodium), or the changes were within historical control values (urea) and therefore considered not to be biologically relevant. The significant decrease in aspartate aminotransferase activity was also considered to be biologically irrelevant because an increase would be expected in the presence of toxic effects on organs. The absolute weight of the spleen and that in relation to body weight were increased at the two higher doses. The increases were slight at 600 mg/kg of diet but were statistically significant at the highest dose. An enlarged and/or red–brown, discoloured spleen was seen in three males and nine females at the highest dose. As a similar effect was seen in two females at the lowest dose but not at 600 mg/kg of diet, the effect was considered biologically irrelevant. Histopathological examination of the spleen revealed increased haematopoiesis, slight congestion, and follicular atrophy in animals at the highest dose. The NOAEL was 120 mg/kg of diet, equal to 10 mg/kg bw per day, on the basis of the significant decrease in erythrocyte count and the significant, dose-related increase in methaemoglobin at 600 mg/kg of diet. The authors considered the NOAEL to be 600 mg/kg of diet, equal to 47 mg/kg bw per day, as the anaemia observed at this dose was of only minimal severity, and no morphological changes were observed in the spleen (see Table 9) (Schoenmakers et al., 1998b). The Meeting noted that it would have been more appropriate to determine methaemoglobin earlier in the study. Methaemoglobin formation is an acute effect, and adaptation might have occurred when it was determined in this study (at the end of treatment).
Table 9. Results of 90-day study in Wistar rats treated with chlorpropham in the diet
|
Effect |
Dose (mg/kg bw per day) |
|||
|
0 |
10 |
11 |
||
|
Male |
Female |
Male |
Female |
|
|
Death |
No treatment-related effects |
|
|
|
|
Ophthalmoscopy |
No treatment-related effects |
|
|
|
|
Functional observations |
No treatment-related effects |
|
|
|
|
Clinical signs |
No treatment-related effects |
|
|
|
|
Body-weight gain |
No treatment-related effects |
|
|
|
|
Food consumption |
No treatment-related effects |
|
|
|
|
Haematology |
|
|
|
|
|
Haemoglobin |
|
|
|
Decrease* |
|
Erythrocyte volume fraction |
|
|
|
Decrease* |
|
Erythrocyte count |
|
|
|
|
|
Mean corpuscular haemoglobin |
|
|
|
|
|
Mean corpuscular volume |
|
|
|
|
|
Mean corpuscular haemoglobin concentration |
|
|
|
|
|
Red cell distribution width (%) |
|
|
Decrease* |
|
|
Reticulocyte count |
|
|
Increase* |
Increase* |
|
Methaemoglobin |
|
|
|
|
|
Leukocyte count |
|
|
|
|
|
Platelet count |
|
|
|
Increase |
|
Prothrombin time |
|
|
Decrease* |
|
|
Partial thromboplastin time |
|
|
|
|
|
Clinical chemistry |
|
|
|
|
|
Aspartate aminotransferase activity |
|
|
Decrease* |
|
|
Bilirubin concentration |
|
|
|
|
|
Urea concentration |
|
|
|
|
|
Total protein concentration |
|
|
|
|
|
Albumin concentration |
|
|
Decrease* |
|
|
Sodium concentration |
|
|
|
|
|
Organ weights |
|
|
|
|
|
Spleen |
|
|
|
|
|
Macroscopy |
|
|
|
|
|
Spleen, enlarged and/or red–brown |
0/10 |
0/10 |
0/10 |
2/10 |
|
Microscopy |
|
|
|
|
|
Spleen |
|
|
|
|
|
Haematopoiesis, grade 1 |
9/10 |
9/10 |
10/10 |
10/10 |
|
Haematopoiesis, grade 2 |
1/10 |
1/10 |
0/10 |
0/10 |
|
Haemosiderin deposits, grade 1 |
9/10 |
9/10 |
10/10 |
9/10 |
|
Haemosiderin deposits, grade 2 |
1/10 |
1/10 |
0/10 |
1/10 |
|
Congestion, grade 1 |
0/10 |
0/10 |
0/10 |
0/10 |
|
Congestion, grade 2 |
0/10 |
0/10 |
0/10 |
0/10 |
|
Follicular atrophy, grade 1 |
0/10 |
0/10 |
0/10 |
0/10 |
|
Follicular atrophy, grade 2 |
0/10 |
0/10 |
0/10 |
0/10 |
Table 9 (continued)
|
Effect |
Dose (mg/kg bw per day) |
Dose-related effect |
|||
|
47 |
54 |
220 |
230 |
||
|
Male |
Female |
Male |
Female |
||
|
Death |
|
|
|
|
|
|
Ophthalmoscopy |
|
|
|
|
|
|
Functional observations |
|
|
|
|
|
|
Clinical signs |
|
|
|
|
|
|
Body-weight gain |
|
|
|
|
|
|
Food consumption |
|
|
|
|
|
|
Haematology |
|
|
|
|
|
|
Haemoglobin |
|
|
Decrease* |
Decrease* |
|
|
Erythrocyte volume fraction |
|
|
Decrease* |
Decrease* |
|
|
Erythrocyte count |
Decrease* |
Decrease* |
Decrease* |
Decrease* |
Males and females |
|
Mean corpuscular haemoglobin |
|
|
Increase* |
Increase* |
|
|
Mean corpuscular volume |
|
|
Increase* |
Increase* |
|
|
Mean corpuscular haemoglobin concentration |
|
|
|
Decrease* |
|
|
Red cell distribution width (%) |
|
|
|
|
|
|
Reticulocyte count |
Increase* |
Increase* |
Increase* |
Increase* |
|
|
Methaemoglobin |
Increase* |
Increase* |
Increase* |
Increase* |
Males and females |
|
Leukocyte count |
Increase |
Increase* |
Increase* |
Increase* |
Males and females |
|
Platelet count |
Increase* |
Increase |
Increase |
Increase |
|
|
Prothrombin time |
|
|
|
|
|
|
Partial thromboplastin time |
|
Increase* |
|
|
|
|
Clinical chemistry |
|
|
|
|
|
|
Aspartate aminotransferase activity |
Decrease* |
|
|
|
|
|
Bilirubin concentration |
|
|
Increase* |
Increase* |
|
|
Urea concentration |
|
|
|
Increase* |
|
|
Total protein concentration |
Decrease* |
|
|
|
|
|
Albumin concentration |
Decrease* |
|
|
|
|
|
Sodium concentration |
|
Decrease* |
|
|
|
|
Organ weights |
|
|
|
|
|
|
Spleen |
Increasea,b |
Increasea,b |
Increase*a,b |
Increase*a,b |
Males and females |
|
Macroscopy |
|
|
|
|
|
|
Spleen, enlarged and/or red–brown |
0/10 |
0/10 |
3/10 |
9/10 |
Females |
|
Microscopy |
|
|
|
|
|
|
Spleen |
|
|
|
|
|
|
Haematopoiesis, grade 1 |
10/10 |
8/10 |
4/10 |
0/10 |
|
|
Haematopoiesis, grade 2 |
0/10 |
2/10 |
6/10 |
10/10 |
|
|
Haemosiderin deposits, grade 1 |
10/10 |
8/10 |
2/10 |
0/10 |
|
|
Haemosiderin deposits, grade 2 |
0/10 |
2/10 |
8/10 |
10/10 |
|
|
Congestion, grade 1 |
0/10 |
0/10 |
2/10 |
1/10 |
|
|
Congestion, grade 2 |
0/10 |
0/10 |
6/10 |
8/10 |
|
|
Follicular atrophy, grade 1 |
0/10 |
0/10 |
5/10 |
5/10 |
|
|
Follicular atrophy, grade 2 |
0/10 |
0/10 |
4/10 |
5/10 |
|
From Schoenmakers et al. (1998b)
* Statistically significant
a
b
Relative to body weightTable 10. Macroscopic results of 90-day study in beagle dogs given chlorpropham in the diet for 90 days
|
Effect |
Dose (mg/kg bw per day) |
|||
|
0 |
25 |
|||
|
Male |
Female |
Male |
Female |
|
|
Death |
No treatment-related effect |
|
|
|
|
Clinical signs |
No treatment-related effect |
|
|
|
|
Ophthalmic end-points |
No treatment-related effect |
|
|
|
|
Body-weight gain |
No treatment-related effect |
|
|
|
|
Food consumption |
No treatment-related effect |
|
|
|
|
Haematological parameters |
|
|
|
|
|
Haemoglobin |
|
|
|
|
|
Erythrocyte count |
|
|
|
|
|
Mean corpsucular volume |
|
|
|
|
|
Mean corpuscular haemoglobin concentration |
|
|
|
|
|
Reticulocyte count |
|
|
|
|
|
Methaemoglobin (%) |
|
|
|
|
|
Heinz bodies |
|
|
|
|
|
Platelet count |
|
|
|
|
|
Clinical chemical parameters |
|
|
|
|
|
Lactate dehydrogenase activity |
|
|
Increase*b |
|
|
Bilirubin concentration |
|
|
|
|
|
Cholesterol concentration |
|
|
|
|
|
Phospholipid concentration |
|
|
|
|
|
Triglyceride concentration |
|
|
|
|
|
Sodium concentration |
|
|
|
|
|
Urinary parameters |
No treatment-related effect |
|
|
|
|
Organ weights |
|
|
|
|
|
Liver |
|
|
|
|
|
Thyroid |
|
|
|
|
|
|
|
|
|
|
|
Spleen |
|
|
|
|
|
Appearance |
|
|
|
|
|
Spleen, enlarged and/or black |
|
|
|
|
|
Thyroid, enlarged |
|
|
|
|
Table 10 (continued)
|
Effect |
Dose (mg/kg bw per day) |
Dose-related effect |
|||
|
125 |
625 |
||||
|
Male |
Female |
Male |
Female |
||
|
Death |
|
|
|
|
|
|
Clinical signs |
Vomiting, retching, excessive salivation, diarrhoea, orange staining of faeces |
|
|
|
|
|
Ophthalmic end-points |
|
|
|
|
|
|
Body-weight gain |
|
|
|
|
|
|
Food consumption |
|
|
|
|
|
|
Haematological parameters |
|
|
|
|
|
|
Haemoglobin |
|
|
Decrease*a |
Decrease*a |
|
|
Erythrocyte count |
|
|
Decrease*a |
Decrease*a |
|
|
Mean corpsucular volume |
|
|
Increase*a |
Increase*a |
|
|
Mean corpuscular haemoglobin concentration |
Decrease*b |
Decrease*a |
Decrease*a |
Decrease*a |
Males and females |
|
Reticulocyte count |
|
|
Increasea |
Increasea |
|
|
Methaemoglobin (%) |
Increase*a |
Increase*a |
Increase*a |
Increase*a |
|
|
Heinz bodies |
|
|
Increasea |
Increasea |
|
|
Platelet count |
|
|
|
Increase*b |
|
|
Clinical chemical parameters |
|
|
|
|
|
|
Lactate dehydrogenase activity |
|
|
Increase*b |
|
|
|
Bilirubin concentration |
|
|
Increase*a |
Increase*b |
|
|
Cholesterol concentration |
Increase*b |
Increase*a |
Increase*a |
Increase*a |
Males and females |
|
Phospholipid concentration |
Increase*b |
Increase*a |
Increase*a |
Increase*a |
Males and females |
|
Triglyceride concentration |
|
|
Increase*a |
Increase*a |
|
|
Sodium concentration |
|
|
Decreaseb |
|
|
|
Urinary parameters |
|
|
|
|
|
|
Organ weights |
|
|
|
|
|
|
Liver |
|
|
Increase*a,b |
Increase*a,b |
|
|
Thyroid |
Increase*a,b |
Increase*a,b |
Increase*a,b |
Increase*a,b |
Males and females |
|
|
|
Increaseb |
|
|
|
|
Spleen |
|
|
Increase*a,b |
Increase*a,b |
|
|
Appearance |
|
|
|
|
|
|
Spleen, enlarged and/or black |
1/4 |
|
4/4 |
4/4 |
Males |
|
Thyroid, enlarged |
2/4 |
|
3/4 |
4/4 |
Males |
From Schoenmakers & Frieling (1998)
* Statistically significant
a After 4 and 13 weeks
b After 13 weeks only
c Absolute weight
d Relative to body weight
Table 11. Microscopic changes in beagles given chlorpropham in the diet for 90 days
|
|
Dose (mg/kg bw per day) |
|||
|
0 |
25 |
|||
|
Male |
Female |
Male |
Female |
|
|
Liver |
|
|
|
|
|
Kuppfer-cell pigment, brown |
|
|
|
|
|
Minimal |
|
1/4 |
|
1/4 |
|
Slight |
|
|
|
1/4 |
|
Moderate |
|
|
|
|
|
Severe |
|
|
|
|
|
Spleen |
|
|
|
|
|
Congestion |
|
|
|
1/4 |
|
Haemosiderin-positive pigment |
|
|
|
|
|
Minimal |
3/4 |
4/4 |
3/4 |
1/4 |
|
Slight |
1/4 |
|
1/4 |
3/4 |
|
Moderate |
|
|
|
|
|
Haematopoiesis, erythropoiesis |
|
|
|
|
|
Minimal |
1/4 |
2/4 |
4/4 |
3/4 |
|
Slight |
|
1/4 |
|
1/4 |
|
Moderate |
|
|
|
|
|
Thyroid |
|
|
|
|
|
Differential follicular hypertrophy or hyperplasia |
|
|
|
|
|
Moderate |
|
|
|
|
|
Severe |
|
|
|
|
|
Pituitary |
|
|
|
|
|
Hypertrophy of basophils |
|
|
|
|
|
Slight |
|
|
|
|
|
Moderate |
|
|
|
|
|
Bone marrow |
|
|
|
|
|
Erythroid hyperplasia |
|
|
|
|
|
Slight |
|
|
|
|
|
Moderate |
|
|
|
|
|
Haemosiderin deposition |
|
|
|
|
|
Minimal |
2/4 |
3/4 |
3/4 |
1/4 |
|
Slight |
|
|
|
1/4 |
|
Moderate |
|
|
|
|
Table 11 (continued)
|
|
Dose (mg/kg bw per day) |
Dose-related effect |
|||
|
125 |
625 |
||||
|
Male |
Female |
Male |
Female |
||
|
Liver |
|
|
|
|
|
|
Kuppfer-cell pigment, brown |
|
|
|
|
Males and females |
|
Minimal |
3/4 |
|
|
|
|
|
Slight |
1/4 |
3/4 |
|
|
|
|
Moderate |
|
1/4 |
3/4 |
4/4 |
|
|
Severe |
|
|
1/4 |
|
|
|
Spleen |
|
|
|
|
|
|
Congestion |
4/4 |
4/4 |
4/4 |
4/4 |
Males and females |
|
Haemosiderin-positive pigment |
|
|
|
|
Males and females |
|
Minimal |
3/4 |
|
2/4 |
|
|
|
Slight |
1/4 |
2/4 |
2/4 |
3/4 |
|
|
Moderate |
|
2/4 |
|
1/4 |
|
|
Haematopoiesis, erythropoiesis |
|
|
|
|
Males and females |
|
Minimal |
2/4 |
1/4 |
2/4 |
|
|
|
Slight |
1/4 |
3/4 |
2/4 |
3/4 |
|
|
Moderate |
|
|
|
1/4 |
|
|
Thyroid |
|
|
|
|
|
|
Differential follicular hypertrophy or hyperplasia |
|
|
|
|
Males and females |
|
Moderate |
3/4 |
3/4 |
1/4 |
1/4 |
|
|
Severe |
|
|
3/4 |
3/4 |
|
|
Pituitary |
|
|
|
|
|
|
Hypertrophy of basophils |
|
|
|
|
Females |
|
Slight |
|
1/4 |
1/4 |
2/4 |
|
|
Moderate |
|
1/4 |
1/4 |
1/4 |
|
|
Bone marrow |
|
|
|
|
|
|
Erythroid hyperplasia |
|
|
|
|
Males and females |
|
Slight |
1/4 |
1/4 |
|
2/4 |
|
|
Moderate |
|
|
4/4 |
2/4 |
|
|
Haemosiderin deposition |
|
|
|
|
Males and females |
|
Minimal |
|
1/4 |
|
|
|
|
Slight |
3/4 |
3/4 |
1/4 |
|
|
|
Moderate |
|
|
3/4 |
4/4 |
|
From Schoenmakers & Frieling (1998)
In a study cited in a review by the Ministry of Agriculture, Fisheries and Food (1993), groups of 10 rats were fed diets containing chlorpropham for 90 days at a concentration of 0.031, 0.125, 0.5, or 2.0% in a dry casein diet (Larson et al., 1960). The mean weights and food consumption of all treated groups surpassed those of the control group. The mean weights of the liver of animals given the three higher doses were significantly greater than those of the control group, although no microscopic abnormality was found after the 90 days of treatment. Owing to the limited study design and the lack of details, the study is not appropriate for risk assessment.
90-day study in dogs treated orally
In a 90-day study in dogs performed according to GLP and OECD Guideline No. 409, groups of four male and four female beagles aged 5–6 months received a capsule containing technical-grade chlorpropham (purity, 98.6%; ground to a fine powder) providing a dose of 0, 25, 125, or 625 mg/kg bw daily for 90 days. The capsules were prepared once a week. The animals were offered 0.3 kg of standard maintenance food once a day. In addition to the haematological parameters required by OECD Guideline No. 409, red cell distribution width, Heinz bodies, and methaemoglobin were determined after 4 and 13 weeks. Although required by the guideline, ornithine decarboxylase in serum was not determined, and serum tri-iodothyronine and thyroxine levels were not determined as was done in the 60-week study in dogs.
Animals at 625 mg/kg bw per day suffered from vomiting and retching, excessive salivation, diarrhoea, and orange staining of the faeces. Haematological examinations showed significantly increased methaemoglobin concentrations in animals at the two higher doses after 4 and 13 weeks. The slight, nonsignificant increases (compared with control values) in methaemoglobin concentrations in animals at the lowest dose fell within the range of concentrations measured before treatment and were therefore considered unrelated to treatment. The mean corpuscular haemoglobin concentration was significantly decreased in males and females at the two higher doses after 4 and 13 weeks, with a dose–response relationship. In addition, animals at the highest dose had significantly decreased red blood cell counts and haemoglobin concentration and significantly increased mean corpuscular volume after both 4 and 13 weeks. Clinical chemical evaluations showed significant dose-related increases in cholesterol and phospholipid concentrations at the two higher doses and significantly increased total bilirubin and triglyceride concentrations at the highest dose. Lactate dehydrogenase activity was increased significantly in males at the highest and lowest doses, but these increases were considered biologically irrelevant because the increase in the mean value at 25 mg/kg bw per day was seen in two animals and that at 625 mg/kg bw per day in one animal, there was no dose–response relationship, and the changes were seen only in males. The significant decrease in mean sodium concentration in males at the highest dose was seen in only one animal and was therefore considered to be biologically irrelevant. Significantly increased thyroid weights were observed in animals at the two higher doses. At the highest dose, significant increases were observed in the weights of the liver and spleen. Urinary analysis showed no treatment-related changes.
Macroscopy revealed enlarged thyroid glands and enlarged and/or black spleens in nearly all animals at the highest dose and in a few males at 125 mg/kg bw per day. Microscopy showed dose-related changes in the thyroid (diffuse follicular hypertrophy and hyperplasia), pituitary (hypertrophy of basophils), liver (increased iron-positive Kuppfer-cell pigment), spleen (congestion, increased iron-positive pigment at these doses and extramedullary erythropoiesis at the highest dose), and bone-marrow (increased erythroid hyperplasia and haemosiderin deposition) in both males and females (see Tables 10 and 11). The NOAEL was 25 mg/kg bw per day on the basis of the increased methaemoglobin concentrations and microscopic changes in the thyroid and other organs at the next higher dose (Schoenmakers & Frieling, 1998).
52–60-week studies in dogs treated orally
In a 60-week study in dogs performed according to GLP and FIFRA Guideline 40 CFR 158, reference 83-1 (essentially the same as OECD Guideline no. 409), groups of four male and four female beagles (aged approximately 7 months) received diets containing chlorpropham (purity, 96.2%) at concentrations providing a dose of 0, 5, 50, 350, or 500 mg/kg bw daily for 60 weeks. The substance was melted at 45–47 °C and used as a liquid or allowed to recrystallize, ground to a fine powder, and used as a solid. It was dissolved in corn oil and mixed into the diet. The control diet contained the same amount of corn oil. Fresh diets were prepared weekly, and samples were analysed for chlorpropham at weeks 1, 2, 3, 4, 5, 6, 7, 9, 16, 28, 40, 50, and 60. The clinical chemical examinations did not include an assay for serum alkaline phosphatase activity. In addition to the guideline, physical examinations were performed weekly, and serum cholinesterase activity and tri-iodothyronine were determined. A test for stimulation of thyroid-stimulating hormone was performed in weeks 0, 14, 26, 54, and 60 in all dogs, involving assays for serum tri-iodothyronine and thyroxine just before injection of thyroid-stimulating hormone and for thyroxine 4 h after injection. Urine from all dogs was analysed for appearance, specific gravity, pH, proteins, bilirubin, urobilinogen, glucose, ketones, occult blood, leukocyte count, and sedimentation rate in weeks 0, 13, 26, and 60. About 40 tissues from all dogs were examined microscopically.
Animals at the two higher doses found the diet unpalatable. Changes in red blood cell parameters and increased liver weights were seen at these doses, but the marked stimulation of red cell production seen in the studies in mice and rats was not apparent in dogs. Cholesterol concentrations were increased at these doses. The main effect in dogs at doses greater than 5 mg/kg bw per day was on the thyroid gland and included increased weight and activity, decreased thyroxine concentration in the thyroid-stimulating hormone stimulation test, and occasionally decreased tri-iodothyronine concentrations. The NOAEL was 5 mg/kg bw per day on the basis of changes in the thyroid at 50 mg/kg bw per day. The results are summarized in Table 12 (Wedig, 1992). Although metabolites of chlorpropham such as chloroaniline and chloroacetanilide may induce methaemoglobinaemia, the presence of neither methaemoglobin nor Heinz bodies in blood was investigated.
Table 12. Results of study in dogs fed a diet containing chlorpropham for60 weeks
|
Effect |
Dose (mg/kg bw per day) |
||||||
|
0 |
5 |
50 |
|||||
|
Male |
Female |
Male |
Female |
Male |
Female |
||
|
Death |
|
|
|
|
1/4a |
|
|
|
Physical condition |
No treatment-related effect |
|
|
|
|
||
|
Ophthalmic parameters |
No treatment-related effect |
|
|
|
|
||
|
Clinical signs |
|
|
|
|
|
|
|
|
Thin appearanceb |
0/4 |
0/4 |
3/4 |
0/4 |
2/4 |
2/4 |
|
|
Intake of active ingredient (mg/kg bw) |
0 |
0 |
5.5 |
5.0 |
51 |
52 |
|
|
Body-weight gainc |
|
|
|
|
|
|
|
|
Food consumption |
|
|
|
|
|
|
|
|
Haematological parameters |
|
|
|
|
|
|
|
|
Haemoglobin |
|
|
|
|
|
|
|
|
Erythrocyte volume fraction |
|
|
|
|
|
|
|
|
Erythrocyte count |
|
|
|
|
|
|
|
|
Mean corpuscular volume |
|
|
|
|
|
|
|
|
Mean corpuscular haemoglobin concentration |
|
|
|
|
|
|
|
|
Platelet count |
|
|
|
|
|
|
|
|
Clinical chemical parameters |
|
|
|
|
|
|
|
|
Cholesterol concentration |
|
|
|
|
|
|
|
|
Tri-iodothyronine |
|
|
|
|
|
|
|
|
Thyroxine (4 h after thyroid-stimulating hormone) |
|
|
|
|
Decrease*i |
Decrease*j |
|
|
Urinary parameters |
|
|
|
|
|
|
|
|
Amorphous phosphate (week 60) |
|
|
|
|
|
Increase |
|
|
Organ weights |
|
|
|
|
|
|
|
|
Liver |
|
|
|
|
|
|
|
|
|
|
|
|
|
|
|
|
|
Thyroid |
|
|
|
Increasel |
Increase*l,m |
Increase*l,m |
|
|
Macroscopic appearance |
|
|
|
|
|
|
|
|
Enlarged thyroid lobes |
|
|
|
|
2/4 |
4/4 |
|
|
Microscopic appearance |
|
|
|
|
|
|
|
|
Thyroid activity |
|
|
|
|
|
|
|
|
Slight |
4/4 |
4/4 |
4/4 |
4/4 |
|
|
|
|
Slight–moderate |
|
|
|
|
4/4 |
|
|
|
Moderate |
|
|
|
|
|
4/4 |
|
|
Moderate–marked |
|
|
|
|
|
|
|
|
Marked |
|
|
|
|
|
|
|
Table 12 (continued)
|
Effect |
Dose (mg/kg bw per day) |
Dose-related effect |
|||
|
350 |
500 |
||||
|
Male |
Female |
Male |
Female |
||
|
Death |
|
|
|
|
|
|
Physical condition |
|
|
|
|
|
|
Ophthalmic parameters |
|
|
|
|
|
|
Clinical signs |
|
|
|
|
|
|
Thin appearanceb |
2/4 |
3/4 |
4/4 |
3/4 |
|
|
Intake of active ingredient (mg/kg bw) |
350 |
360 |
460 |
450 |
|
|
Body-weight gainc |
Decrease |
Decrease |
Decrease |
Decrease |
Males and females |
|
Food consumption |
Decreased |
Decreased |
Decreasee |
Decreasee |
Males and females |
|
Haematological parameters |
|
|
|
|
Males and females |
|
Haemoglobin |
Decrease*f |
Decrease*f |
Decrease*f |
Decrease*f |
|
|
Erythrocyte volume fraction |
Decrease*f |
Decrease*f |
Decrease*f |
Decrease*f |
|
|
Erythrocyte count |
Decrease*f |
Decrease*f |
Decrease*f |
Decrease*f |
|
|
Mean corpuscular volume |
Increaseg |
Increaseg |
Increase*f |
Increase*f |
|
|
Mean corpuscular haemoglobin concentration |
Decrease*f |
Decrease*f |
Decrease*g |
Decrease*f |
|
|
Platelet count |
Increase*g |
Increase*f |
Increase*g |
Increase*g |
|
|
Clinical chemical parameters |
|
|
|
|
|
|
Cholesterol concentration |
Increase*g |
Increase*f |
Increase*g |
Increase*f |
Females |
|
Tri-iodothyronine |
Decrease*h |
Decrease*i |
Decrease*h |
Decrease*i |
|
|
Thyroxine (4 h after thyroid-stimulating hormone) |
Decrease*k |
Decrease*j |
Decrease*g |
Decreaseg |
Males |
|
Urinary parameters |
|
|
|
|
|
|
Amorphous phosphate (week 60) |
|
Increase |
Increase |
Increase |
|
|
Organ weights |
|
|
|
|
|
|
Liver |
Increasel |
Increasel |
Increasel |
Increase*l,m |
Males and females |
|
|
Increase*m |
Increase*m |
Increase*m |
|
|
|
Thyroid |
Increase*l,m |
Increase*l,m |
Increase*l,m |
Increase*l,m |
Males and females |
|
Macroscopic appearance |
|
|
|
|
|
|
Enlarged thyroid lobes |
4/4 |
4/4 |
4/4 |
4/4 |
Males and females |
|
Microscopic appearance |
|
|
|
|
|
|
Thyroid activity |
|
|
|
|
Males and females |
|
Slight |
|
|
|
|
|
|
Slight–moderate |
|
|
|
|
|
|
Moderate |
|
|
|
|
|
|
Moderate–marked |
4/4 |
4/4 |
4/4 |
|
|
|
Marked |
|
|
|
4/4 |
|
From Wedig (1992)
a Necropsied at week 21 after violent episodes of clonic–tonic convulsions, which cannot be excluded as a treatment-related effect
b Observed during short periods at 5 and 50 mg/kg bw per day; present over prolonged periods at 350 and 500 mg/kg bw per day, resulting from unpalatability of the diet
c Treatment-related; sometimes significant, especially at beginning, but not at termination
d Low during first weeks, but excessive consumption during following weeks; one male that ate little up to week 4 received a reduced dose of chlorpropham, which gradually increased to normal within 3 weeks
e Very low during first 3 weeks; this dog received a reduced dose of chlorpropham, which gradually increased to normal levels within 4 weeks
f At one or more sampling times
g At all sampling times
h Statistically significant only at weeks 54 and 60
i Statistically significant only at week 14
j Statistically significant only at week 54
k Statistically significant only at weeks 14 and 60
l Absolute weight
m Relative to body weight
Groups of two male and two female purebred beagle dogs, 6 months old, received diets containing 0, 0.02, 0.2, or 2% chlorpropham (purity and batch unknown), equivalent to 0, 5, 50, and 500 mg/kg bw per day, for 1 year. The diets were prepared with equal amounts of corn oil; they were mixed with water and offered to each dog once a day for about 0.5 h, and the amount consumed was recorded. A bone was given to each dog once a week. The animals were weighed weekly. Haematological and urinary (glucose and protein) parameters were measured at monthly intervals. At termination, the heart, liver, spleen, kidneys, and testes were weighed. Fifteen tissues from all animals that died during the study and from surviving animals were examined histologically. Body-weight gain was decreased in a dose-related fashion at the two higher doses, and food consumption was decreased in males and females at the highest dose. Haemoglobin concentration and erythrocyte volume fraction were decreased in males and females at this dose, and the relative weights of the liver and spleen were increased. Splenic congestion was seen in two dogs (sex not specified) at the highest dose (Larson et al., 1960). Owing to its limited design, the study was not appropriate for risk assessment.
19-week study in pigs treated orally
In a study cited in a review by the Ministry of Agriculture, Fisheries and Food (1993), groups of four pigs received a diet containing chlorpropham at a concentration of 3300 mg/kg of diet for 19 weeks. There was no effect on weight gain, and no pathological abnormalities were observed at autopsy. The liver, kidney, and spleen were histologically normal. The only change in the haematological profile was a slight decrease in haemaglobin content in week 19. Owing to its limited design and the lack of details, this study was not appropriate for risk assessment.
21-day study in rabbits treated dermally
In a 21-day study in New Zealand white rabbits performed according to GLP and FIFRA Guideline 40 CFR 158.135, reference 82-2 (essentially the same as OECD Guideline No. 410), groups of seven male and seven female animals weighing 2.1–3.7 kg were treated with chlorpropham (purity 96.2%) as a solid moistened with 0.9% saline at a dose of 100, 520, or 1000 mg/kg bw daily for 21–22 days with a 6-h application on the clipped intact skin of the back (10% of the body surface) under an occluded dressing. A control group was treated with 0.9% saline only. Food consumption was not determined in this study. In addition to the guidelines, physical examinations and ophthalmoscopy were performed at the beginning of the test and before necropsy, clinical observations were made twice daily, determination of plasma cholinesterase activity was included in the clinical chemistry, and all animals were examined microscopically. Dermal irritation and microscopic changes in the skin were seen at all doses, although only very slight erythema had been observed in an acute test for skin irritation. Haematological tests revealed an increased number of reticulocytes at the two higher doses, indicative of a decreased life span of red blood cells and subsequently increased haematopoiesis. Since no anaemia was observed, the animals were able to compensate for the reduction in the red blood cell life span. The LOAEL for dermal irritation and microscopic changes in the skin and the NOAEL for systemic effects on the basis of an increased number of reticulocytes was 100 mg/kg bw per day. The results of the study are shown in Table 13 (Krohmer, 1990g). The Meeting noted that although metabolites of chlorpropham such as chloroaniline and chloroacetanilide can induce methaemoglobinemia, the presence of neither methaemoglobin nor Heinz bodies in blood was investigated in this study.
Table 13. Results of a 21-day study in rabbits treated with chlorpropham dermally
|
Effect |
Dose (mg/kg bw per day) |
|||
|
0 |
100 |
|||
|
Male |
Female |
Male |
Female |
|
|
Deaths |
No treatment-related effect |
|
|
|
|
Physical condition |
No treatment-related effect |
|
|
|
|
Ophthalmic end-points |
No treatment-related effect |
|
|
|
|
Clinical signs |
|
|
|
|
|
Skin irritation |
|
|
|
|
|
Erythema |
0/7 |
0/7 |
1/7 |
5/7 |
|
Oedema |
0/7 |
0/7 |
0/7 |
2/7 |
|
Fine transversal cracking |
0/7 |
0/7 |
0/7 |
0/7 |
|
Scaliness |
0/7 |
0/7 |
0/7 |
1/7 |
|
Body-weight gain |
No treatment-related effect |
|
|
|
|
Haematological end-points |
|
|
|
|
|
Reticulocyte count |
|
|
|
|
|
Clinical chemical end-points |
|
|
|
|
|
Glucosea |
|
|
Decrease* |
|
|
Organ weights |
|
|
|
|
|
Spleenb |
|
|
Increasec |
|
|
|
|
|
Increased |
|
|
|
|
|
Increasee |
|
|
Macroscopic appearance |
|
|
|
|
|
Thickened treated skin area |
0/7 |
0/7 |
0/7 |
0/7 |
|
Microscopic appearance |
|
|
|
|
|
Skin |
|
|
|
|
|
Acanthosis |
|
|
|
|
|
Minimal |
0/7 |
0/7 |
4/7 |
4/7 |
|
Slight |
0/7 |
0/7 |
0/7 |
0/7 |
|
Hyperkeratosis |
|
|
|
|
|
Minimal |
0/7 |
0/7 |
4/7 |
4/7 |
|
Slight |
0/7 |
0/7 |
0/7 |
0/7 |
|
Focal dermal inflammation |
|
|
|
|
|
Cell infiltation, minimal |
0/7 |
0/7 |
4/7 |
4/7 |
Table 13 (continued)
|
Effect |
Dose (mg/kg bw per day) |
Dose-related effect |
|||
|
520 |
1000 |
||||
|
Male |
Female |
Male |
Female |
||
|
Deaths |
|
|
|
|
|
|
Physical condition |
|
|
|
|
|
|
Ophthalmic end-points |
|
|
|
|
|
|
Clinical signs |
|
|
|
|
Males and females |
|
Skin irritation |
|
|
|
|
|
|
Erythema |
4/7 |
5/7 |
7/7 |
7/7 |
|
|
Oedema |
0/7 |
0/7 |
2/7 |
2/7 |
|
|
Fine transversal cracking |
0/7 |
1/7 |
2/7 |
1/7 |
|
|
Scaliness |
0/7 |
3/7 |
0/7 |
6/7 |
|
|
Body-weight gain |
|
|
|
|
|
|
Haematological end-points |
|
|
|
|
|
|
Reticulocyte count |
Increase |
Increase |
Increase* |
Increase* |
Males and females |
|
Clinical chemical end-points |
|
|
|
|
|
|
Glucosea |
Decrease* |
|
Decrease* |
|
|
|
Organ weights |
|
|
|
|
|
|
Spleenb |
Increasec |
|
Increasec |
|
|
|
|
Increase*d |
|
Increase*d |
|
|
|
|
Increase*e |
|
Increasee |
|
|
|
Macroscopic appearance |
|
|
|
|
|
|
Thickened treated skin area |
0/7 |
0/7 |
4/7 |
7/7 |
|
|
Microscopic appearance |
|
|
|
|
|
|
Skin |
|
|
|
|
|
|
Acanthosis |
|
|
|
|
Males and females |
|
Minimal |
6/7 |
5/7 |
4/7 |
2/7 |
|
|
Slight |
1/7 |
2/7 |
3/7 |
5/7 |
|
|
Hyperkeratosis |
|
|
|
|
Males and females |
|
Minimal |
4/7 |
4/7 |
3/7 |
4/7 |
|
|
Slight |
3/7 |
3/7 |
4/7 |
3/7 |
|
|
Focal dermal inflammation |
|
|
|
|
Males and females |
|
Cell infiltation, minimal |
7/7 |
7/7 |
7/7 |
7/7 |
|
From Krohmer (1990g)
a
Not dose-related; value in control group very high at end of testb
Not dose-related; spleen weight in control group very lowc
Absolute weightd
Relative to brain weighte
Relative to body weight(c) Long-term toxicity and carcinogenicity
Mice
An 18-month study in mice was performed according to GLP and FIFRA Guideline 40 CFR 158.153, reference 83-2, in which groups of 60 CD-1 albino mice of each sex received diets containing chlorpropham (purity, 96.2%) at concentrations resulting in a dose of 0, 100, 500, or 1000 mg/kg bw per day for 78 weeks. After 52 weeks of treatment, 10 mice of each sex per group were killed. Chlorpropham was melted at 45–47 °C and used as a liquid or allowed to recrystallize, ground to a fine powder, and used as a solid. It was dissolved in corn oil and mixed into the diet. The control diet contained the same amount of corn oil. Fresh diets were prepared weekly during weeks 1–36 and every two weeks from week 37. The blended diets were analysed at the beginning of weeks 1, 2, 3, 4, 17, 30, 37, 39, 43, 56, and 70 to determine the concentration of chlorpropham. Samples to test for storage stability were collected 6 days after preparation of the diets in weeks 38, 44, 56, and 70. The Meeting considered that as the diet was prepared every 2 weeks from week 37 onwards, its stability over 14 days should also have been demonstrated. In addition to the guidelines, physical and ophthalmoscopic examinations were performed on all mice before the study and on all animals scheduled for interim and terminal necropsy; the general physical assessment, including digital palpation and body-weight measurements, was conducted weekly until interim sacrifice and every 2 weeks thereafter. Food consumption was measured once a week during the first 14 weeks and every 2 weeks thereafter.
At the interim kill at 12 months, the effects seen at 1000 mg/kg bw per day were dark eyes and bluish skin of the extremities in all animals; significantly increased reticulocyte counts; significantly increased mean corpuscular haemoglobin concentration in males; significantly increased mean corpuscular haemoglobin in animals of each sex; significantly increased absolute and relative (to body and brain) weights of the liver in males; significantly increased relative weights of the spleen in females; increased liver haematopoiesis in 3/10 males and 5/10 females; increased severity of splenic haematopoiesis in males and females; and minimal splenic haemosiderosis in 8/10 males and10/10 females. At 500 mg/kg bw per day, 63% of the animals had dark eyes and 47% had bluish skin on the extremities; the reticulocyte counts were significantly increased in males; and minimal spleen haemosiderosis was seen in 5/10 males and 4/10 females. At 100 mg/kg bw, no treatment-related effects were seen.
After 18 months, bluish extremities and dark eyes were seen at the two higher doses, and haematology revealed increased MCH and MCHC values and an increased number of reticulocytes in animals at the highest dose. In addition, males at this dose had significantly increased liver weights, while females had significantly increased spleen weights. Microscopy revealed a quantitative increase in haematopoiesis in the liver at 1000 mg/kg bw per day. In the spleen, increased severity of haematopoiesis and increased severity and quantity of haemosiderosis were observed at the two higher doses. Increased severity of bone-marrow cellularity was also seen at these doses. The NOAEL was 100 mg/kg bw per day on the basis of haematological changes at the next higher dose. The results at the end of the study are shown in Table 14. The bluish extremities seen at 500 and 1000 mg/kg bw per day suggest methaemoglobinaemia; however, the presence of neither methaemoglobin nor Heinz bodies in blood was investigated in this study (Botta, 1992; Krohmer, 1992a).
Table 14. Results of a 78-week study of toxicity and carcinogenicity in mice goven chlorpropham in the diet
|
Effect |
Dose (mg/kg bw per day) |
|||
|
0 |
100 |
|||
|
Male |
Female |
Male |
Female |
|
|
Deaths |
7/49 |
11/51 |
11/50 |
17/50 |
|
Clinical signsa |
|
|
|
|
|
Bluish extremities |
|
1 |
|
|
|
Dark eyes |
|
|
|
|
|
Ophthalmoscopic end-points |
No treatment-related effect |
|
|
|
|
Physical condition at termination |
No treatment-related effect |
|
|
|
|
Body-weight gain |
No treatment-related effect |
|
|
|
|
Food consumption |
No treatment-related effect |
|
|
|
|
Haematological end-points |
|
|
|
|
|
Mean corpuscular haemoglobin |
|
|
|
|
|
Reticulocyte count |
|
|
|
|
|
Mean corpuscular haemoglobin concentration |
|
|
|
|
|
Monocyte count |
|
|
Decrease*b |
|
|
Organ weights |
|
|
|
|
|
Liver |
|
|
|
|
|
Spleen |
|
|
|
|
|
Macroscopic appearance |
No treatment-related effect |
|
|
|
|
Microscopic appearance |
|
|
|
|
|
Liver |
|
|
|
|
|
Haematopoiesis |
|
|
|
|
|
Minimal |
|
|
|
|
|
Minimal–slight |
|
|
|
|
|
Slight |
|
|
|
1/50 |
|
Spleen |
|
|
|
|
|
Haematopoiesis |
|
|
|
|
|
Minimal |
41/49 |
32/51 |
42/49 |
35/50 |
|
Slight |
6/49 |
15/51 |
7/49 |
15/50 |
|
Moderate |
2/49 |
4/51 |
|
|
|
Marked |
|
|
|
|
|
Haemosiderosis |
|
|
|
|
|
Minimal |
2/49 |
11/51 |
1/50 |
15/50 |
|
Minimal–slight |
|
|
|
|
|
Bone-marrow cellularity |
|
|
|
|
|
Moderate |
45/49 |
44/51 |
48/50 |
47/50 |
|
Marked |
4/49 |
7/51 |
2/50 |
3/50 |
|
Testis |
|
|
|
|
|
Amyloidosis |
4/49 |
|
2/11 |
|
|
Neoplastic lesions |
No treatment-related effect |
|
|
|
Table 14 (continued)
|
Effect |
Dose (mg/kg bw per day) |
Dose-related effect |
|||
|
500 |
1000 |
||||
|
Male |
Female |
Male |
Female |
||
|
Deaths |
8/50 |
18/50 |
22/49* |
11/50 |
|
|
Clinical signsa |
|
|
|
|
|
|
Bluish extremities |
16 |
1 |
49 |
50 |
Males and females |
|
Dark eyes |
48 |
16 |
49 |
50 |
Females |
|
Ophthalmoscopic end-points |
|
|
|
|
|
|
Physical condition at termination |
|
|
|
|
|
|
Body-weight gain |
|
|
|
|
|
|
Food consumption |
|
|
|
|
|
|
Haematological end-points |
|
|
|
|
|
|
Mean corpuscular haemoglobin |
|
|
Increase* |
|
|
|
Reticulocyte count |
|
|
Increase* |
Increase |
|
|
Mean corpuscular haemoglobin concentration |
|
|
Increase |
Increase* |
|
|
Monocyte count |
Decrease*b |
|
Decrease*b |
|
|
|
Organ weights |
|
|
|
|
|
|
Liver |
|
|
Increase*c–e |
|
|
|
Spleen |
|
|
|
Increase*c,e |
|
|
Macroscopic appearance |
|
|
|
|
|
|
Microscopic appearance |
|
|
|
|
|
|
Liver |
|
|
|
|
|
|
Haematopoiesis |
|
|
|
|
|
|
Minimal |
1/50 |
2/50 |
6/49 |
|
|
|
Minimal–slight |
|
|
|
2/50 |
|
|
Slight |
|
|
|
|
|
|
Spleen |
|
|
|
|
|
|
Haematopoiesis |
|
|
|
|
Males and females |
|
Minimal |
28/50 |
18/50 |
10/49 |
11/50 |
|
|
Slight |
18/50 |
26/50 |
30/49 |
35/50 |
|
|
Moderate |
4/50 |
6/50 |
9/49 |
3/50 |
|
|
Marked |
|
|
|
1/50 |
|
|
Haemosiderosis |
|
|
|
|
Males and females |
|
Minimal |
|
|
|
|
|
|
Minimal–slight |
27/50 |
27/50 |
35/49 |
47/50 |
|
|
Bone-marrow cellularity |
|
|
|
|
Males and females |
|
Moderate |
35/50 |
13/50 |
6/49 |
14/50 |
|
|
Marked |
15/50 |
37/50 |
43/49 |
36/50 |
|
|
Testis |
|
|
|
|
|
|
Amyloidosis |
3/10 |
|
11/49f |
|
|
|
Neoplastic lesions |
|
|
|
|
|
From Botta (1992); Krohmer (1992a)
* Statistically significant
a
Total number of cases at terminationb
The values are within the expected range; the significance was due to an incidentally elevated control value, which was not considered an effect of treatment.c
Absolute weightd
Relative to terminal body weighte
Relative to brain weightf
Significant at terminationA group of 25 Swiss mice of each sex, 7 weeks old, were fed a diet containing 0 (standard diet) or 0.1% chlorpropham (purity unknown, containing 30–40 ppm of 3-chloroaniline), equivalent to 140 mg/kg bw per day. Two other groups received the standard diet and subcutaneous injections of 1 g/kg bw of chlorpropham in 0.025 ml of methylpyrrolidone or methylpyrrolidone alone, for a total injection volume of 0.04 ml. Injections were given on days 1 and 14 and then at 1.5, 3, 4.5, 6, 10, 14, and 17 months. The surviving animals were killed after 116 weeks, and these and mice that died during the experiment were examined macroscopically; liver, kidney, heart, lungs, spleen, pancreas, adrenals, gastrointestinal tract, urinary bladder, prostate, testes, ovaries, uterus, and the injection site were examined microscopically. Food intake and growth were recorded irregularly. Growth was reduced in female mice given subcutaneous injections. The incidence of solitary lung tumours was slightly elevated in the group given chlorpropham in the diet (15/47 compared with 10/49 in the control group) and in the group treated by subcutaneous injection (13/49 compared with 9/45 in the control group) (van Esch & Kroes, 1972). Owing to its limited design, this study is not appropriate for risk assessment.
Rats
In a 24-month study in rats performed according to GLP and FIFRA Guideline 40 CFR 158.135, reference 83-5 (essentially the same as OECD Guideline no. 453), groups of 60 male and 60 female Sprague-Dawley rats aged 6 weeks (body weight, 180–241 for males, 123–195 g for females) received diets containing chlorpropham (purity, 96.2%) at concentrations providing a dose of 0, 30, 100, 500, or 1000 mg/kg bw daily for 24 months. The substance was melted at 45–47 °C and used as a liquid or allowed to recrystallize, ground to a fine powder, and used as a solid. It was dissolved in corn oil and mixed into the diet. The control diet contained the same amount of corn oil. Fresh diets were prepared weekly during weeks 1–37 and then every 2 weeks from week 38 until the end of the study; samples were analysed for chlorpropham in weeks 1, 2, 3, 4, 17, 30, 38, 40, 44, 56, 70, 82, and 96. Samples for analysis of storage stability were collected 6 days after preparation of the diets in weeks 38, 44, 56, 70, 82, and 96. The Committee considered that as the diet was prepared every 2 weeks from week 37 onwards, the stability over 14 days should also have been demonstrated. Ten animals of each sex per group were killed after 52 weeks. In addition to the guidelines, physical and ophthalmoscopic examinations were performed on all rats before the study and on all animals scheduled for interim and terminal necropsy; general physical assessment including digital palpation was performed weekly; clinical observations were made twice daily; body weights and food consumption were measured once weekly until week 16 and every 2 weeks thereafter.
Owing to an increased mortality rate among females in the control group and at 100 mg/kg bw per day, the females were killed after 102 weeks instead of 104 weeks in order to have sufficient animals for a meaningful evaluation of lifetime data. This early loss was not attributable to treatment, as the group receiving 500 mg/kg bw per day had twice as many female survivors as the control group, and that given 1000 mg/kg bw per day had almost 50% more female survivors than the control group. During week 13, a sialodacryoadenitis virus infection caused a drastic reduction in food consumption. As a consequence, the intake of the substance was reduced to 61–85% of that intended, and the concentrations in the diet were altered during week 14 to compensate for this effect. However, recovery from the infection during week 14 prompted an increase in food consumption and resulted in an increase in intake of 120–180% of that intended. After recovery, the average intake of the test substance was 88–130% of that intended.
After treatment for 12 months, the treatment-related effects in animals at 1000 or 500 mg/kg bw per day were a dose-related decrease in body-weight gain; dark blood; dose-related decreases in haemoglobin concentration, erythrocyte volume fraction (only in females), and red blood cell count; dose-related increases in mean corpuscular haemoglobin, mean corpuscular volume, and reticulocyte count and a decrease in mean corpuscular haemoglobin concentration (in males at 1000 mg/kg bw per day); a dose-related increase in serum cholesterol (in males at 500 mg/kg bw per day and in males and females at 1000 mg/kg bw per day); increased albumin (only at 1000 mg/kg bw per day) and albumin:globulin ratio (in females at 1000 mg/kg bw per day); decreased plasma cholinesterase activity in females at week 52 only (2190, 1384, and 1381 U/L at 0, 500, and 1000 mg/kg bw per day, respectively, i.e. 63% of the control value at both doses); dose-related increases in the absolute and relative weights of the spleen, accompanied by enlargement; increased relative weights of the liver; increased haematopoiesis and haemosiderosis in the spleen, increased haematopoiesis in the liver, increased cellularity in bone marrow, and increased pigmentation of reticuloendothelial cells in liver. At 100 mg/kg bw per day, the changes included dark blood in all animals; dose-related decreases in haemoglobin concentration, erythrocyte volume fraction (only in females), and red blood cell count; dose-related increases in mean corpuscular haemoglobin (only in males) and mean corpuscular volume; a dose-related increase in serum cholesterol concentration (only in males); and increased haematopoiesis and haemosiderosis in the spleen. At 30 mg/kg bw per day, there were no treatment-related changes.
At 24 months, significant decreases in body-weight gain were seen at the three higher doses, and haematological examination revealed dark blood and changes in red blood cell parameters. Increased serum cholesterol concentrations were observed at the two higher doses. Urinary analysis showed increased bilirubin concentrations at the three higher doses. The weights of the liver and spleen were increased at 500 and 1000 mg/kg bw per day, and the spleen was enlarged at these doses. The weights of the thyroid and testes were significantly increased in males at the highest dose. Microscopy showed increased (in number and/or severity) haematopoiesis, haemosiderosis, and congestion in the spleen, increased haematopoiesis in the liver and bone marrow, and increased pigmentation in reticuloendothelial cells of the liver at the three higher doses. Even at 30 mg/kg bw per day, a slight increase in the severity and/or incidence of haematopoiesis and haemosiderosis in the spleen, a slightly increased incidence of haematopoiesis in the liver, and increased severity of bone-marrow cellularity were seen. The lungs of males at 500 mg/kg bw per day and of males and females at 1000 mg/kg bw per day showed an increased incidence of foamy alveolar macrophages. In males at the highest dose, an increased incidence of lenticular degeneration was seen.
Chlorpropham induced a significantly increased incidence of benign interstitial-cell tumours (Leydig-cell tumours) in the testes of rats at the highest dose (9/51 compared with 1/47 in controls). Additionally, increased incidences, which were not statistically significant in individual group analyses, were observed in all other groups which were clearly significant by trend test analysis (as performed by the Meeting). The percentage of Leydig-cell tumours found at the highest dose (9/51; 18%) is clearly greater than the historical control value for this type of tumour in the laboratory (0–4%). Leydig-cell tumours are benign and generally related to a disturbance of the hormonal control mechanism of the testes. It should be recalled that some toxicity was observed in the animals at the highest dose. The LOAEL was 30 mg/kg bw per day on the basis of slight histopathological changes in the spleen, liver, and bone marrow. The results after 24 months are described in Table 15 (Krohmer, 1992b; Botta, 1993a,b). The occurrence of dark blood at 100, 500, and 1000 mg/kg bw suggests methaemoglobinaemia. However, the presence of neither methaemoglobin nor Heinz bodies in blood was investigated in this study.
Table 15. Results of a 24-month study of toxicity and carcinogenicity in rats goven chlorpropham in the diet
|
Effect |
Dose (mg/kg bw per day) |
|||||
|
0 |
30 |
100 |
||||
|
Male |
Female |
Male |
Female |
Male |
Female |
|
|
Deaths |
No treatment-related effect |
|
|
|
|
|
|
Physical condition |
No treatment-related effect |
|
|
|
|
|
|
Ophthalmic end-points |
|
|
|
|
|
|
|
Corneal opacity |
|
|
|
|
|
|
|
Clinical signs |
No treatment-related effect |
|
|
|
|
|
|
Body-weight gain |
|
|
|
|
|
Decreaseb |
|
Food consumption |
No treatment-related effect |
|
|
|
|
|
|
Haematological end-points |
|
|
|
|
|
|
|
Dark-brownish colour |
|
|
|
|
Increasec |
Increasec |
|
Haemoglobin |
|
|
|
|
|
Decrease*c |
|
Erythrocyte volume fraction |
|
|
|
|
|
Decrease*c |
|
Erythrocyte count |
|
|
|
|
Decrease*c |
Decrease*c |
|
Mean corpuscular volume |
|
|
|
|
Increase*c |
Increase*c |
|
Mean corpuscular haemoglobin |
|
|
|
|
Increase*c |
|
|
Mean corpuscular haemoglobin concentration |
|
|
|
|
|
|
|
Reticulocyte count |
|
|
|
|
|
|
|
Clinical chemical end-points |
|
|
|
|
|
|
|
Cholesterol concentration |
|
|
|
|
Increase*c |
|
|
Albumin concentration |
|
|
|
|
|
|
|
Albumin:globulin ratio |
|
|
|
|
|
|
|
Thyroxine concentration |
|
|
|
|
|
|
|
Urinary end-pointsh |
|
|
|
|
|
|
|
Bilirubin concentration at termination |
0/19 |
1/15 |
0/14 |
1/19 |
0/16 |
1/13 |
|
Organ weights |
|
|
|
|
|
|
|
Liver |
|
|
|
|
|
|
|
Left kidney |
|
|
|
|
|
Increase*i |
|
Right kidney |
|
|
|
|
|
Increase*i |
|
Both kidneys |
|
|
|
|
|
Increase*i |
|
Spleen |
|
|
|
|
|
|
|
Thyroid |
|
|
|
|
|
|
|
Testis |
|
|
|
|
|
|
|
Macroscopic appearance |
|
|
|
|
|
|
|
Spleen, enlarged |
|
|
|
|
|
|
|
Microscopic appearancel |
|
|
|
|
|
|
|
Liver |
|
|
|
|
|
|
|
Haematopoiesis |
|
|
|
|
|
|
|
Minimal |
4/50 |
7/50 |
8/50 |
9/50 |
7/50 |
10/50 |
|
Slight |
0/50 |
0/50 |
0/50 |
2/50 |
0/50 |
0/50 |
|
Pigment |
|
|
|
|
|
|
|
Minimal |
0/50 |
3/50 |
0/50 |
0/50 |
1/50 |
7/50 |
|
Slight |
0/50 |
0/50 |
0/50 |
0/50 |
0/50 |
0/50 |
|
Spleen |
|
|
|
|
|
|
|
Haematopoiesis |
|
|
|
|
|
|
|
Minimal |
31/50 |
33/50 |
21/50 |
27/50 |
12/50 |
24/50 |
|
Slight |
11/50 |
11/50 |
11/50 |
13/50 |
24/50 |
12/50 |
|
Moderate |
4/50 |
5/50 |
12/50 |
6/50 |
10/50 |
10/50 |
|
Marked |
1/50 |
1/50 |
6/50 |
4/50 |
4/50 |
4/50 |
|
Haemosiderosis |
|
|
|
|
|
|
|
Minimal |
11/50 |
15/50 |
17/50 |
16/50 |
22/50 |
9/50 |
|
Slight |
0/50 |
9/50 |
2/50 |
18/50 |
12/50 |
21/50 |
|
Moderate |
0/50 |
0/50 |
0/50 |
1/50 |
0/50 |
10/50 |
|
Congestion |
|
|
|
|
|
|
|
Minimal |
3/50 |
0/50 |
0/50 |
0/50 |
9/50 |
0/50 |
|
Slight |
3/50 |
0/50 |
2/50 |
0/50 |
9/50 |
2/50 |
|
Moderate |
0/50 |
0/50 |
0/50 |
0/50 |
0/50 |
0/50 |
|
Marked |
0/50 |
0/50 |
0/50 |
0/50 |
0/50 |
0/50 |
|
Bone-marrow cellularity |
|
|
|
|
|
|
|
Moderate |
30/50 |
40/50 |
26/50 |
36/50 |
24/50 |
25/25 |
|
Marked |
17/50 |
10/50 |
24/50 |
14/50 |
26/50 |
25/50 |
|
Lungs |
|
|
|
|
|
|
|
Focal lymphocytic infiltration |
22/50 |
20/50 |
21/50 |
23/50 |
26/50 |
18/50 |
|
Alveolar macrophages |
9/50 |
5/50 |
9/50 |
9/50 |
6/50 |
6/50 |
|
Kidneys |
|
|
|
|
|
|
|
Mineral deposits |
5/50 |
30/50 |
5/50 |
30/50 |
4/50 |
29/50 |
|
Pigment |
0/50 |
6/50 |
0/50 |
3/50 |
2/50 |
6/50 |
|
Cysts |
7/50 |
0/50 |
10/50 |
0/50 |
2/50 |
0/50 |
|
Chronic nephritis |
43/50 |
35/50 |
44/50 |
34/50 |
47/50 |
28/50 |
|
Eyes |
|
|
|
|
|
|
|
Lenticular degeneration |
0/47 |
0/50 |
1/38 |
1/34 |
0/41 |
2/39 |
|
Neoplasms |
|
|
|
|
|
|
|
Testis |
|
|
|
|
|
|
|
Benign interstitial-cell tumour |
1/47 |
|
4/50 |
|
2/50 |
|
Table 15 (continued)
|
Effect |
Dose (mg/kg bw per day) |
Dose-related effect |
|||
|
500 |
1000 |
||||
|
Male |
Female |
Male |
Female |
||
|
Deaths |
|
|
|
|
|
|
Physical condition |
|
|
|
|
|
|
Ophthalmic end-points |
|
|
|
|
|
|
Corneal opacity |
|
|
Increase* |
|
|
|
Clinical signs |
|
|
|
|
|
|
Body-weight gain |
Decrease*b |
Decrease*b |
Decrease*a |
Decrease*b |
|
|
Food consumption |
|
|
|
|
|
|
Haematological end-points |
|
|
|
|
|
|
Dark-brownish colour |
Increased |
Increased |
Increased |
Increased |
Males and females |
|
Haemoglobin |
Decrease*c |
Decrease*e |
Decrease*c |
Decrease*e |
Males and females |
|
Erythrocyte volume fraction |
|
Decrease*e |
|
Decrease*e |
Females |
|
Erythrocyte count |
Decrease*e |
Decrease*e |
Decrease*d |
Decrease*d |
Males and females |
|
Mean corpuscular volume |
Increase*d |
Increase*e |
Increase*d |
Increase*d |
Males and females |
|
Mean corpuscular haemoglobin |
Increase*d |
Increase*e |
Increase*d |
Increase*d |
Males and females |
|
Mean corpuscular haemoglobin concentration |
Decrease*e |
Decrease*f |
Decrease*d |
Decrease*e |
Males and females |
|
Reticulocyte count |
Increase*e |
Increase*e |
Increase*d |
Increase*d |
Males and females |
|
Clinical chemical end-points |
|
|
|
|
|
|
Cholesterol concentration |
Increase*d |
Increase*f |
Increase*d |
Increase*d |
Males and females |
|
Albumin concentration |
|
Increase*c |
Increase*c |
Increase*c |
|
|
Albumin:globulin ratio |
|
|
Increase*c |
Increase*g |
|
|
Thyroxine concentration |
Decrease*f |
|
Decrease*f |
|
|
|
Urinary end-pointsh |
|
|
|
|
|
|
Bilirubin concentration at termination |
5/15 |
6/29 |
24/27 |
13/22 |
Males and females |
|
Organ weights |
|
|
|
|
|
|
Liver |
|
Increase*i |
Increase*i,j |
Increase*i |
Females |
|
Left kidney |
|
Increase*i |
|
Increase*i |
|
|
Right kidney |
|
Increase*i |
Increase*i |
Increase*i |
|
|
Both kidneys |
|
Increase*i |
|
Increase*i |
|
|
Spleen |
Increase*i–k |
Increase*i–k |
Increase*i–k |
Increase*i–k |
Males and females |
|
Thyroid |
|
|
Increase*i |
|
|
|
Testis |
|
|
Increase*i |
|
|
|
Macroscopic appearance |
|
|
|
|
|
|
Spleen, enlarged |
Yes |
Yes |
Yes |
Yes |
|
|
Microscopic appearancel |
|
|
|
|
|
|
Liver |
|
|
|
|
|
|
Haematopoiesis |
|
|
|
|
Males and females |
|
Minimal |
17/50 |
21/50 |
15/50 |
21/50 |
|
|
Slight |
1/50 |
1/50 |
1/50 |
4/50 |
|
|
Pigment |
|
|
|
|
Males and females |
|
Minimal |
10/50 |
30/50 |
26/50 |
33/50 |
|
|
Slight |
1/50 |
1/50 |
1/50 |
12/50 |
|
|
Spleen |
|
|
|
|
|
|
Haematopoiesis |
|
|
|
|
Males and females |
|
Minimal |
7/5 |
4/50 |
7/50 |
6/50 |
|
|
Slight |
18/50 |
15/50 |
15/50 |
18/50 |
|
|
Moderate |
16/50 |
26/50 |
21/50 |
21/50 |
|
|
Marked |
9/50 |
5/50 |
7/50 |
5/50 |
|
|
Haemosiderosis |
|
|
|
|
Males and females |
|
Minimal |
12/50 |
12/50 |
12/50 |
4/50 |
|
|
Slight |
23/50 |
25/50 |
27/50 |
19/50 |
|
|
Moderate |
4/50 |
12/50 |
5/50 |
24/50 |
|
|
Congestion |
|
|
|
|
Males and females |
|
Minimal |
3/50 |
10/50 |
4/50 |
3/50 |
|
|
Slight |
24/50 |
21/50 |
13/50 |
20/50 |
|
|
Moderate |
7/50 |
5/50 |
26/50 |
15/50 |
|
|
Marked |
0/50 |
0/50 |
4/50 |
0/50 |
|
|
Bone-marrow cellularity |
|
|
|
|
Males and females |
|
Moderate |
15/50 |
5/50 |
6/50 |
6/50 |
|
|
Marked |
35/50 |
45/50 |
44/50 |
44/50 |
|
|
Lungs |
|
|
|
|
|
|
Focal lymphocytic infiltration |
34/50 |
31/50 |
31/50 |
32/50 |
Males and females |
|
Alveolar macrophages |
16/50 |
8/50 |
18/50 |
17/50 |
Males and females |
|
Kidneys |
|
|
|
|
|
|
Mineral deposits |
15/50 |
31/50 |
16/50 |
40/50 |
Males and females |
|
Pigment |
19/50 |
28/50 |
36/50 |
37/50 |
Males and females |
|
Cysts |
12/50 |
6/50 |
21/50 |
7/50 |
Males and females |
|
Chronic nephritis |
47/50 |
39/50 |
48/50 |
45/50 |
|
|
Eyes |
|
|
|
|
|
|
Lenticular degeneration |
1/40 |
0/21 |
5/50 |
1/50 |
|
|
Neoplasms |
|
|
|
|
|
|
Testis |
|
|
|
|
|
|
Benign interstitial-cell tumour |
4/50 |
|
9/51* |
|
|
From Krohmer (1992b) and Botta (1993a,b)
* Statistically significant
a
Significant at termination, not significant during treatment, but reduced by more than 10% from week 94b
Significant during treatment and at terminationc
At two sampling times during treatmentd
At all sampling timese
At week 26 (53) and at terminationf
Only at terminationg
At week 53 onlyh
No. of animals/total no. of animals examinedi
Relative to body weightj
Absolute weightk
Relative to brain weightl
No. of animals/total no. of animals examimed (terminal kills plus decedents from week 52 onwards)The slides from this study were re-evaluated, with specific attention to red blood cell morphology 26, 52, 78, and 104 weeks after the start of the study. Crenated red blood cells and burr cells were observed at various times and in various groups, with no relationship between incidence and dose. These morphological changes may occur as artefacts after storage of blood on slides. A statistically significant increase in the incidence of polychromatophilic cells, which are associated with compensated anaemia due to haemolysis (Botta, 1994), was observed in males and females at the highest dose and occasionally in females at 500 mg/kg bw per day.
Four groups of 25 male and 25 female young albino rats received diets containing chlorpropham (purity and batch unknown) at a concentration of 0, 0.02, 0.2, or 2%, equivalent to 0, 10, 100, or 1000 mg/kg bw, for 2 years. The diets were prepared with equal amounts of corn oil. Growth was recorded weekly, and data on food consumption by all rats over 3-day periods were collected after 1, 3, 6, 12, and 24 months. Haematological parameters (haemoglobin concentration, erythrocyte volume fraction, total and differential white cell counts) were assessed every 3 months in five or 10 rats of each sex at each dose. Pooled urine samples from five rats of each sex at each dose were tested for glucose and protein. Heart, liver, spleen, kidneys, and testes were weighed, and 15 tissues from all rats that died during the study or were killed were examined histologically.
The growth of animals receiving 2% chlorpropham was significantly reduced during the first year for animals of each sex and thereafter only for females. Significantly more male rats at this concentration died during the last 13 weeks of the study. Rats at this dose tended to have somewhat increased food consumption. From the third month of the study, the haemoglobin concentration and erythrocyte volume fraction were decreased in this group, particularly in males. The relative organ weights could not easily be interpreted owing to the small number of survivors at the highest dose, but there was an apparent increase in the weight of the liver and a marked increase in that of the spleen in animals of each sex at 2% in the diet. Histopathological examination showed an unusually high incidence of infectious disease of the respiratory tract. Tumour incidences were not increased. Owing to the limited test design, the study is not appropriate for risk assessment (Larson et al., 1960).
Hamsters
A group of 23 male and 26 female golden hamsters, 6 weeks old, were fed a diet containing 0.2% chlorpropham (purity unknown, containing 30–40 ppm of 3-chloroaniline) for 33 months. A control group of 22 male and 27 female hamsters received a standard diet. The animals were weighed weekly for the first 15 weeks and monthly thereafter. Food intake was not recorded. Macroscopy and microscopy of the liver and kidney and all tissues found to be abnormal at macroscopy were performed on all animals that died during the study and all surviving animals. Special attention was paid to the occurrence of melanotic spots on the skin, and the buccal pouches were examined for the presence of tumours. No changes in tumour incidence were observed. Testicular atrophy was seen in four treated males and in none of the controls. No further details were available (van Esch & Kroes, 1972). Owing to the limited test design and the lack of details, the study is not appropriate for risk assessment.
These studies are summarized in Table 16.
Table 16. Results of tests for the genotoxicity of chlorpropham
|
End-point |
Target cell |
Concentration |
Metabolic activation |
Results |
Reference |
|
|
Without activation |
With activation |
|||||
|
Gene mutation |
S. typhimurium |
1–5 µl/plate as liquid or small crystals |
No |
Negative |
|
Andersen et al. (1972) |
|
Gene mutation |
L5178Y mouse |
25–70 µg/ml |
No |
Negative |
|
Enninga (1989a) |
|
lymphoma cells |
40–90 µg/ml |
Rat liver S9 |
|
Negative |
|
|
|
Chromosomal aberrations |
Chinese hamster ovary cells |
10–160 µg/ml |
No |
Negative |
|
Murli (1991) |
|
10–160 µg/ml |
Rat liver S9 |
|
Weakly positive |
|
||
|
Chromosomal aberrations |
Human lymphocytes |
20–50 µg/ml |
No |
Negative |
|
Enninga (1989b) |
|
200–300 µg/ml |
Rat liver S9 |
|
Negative |
|
||
|
Unscheduled DNA synthesis |
Rat hepatocytes |
0.17–33 µg/ml |
Intrinsic |
|
Negative |
Fautz (1989) |
|
Cell transformation |
Syrian hamster embryo cells |
5–30 µg/ml for 24 h |
Intrinsic |
|
Positive |
Poiley (1991) |
|
40–100 µg/ml for 7 days |
|
|
|
|
||
A test in histidine-requiring mutants of Salmonella typhimurium involving the C, D, and G genes of the histidine operon was performed in the absence of metabolic activation. The incubation time was not reported. Positive control assays were included. Chlorpropham was not mutagenic. The test was not performed according to GLP or any guideline and was judged to be inadequate (Andersen et al., 1972).
A test for gene mutation at the Tk locus in L5178Y mouse lymphoma cells was performed according to OECD Guideline 476 and GLP in the presence and absence of a 9000 x g supernatant (S9) from Aroclor-pretreated male rats. Cells were exposed without metabolic activation for 2 h to 25–70 µg/ml of chlorpropham (purity, 99.5%) in dimethyl sulfoxide (DMSO). No increase in the number of cells with mutations was observed. The cloning efficiency immediately after treatment was slightly decreased at 70 µg/ml. Ethyl methanesulfonate (2 mmol/L) was used as the positive control. Cells were exposed with metabolic activation for 2 h to 40–90 µg/ml of chlorpropham (purity, 99.5%) in DMSO. No increase in the number of cells with mutations was observed. The cloning efficiency immediately after treatment was decreased at 90 µg/ml. N-Nitrosodimethylamine (0.5 mmol/L) was used as the positive control (Enninga, 1989a).
An assay for chromosomal aberrations was performed according to GLP and FIFRA Guideline 84-2 (corresponding to OECD Guideline 473) in Chinese hamster ovary cells with and without metabolic activation with S9 from Aroclor-pretreated male Sprague-Dawley rats. Cell cycle delay was determined in a preliminary study with concentrations of 0.050–1500 µg/ml. In the absence of S9, complete cytotoxicity occurred at doses ³ 150 µg/ml, and severe cell cycle delay was seen at 50 µg/ml. In the presence of S9, complete cytotoxicity occurred at 150 µg/ml and no cell cycle delay was seen. Cells were exposed in the absence of S9 for 10 h to 10, 15, or 20 µg /ml of chlorpropham and for 20 h to 20, 40, 60, 80, 120, or 160 µg/ml. No increase in the number of cells with chromosomal aberrations was observed. Cells were exposed in the presence of S9 to 10, 20, 40, 60, or 80 µg/ml for 2 h and harvested 10 h after the start of exposure; in addition, cells were exposed with S9 to 80, 120, or 160 µg/ml for 2 h and harvested 20 h after the start of exposure. In the 10-h assay, no chromosomal aberrations were induced, but a significant positive effect was seen in one of the two cultures at 120 µg/ml at the 20-h harvest time. In repeat tests with S9, a harvest time of 20 h, and concentrations of 80–140 µg/ml, a significant positive effect was seen in one of two cultures at 140 µg/ml. At 120, 100, and 80 µg/ml, no effects were seen. To investigate the possibility of variable delays in cell cycle time, additional assays were performed with S9, 20-h and 26-h harvest times, and concentrations of 20–120 µg/ml. In the 20-h assay, a significant positive effect was seen at 120 µg/ml in one of two cultures. In the 26-h assay, a significant increase in the number of cells with chromosomal aberrations was observed in both cultures at 120 µg/ml (the only concentration analysed). The significant increases seen with S9 were smaller than the positive control values. The mitotic index was not determined (Murli, 1991).
An assay for chromosomal aberrations was performed according to GLP and OECD 473 with and without metabolic activation with S9 from Aroclor-pretreated male Sprague-Dawley rats. A preliminary test was performed to determine the mitotic index: it was 56% of the control value at the highest dose of 50 µg/ml without S9 and 73% of the control value at the highest dose of 300 µg/ml with S9. Slight precipitation occurred at 250 and 300 µg/ml in the presence of S9. Cells were exposed for 24 h in the absence of S9 to 0, 20, 30, or 50 µg/ml of chlorpropham (purity, 99.5%) in DMSO. No increase in the number of aberrations was observed. Mitomycin C was used as the positive control. Cells were exposed in the absence of S9 for 2 h to 0, 200, 250, or 300 µg/ml in DMSO, then rinsed and incubated for 21–22 h in 5 ml of growth medium. No increase in the frequency of aberrations was observed. Cyclophosphamide was used as the positive control (Enninga, 1989b).
An assay for unscheduled DNA synthesis was performed according to GLP and OECD 482 with rat primary hepatocytes. In a preliminary study with concentrations of 0.05–150 µg/ml, those > 15 µg/ml caused reduced cell numbers and pyknotic nuclei, and concentrations > 50 µg/ml were highly cytotoxic. The test was performed in two independent experiments with an identical procedure, and 2-acetylaminofluorene was used as the positive control. Samples of 100 freshly isolated hepatocytes were exposed to chlorpropham (purity, 98%) in DMSO for 18 h in the presence of [3H]thymidine. The concentrations were 0.17, 0.50, 1.7, 5.0, and 17 µg/ml in the first experiment, and 0.50, 1.7, 5.0, 17, and 33 µg/ml in the second. No increase in nuclear grain count or in net grain count was observed (Fautz, 1989).
An assay for cell transformation in Syrian hamster embryo cells was performed according to GLP and FIFRA Guideline 84-2. Chlorpropham (purity not given) was administered once and, on the basis of preliminary assays for cytotoxicity, the cells were exposed to chlorpropham dissolved in DMSO at 5, 10, 15, 20, 25, or 30 µg/ml continuously or at 40, 50, 60, 70, 85, or 100 µg/ml for 24 h (re-feed regimen). The total incubation time in both tests was 7 days. A significantly increased number of transformants was observed after continuous exposure at 10, 20, 25, or 30 µg/ml, without a dose–response relationship, and after 24-h exposure at 70, 85, or 100 µg/ml (Poiley, 1991).
Several additional in studies of mutagenicity in vitro and in vivo were cited in the review of the Ministry of Agriculture, Fisheries and Food (1993) and are summarized in Table 17.
Table 17. Results of tests for the genotoxicity of chlorpropham cited by the Ministry of Agriculture, Fisheries and Food (1993)
|
End-point |
Target cell |
Concentration |
Metabolic activation |
Results |
Year of referencea |
|
|
Without activation |
With activation |
|||||
|
In vitro |
||||||
|
Gene mutation |
S. typhimurium TA98, TA100, TA1535, TA1537,TA1538 |
£ 5000 µg/plate |
No |
Negative |
|
1982 |
|
Gene mutation |
S. typhimurium TA98, TA100, TA1535, TA1537 |
10–1500 µg/plate |
Yes |
Negative |
Negative |
1978 |
|
Gene mutation |
S. typhimurium BA13 (mutates from L-arabinose sensitivity to L- arabinose resistance) |
0.1–50 µg/plate, incorporation 10–10 000 µg/plate, preincubation |
Yes |
Negative |
Negative |
1988 |
|
Gene mutation |
S. typhimurium TA98, TA100 |
1.0 µmol/plate |
Yes |
Negative |
Negative |
1982 |
|
Gene mutation |
S. typhimurium |
No details |
No details |
Negative |
|
Several authors, date unknown |
|
Gene mutation |
E. coli WP2 hcr |
£ 5000 µg/plate |
No |
Negative |
|
1982 |
|
Gene mutation |
E. coli |
No details |
No details |
Negative |
|
Several authors, date unknown |
|
lambda prophage |
E. coli |
No details |
No details |
Negative |
|
Unknown |
|
Mitotic non-disjunction |
Aspergillus nidulans |
0.2–0.4 mmol/L |
No details |
Inclusion of haploid segregants |
1981 |
|
|
Gene mutation |
S. cerevisiae |
No details |
No details |
Negative |
|
Several authors, date unknown |
|
Gene mutation |
S. cerevisiae |
100 ppm |
No |
Questionable, < 2 x increases at 100 ppm (toxic) |
Unknown |
|
|
Mitotic aneuploidy |
S. cerevisiae |
No details |
No details |
Positive at > 25 µg/ml |
|
Unknown |
|
Gene mutation |
L5178Y mouse lymphoma cells |
2.4–225 µg/ml |
Yes |
Negative without S9 |
Unknown |
|
|
|
|
|
|
Positive with S9 (cytotoxic) |
|
|
|
Chromosomal aberrations |
Epithelial-like rat liver cell line RL1 |
No details |
No details |
Negative |
|
Unknown |
|
Chromosomal aberrations |
Human lymphocytes |
5–40 µg/ml |
No details |
Negative |
|
1984 |
|
Nuclear enlargement |
HeLa and human fibroblasts |
8, 40, and 200 µg/ml |
No details |
Positive |
|
Unknown |
|
Antimitotic activity |
Human lymphocytes |
10–1000 (units not given) |
No details |
Positive |
|
1970 |
|
Antimitotic activity |
Human lymphocytes |
No details |
No details |
Disturbed several components of mitotic figures; abnormal or disorganized tubular structures or disappearance. Disappearance of endoplasmic reticulum; effects correlated with action on DNA and protein synthesis |
1980 |
|
|
Sister chromatid exchange (two tests) |
Chinese hamster ovary cells |
No details |
No details |
Negative |
|
Unknown |
|
Sister chromatid exchange |
Human lymphocytes |
1 and 2 µg/ml |
No details |
Negative |
|
1985 |
|
Unscheduled DNA synthesis |
Human fibroblasts |
0.032–100 µg/ml |
Yes |
Positive with and without S9 |
Unknown |
|
|
Indirect DNA damage (rec assay) |
Bacillus subtilis |
No details |
No details |
Negative |
|
Unknown |
|
Indirect DNA damage (rec assay) |
E. coli |
No details |
No details |
Negative |
|
Unknown |
|
Indirect DNA |
E. coli |
No details |
No details |
Marginally more toxic to repair-deficient strains without activation |
Two authors, dates unknown |
|
|
Indirect DNA damage |
Yeast |
=100 µg/ml |
Yes |
Positive with S9 at 100 µg/ml; toxic at higher concentrations |
Unknown |
|
|
Mitotic crossing-over and indirect DNA damage |
S. cerevisiae |
No details |
Yes |
Negative for mitotic crossing-over; positive for indirect DNA damage |
Unknown |
|
|
Cell transformation |
Baby hamster kidney cells |
No details |
Yes |
Positive with and without S9 (specificity of assay, 21%) |
Unknown |
|
|
Cell transformation |
Baby hamster kidney cells |
0.025–25 µg/ml |
Yes |
Positive with S9; dose-related with decreased survival |
Unknown |
|
|
Integration enhancement (MLV test) |
Mouse kidney cells |
No details |
No details |
Negative |
|
Unknown |
|
In vivo |
||||||
|
Micronucleib |
Mouse |
70–220 mg/kg bw intraperitoneally |
|
Questionable |
Unknown |
|
|
Micronucleib |
Mouse |
35–150 mg/kg bw intraperitoneally |
|
Negative; positive effect at 72-h sampling time cannot be ruled out |
Unknown |
|
|
Sperm-head abnormalities |
Mouse |
50–1000 mg/kg bw for 5 days intraperitoneally |
|
Negative |
|
1980 |
a Complete references not given in the review
b Since chlorpropham was administered intraperitoneally in these two assays, it can be assumed that the compound reached the target cells, although this fact was not mentioned.
In a two-generation (one litter per generation) study of reproductive toxicity, groups of 15 male and 30 female CD rats (Sprague-Dawley-derived, 41 days of age, received diets containing chlorpropham (purity, 98.8%) dissolved in corn oil at a concentration of 0, 1000, 3000, or 10 000 mg/kg (equivalent to 50, 150, and 500 mg/kg bw per day) for 14 weeks before mating and throughout mating, gestation, and lactation. The control diet contained the same amount of corn oil. The study was not performed according to GLP or any guideline, but the protocol did not differ essentially from OECD Guideline 416. A quality assurance declaration was included. F0 animals were killed after they had weaned F1 animals. Groups of 15 male and 30 female F1 weanlings were selected to produce the F2 generation and received chlorpropham in the diet for 18 weeks before mating and throughout mating, gestation, and lactation. F2 animals were killed at weaning. F1 parents remained on treatment and were killed approximately 5 weeks after they had weaned the last F2 litter.
No effects on reproduction or fertility were seen. At the highest dose, F1 and F2 pups had reduced body weight, F2 pups had decreased spleen weights, and F1 pups had a reduced survival rate and a high incidence of dark spleens. The last effect was also observed in the F1 generation at 3000 mg/kg of diet. Microscopic changes were found tissues from F1 parents. The spleens of all animals, including controls, contained brown pigmented granules in reticuloendothelial cells, the severity being greatest at the two higher doses, with a dose–response relationship. Extramedullary haematopoiesis was observed in the spleens of all animals, including controls, and appeared to be most severe at the highest dose. Brown pigmented granules were observed in reticuloendothelial and Kupffer cells of the liver and in the kidneys, the severity again being greatest at the highest dose. Bone-marrow hypercellularity was most prominent with respect to both incidence and severity at the two highest doses. The NOAEL for both developmental toxicity and for parental toxicity was 1000 mg/kg of diet, equivalent to 50 mg/kg bw per day, the latter based on effects on body weight and on the weights of the spleen and liver and microscopic findings in the spleen, liver, kidneys, and bone marrow (see Table 18) (Schroeder, 1983).
Table 18. Results of a two-generation study of reproductive toxicity in rats fed diets containing chlorpropham
|
Effect |
Dose (mg/kg bw per day) |
|||
|
0 |
50 |
|||
|
Male |
Female |
Male |
Female |
|
|
F0 animals |
|
|
|
|
|
Intake of active substance (mg/kg bw) |
|
|
72 |
86 |
|
Deaths |
|
|
No treatment-related effect |
|
|
Physical condition |
|
|
No treatment-related effect |
|
|
Clinical signs |
|
|
No treatment-related effect |
|
|
Body weight |
|
|
|
|
|
Period of growth |
|
|
|
|
|
Period of gestation and lactation |
|
|
|
|
|
Food consumption |
|
|
No treatment-related effect |
|
|
Mating, fertility, and insemination indices |
|
|
No treatment-related effect |
|
|
Gestation and parturition indices |
|
|
No treatment-related effect |
|
|
Macroscopic appearance |
|
|
No treatment-related effect |
|
|
Microscopic appearance: Testis and epididymis |
|
|
No treatment-related effect |
|
|
F1 pups |
|
|
|
|
|
Numbers of live and dead pups |
|
|
No treatment-related effect |
|
|
Litter size |
|
|
No treatment-related effect |
|
|
Sex ratio |
|
|
No treatment-related effect |
|
|
Litter survival indices |
|
|
No treatment-related effect |
|
|
Pup survival indices |
|
|
|
|
|
Clinical signs |
|
|
No treatment-related effect |
|
|
Pup weight |
|
|
|
|
|
Organ weights |
|
|
No treatment-related effect |
|
|
Macroscopic appearance |
|
|
|
|
|
F1 parents |
|
|
|
|
|
Intake of active substance (mg/kg bw) |
|
|
69 |
83 |
|
Intake after weaning (mg/kg bw) |
|
|
44 |
61 |
|
Deaths |
|
|
No treatment-related effect |
|
|
Physical condition |
|
|
No treatment-related effect |
|
|
Clinical signs |
|
|
No treatment-related effect |
|
|
Body weight |
|
|
|
|
|
Period of growth |
|
|
Decrease |
|
|
Period of gestation and lactation |
|
|
|
Decrease |
|
After weaning |
|
|
Decrease |
|
|
Food consumption |
|
|
No treatment-related effect |
|
|
Mating, fertility, and insemination indices |
|
|
No treatment-related effect |
|
|
Gestation and parturition indices |
|
|
No treatment-related effect |
|
|
Cholinesterase activity |
|
|
|
|
|
Plasma |
|
|
No treatment-related effect |
|
|
Brain |
|
|
Increase* |
|
|
Erythrocytes |
|
|
No treatment-related effect |
|
|
Organ weights |
|
|
|
|
|
Liver |
|
|
|
|
|
Spleen |
|
|
|
|
|
Macroscopic appearance |
|
|
No treatment-related effect |
|
|
Microscopic appearance |
|
|
|
|
|
Spleen |
|
|
|
|
|
Brown pigment |
(See text) |
|
|
|
|
Haematopoiesis |
(See text) |
|
|
|
|
Liver |
|
|
|
|
|
Brown pigment |
2/15 |
2/15 |
1/15 |
0/15 |
|
Haematopoiesis |
6/16 |
8/15 |
7/15 |
6/15 |
|
Albuminous degeneration of central lobular hepatocytes |
0/15 |
3/15 |
2/15 |
1/15 |
|
Kidneys: Brown pigment |
1/15 |
1/15 |
3/14 |
1/15 |
|
Bone marrow: Hypercellularity |
4/15 |
5/15 |
6/14 |
4/15 |
|
F2 pups |
|
|
|
|
|
Numbers of live and dead pups |
|
|
No treatment-related effect |
|
|
Litter size |
|
|
No treatment-related effect |
|
|
Sex ratio |
|
|
No treatment-related effect |
|
|
Litter survival indices |
|
|
No treatment-related effect |
|
|
Pup survival indices |
|
|
No treatment-related effect |
|
|
Clinical signs |
|
|
No treatment-related effect |
|
|
Organ weights: Spleen |
|
|
|
|
|
Macroscopic appearance |
|
|
No treatment-related effect |
|
Table 18 (continued)
|
Effect |
Dose (mg/kg bw per day) |
Dose-related effect |
||||
|
150 |
500 |
|
||||
|
Male |
Female |
Male |
Female |
|
||
|
F0 animals |
|
|
|
|
|
|
|
Intake of active substance (mg/kg bw) |
220 |
260 |
720 |
850 |
|
|
|
Deaths |
|
|
|
|
|
|
|
Physical condition |
|
|
|
|
|
|
|
Clinical signs |
|
|
|
|
|
|
|
Body weight |
|
|
|
|
|
|
|
Period of growth |
|
|
Decrease |
Decrease* |
|
|
|
Period of gestation and lactation |
|
|
Decrease*a |
|
|
|
|
Food consumption |
|
|
|
|
|
|
|
Mating, fertility, and insemination indices |
|
|
|
|
|
|
|
Gestation and parturition indices |
|
|
|
|
|
|
|
Macroscopic appearance |
|
|
|
|
|
|
|
Microscopic appearance: Testis and epididymis |
|
|
|
|
|
|
|
F1 pups |
|
|
|
|
|
|
|
Numbers of live and dead pups |
|
|
|
|
|
|
|
Litter size |
|
|
|
|
|
|
|
Sex ratio |
|
|
|
|
|
|
|
Litter survival indices |
|
|
|
|
|
|
|
Pup survival indices |
|
|
Decrease*b |
|
|
|
|
Clinical signs |
|
|
|
|
|
|
|
Pup weight |
|
|
Decrease*c |
|
|
|
|
Organ weights |
|
|
|
|
|
|
|
Macroscopic appearance |
High incidence of dark spleen in unselected pups killed 1 or 2 weeks after weaning |
|
||||
|
F1 parents |
|
|
|
|
|
|
|
Intake of active substance (mg/kg bw) |
210 |
260 |
720 |
840 |
|
|
|
Intake after weaning (mg/kg bw) |
130 |
190 |
470 |
640 |
|
|
|
Deaths |
|
|
|
|
|
|
|
Physical condition |
|
|
|
|
|
|
|
Clinical signs |
|
|
|
|
|
|
|
Body weight |
|
|
|
|
|
|
|
Period of growth |
Decrease* |
Decrease* |
Decrease* |
Decrease* |
Males and females |
|
|
Period of gestation and lactation |
|
Decrease*a |
|
Decrease*a |
Females |
|
|
After weaning |
Decrease* |
Decrease* |
Decrease* |
Decrease* |
Males and females |
|
|
Food consumption |
|
|
|
|
|
|
|
Mating, fertility, and insemination indices |
|
|
|
|
|
|
|
Gestation and parturition indices |
|
|
|
|
|
|
|
Cholinesterase activity |
|
|
|
|
|
|
|
Plasma |
|
|
|
|
|
|
|
Brain |
Increase* |
|
Increase* |
|
|
|
|
Erythrocytes |
|
|
|
|
|
|
|
Organ weights |
|
|
|
|
|
|
|
Liver |
|
Increase*d |
|
Increase*d |
Females |
|
|
Spleen |
|
Increase*,d–f |
Increase*,d–f |
Increase*,d–f |
Females |
|
|
Macroscopic appearance |
|
|
|
|
|
|
|
Microscopic appearance |
|
|
|
|
|
|
|
Spleen |
|
|
|
|
|
|
|
Brown pigment |
|
|
|
|
Males and females |
|
|
Haematopoiesis |
|
|
|
|
Males and females |
|
|
Liver |
|
|
|
|
|
|
|
Brown pigment |
7/14 |
13/15 |
15/15 |
15/15 |
Males and females |
|
|
Haematopoiesis |
4/14 |
14/15 |
4/14 |
11/15 |
Females |
|
|
Albuminous degeneration of central |
6/15 |
4/15 |
6/15 |
7/15 |
Males and females |
|
|
|
|
|
|
|
|
|
|
Kidneys: Brown pigment |
8/15 |
6/15 |
12/15 |
9/14 |
Males and females |
|
|
Bone marrow: Hypercellularity |
11/14 |
8/15 |
13/13 |
13/15 |
Males and females |
|
|
F2 pups |
|
|
|
|
|
|
|
Numbers of live and dead pups |
|
|
|
|
|
|
|
Litter size |
|
|
|
|
|
|
|
Sex ratio |
|
|
|
|
|
|
|
Litter survival indices |
|
|
|
|
|
|
|
Pup survival indices |
|
|
|
|
|
|
|
Clinical signs |
|
|
|
|
|
|
|
Organ weights: Spleen |
|
|
Decrease*,d–f |
Decreased–f |
|
|
|
Macroscopic appearance |
|
|
|
|
|
|
From Schroeder (1983)
a
Body weight was significantly lower than that of controls during gestation and lactation; body-weight gain was also significantly lower than that of controls during gestation but significantly higher than that of controls during lactation.b
Significant decrease in survival of F1 pups during days 4–21c
Normal on days 0 and 4, slightly lower on day 14, and significantly lower on day 21; not determined on day 7d
Relative to body weighte
Absolute weightf
Relative to brain weightg
Normal on days 0 and 4, significantly lower on days 14 and 21; not determined on day 7Rats
A study of developmental toxicity in rats was performed according to GLP and OECD 414. Groups of 25 mated female Wistar/HAN rats received chlorpropham (purity, 99.3%) orally by gavage at a dose of 0, 50, 200, or 800 mg/kg bw daily on days 6–15 of gestation. On day 21, the dams were killed and the fetuses removed. Chlorpropham was dissolved in dichloromethane and acetonitrile to make solutions of 10–50 µg/ml, and these were mixed with corn oil daily before administration; the controls received corn oil alone. Reduced body-weight gain and food consumption were seen at 800 mg/kg bw per day; the reduced body weight seen at 200 mg/kg bw per day was only marginal and therefore considered not toxicologically relevant. At 800 mg/kg bw, reduced fetal body weights and retarded ossification were seen. There was no indication of irreversible structural effects at any dose. The results of this study are shown in Table 19. The NOAEL for maternal toxiciy was 200 mg/kg bw per day on the basis of significantly reduced body-weight gain and food consumption at 800 mg/kg bw per day. The NOAEL for embryotoxicity was 200 mg/kg bw per day (Becker & Biedermann, 1990a,b).
Table 19. Results of a study of developmental toxicity in rats given chlorpropham by gavage
|
Effect |
Dose (mg/kg bw per day) |
Dose-related effect |
|||
|
0 |
50 |
200 |
800 |
||
|
Maternal toxicity |
|
|
|
|
|
|
Deaths |
|
None |
|
|
|
|
Clinical signs |
|
|
|
|
|
|
Ventral recumbencya |
|
|
|
25/25 |
|
|
Body-weight gain |
|
|
Decrease |
Decrease*b |
|
|
Food consumption |
|
|
Decrease |
Decrease* |
|
|
Macroscopic appearance |
|
|
|
|
|
|
Enlarged spleen |
|
|
|
1/25 |
|
|
Number of corpora lutea |
|
No treatment-related effect |
|
|
|
|
Number of implantations |
|
No treatment-related effect |
|
|
|
|
Litter effects |
|
|
|
|
|
|
Implantation loss |
|
No treatment-related effect |
|
|
|
|
Number of live fetuses |
|
No treatment-related effect |
|
|
|
|
Sex ratio |
45/55 |
54/46 |
46/54 |
57/43 |
|
|
Number of litters |
|
|
|
Decrease* |
|
|
Fetal weight |
|
|
|
Decrease* |
|
|
External examinations |
|
|
|
|
|
|
Micrognathia (inferior) |
|
|
1/271 |
1/289 |
|
|
Visceral examination |
|
|
|
|
|
|
Micrognathia |
|
|
|
1/139 |
|
|
Skeletal examination |
|
|
|
|
|
|
Slightly retarded ossificationc |
|
|
|
Increase* |
|
|
One supernumary rib |
|
Increase |
|
Increase |
|
From Becker & Biedermann (1990a,b)
* Statistically significant
a
Usually associated with ruffled furb
Significant on day 17 after conceptionc
Included cervical vertebra, sternebra, left and right digit and toe proximal phalanx, right metatarsaliaRabbits
Groups of 16 pregnant New Zealand white rabbits received technical-grade chlorpropham suspended at a concentration of 2.1, 4.2, or 8.3% in water containing 1% methylcellulose, equivalent to 125, 250, and 500 mg/kg bw per day. The suspensions were made on the first day of dosing and weekly thereafter. The suspensions were stirred and then administered to the rabbits by gavage at 6 ml/kg bw, to provide a dose of 125, 250, or 500 mg/kg bw per day, on days 6–18 of gestation. A control group received water containing 1% methylcellulose. The dams were killed on day 29 of gestation. No test method was cited and compliance with GLP was not reported, but the protocol resembled OECD 414. The number of corpora lutea was not reported, and summary tables of macroscopic observations and skeletal and visceral malformations were not provided.
Anorexia, decreased food consumption, and decreased faecal output were seen at 500 mg/kg bw per day, resulting in a NOAEL for maternal toxicity of 250 mg/kg bw per day. A dose-related increase in the frequency of postimplantation loss was seen at 250 and 500 mg/kg bw per day. No irreversible structural effects were observed at any dose. As the slight increase seen at 125 mg/kg bw per day was considered not biologically relevant, the NOAEL for embryotoxicity was 125 mg/kg bw per day. The results of this study are shown in Table 20 (James et al., 1983).
Table 20. Results of a study of developmental toxicity in rabbits given chlorpropham by gavage
|
Effect |
Dose (mg/kg bw per day) |
Dose-related effect |
|||
|
0 |
125 |
250 |
500 |
||
|
Maternal toxicity |
|
|
|
|
|
|
Deaths |
|
2/18a |
|
|
|
|
Clinical signs |
|
|
|
|
|
|
Cold earsb |
|
|
Increase |
Increase |
|
|
Slight anorexia |
|
|
|
Increase |
|
|
Faecal output |
|
|
|
Decrease |
|
|
Abortionc |
|
|
|
2/16 |
|
|
Body-weight gain |
|
Decrease |
Decrease |
Decrease |
|
|
Food consumption |
|
|
|
Decrease |
|
|
Pregnancy rate (%) |
88 |
100 |
88 |
100 |
|
|
Litter effects |
|
|
|
|
|
|
Intrauterine deaths |
0.7 |
0.9 |
0.8 |
1.8*d |
|
|
Post-implantation loss (%) |
7.2 |
9.1 |
15 |
19*d |
Yes |
|
Fetal weight |
|
No treatment-related effect |
|
|
|
|
Sex ratio |
|
No treatment-related effect |
|
|
|
|
Visceral abnormalities |
|
No treatment-related effect |
|
|
|
|
Skeletal effects |
|
No treatment-related effect |
|
|
|
From James et al. (1983)
* Statistically significant
a
Killed because of an apparent uterine infectionb
At 500 mg/kg bw per day, most animals had cold ears; at 250 mg/kg bw per day, a slight increase in incidence was seenc
On days 24 and 25d
14 animals per groupA study of developmental toxicity in rabbits was performed according to GLP and OECD Guideline No. 414. Groups of 16 pregnant New Zealand white rabbits received technical-grade chlorpropham (purity, 98.6%) by gavage at a dose of 125, 250, or 500 mg/kg bw per day as a suspension in 1% methylcellulose in water, at a constant dose volume per kilogram of body weight, i.e. 5 ml/kg bw. The doses were based on a preliminary study of toxicity. The animals were treated on days 6–18 of gestation and were killed on day 29. Owing to difficulties in taking representative samples from the chlorpropham suspension, the content measured in the first batch differed from the intended concentration by –45% for the low dose and by –21% for the intermediate dose, and the content of the second batch differed by –21% for the low dose, 7% for the intermediate dose, and 12% for the high dose.
The results of this study are shown in Table 21. At necropsy of animals at 250 and 500 mg/kg bw per day that died during the study, haemorrhage was observed in the lungs and red mucosa in the trachea and/or larynx. These findings may have been related to the gavage administration. Increased mortality rates were seen at 250 and 500 mg/kg bw per day, decreased body-weight gain and food consumption at 500 mg/kg bw per day, and increased spleen weights at 500 mg/kg bw per day. The NOAEL for maternal toxicity was 125 mg/kg bw per day. No statistically significant differences were found between controls and treated groups in the numbers of corpora lutea, implantations, live and dead fetuses, early and late resorptions and pre- and postimplantation losses. A slight decrease in fetal weight at 125 and 250 mg/kg bw per day appeared to be related to the larger number of fetuses per litter (7.7 and 8.2 at 125 and 250 mg/kg bw per day, respectively, and 6.2 in the control group; at 500 mg/kg bw, the number of fetuses per litter was 6.8). The statistically nonsignificant decrease in fetal weight at 500 mg/kg bw per day might be related to the slightly larger number of fetuses per litter in this group and the decrease in maternal body-weight gain. Effects seen on ossification of the fetuses at 125 and 250 mg/kg bw per day were considered to be related not to treatment but to the larger number of fetuses with reduced body weight. The slightly retarded ossification at 500 mg/kg bw per day was possibly related to the decreased maternal body-weight gain. No irreversible structural effects were observed in the pups at any dose. The NOAEL for developmental toxicity was 250 mg/kg bw per day on the basis of the nonsignificant decrease in fetal weight and slightly retarded ossification in the presence of maternal toxicity (Waalkens-Berendsen, 1998a,b).
Table 21. Results of a study of developmental toxicity in rabbits given chlorpropham by gavage
|
Effect |
Dose (mg/kg bw per day) |
Dose-related effect |
|||
|
0 |
125 |
250 |
500 |
||
|
Maternal toxicity |
|
|
|
|
|
|
Deaths |
|
0/16 |
0/16 |
3/16a |
2/16a |
|
Pregnancy rate |
13/16 |
14/16 |
11/13 |
14/16 |
|
|
Behaviour |
|
No treatment-related effect |
|
|
|
|
Clinical signs |
|
No treatment-related effect |
|
|
|
|
Body-weight gain |
|
|
|
Decrease*b |
|
|
Food consumption |
|
|
|
Decrease*c |
|
|
Corpora lutea per animal |
|
No treatment-related effect |
|
|
|
|
Organ weights |
|
|
|
|
|
|
Spleen |
|
|
|
Increased,e |
|
|
Macroscopic appearance |
|
|
|
|
|
|
Dark spleen |
6/16 |
5/16 |
5/16 |
9/19 |
|
|
Litter effects |
|
|
|
|
|
|
Number of corpora lutea |
|
No treatment-related effect |
|
|
|
|
Implantations per animal |
|
No treatment-related effect |
|
|
|
|
Preimplantation loss |
|
No treatment-related effect |
|
|
|
|
Postimplantation loss |
|
No treatment-related effect |
|
|
|
|
Early resorptions per animal |
|
No treatment-related effect |
|
|
|
|
Late resorptions per animal |
|
No treatment-related effect |
|
|
|
|
Intrauterine deaths |
|
No treatment-related effect |
|
|
|
|
Number of fetuses per litter |
6.2 |
7.7 |
8.2 |
6.8 |
|
|
Number of live fetuses per animal |
|
No treatment-related effect |
|
|
|
|
Number of dead fetuses per animal |
|
No treatment-related effect |
|
|
|
|
Sex ratio |
|
No treatment-related effect |
|
|
|
|
Fetal weight |
|
Decreasef |
Decreasef |
Decreaseg |
|
|
External abnormalities |
|
No treatment-related effect |
|
|
|
|
Visceral abnormalities |
|
No treatment-related effect |
|
|
|
|
Skeletal effects |
|
|
|
|
|
|
Retarded ossification |
|
Increaseh |
Increaseh |
Increasei |
|
From Waalkens-Berendsen (1998a,b)
a
Found dead shortly after dosing on days 8 and 9 with no remarkable finding before last doseb
Between days 6 and 12 of gestationc
Between days 6 and 18 of gestationd
Absolute weighte
Relative to body weightf
Slight decrease in weight appeared to be related not to treatment but to the larger number of fetuses per litterg
Might be related to slightly larger number of fetuses per litter and decrease in body-weight gain of damsh
Considered to be unrelated to treatment but related to greater number of fetuses with a lower body weighti
Possibly related to decreased maternal body-weight gainAfter oral administration to rats, [14C-ring]chlorpropham was rapidly and extensively absorbed from the gastrointestinal tract. Excretion in urine represented 82–92% of the administered dose within 24 h, and 3–5% of the dose was excreted in the faeces during this time. After oral or intraperitoneal administration of [14C-side-chain]chlorpropham to rats, about 50% of the dose was excreted in urine within 72 h and the majority within 24 h. Faecal excretion represented about 5% of the dose, and 20–35% was eliminated as 14carbon dioxide over 72 h.
The metabolism of chlorpropham in rats, lactating goats, and laying hens is qualitatively similar. Many metabolites have been identified, the main biotransformation pathways being aromatic 4’-hydroxylation, oxidation of the isopropyl side-chain, and carbamate hydrolysis, followed by rearrangement to chloroaniline and conjugation of many of the subsequent products with sulfate or glucuronic acid. In rats, the principal metabolites are the aryl O-sulfate conjugates and para-hydroxychlorpropham, the major free metabolite in urine and faeces.
The extensive (about 40%) biliary excretion found after intravenous administration to rats and the low faecal elimination observed after oral dosing indicate that the metabolites excreted in bile are almost completely reabsorbed. After absorption, chlorpropham is rapidly distributed to all tissues, including the brain; maximum levels in tissues are reached within 2 h after dosing and decline rapidly thereafter, with half-times of 3–11 h for radiolabelled material in tissues including blood, fat, and brain. Studies with radiolabelled compound showed minimal tissue accumulation (£ 0.05 mg/kg) after single or repeated (15 days) oral doses of 5 mg/kg bw. After a single intravenous dose of 5 mg/kg bw, no residues were detected in tissues. After oral administration to pregnant rats, radiolabelled material was readily transferred from the dams to fetuses and, after parturition, from the dams to offspring via the milk.
In goats, rapid absorption and excretion were observed, excretion occurring mainly in urine. Small amounts of radiolabel were excreted in the faeces. Transfer of residues into milk (< 0.5 mg/kg) and hepatic retention (< 0.5 mg/kg) represented only about 1% of the dose, and the amount accumulated in fat and muscle (< 0.03 mg/kg) was one to two orders of magnitude lower. In laying hens, only 0.03% of the administered radiolabel was found in the total egg production (maximum residue, 0.074 mg/kg in egg white and 0.23 mg/kg in egg yolk). Little residual radioactivity was found in tissues and organs: < 0.5 mg/kg in liver, kidneys, fat, and skin; 0.015 mg/kg in thigh muscle; and 0.006 mg/kg in breast muscle.
Chlorpropham has low acute toxicity: the oral LD50 in rats was > 2000–4200 mg/kg bw, and the dermal LD50 in both rats and rabbits was > 2000 mg/kg bw. Chlorpropham is also only weakly toxic after inhalation; concentrations in air greater than 470 mg/m3 could not be attained, and no deaths were observed at this concentration. Chlorpropham was not irritating to the eye or skin of rabbits. It did not sensitize the skin of guinea-pigs in a Bühler test, an open epicutaneous test, or a Magnusson Kligman test. Although chlorpropham did sensitize the skin of 30% of the guinea-pigs tested in a split adjuvant test, the Meeting concluded that chlorpropham is unlikely to cause sensitization in humans. WHO (1999) has classified chlorpropham as unlikely to present an acute hazard in normal use.
In short-, medium-, and long-term studies of the effects of chlorpropham in mice, rats, and dogs, the haematopoietic system was the main toxicological target, with changes in the morphology and parameters of erythrocytes, including increased methaemoglobin, and changes in the spleen and liver consistent with a haemolytic effect. Damage to erythrocytes was observed at doses of 47 mg/kg bw per day and above in rats. In dogs given diets containing chlorpropham for 28 days or by capsule for 90 days, effects were also seen on the thyroid gland at doses similar to or lower than those that affected the erythrocytes. The LOAEL was 190 mg/kg bw per day in mice (one study), and the NOAEL was 210 mg/kg bw per day in one study in mice, 10 mg/kg bw per day in two studies in rats, and 25 mg/kg bw per day in mice and rats fed chlorpropham in the diet and in dogs treated by capsule for 3 months.
In a long-term study of toxicity in mice, the haematopoietic system was again the main toxicological target, with increased haematopoiesis and haemosiderosis in the spleen, increased hepatic haematopoiesis, and increased bone-marrow cellularity. The NOAEL was 100 mg/kg bw per day. Rats showed effects similar to those observed in mice, with the addition of decreased body-weight gain, an increased urinary concentration of bilirubin, and pigmentation of the reticuloendothelial cells of the liver. The lowest dose, 30 mg/kg bw per day, was the LOAEL. In dogs given chlorpropham by capsule for 60 days, the NOAEL was 5 mg/kg bw per day on the basis of effects on the thyroid gland, including increased weight, decreased concentrations of thyroxine (in a test for stimulation by thyroid-stimulating hormone), and, occasionally, decreased concentrations of tri-iodothyronine. Although changes in erythrocyte parameters were observed at higher doses, accompanied by increased liver weights, they were not as marked as in mice and rats; however, it should be noted that methaemoglobin and Heinz bodies were not measured in this study.
Dermal exposure of rabbits to chlorpropham for 21 days caused skin irritation and microscopic dermal changes at the lowest dose tested (100 mg/kg bw per day). After systemic absorption, the haematopoietic system was again the main toxicological target, with an increased number of reticulocytes. The NOAEL for systemic effects was 100 mg/kg bw per day.
Chlorpropham was not carcinogenic in mice treated in the diet at doses up to 1000 mg/kg bw per day. It caused a significant increase in the incidence of benign Leydig-cell tumours in a study in rats at a dietary dose of 1000 mg/kg bw per day, the highest dose tested. On the basis of current information, benign Leydig-cell tumours are considered to arise in rats by an indirect, non-genotoxic mechanism involving disturbance of the hormonal control mechanism of the testis. This hypothesis remains to be confirmed in an appropriately designed study.
Chlorpropham was not genotoxic in a number of tests for mutagenicity in bacterial and mammalian cells and for cytogenicity in vitro and in vivo. Nevertheless, weak or equivocally positive results were obtained in some tests in vitro, including two for cell transformation, one for unscheduled DNA synthesis, and one for chromosomal aberrations. The Meeting concluded that, although chlorpropham may be weakly genotoxic in vitro, it is unlikely to present a human risk. This conclusion should be validated in adequate studies in vivo. On the basis of the available information, the Meeting concluded that the probability that chlorpropham has carcinogenic potential in humans is remote.
The reproductive toxicity of chlorpropham in rats was investigated in a two-generation study. The NOAEL for maternal toxicity was 1000 ppm, equivalent to 50 mg/kg bw per day, on the basis of effects on the haematopoietic system similar to those observed in other short-term studies. No reproductive toxicity was observed at 10 000 ppm, the highest dose tested, although some developmental toxicity was seen at this dose. In F1 pups, but not in F2 pups, dark spleens were observed at a dose of 3000 ppm, indicating developmental toxicity. The NOAEL for developmental toxicity was therefore 1000 ppm, equivalent to 50 mg/kg bw per day.
The developmental toxicity of chlorpropham was studied in rats and rabbits. In rats, the NOAEL for maternal toxicity was 200 mg/kg bw per day on the basis of reduced body-weight gain and food consumption at higher doses. Chlorpropham was embryotoxic only at maternally toxic doses, with a NOAEL of 200 mg/kg bw per day. It was not teratogenic, the NOAEL being 800 mg/kg bw per day, the highest dose tested. In a study in rabbits, signs of maternal toxicity (anorexia, decreased food consumption, and decreased faecal output) were seen at 500 mg/kg bw per day, resulting in a NOAEL of 250 mg/kg bw per day. The NOAEL for embryotoxicity was 125 mg/kg bw per day, on the basis of post-implantation loss at higher doses. Chlorpropham was not teratogenic, the NOAEL being 500 mg/kg bw per day, the highest dose tested. In a second study in rabbits, signs of maternal toxicity (equivocal increase in mortality rate, decreased body-weight gain and food consumption, and increased spleen weights) were evident at 250 and 500 mg/kg bw per day, resulting in a NOAEL of 125 mg/kg per day. Chlorpropham was embryotoxic only at maternally toxic doses, with a NOAEL of 250 mg/kg bw per day. It was not teratogenic, the NOAEL for this effect being 500 mg/kg bw per day, the highest dose tested.
The lowest NOAEL for the effects of chlorpropham on erythrocytes, methaemoglobinaemia, and Heinz body formation was found in Wistar rats treated orally for 90 days. As methaemo-globinaemia is known to be a transient effect, and adaptation occurs after some time, it would have been more appropriate to measure methaemoglobin earlier in the study, rather than after 90 days.
The Meeting concluded that the existing database was adequate to characterize the potential hazard of chlorpropham to fetuses, infants, and children.
The Meeting established an ADI of 0–0.03 mg/kg bw, on the basis of a NOAEL of 10 mg/kg bw per day in the 90-day study of toxicity in Wistar rats and a safety factor of 300. This value includes an additional safety factor of 3 to account for inadequacies in the assessment of methaemoglobinaemia, the critical toxicological effect. The ADI also provides an adequate margin of safety for the effects on the thyroid observed in dogs (NOAEL, 5 mg/kg bw per day).
The Meeting established an acute RfD of 0.03 mg/kg bw, on the basis of a NOAEL of 10 mg/kg bw per day in the 90-day study of toxicity in Wistar rats and a safety factor of 300. This value includes an additional safety factor of 3 to take account of inadequacies in the assessment of methaemoglobinaemia, the critical toxicological effect.
Levels relevant for risk assessment
|
Species |
Study |
Effect |
NOAEL |
LOAEL |
|
Mouse |
90-day study of toxicity a |
Toxicity |
– |
190 mg/kg bw per day |
|
78-week study of toxicity and carcinogenicity a |
Toxicity |
100 mg/kg bw per day |
500 mg/kg bw per day |
|
|
Carcinogenicity |
1000 mg/kg bw per dayb |
– |
||
|
Rat |
90-day study of toxicity a |
Toxicity |
10 mg/kg bw per day |
47 mg/kg bw per day |
|
24-month study of toxicity |
Toxicity and carcinogenicitya |
– |
30 mg/kg bw per day |
|
|
Carcinogenicity |
500 mg/kg bw per day |
1000 mg/kg bw per day |
||
|
Two-generation study of reproductive toxicitya |
Parental and pup toxicity |
1000 ppm, equivalent to |
3000 ppm, equivalent to |
|
|
50 mg/kg bw per day |
150 mg/kg bw per day |
|||
|
Reproductive toxicity |
10 000 ppm, equivalent to 500 mg/kg bw per dayb |
– |
||
|
Developmental toxicityc |
Maternal and fetal toxicity |
200 mg/kg bw per day |
800 mg/kg bw per day |
|
|
Embryotoxicity |
200 mg/kg bw per day |
800 mg/kg bw per day |
||
|
Rabbit |
Developmental toxicityc |
Maternal toxicity |
250 mg/kg bw per day |
500 mg/kg bw per day |
|
Embryotoxicity |
125 mg/kg bw per day |
250 mg/kg bw per day |
||
|
Developmental toxicityc |
Maternal toxicity |
125 mg/kg bw per day |
250 mg/kg bw per day |
|
|
Embryo- and fetotoxicity |
250 mg/kg bw per day |
500 mg/kg bw per day |
||
|
Dog |
90-day study of toxicityd |
Toxicity |
25 mg/kg bw per day |
125 mg/kg bw per day |
|
60-week study of toxicityd |
Toxicity |
5 mg/kg bw per day |
50 mg/kg bw per day |
a Dietary administration
b Highest dose tested
c Gavage
d Capsule
Estimate of acceptable daily intake for humans
0–0.03 mg/kg bw
Estimate of acute reference dose
0.03 mg/kg bw
Studies that would provide information useful for continued evaluation of the compound:
• Time course of methaemoglobinaemia in rats
• Mechanism of benign Leydig-cell tumour development
• Genotoxicity in vivo
• Observations in humans
Summary of critical end-points
|
Absorption, distribution, excretion and metabolism in mammals |
|
|
Rate and extent of absorption |
Rapid and extensive (~100%), rats |
|
Dermal absorption |
No data (rabbit; systemic toxicity at ³ 520 mg/kg bw per day) |
|
Distribution |
Low concentrations of residues; highest in blood, liver, and spleen, rat |
|
Potential for accumulation |
None |
|
Rate and extent of excretion |
Rapid, 85–97% within 24 h, primarily in urine; 3–5% in faeces, rat |
|
Metabolism in animals |
Extensive, only 0.3% recovered unchanged in urine and faeces; numerous metabolites: main pathways are aromatic 4’-hydroxylation, isopropyl side-chain oxidation, and carbamate hydrolysis followed by rearrangement to 3-chloroaniline and then conjugation |
|
Toxicologically significant compounds |
Chlorpropham and chloroaniline |
|
Acute toxicity |
|
|
LD50, oral |
4200 mg/kg bw, rat |
|
LD50, dermal |
> 2000 mg/kg bw, rat |
|
LC50, inhalation |
> 476 mg/m3, rat |
|
Dermal irritation |
Not irritating, rabbit |
|
Ocular irritation |
Not irritating, rabbit |
|
Dermal sensitization |
Not sensitizing, guinea-pig |
|
Short-term toxicity |
|
|
Target/critical effect |
Mice, rats, dogs: erythrocyte damage, methaemoglobinaemia in erythrocytes, liver, spleen, and bone marrow; thyroid dysfunction (dogs) |
|
Lowest relevant oral NOAEL |
90-day, rat, 10 mg/kg bw per day (diet) |
|
|
60-week, dog, 5 mg/kg bw per day (diet)V |
|
Lowest relevant dermal NOAEL |
21-day, rabbit, 104 mg/kg bw per day |
|
Long-term toxicity and carcinogenicity |
|
|
Target/critical effect |
Mice, rats, dogs: erythrocyte damage, methaemoglobinaemia in erythrocytes, liver, spleen, bone marrow; thyroid dysfunction (dogs) |
|
Lowest relevant NOAEL |
2-year, rat, LOAEL 30 mg/kg bw (diet) |
|
Carcinogenicity |
Not carcinogenic, mouse. |
|
|
Benign Leydig-cell tumours, rat |
|
Genotoxicity |
Weak or equivocal evidence in vitro |
|
|
Not genotoxic in limited studies in vivo |
|
Reproductive toxicity |
|
|
Reproduction target/critical effect |
None, rat |
|
Lowest relevant reproductive NOAEL |
500 mg/kg bw per day, highest dose tested, rat |
|
Developmental target/critical effect |
Post-implantation loss, rabbit; slightly retarded ossification (in the presence of maternal toxicity), rabbit |
|
Lowest relevant developmental NOAEL |
125 mg/kg bw per day, rabbit |
|
Neurotoxicity / Delayed neurotoxicity |
|
|
Neurotoxicity |
No evidence |
|
Other toxicological studies |
None |
|
Medical data |
None |
|
Summary |
Value |
Study |
Safety factor |
|
ADI |
0–0.03 mg/kg bw |
90-day, rat, toxicity |
300 |
|
Acute RfD |
0.03 mg/kg bw |
90-day, rat, toxicity |
300 |
Andersen, K.J., Leighty, E.G. & Takahashi, M.T. (1972) Evaluation of herbicides for possible mutagenic properties. J. Agric. Food Chem., 20, 649–656 (dossier no. 5.4.1/01; no GLP).
Becker, H. & Biedermann, K. (1990a) Dose-range-finding embryotoxicity study (including teratogenicity) with chlorpropham in the rat. Conducted by Luxan B.V., file No. TO90/044, May 1990 (dossier no. 5.6.2/01; GLP). Submitted to WHO by Luxan B.V.
Becker, H. & Biedermann, K. (1990b) Embryotoxicity study (including teratogenicity) with chlorpropham in the rat. Conducted by Luxan B.V., file No. TO90/045 (parts I and II), October 1990 (dossier no. 5.6.2/02; GLP).
Bobik, A., Holder, G.M. & Ryan, A.J. (1972) Excretory and metabolic studies of isopropyl N-(3-chlorophenyl) carbamate in the rat. Food Cosmet. Toxicol., 10, 163–170 (dossier no. 5.1/02; no GLP).
Botta, J.A. (1992) 18-month oncogenicity evaluation of chlorpropham in the mouse. Conducted by T.P.S., Inc., October 1992. Submitted to WHO by the Chlorpropham Task Force (dossier no. 5.5/04; GLP).
Botta, J.A. (1993a) 24 month combined oncogenicity/toxicity evaluation of chlorpropham in rats. Conducted by T.P.S., Inc., April 1993. Submitted to WHO by the Chlorpropham Task Force (dossier no. 5.5/05; GLP).
Botta, J.A. (1993b) 24 month combined oncogenicity/toxicity evaluation of chlorpropham in rats: amendment for MRID No. 42754701 (Laboratory project: 393L-103-055-89).
Botta, J.A. (1994) 24 month combined oncogenicity/toxicity evaluation of chlorpropham in rats: supplemental data for MRID No. 42754701 (Laboratory project: 393L-103-055-89).
Debets, F.M.H. (1985) Evaluation of the acute inhalation toxicity of chlorpropham in the rat. Conducted by Luxan B.V., October 1985, file No. TO-138. Submitted to WHO by Luxan B.V. (dossier no. 5.2.3/01; GLP).
Dickhaus, S. & Heisler, E. (1989) [Open epicutaneous sensitiyation test with guinea-pigs with CIPC-techn., according to the Bühler method] (in German). Conducted by Luxan B.V., November 1989m file No. TO-143. Submitted to WHO by Luxan B.V. (dossier no. 5.2.6/02; GLP).
Enninga, I.C. (1989a) Evaluation of the mutagenic activity of chlorpropham in an in vitro mammalian cell gene mutation test with L5178Y mouse lymphoma cells (with independent repeat). Conducted by Luxan B.V., July 1989, file No. TO-151. Submitted to WHO by Luxan B.V. (dossier no. 5.4.1/01; GLP).
Enninga, I.C. (1989b) Evaluation of the ability of chlorpropham to induce chromosome aberrations in cultured peripheral human lymphocytes. Conducted by Luxan B.V., July 1989, file No. TO-152. Submitted to WHO by Luxan B.V. (dossier no. 5.4.1/02; GLP).
van Esch, G.J. & Kroes, R. (1972) Long-term toxicity studies of chlorpropham and propham in mice and hamsters. Food Cosmet. Toxicol., 10, 373–381 (dossiers nos 5.5/03, 5.5/04 and 5.5/05; no GLP).
Fang, S.C., Fallin, E., Montgomery, M.L. & Freed, V.H. (1974) Metabolic studies of 14C-labeled propham and chlorpropham in the female rat. Pestic. Biochem. Physiol., 4, 1–11 (dossier no. 5.1/03; no GLP).
Fautz, R. (1989) Unscheduled DNA synthesis in primary hepatocytes of male rats in vitro with chlorpropham. Conducted by Luxan B.V., July 1989, file No. TO-150. Submitted to WHO by Luxan B.V. (dossier no. 5.4.1/03; GLP).
James, P., Billington, R., Clark, R. & Offer, J.M. (1983) A study of the effect of CIPC on pregnancy of the rabbit. Conducted by PPG Industries, Barberton, Ohio, USA, 8 March 1983, file No. UPL/EC/REG/CIPC/A2/5.6.2/075. Submitted to WHO by United Phosphorus Ltd. (dossier no. 5.6.2/01; GLP).
Jonker, D. (1998) Preliminary carcinogenicity study with chlorpropham techn. in mice. Conducted by TNO Nutrition and Food Research Institute, February 1998, report V79.944, project no. 470842, study nos 1926 (males) and 1927 (females), file No. TO-801. Submitted to WHO by Luxan B.V. (GLP).
Krohmer, R.W. (1990a) Acute oral toxicity evaluation of chlorpropham in rats. Conducted by T.P.S., Inc., April 1990. Submitted to WHO by the Chlorpropham Task Force (dossier no. 5.2.1/01; GLP).
Krohmer, R.W. (1990b) Acute dermal toxicity evaluation of chlorpropham in rabbits. Conducted by T.P.S., Inc., February 1990. Submitted to WHO by the Chlorpropham Task Force (dossier no. 5.2.2/01; GLP).
Krohmer, R.W. (1990c) Primary dermal irritation evaluation of chlorpropham in rabbits. Conducted by T.P.S., Inc., February 1990. Submitted to WHO by the Chlorpropham Task Force (dossier no. 5.2.4/01; GLP).
Krohmer, R.W. (1990d) Primary Oocular irritation evaluation of chlorpropham in rabbits. Conducted by T.P.S., Inc., February 1990. Submitted to WHO by the Chlorpropham Task Force (dossier no. 5.2.5/01; GLP).
Krohmer, R.W. (1990e) Evaluation of the dermal sensitization potential of chlorpropham in guinea pigs. Conducted by T.P.S., Inc., April 1990. Submitted to WHO by the Chlorpropham Task Force (dossier no. 5.2.6/01; GLP).
Krohmer, R.W. (1990f) 90 day subchronic toxicity evaluation of chlorpropham in the mouse. Conducted by T.P.S., Inc., September 1990. Submitted to WHO by the Chlorpropham Task Force (dossier no. 5.3.2/02; GLP).
Krohmer, R.W. (1990g) 21-day dermal toxicity evaluation of chlorpropham in rabbits. Conducted by T.P.S., Inc., July 1990. Submitted to WHO by the Chlorpropham Task Force (dossier no. 5.3.3/01; GLP).
Krohmer, R.W. ((1992a) 52 week interim report. 18 month oncogenicity evaluation of chlorpropham in the mouse. Conducted by T.P.S., Inc., March 1992. Submitted to WHO by the Chlorpropham Task Force (dossier no. 5.5/03; GLP).
Krohmer, R.W. (1992b) 52 week interim report. 24 month combined oncogenicity/toxicity evaluation of chlorpropham in the rat. Conducted by T.P.S., Inc., February 1992. Submitted to WHO by the Chlorpropham Task Force (dossier no. 5.5/02; GLP).
Larson, P.S., Crawford, E.M., Blackwell Smith, R., Jr, Hennigar, G.R., Haag, H.B. & Finnegar, J.K. (1960) Chronic toxicologic studies on isopropyl-N-(3-chlorophenyl) carbamate (CIPC). Toxicol. Appl. Pharnacol., 2, 659–673 (dossier no. 5.5/01; no. GLP).
Ministry of Agriculture, Fisheries and Food (1993) Food and Environment Protection Act 1985, Part III, Evaluation of fully approved or provisionally approved products. Evaluation of chlorpropham, London: Pesticide Safety Directorate.
Murli, H. (1991) Mutagenicity test on chlorpropham in an in vitro cytogenetic assay measuring chromosomal aberration frequencies in Chinese hamster ovary (CHO) cells. Conducted by Hazleton Laboratories America, Inc., April 1991. Submitted to WHO by the Chlorpropham Task Force (dossier no. 5.4.1/03; GLP).
Pels Rijcken, W.R. (1996a) Assessment of acute oral toxicity with chlorpropham technical in the rat. Conducted by NOTOX B.V., 29 January 1996, project 154125, substance 54495, file No. TO-664. Submitted to WHO by Luxan B.V.
Pels Rijcken, W.R. (1996b) Assessment of acute dermal toxicity with chlorpropham technical in the rat. Conducted by NOTOX B.V., 29 January 1996, project 154136, substance 54495, file No. TO-665. Submitted to WHO by Luxan B.V.
Pels Rijcken, W.R. (1996c) Primary skin irritation/corrosion study with chlorpropham technical in the rabbit (4-hour semi-occlusive application). Conducted by NOTOX B.V., 27 January 1996, project 154147, substance 54495, file No. TO-666. Submitted to WHO by Luxan B.V.
Pels Rijcken, W.R. (1996d) Acute eye irritation/corrosion study with chlorpropham technical in the rabbit. Conducted by NOTOX B.V., 29 January 1996, project 154158, substance 54495, file No. TO-667. Submitted to WHO by Luxan B.V. (GLP).
Poiley, J.A. (1991) In vitro transformation assay of chlorpropham using Syrian hamster cells. Conducted by Hazleton Laboratories America, Inc., March 1991. Submitted to WHO by the Chlorpropham Task Force (dossier no. 5.4.1/02; GLP).
Robinson, R.A. & Liu, D.D.W. (1991) Metabolism of 14C-chlorpropham in rats—Definitive FIFRA study, metabolite analysis and quantitation. Conducted by XenoBiotic Labs, Inc. and Biological Test Center, August 1991. Submitted to WHO by the Chlorpropham Task Force (dossier no. 5.1/01; GLP).
Schoenmakers, A.C.M. & Frieling, W.J.A.M. (1998) Subchronic 90-day oral toxicity study with chlorpropham techn. in the dog. Conducted by NOTOX B.V., 21 October 1998, project 202534, substance 63072/A, file No. TO-867. Submitted to WHO by Luxan B.V. (GLP).
Schoenmakers, A.C.M. & Nesselrooy, J.H.J. (1998) 14-day range-finding oral toxicity study with chlopropham techn. in the dog. Conducted by NOTOX B.V., 18 March 1998, project 203309, substance 63072, file No. TO-817. Submitted to WHO by Luxan B.V. (GLP).
Schoenmakers, A.C.M. et al. (1998a) Subacute 28-day oral toxicity with chlorpropham techn. by dietary administration in the rat. Conducted by NOTOX B.V., 23 March 1998, project 202512, substance 63072, file No. TO-816. Submitted to WHO by Luxan B.V. (GLP).
Schoenmakers, A.C.M. et al. (1998b) Subchronic 90-day oral toxicity with chlorpropham techn. by dietary administration in the rat. Conducted by NOTOX B.V., 3 June 1998, project 202523, substance 63072, file No. TO-824. Submitted to WHO by Luxan B.V. (GLP).
Schroeder, R.E. (1983) A two generation reproduction study in rats with CIPC. Conducted by PPG Industries, Barberton, Ohio, USA, 5 July 1983, file No. UPL/EC/REG/CIPC/A2/5.6.1/076. Submitted to WHO by United Phosphorus Ltd (dossier no. 5.6.1/01; GLP).
Waalkens-Berendsen, D.H. (1998a) Preliminary toxicity study with chlorproham techn in New Zealand white rabbits. Conducted by TNO Nutrition and Food Research Institute, 25 June 1998, report V98.225, project No. 470480/001, file No. TO-831. Submitted to WHO by Luxan B.V. (GLP).
Waalkens-Berendsen, D.H. (1998b) Oral embryotoxicity/teratogenicity study with chlorpropham techn. in New Zealand white rabbits. Conducted by: TNO Nutrition and Food Research Institute, 29 June 1998, report V98.226 final, project No. 470840/002, file No. TO-832. Submitted to WHO by Luxan B.V. (GLP).
Wedig, J.H. (1990a) 28-day rangefinding evaluation of chlorpropham in the dog. Conducted by T.P.S., Inc., June 1990. Submitted to WHO by the Chlorpropham Task Force (dossier no. 5.3.1/01; GLP).
Wedig, J.H. (1990b) 90 day subchronic toxicity evaluation of chlorpropham in the rat. Conducted by T.P.S., Inc., September 1990. Submitted to WHO by the Chlorpropham Task Force (dossier no. 5.3.2/01; GLP).
Wedig, J.H. (1992) One year chronic study of chlorpropham in dogs. Conducted by T.P.S., Inc., January 1992. Submitted to WHO by the Chlorpropham Task Force (dossier no. 5.5/01; GLP).
Weterings, P.J.J.M. (1985) Assessment of the skin sensitisation potential of chlorpropham in the guinea-pig (split adjuvant test). Conducted by Luxan B.V., October 1985, file No. TO-136. Submitted to WHO by Luxan B.V. (dossier no. 5.2.6/01; GLP).
WHO (1999) Recommended classification of pesticides by hazard and guidelines to classification 1998–1999 (WHO/PCS/98.21/Rev.1), Geneva, International Programme on Chemical Safety (www.who.int/pcs/pcs-act.htm).
Wu, D. (1991a) Metabolism of 14C-chlorpropham in lactating goats—Metabolite analysis and quantitation in milk and edible tissues. Conducted by XenoBiotic Labs, Inc. and Biological Test Center, November 1991. Submitted to WHO by the Chlorpropham Task Force (dossier no. 5.1/02; GLP).
Wu, D. (1991b) Metabolism of 14C-chlorpropham in laying hens. Metabolite analysis and quantitation in eggs and tissues. Conducted by XenoBiotic Labs, Inc. and Biological Test Center, December 1991. Submitted to WHO by the Chlorpropham Task Force (dossier no. 5.1/03; GLP).
    See Also:
       Toxicological Abbreviations
       Chlorpropham (ICSC)
       Chlorpropham (FAO Meeting Report PL/1965/10/1)
       Chlorpropham (JMPR Evaluations 2005 Part II Toxicological)