
Pesticide residues in food 2001
First draft prepared by
I. Dewhurst
Pesticides Safety Directorate,
York, United Kingdom
Diflubenzuron [1-(4-chlorophenyl)-3-(2,6-difluorobenzoyl)urea] is an insecticide that acts by disrupting chitin synthesis and deposition. The toxicity of diflubenzuron was evaluated by the JMPR in 1981, 1984 and 1985 (Annex 1, references 36, 42 and 44); an ADI of 0–0.02 mg/kg bw was established at the latter Meeting. This ADI was maintained by a 1994 WHO Core Assessment Group that prepared Environmental Health Criteria 184 (WHO, 1996). The present Meeting considered studies performed since the last review and older, re-submitted reports.
The studies submitted for this evaluation of diflubenzuron were performed over a period of approximately 30 years. All the studies were considered adequate for their intended purpose unless specifically stated in the text. Studies that contained statements of compliance with good laboratory practice (GLP) or had been subjected to quality assurance (QA) audits are identified in the reference list.
Diflubenzuron has been known under a number of synonyms and codes, including DU112307, TH6040, Vigilante and Dimilin. The manufacturing process for diflubenzuron is reported to have been consistent over time (Dykstra, 2001), and the results obtained in the 1970s were considered applicable to the technical-grade material produced currently.
(a) Absorption, distribution and excretion
Mice
When mice were given a single oral dose of diflubenzuron at 12, 64, 200 or 920 mg/kg bw, excretion was almost complete within 48 h. The cumulative percentage of the dose excreted in the urine decreased from 15% at the lowest dose to about 2% at the highest, showing that the relationship between urinary excretion and dose in mice is similar to that in rats (cited in Annex 1, reference 46).
Rats
The intestinal absorption of diflubenzuron in mammals decreased with increasing dose. Radiolabelled diflubenzuron, with the 14C label uniformly distributed in the anilino moiety, was administered by gavage to rats as a single dose of 4, 16, 48, 128 or 1000 mg/kg bw. Urine was collected every 24 h up to 120 or 144 h. The cumulative excretion in urine as a percentage of the dose decreased from 28% at the lowest dose to only 1% at the highest, while the recovery remained constant (90%). In rats with cannulated bile ducts, the sum of the excretion in urine and bile decreased from 42% of the dose at the lowest dose to about 4% at the highest. In rats that had received radiolabelled diflubenzuron with the 14C in the carbamoyl group of the benzoyl moiety, 1% of the radiolabel was found in expired air. In rats, 72 h after administration of a single oral dose of 5 mg/kg bw of double-labelled diflubenzuron (14C in the anilino moiety and 3H in the benzoyl moiety), 1.3% of the 14C and 3.5% of the 3H was retained in the carcass (cited in Annex 1, reference 46).
An extensive investigation of the absorption, distribution and excretion of diflubenzuron was reported. Groups of Sprague-Dawley rats received [14C]diflubenzuron uniformly labelled in both phenyl rings (specific activity, 1 µCi/mg or 19.5 µCi/mg), by gavage in 1% gum tragacanth. Details of the dosing and sampling are given in Table 1. Samples were retained for subsequent determination of metabolites. Radiolabel was determined by liquid scintillation counting with correction against an external standard after appropriate processing. The results (Table 2) show that diflubenzuron at a dose of 5 mg/kg bw was moderately absorbed, about 30% of the administered dose being excreted in urine and bile, and was less completely absorbed at 100 mg/kg bw. In animals with bile cannulae, reduced excretion was seen in urine (about 7%), indicating some degree of enterohepatic recirculation. 14CO2 in exhaled air represented < 0.1% of the administered dose. The peak concentrations of radiolabel in blood (Cmax) were achieved 4 h after administration. The highest tissue concentrations at 4 h were seen in liver and fat. More radiolabel was found in erythrocytes relative to plasma with increasing duration after dosing. Autoradiography showed a wide distribution of radiolabel, the highest concentrations being found in the gastrointestinal tract. Excretion was relatively rapid, > 90% of the doses of 5 and 100 mg/kg bw being excreted within 24 h. Animals given repeated doses showed evidence of delayed absorption and excretion, but no change in the pattern of excretion or residues was seen at 7 days; it is unclear whether this was an effect of diflubenzuron or of increased age and body weight. The highest concentrations of residues of radiolabel 7 days after administration were found in erythrocytes and liver, but the total residual radiolabel represented < 1% of the administered dose. There were no notable differences between the sexes (Dunsire et al., 1990).
Table 1. Design of study of absorption, distribution and excretion of [14C]diflubenzuron in rats
|
No. of animals |
Dosing schedule |
Routine samplesa |
Terminal samples |
|
5/sex |
1 × 5 mg/kg bw |
Urine, faeces, air |
Fluids, tissues at 168 h |
|
5/sex |
14 × 5 mg/kg bw per day (12C) |
|
|
|
|
1 × 5 mg/kg bw (14C) |
Urine, faeces, air |
Fluids, tissues at 168 h |
|
5/sex |
1 × 100 mg/kg bw |
Urine, faeces, air |
Fluids, tissues at 168 h |
|
3/sex |
1 × 5 mg/kg bw |
Blood |
– |
|
3/sex per time |
1 × 5 mg/kg bw |
– |
Fluids, tissues at 4, 14, 48 and 72 h |
|
3/sex |
1 × 5 mg/kg bw |
Bile, urine, faeces |
Gastrointestinal tract, carcass at 24 h |
|
1/sex/time |
1 × 5 mg/kg bw |
– |
Autoradiographyb |
From Dunsire et al. (1990)
a
Urine and faecal samples were taken at 8 and 24 h, then every 24 h until 168 h. Air samples were taken at 8 and 24 h. Tail vein blood was taken at 0.25, 0.5, 1, 2, 4, 8, 16, 24 and 48 h. Bile samples were taken hourly for 24 h.b
At times corresponding to plasma Cmax, Cmax/2 and 48 hTable 2. Absorption, distribution and excretion of [14C]diflubenzuron in rats (mean values)
|
|
Dose (mg/kg bw) |
|||||
|
|
1 × 5 |
14 + 1 × 5 |
1 × 100 |
|||
|
|
Males |
Females |
Males |
Females |
Males |
Females |
|
Urine (%) |
|
|
|
|
|
|
|
0–8 h |
8 |
9 |
4 |
4 |
1 |
1 |
|
0–24 h |
20 |
20 |
14 |
12 |
3 |
2 |
|
Faeces (%) |
|
|
|
|
|
|
|
0–8 ha |
16 |
11 |
< 1 |
11 |
66 |
35 |
|
0–24 h |
73 |
75 |
64 |
72 |
95 |
93 |
|
Total recovery (%) |
97 |
99 |
97 |
99 |
99 |
99 |
|
Time to blood Cmax (h) |
4 h |
4 h |
ND |
ND |
ND |
ND |
|
Time to blood Cmax/2 (h) |
14 h |
14 h |
ND |
ND |
ND |
ND |
|
Plasma (ng equivalents per ml) Cmax |
695 |
752 |
ND |
ND |
ND |
ND |
|
Plasma (ng equivalents per ml) Cmax/2 |
187 |
260 |
ND |
ND |
ND |
ND |
|
48 h |
13 |
20 |
ND |
ND |
ND |
ND |
|
168 h |
3 |
3 |
4 |
5 |
0 |
10 |
|
Liver (ng equivalents per ml) Cmax |
2090 |
2440 |
ND |
ND |
ND |
ND |
|
Liver (ng equivalents per ml) Cmax/2 |
693 |
1170 |
ND |
ND |
ND |
ND |
|
48 h |
336 |
526 |
ND |
ND |
ND |
ND |
|
168 h |
187 |
151 |
153 |
152 |
330 |
370 |
|
Erythrocytes (µg equivalents per ml) Cmax |
548 |
449 |
ND |
ND |
ND |
ND |
|
Erythrocytes (µg equivalents per ml) Cmax/2 |
566 |
318 |
ND |
ND |
ND |
ND |
|
48 ha |
360 |
398 |
ND |
ND |
ND |
ND |
|
168 h |
169 |
251 |
157 |
152 |
590 |
780 |
|
Bile (%) |
||||||
|
0–8 h |
3 |
3 |
ND |
ND |
ND |
ND |
|
0–24 h |
19 |
15 |
ND |
ND |
ND |
ND |
From Dunsire et al. (1990). ND, not determined
a
Great inter-animal variationThe dermal absorption of [anilino-U-14C]diflubenzuron (purity, 97.2%; specific activity, 18 µCi/mg) was investigated in groups of four male Sprague-Dawley rats (one control per time). A suspension of diflubenzuron (100 µl) in 0.25% gum tragacanth was applied to a 10-cm2 clipped area at a concentration of 0.005 or 0.05 mg/cm2 and kept under semi-occluded conditions. The animals were killed 1, 4 or 10 h after application, and the skin site was washed five times with soap solution. Samples of excreta, cage wash, application site and carcass were analysed by liquid scintillation counting after appropriate processing. More than 96% was recovered in all groups, more than 80% of the applied radiolabel being removed in the first wash. The residue at the application site represented 4.5–6% of the applied dose. The mean absorption was < 0.5% in all groups (range, 0.03–1.2%). There was no evidence of increased absorption with longer exposure (Andre, 1996).
Rabbits
The dermal absorption of [anilino-U-14C]-diflubenzuron (purity, > 99%; specific activity, 11.2 µg/g) was investigated in a group of eight male New Zealand rabbits. A 10% suspension of diflubenzuron in 1% gum tragacanth was applied at 150 mg/kg bw to shaved areas and occluded for 6 h, when the site was washed. Excretion of radiolabel in urine and faeces was determined over 48 h. The concentration of radiolabel in faeces was at the level of determination (< 1% of the applied dose), and there was about 0.1% in urine. Diflubenzuron is thus poorly absorbed through rabbit skin (de Lange, 1979).
Cats
Diflubenzuron labelled with 14C and 3H was administered orally to cats at a dose of about 7 mg/kg bw on day 10 of a 15-day dosing regimen with unlabelled diflubenzuron. Within 72 h of administration, 9% of the oral dose had been excreted in the urine and 77% of the 14C and 71% of the 3H in the faeces (Hawkins et al., 1980).
The basic metabolic pathways of diflubenzuron were established in early studies in rats and cows. The main pathway involves hydroxylation of the phenyl moieties of the intact compound. About 80% of the metabolites in rat urine were identified as 2,6-difluoro-3-hydroxybenzuron, 4-chloro-2-hydroxydiflubenzuron and 4-chloro-3-hydroxy diflubenzuron. Approximately 20% underwent scission at the ureido bridge, and most was excreted as 2,6-difluorobenzoic acid. 4-Chlorophenylurea was not detected in bile or urine in significant quantities (cited in Annex 1, reference 46).
The metabolites produced by Sprague-Dawley rats after administration of [14C]diflubenzuron uniformly labelled in both phenyl rings were identified and characterized in samples from the study of Dunsire et al. (1990). Pooled (0–24 h) samples of urine, faeces or bile were prepared from males and females dosed once at 5 or 100 mg/kg bw or 15 times at 5 mg/kg bw per day (see Table 1). After extraction, the metabolites were determined by high-performance liquid chromatography (HPLC) separation, liquid scintillation counting and comparison with standards. The presence of conjugates was determined by the use of a glucuronidase–aryl sulfatase preparation. A specific investigation for the presence of 4-chloroaniline was performed, as routine methods failed to separate this compound from 4-chlorophenylurea.
The metabolic profiles were similar for the two sexes. Biliary samples proved difficult to analyse, as 75–80% of the radiolabel was present in a five-component peak. Enzyme hydrolysis of bile increased the proportion of 2-hydroxydiflubenzuron from about 5% to 19%, at the expense of the major multi-component peak. Diflubenzuron represented about 7% of the biliary radiolabel. Initial investigations of faecal samples gave variable recovery rates, with diflubenzuron representing > 93% of the recovered radiolabel. A second method involving enzyme hydrolysis and dilution with control urine was used to investigate samples from animals given the high single dose and repeated doses. Various compounds were identified, the main peaks being diflubenzuron (65–75% of recovered radiolabel), 2-hydroxydiflubenzuron (7–10%), 4-chlorophenylurea (5–6%) and 2,6-difluorobenzamide (2–4%). Investigations of urine samples gave reliable recoveries (85–105%), and various metabolites were identified (Table 3), though again there was incomplete separation. The results showed that absorbed diflubenzuron was extensively metabolized. Enzyme treatment of the urine samples indicated conjugation of 2’-hydroxydiflubenzuron and of diflubenzuron. The only notable difference between the groups was the higher concentration of unconjugated 2’-hydroxydiflubenzuron and the presence of peak B in the urine of animals given repeated doses. Specific investigations for 4-chloroaniline did not reveal its presence in bile or urine at a limit of determination of 7.5 ng/ml (Cameron et al., 1990).
The production of 4-chloroaniline and 4-chlorophenylurea was investigated in four male Fischer 344 rats given a single dose of 104 mg/kg bw of [U-14C-anilino]diflubenzuron (specific activity, 9828 dpm/mg; radiochemical purity, 99.9%) in 1% gum tragacanth by gavage. Urine and faecal samples were taken after 20, 48, 72 and 96 h. Pooled 0–20-h samples were analysed by HPLC, liquid chromatography–mass spectrometry and liquid chromatography–tandem mass spectrometry. Faecal samples were extracted initially with acetonitrile, then sequentially with hexane, acetone and water. Most of the administered dose was excreted within 20 h, with 68% in faeces and 2% in urine. The only compound detected in faeces was diflubenzuron. Three metabolites were identified in significant amounts in urine: 4-chloroaniline-2-sulfate (45% of the total urinary radiolabelled residues), N-(4-chlorophenyl)-oxamic acid (13%) and 4-chloroacetanilide-2-sulfate (2%). Neither diflubenzuron, 4-chloroaniline nor 4-chlorophenylurea nor their N-hydroxy derivatives were identified in urine. 2-Hydroxydiflubenzuron was present at only < 1% of the total radiolabelled residues (Wang & Gay, 1999). A proposed metabolic pathway for diflubenzuron is presented in Figure 1.
Table 3. Metabolites in urine of rats given [14C]diflubenzuron (% of recovered radiolabel) before and after enzyme hydrolysis
|
Metabolite |
Dose group |
|||||||
|
1 ´ 5 mg/kg bw |
1 ´ 100 mg/kg bw |
|||||||
|
Males |
Females |
Males |
Females |
|||||
|
Before |
After |
Before |
After |
Before |
After |
Before |
After |
|
|
Diflubenzuron |
1.5 |
3.8 |
0.4 |
4.0 |
0 |
4.3 |
0 |
4.5 |
|
2,6-Difluorobenzoic acid |
22 |
29 |
21 |
27 |
30 |
29 |
28 |
29 |
|
2,6-Difluorohippuric acid |
7.4 |
7.4 |
8.7 |
7.9 |
8.5 |
9.1 |
9.4 |
9.8 |
|
2,6-Difluorobenzamidea |
19 |
7.0 |
20 |
6.7 |
25 |
6.6 |
27 |
6.2 |
|
4-Chlorophenylurea |
10 |
11 |
10 |
12 |
5.5 |
14 |
5.2 |
11 |
|
2-Hydroxydiflubenzuron |
6.8 |
18 |
7.7 |
17 |
4.4 |
15 |
2.8 |
15 |
|
Peak Ab |
27 |
16 |
26 |
15 |
22 |
12 |
23 |
14 |
|
Peak Bc |
0.8 |
3.0 |
1.0 |
3.6 |
0.6 |
5.0 |
0.2 |
4.0 |
|
Metabolite |
Dose group |
|||
|
14 + 1 ´ 5 mg/kg bw per day |
||||
|
Males |
Females |
|||
|
Before |
After |
Before |
After |
|
|
Diflubenzuron |
0.3 |
4.0 |
0.6 |
4.4 |
|
2,6-Difluorobenzoic acid |
22 |
27 |
25 |
25 |
|
2,6-Difluorohippuric acid |
11 |
6.6 |
8.3 |
7.9 |
|
2,6-Difluorobenzamidea |
21 |
7.1 |
20 |
8.6 |
|
4-Chlorophenylurea |
8.1 |
13 |
8.2 |
13 |
|
2-Hydroxydiflubenzuron |
12 |
17 |
12 |
19 |
|
Peak Ab |
16 |
12 |
17 |
14 |
|
Peak Bc |
6.1 |
4.4 |
2.6 |
4.1 |
a
Probably a two-component peak co-eluting with 2,6-difluorobenzamide standardb
Five componentsc
Mixture of 3’-hydroxydiflubenzuron, 4-nitrochlorobenzene and N-acetyl-4-chlorophenylurea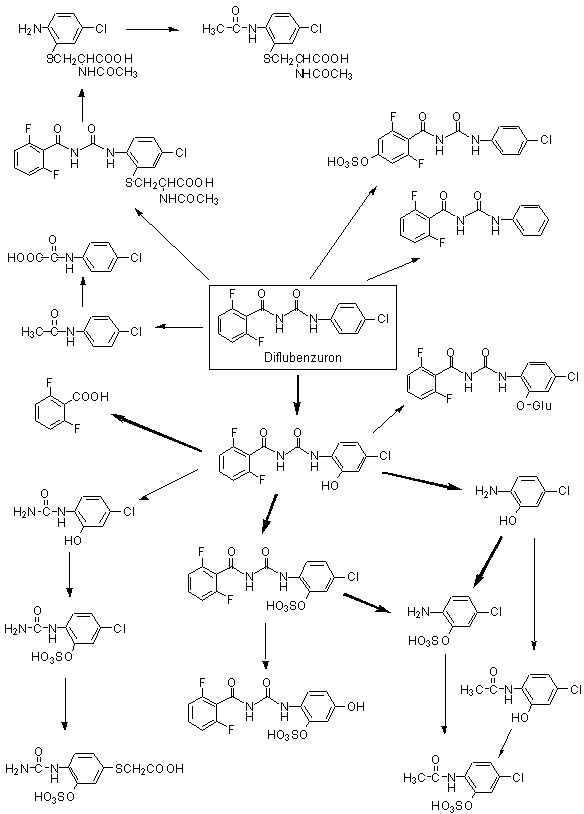
Figure 1. Proposed metabolic pathway for diflubenzuron in rats
The metabolism of 4-chlorophenylurea, a major plant metabolite of diflubenzuron, was studied in four male Fischer 344 rats that received [U-14C-phenyl]-4-chlorophenylurea (specific activity, 1.9 Ci/mol; radiochemical purity, 97%) in 1% gum tragacanth by gavage at 198 mg/kg bw. Urine and faeces were collected at 20, 48, 72, 96, 120 and 144 h (termination). The total radiolabel in urine, faeces and carcass was determined by liquid scintillation counting after appropriate processing. Pooled 0–20- and 20–48-h faecal and urine samples were examined by HPLC, thin-layer chromatography, liquid chromatography–mass spectrometry and gas chromatography–mass spectrometry and comparison with standards. Metabolites in faeces were identified after sequential extractions with acetonitrile, hexane, acetone and water. Urine samples were also investigated after treatment with glucuronidase or sulfatase. Over 90% of the administered dose was excreted in urine. Four faecal metabolites were identified, all of which were also found in urine. The major faecal metabolite was 4-hydroxyphenylurea (about 3% of the administered dose), with unchanged 4-chlorophenylurea present at 0.6%. Thirteen distinct peaks were obtained from urine samples, the major components being 4-chlorophenylurea-2-sulfate (25% of the administered dose), 4-hydroxyphenylurea (18%), 4-chlorophenylurea-2-glucuronide (17%), 4-chlorophenylurea-3-sulfate (8%) and phenylurea-4-sulfate (7%). 4-Chloroaniline was not detected in urine at a limit of detection of < 0.02 µg/ml. The metabolic profile of 4-chlorophenylurea showed that it undergoes extensive ring hydroxylation and conjugation with either sulfate or glucuronide (Gay et al., 1999).
There is no clear reason for the marked differences between the findings of Cameron et al. (1990) and Wang and Gay (1999). The overall conclusion from these studies is that the primary steps in the metabolism of diflubenzuron are hydrolysis of the anilino ring, cleavage of the ureido bridge and conjugation (mainly to sulfate). The most recent data (Wang & Gay, 1999), and reputedly the most reliable, indicate that two compounds found as plant residues of diflubenzuron, 4-chloroaniline and 4-chlorophenylurea, might not be formed directly in rats. It is possible that hydroxylation of the anilino ring occurs before cleavage of the ureido bridge. Comparison of the results of Wang and Gay (1999) and Gay et al. (1999) suggests that 4-chlorophenylurea is not formed to a significant extent and that cleavage of diflubenzuron gives rise predominantly to 4-chloroaniline derivatives.
(c) Effects on enzymes and other biochemical parameters
The concentrations of methaemoglobin and sulfhaemoglobin and the incidence of Heinz bodies were investigated in animals dosed once with a 25% w/w formulation of diflubenzuron. Groups of 15 male Swiss mice or male Wistar rats received Dimilin at 0 (co-formulants only) or 10 000 mg/kg bw in 1% gum tragacanth by gavage. Samples of blood were taken 4 and 24 h after dosing. In mice, there were no effects on body weight, sulfhaemoglobin concentration or incidence of Heinz bodies. The methaemoglobin concentrations were increased (p < 0.003) at 4 h but not at 24 h. The increase at 4 h was relatively small (2.2% versus 2.6%), but the ranges (1.3–2.5% versus 1.5–3.3%) indicated a treatment-related effect. A similar pattern was found in rats, with no effects on body weight, sulfhaemoglobin concentration or incidence of Heinz bodies. The methaemoglobin concentrations were increased (p < 0.01) at 24 h but not at 4 h. The increase at 24 h was relatively small (1.5% versus 1.9%), but there was a small overlap in the ranges (1.2–1.8% versus 1.6–2.1%), showing a clear treatment-related effect. A single high dose of diflubenzuron (2500 mg/kg bw) can thus increase methaemoglobin concentrations (Keet et al., 1997a,b).
The results of studies if acute toxicity show that diflubenzuron (purity, 99.6%) has little acute toxicity when given by the oral, inhalation or dermal route. The LD50 in mice and rats given diflubenzuron in 1% tragacanth by gavage was > 4600 mg/kg bw (van Eldik, 1973). In rats treated dermally for 24 h, the LD50 was > 10 000 mg/kg bw (Koopman, 1977), and in rats treated by whole-body inhalation of a preparation with a mass median aerodynamic diameter < 5 µm, the LC50 was > 2.9 mg/l of air (Berczy et al., 1973). No clinical signs were seen in these studies, although the level of detail in the study reports was inadequate to permit independent confirmation. No haematological investigations were performed.
(b) Short-term studies of toxicity
Rats
Groups of 40 Sprague-Dawley rats of each sex (controls, 90 of each sex) received diets containing diflubenzuron (two lots; purity, 96% and 97.2%) at a concentration of 0, 160, 400, 2000, 10 000 or 50 000 ppm. About half the animals were killed at week 7 and the remainder at 13 weeks. Routine clinical investigations were performed. Samples were taken from 10 animals of each sex per group for haematological, clinical chemical and urinary investigations in weeks 7 and 13. All animals were examined grossly, and extensive histological investigations were performed on controls and animals at the highest dose, with more limited examination (but including liver, spleen and marrow) of other groups.
There were no treatment-related effects on the mortality rate, clinical signs or food consumption. Body-weight gain was reduced by about 20% in females receiving 50 000 ppm and in males receiving > 2000 ppm, but with no clear dose–response relationship. Haematology at week 7 showed a range of dose-related alterations in erythrocyte parameters in animals of each sex receiving doses > 400 ppm, with minimal effects at 160 ppm (Table 4). The haematological findings were reproduced at week 13. Alterations in a number of clinical chemical parameters were seen in animals at the two higher doses, but the findings were sporadic, generally occurred in only a few animals in a group and considered to be not biologically significant. The absolute and relative weights of the spleen were increased in males and females at doses > 400 ppm and in males receiving 160 ppm for 7 weeks (Table 4). At week 13, the absolute weight of the liver was increased (by > 10%) in females at the highest dose, and the relative weights were increased (by > 10%) in males at the highest dose and females at doses > 400 ppm. Pathological lesions related to treatment were chronic hepatitis, haemosiderosis and congestion of the spleen and erythroid hyperplasia of the bone marrow in all treated groups, and haemosiderosis in the liver at doses > 400 ppm. The lesions increased in severity with increasing dose and duration of dosing (Table 4). No NOAEL could be identified, as there were small but statistically significant increases in methaemoglobin concentration, with associated findings in the spleen and bone marrow at the lowest dose, 160 ppm, equivalent to 8 mg/kg bw per day (Burdock et al., 1980; Goodman, 1980).
Table 4. Haematological and histopathological findings in rats fed diets containing diflubenzuron for 7 or 13 weeks
|
Finding |
Sex |
Concentration in feed (ppm) |
|||||
|
0 |
160 |
400 |
2000 |
10 000 |
50 000 |
||
|
Week 7 |
|||||||
|
Erythrocyte count (106/mm3) |
Males |
7.7 |
7.5 |
7.0* |
6.5* |
6.6* |
5.9* |
|
Females |
7.1 |
6.7 |
6.5* |
5.8* |
5.6* |
5.3* |
|
|
Haemoglobin (g/dl) |
Males |
16 |
15 |
15* |
14* |
14* |
14* |
|
Females |
15 |
15 |
15 |
14* |
14* |
14* |
|
|
Reticulocytes (% RBC) |
Males |
1.7 |
2.1 |
3.0* |
5.4* |
5.6* |
7.9* |
|
Females |
1.7 |
2.1 |
3.4* |
5.7* |
5.8* |
9.0* |
|
|
Methaemoglobin (%) |
Males |
0.2 |
0.3 |
0.3* |
0.5* |
0.5* |
0.7* |
|
Females |
0.2 |
0.3* |
0.4* |
0.5* |
0.5* |
0.7* |
|
|
Sulfhaemoglobin (%) |
Males |
0.04 |
0.08 |
0.1 |
0.07 |
0.1 |
0.2* |
|
Females |
0.03 |
0.03 |
0.06 |
0.06 |
0.1* |
0.2* |
|
|
Spleen weight (g) |
Males |
0.7 |
0.8* |
0.9* |
1.1* |
1.2* |
1.7* |
|
Females |
0.5 |
0.5 |
0.6 |
0.8* |
0.9* |
1.3* |
|
|
Week 13 |
|||||||
|
Spleen weight (g) |
Males |
0.7 |
0.7 |
0.9* |
1.1* |
1.3* |
1.6* |
|
Females |
0.5 |
0.5 |
0.6* |
0.9* |
1.1* |
1.2* |
|
|
Chronic hepatitis (mean severity)a |
Males |
0.91 |
1.3 |
1.4 |
1.6 |
2.5 |
2.8b |
|
Females |
0.77 |
0.81 |
1.0 |
1.3 |
1.7 |
1.1b |
|
|
Liver haemosiderosis (%) |
Males |
0 |
0 |
45* |
90* |
100* |
100* |
|
Females |
0 |
5 |
60* |
85* |
95* |
100* |
|
|
Spleen haemosiderosis (severity)a |
Males |
1.7 |
2.7 |
3.9 |
4.2 |
4.2 |
4.1b |
|
Females |
1.3 |
3.7 |
4.3 |
4.1 |
3.9 |
4.3b |
|
|
Spleen congestion (%) |
Males |
9 |
21 |
70* |
95* |
80* |
95* |
|
Females |
4 |
15 |
30* |
70* |
85* |
100* |
|
|
Bone marrow, erythroid hyperplasia (%) |
Males |
0 |
37* |
80* |
100* |
100* |
95* |
|
Females |
0 |
22* |
37* |
79* |
82* |
95* |
|
From Burdock et al. (1980) and Goodman (1980)
* p < 0.05
a
Control incidence > 90%b
p < 0.01 for trendGroups of 10 Crl:CD BR (VAF/Plus) rats of each sex received diflubenzuron (purity, 96.7%) in 0.25% aqueous gum tragacanth dermally for 6 h/day for 21 days under semi-occlusive dressings at a dose of 0, 20, 500 or 1000 mg/kg bw per day on shaved, unabraded sites representing about 10% of the body area at the two higher doses and 1% at the lowest dose. Routine clinical investigations were performed. Blood samples for haematological and clinical chemical analysis were taken before sacrifice. All animals were examined grossly, and liver, kidney and skin from controls and animals at the highest dose were examined histologically.
One female at 500 mg/kg bw per day and one at the highest dose died on day 9. As these were isolated findings and there were no subsequent deaths, the relationship to exposure to diflubenzuron is uncertain. Body weight, food consumption, clinical signs, clinical chemical end-points and gross and microscopic appearance were unaffected. There were no signs of irritation at the application site. Reductions in erythrocyte parameters were seen in females at 500 mg/kg bw per day and in animals of each sex at 1000 mg/kg bw per day (Table 5), together with increased incidences and severity of polychromasia, hyperchromasia and anisocytosis in animals of each sex at doses > 500 mg/kg bw per day. Statistically significant increases in leukocyte counts were seen in males at > 500 mg/kg bw per day and a nonsignificant increase in females at the highest dose (Table 5). The findings were linked to increased numbers of segmented neutrophils and lymphocytes, but the association with diflubenzuron is unclear. The NOAEL was 20 mg/kg bw per day on the basis of haematological effects at doses > 500 mg/kg bw per day (Goldenthal, 1996).
Table 5. Erythrocyte parameters in rats exposed dermally to diflubenzuron for 21 days
|
End-point |
Dose (mg/kg bw per day) |
|||||||
|
Controls |
20 |
|
500 |
|
1000 |
|
|
|
|
Males |
Females |
Males |
Females |
Males |
Females |
Males |
Females |
|
|
Erythrocyte count (106/mm3) |
8.0 |
7.9 |
8.1 |
7.9 |
7.8 |
7.0* |
7.6 |
7.1* |
|
Haemoglobin (g/dl) |
16 |
15 |
16 |
16 |
15 |
14* |
15* |
14* |
|
Erythrocyte volume fraction(%) |
48 |
48 |
49 |
48 |
47 |
44* |
46 |
45* |
|
Methaemoglobin (%) |
0.1 |
0.1 |
0.2 |
0.1 |
0.2 |
0.2 |
0.3* |
0.2* |
|
Leukocyte count (103/mm3) |
9.9 |
8.2 |
11 |
7.9 |
13* |
8.7 |
13* |
11 |
From Goldenthal (1996)
* p < 0.05
Groups of 10 Sprague-Dawley rats of each sex were exposed for 6 h/day, 5 days/week for 4 weeks, by nose only, to atmospheres of diflubenzuron (purity, 96.5%), which were generated from a jet mill and contained particles with a mass median aerodynamic diameter of about 2 mm and a gravimetric concentration of 0.2 (control), 12, 34 or 110 mg/m3. The concentrations varied during the study by ± 10%, but homogeneity within the chamber was confirmed. The animals were observed routinely during and after exposure, with a basic neuro-functional assessment. Samples for urinary analysis, haematology and clinical chemistry were taken before sacrifice. All animals were examined grossly. A wide range of tissues from controls and those at the highest concentration were examined microscopically, with kidney, liver and lungs from all other animals.
One animal died during the terminal bleeding. Body weight, food consumption, clinical signs, urinary parameters and gross and microscopic appearance were unaffected. A reduction in ‘grid count’ was evident in the neuro-functional assessment of males and females exposed to 110 mg/m3. Statistically significant (p < 0.05) decreases in some erythrocyte parameters were seen at this concentration, with evidence of a concentration-related effect (Table 6). Slight but statistically significant increases in bilirubin concentrations were seen in both males and females at the highest level of exposure. The NOAEL was 34 mg/m3, approximately 10 mg/kg bw per day, on the basis of effects on behaviour, haematological end-points and bilirubin concentration at 110 mg/m3 (Newton, 1999).
Table 6. Erythrocyte parameters in rats exposed by inhalation to diflubenzuron for 4 weeks
|
End-point |
Concentration (mg/m3 of air) |
|||||||
|
Controls |
12 |
|
34 |
|
110 |
|
|
|
|
Males |
Females |
Males |
Females |
Males |
Females |
Males |
Females |
|
|
Erythrocyte count (106/mm3) |
8.3 |
7.7 |
8.0 |
7.6 |
8.1 |
7.6 |
7.8 |
7.2 |
|
Haemoglobin (g/dl) |
16 |
15 |
15 |
15 |
15 |
15 |
14* |
14* |
|
Erythrocyte volume fraction (%) |
49 |
46 |
47 |
46 |
46 |
45 |
45* |
44* |
|
Methaemoglobin (%) |
0.1 |
0.1 |
0.2 |
0.2 |
0.2 |
0.1 |
0.2 |
0.2 |
From Newton (1999)
* p < 0.05
Rabbits
Diflubenzuron (purity unknown) was reported not to be irritating to intact or abraded skin of rabbits, although the level of detail in the report was inadequate to permit independent confirmation (Taylor, 1973).
Diflubenzuron (purity, 99.6%) was slightly irritating to the eyes of New Zealand white rabbits after instillation of 40 mg (0.1 ml). The findings were similar when the eyes were rinsed 5 min or 24 h after administration (Davies & Liggett, 1973).
Guinea-pigs
The skin sensitizing potential of diflubenzuron (purity, 95.6%) was investigated in groups of 10 CRL HA BR guinea-pigs exposed in a ‘maximization’ protocol. For induction, 10% diflubenzuron in maize oil with Freund’s complete adjuvant was injected or 30% diflubenzuron in Vaseline was applied topically. The animals were challenged by application of 10% or 30% diflubenzuron in Vaseline. Mild responses were seen after induction by either route. After challenge, mild reactions were seen in one control and two test animals. Diflubenzuron was not a skin sensitizer in this study (Prinsen, 1992).
Dogs
Groups of three male and three female pure-bred beagle dogs aged 16–23 weeks received diets (400 g/day) containing diflubenzuron (purity unspecified) at a concentration of 0, 10, 20, 40 or 160 ppm for 13 weeks. The achieved intakes were 0, 0.4, 0.8, 1.6 and 6.4 mg/kg bw per day. The animals underwent routine clinical investigations. Samples for haematology were taken before dosing and at weeks 2, 4, 6 and 12. Clinical chemistry (limited), urine analysis and ophthalmological investigations were performed before dosing and at weeks 6 and 12. All animals were examined grossly at sacrifice, and an extensive range of tissues were examined microscopically. The results were presented for the two sexes combined.
There were no deaths or adverse clinical signs. Body weights and food and water consumption were not affected by treatment. The body weights fluctuated considerably during the study, but this was to be expected, given the spread of ages, and there was no indication of an association with treatment. The results of urine analysis, ophthalmology and gross and histopathological examinations were similar in all groups. Increases in aspartate aminotransferase activity were seen in animals at the highest dose in weeks 6 and 12, but the finding is of dubious significance as it was not reproduced when the samples were re-tested. Haematological end-points were similar in all groups at week 2, but, by week 4, the haemoglobin concentration of animals at 160 ppm was reduced by about 10%. At week 6, both the haemoglobin concentration and erythrocyte count were reduced and the methaemoglobin and free haemoglobin concentrations were increased in animals at 160 ppm. Haematological end-points were similar in all groups at week 12, although there was a clear increase in the myeloid:erythroid ratio in bone marrow in dogs at 160 ppm (1.2 versus 0.7 in controls). There was an indication of an increase in spleen weight (by about 40%) at 160 ppm, but inter-group variation was high and the ranges in treated and control groups showed considerable overlap. The NOAEL was 40 ppm, equal to 1.6 mg/kg bw per day, on the basis of alterations in haematological end-points and bone marrow at 160 ppm (Chesterman et al., 1974).
Groups of six male and six female beagle dogs (controls, 12 of each sex) received gelatin capsules containing diflubenzuron (purity, 97.6%) at a dose of 0, 2, 10, 50 or 250 mg/kg bw per day. The animals underwent routine clinical investigations. Blood samples for haematology and clinical chemistry were taken before dosing and at weeks 4, 7, 13, 26 and 51. Urine was analysed before dosing and at weeks 7, 13, 26 and 51. Ophthalmoscopy was performed before dosing and at weeks 26 and 51. All animals were examined grossly and microscopically.
One female at the highest dose died from liver failure and one female at 50 mg/kg bw per day died from pneumonia, but neither death was clearly related to treatment. No consistent differences were found between control and test animals in respect of clinical signs, food consumption, body weight, water consumption or urinary parameters. A range of effects related to impaired erythrocytes were seen at 50 and 250 mg/kg bw per day from week 13 onwards. At doses > 50 mg/kg bw per day, signs of haemolytic anaemia, destruction of erythrocytes and compensatory regeneration of erythrocytes were observed. Increases in methaemoglobin and sulfhaemoglobin concentrations were evident at doses > 10 mg/kg bw per day (Table 7). The severity of the haematological alterations appeared to increase with duration of dosing, stabilizing at week 26 and with some evidence of adaptation at week 52. Increased sulfhaemoglobin concentrations seen in animals at the lowest dose in week 26 were considered not to be adverse, as they were not statistically significant and were not seen at 52 weeks. Other findings included increased platelet numbers at doses > 10 mg/kg bw per day in females and > 50 mg/kg bw per day in males; increased lactic dehydrogenase activity from week 7 in animals of each sex receiving 250 mg/kg bw per day and increases in liver (10%) and spleen weights (35%) at doses > 50 mg/kg bw per day. The only notable histopathological findings were in the liver, comprising increased pigmentation of Kupfer cells and macrophages (Table 7). The latter effect in males at the lowest dose was considered not biologically significant as it was graded ‘minimal’ and the frequency was within the normal range of background findings. The NOAEL was 2 mg/kg bw per day on the basis of significant effects on methaemoglobin and sulfhaemoglobin concentrations, platelet counts and hepatic pigmentation at 10 mg/kg bw per day (Greenough et al., 1985).
Table 7. Findings in dogs given diflubenzuron in capsules for 52 weeks
|
Finding |
Sex |
Dose (mg/kg bw/day) |
||||
|
0 |
2 |
10 |
50 |
250 |
||
|
Week 4 |
||||||
|
Sulfhaemoglobin (%) |
Males |
0.1 |
0 |
0.1 |
0.3* |
0.7* |
|
|
Females |
0 |
0 |
0 |
0.2 |
0.4* |
|
Week 13 |
||||||
|
Methaemoglobin (%) |
Males |
1.1 |
1.1 |
1.6 |
1.8 |
4.3* |
|
|
Females |
1.4 |
1.2 |
1.8 |
1.5 |
3.3* |
|
Heinz bodies (no. of animals) |
Males |
0 |
0 |
0 |
0 |
0 |
|
|
Females |
0 |
0 |
0 |
0 |
2 |
|
Week 26 |
||||||
|
Haemoglobin (g/dl) |
Males |
17 |
16 |
17 |
17 |
16* |
|
|
Females |
18 |
18 |
18 |
17* |
16* |
|
Sulfhaemoglobin (%) |
Males |
0 |
0.2 |
0.6* |
0.8* |
1.5* |
|
|
Females |
0 |
0.4 |
0.8* |
1.0* |
1.7* |
|
Methaemoglobin (%) |
Males |
1.6 |
2.1 |
2.6 |
4.1* |
3.6* |
|
|
Females |
1.4 |
1.7 |
2.4* |
2.5* |
3.4* |
|
Heinz bodies (no. of animals) |
Males |
0 |
0 |
0 |
0 |
5* |
|
|
Females |
0 |
0 |
0 |
3* |
5* |
|
Week 52 |
||||||
|
Haemoglobin (g/dl) |
Males |
18 |
17 |
18 |
17 |
17 |
|
|
Females |
18 |
18 |
18 |
16* |
17* |
|
Methaemoglobin (%) |
Males |
1.5 |
1.4 |
3.2* |
2.9* |
3.6* |
|
|
Females |
1.3 |
1.5 |
2.3* |
2.4* |
3.4* |
|
Sulfhaemoglobin (%) |
Males |
0 |
0 |
0.2* |
0.6* |
0.9* |
|
|
Females |
0 |
0 |
0.3* |
0.4* |
1.2* |
|
Heinz bodies (no. of animals) |
Males |
0 |
0 |
0 |
0 |
4* |
|
|
Females |
0 |
0 |
0 |
1 |
3 |
|
Total no. of tissues/sex per group |
|
12 |
6 |
6 |
6 |
6 |
|
Pigmented Kupfer cells (minimal) |
Males |
0 |
3* |
0 |
1 |
1 |
|
|
Females |
1 |
2 |
1 |
1 |
1 |
|
Pigmented Kupfer cells (> mild) |
Males |
0 |
0 |
3* |
5* |
5* |
|
|
Females |
2 |
0 |
5* |
3 |
5* |
|
Pigmented macrophages in liver (> mild) |
Males |
0 |
0 |
3* |
4* |
5* |
|
|
Females |
3 |
2 |
5* |
3 |
6* |
From Greenough et al. (1985)
* p < 0.05
(c) Long-term studies of toxicity and carcinogenicity
Mice
Groups of 52 HC/CFLP mice of each sex (controls, 104 of each sex) received diets containing diflubenzuron (purity, 97.6%) at a concentration of 0, 16, 80, 400, 2000 or 10 000 ppm for up to 91 weeks. Groups of 24 controls and 12 mice receiving diflubenzuron were killed at weeks 26, 52 and 78 for interim investigations. Routine investigations were supplemented by haematology (weeks 26, 52, 78 and 91), clinical chemistry (weeks 24, 50, 76 and 89) and urine analysis (weeks 25, 51, 77 and 90). All animals were examined grossly, and a wide range of tissues from all animals were examined microscopically.
The homogeneity and achieved concentrations in the diet were acceptable, the mean achieved intakes covering an approximately 800-fold range (1.2–960 mg/kg bw per day; Table 8). The mortality rates were similar in all groups, survival to week 78 being > 50% except for females receiving 80 or 2000 ppm. Clinical signs (blue–grey colouration of the extremities) were noted at week 1 in animals receiving doses > 2000 ppm and subsequently in animals in all groups receiving doses > 80 ppm. Body weights and food consumption were similar in all groups. Water consumption was increased at some times for females receiving doses > 2000 ppm, with an associated increase in urine volume. Urine analysis did not indicate any impairment of renal function. Statistically significant, dose-related changes were seen in a number of haematological parameters from week 26 onwards, in animals receiving doses > 80 ppm (Table 8). Statistically significant increases in the concentrations of sulfhaemoglobin were seen in animals of each sex at 16 ppm at 52 weeks and in females at week 78. A dose-related increase in the incidence of Heinz bodies was seen consistently in mice at doses > 400 ppm and sporadically in males at 80 ppm. Increased serum alkaline phosphatase and aspartate aminotransferase activities were seen in males and females at the highest dietary concentration at week 26 and in males at this concentration subsequently. Gross pathological examination ahowed increased liver and spleen weights (Table 8) and cyanotic skin as the only consistent findings. Histopathological examination confirmed that the liver and spleen were the primary target organs for non-neoplastic effects (Table 8). No increase in tumour incidence was associated with administration of diflubenzuron. The increased sulfhaemoglobin concentrations at 16 ppm are of questionable biological significance as they occurred in only a proportion of animals in the group, and the frequency was within the range of fluctuating control values seen during the study. The NOAEL was 16 ppm, equal to 1.2 mg/kg bw per day, on the basis of increased methaemoglobin concentrations and incidences of cyanosis at 80 ppm. The NOAEL for carcinogenicity was the highest concentration tested, 10 000 ppm, equal to 840 mg/kg bw per day (Colley et al., 1984).
Table 8. Findings in mice given diflubenzuron in the diet for up to 93 weeks
|
Finding |
Sex |
Dietary concentration (ppm) |
|||||
|
0 |
16 |
80 |
400 |
2000 |
10 000 |
||
|
Mean intake (mg/kg bw per day) |
Males |
0 |
1.2 |
6.4 |
32 |
160 |
840 |
|
Females |
0 |
1.4 |
7.3 |
35 |
190 |
960 |
|
|
Week 26 |
|||||||
|
Leukocyte count (103/mm3) |
Males |
6.5 |
7.7 |
8.7 |
8.1 |
7.2 |
11* |
|
Females |
6.5 |
5.3 |
6.4 |
6.7 |
11* |
8.3* |
|
|
Erythrocyte count (106/mm3) |
Males |
7.5 |
7.8 |
7.4 |
7.6 |
7.1 |
7.0 |
|
Females |
8.7 |
9.1 |
8.4 |
8.9 |
8.3 |
8.1 |
|
|
Haemoglobin (g/dl) |
Males |
14 |
15 |
14 |
14 |
14 |
15 |
|
Females |
16 |
16 |
16 |
16 |
17* |
17* |
|
|
Mean cell haemoglobin (pg) |
Males |
19 |
19 |
19 |
19 |
20* |
22* |
|
Females |
18 |
17 |
18 |
18 |
20* |
21* |
|
|
Methaemoglobin (%) |
Males |
1.6 |
1.9 |
2.2* |
2.9* |
4.9* |
5.9* |
|
Females |
1.6 |
1.8 |
2.3* |
3.4* |
5.3* |
5.9* |
|
|
Platelet count (103/mm3) |
Males |
890 |
930 |
900 |
1200* |
1200* |
1200* |
|
Females |
1100 |
1100 |
1100 |
1400* |
1400* |
1400 |
|
|
Liver weight (g) |
Males |
2.6 |
2.7 |
2.5 |
2.6 |
3.0* |
3.0* |
|
Females |
2.5 |
2.3 |
2.5 |
2.4 |
2.6 |
2.8 |
|
|
Spleen weight (g) |
Males |
0.13 |
0.16 |
0.14 |
0.16 |
0.22* |
0.29* |
|
Females |
0.15 |
0.14 |
0.16 |
0.22* |
0.29* |
0.41* |
|
|
Week 78 |
|||||||
|
Leukocyte count (103/mm3) |
Males |
10 |
10 |
13 |
14 |
9.5 |
13 |
|
Females |
7.1 |
5.7 |
5.9 |
5.5 |
9.4 |
4.9 |
|
|
Erythrocyte count (106/mm3) |
Males |
7.3 |
7.1 |
6.8 |
6.9 |
6.9 |
6.6 |
|
Females |
7.9 |
8.1 |
6.9 |
7.2 |
7.2 |
6.3* |
|
|
Haemoglobin (g/dl) |
Males |
14 |
15 |
12 |
14 |
15 |
16* |
|
Females |
15 |
15 |
12 |
14 |
14 |
15 |
|
|
Mean cell haemoglobin (pg) |
Males |
21 |
21 |
18 |
21 |
22 |
24* |
|
Females |
19 |
18 |
18 |
20 |
20 |
23* |
|
|
Methaemoglobin (%) |
Males |
0.66 |
0.87 |
1.4* |
2.3* |
3.2* |
4.6* |
|
Females |
1.3 |
1.4 |
1.9* |
3.6* |
5.2* |
6.0* |
|
|
Sulfhaemoglobin (%) |
Males |
0.1 |
0.2 |
0.4* |
4.0* |
3.8* |
6.4* |
|
Females |
0.1 |
0.6* |
0.6* |
3.0* |
3.5* |
3.7* |
|
|
Platelet count (103/mm3) |
Males |
1000 |
1000 |
1100 |
1200 |
1500* |
1600* |
|
Females |
590 |
600 |
700 |
930 |
1300 |
1500 |
|
|
Liver weight (g) |
Males |
3.4 |
3.0 |
3.9 |
3.5 |
3.6 |
3.5 |
|
Females |
2.9 |
2.9 |
3.4 |
3.2 |
3.9 |
4.3* |
|
|
Spleen weight (g) |
Males |
0.22 |
0.48 |
0.97 |
0.52 |
0.22 |
0.33 |
|
Females |
0.27 |
0.22 |
0.38 |
0.50 |
0.55 |
0.46 |
|
|
Week 91 |
|||||||
|
Total no. of tissues/sex per group |
|
104 |
52 |
52 |
52 |
52 |
52 |
|
Hepatocyte enlargement |
Males |
36 |
12 |
11 |
23 |
35* |
31* |
|
Females |
15 |
4 |
5 |
11 |
15* |
29* |
|
|
Hepatocyte vacuolation |
Males |
22 |
17 |
9 |
12 |
18 |
26* |
|
Females |
33 |
17 |
17 |
17 |
12 |
26 |
|
|
Pigmented Kupfer cells |
Males |
0 |
0 |
1 |
1 |
3 |
15* |
|
Females |
1 |
0 |
1 |
0 |
±4 |
11* |
|
|
Splenic extramedullary haematopoiesis |
Males |
27 |
7 |
15 |
21 |
19 |
22* |
|
Females |
37 |
18 |
19 |
19 |
25 |
25 |
|
|
Splenic siderocytes |
Males |
5 |
1 |
2 |
16* |
32* |
30* |
|
Females |
15 |
6 |
13 |
30* |
31* |
43* |
|
From Colley et al. (1984)
*p < 0.05
Rats
Groups of 60 CD rats of each sex were fed diets containing diflubenzuron (purity unspecified) at a concentration of 0, 10, 20, 40 or 160 ppm for 2 years. All animals were investigated for clinical signs, body weight, food consumption and gross and microscopic appearance of a limited range of tissues. Samples from controls and animals at the highest concentration were taken at 3, 6, 12, 18 and 24 months for determinations of haematological end-points (10 of each sex), limited clinical chemistry (five of each sex) and urinary parameters (five of each sex). Ophthalmological investigations were performed on controls and animals at the highest concentration at 3, 6, 12, 18 and 24 months. Haematological investigations were performed on animals at 40 ppm (10 of each sex) at 12, 18 and 24 months.
The achieved dietary concentrations and homogeneity were not confirmed. The survival rate was unaffected by treatment but was low, < 30% of animals surviving in all groups at termination. There were no treatment-related effects on urinary, clinical chemical or ophthalmic end-points, food consumption or body-weight gain. Statistically significant (p < 0.05) increases in methaemoglobin concentrations were seen at 12 and 18 months in males and females receiving 160 ppm but not in those at 40 ppm. Sulfhaemoglobin was unaffected by treatment, but the free haemoglobin concentration was reduced in groups at the highest concentration at 3 and 12 months. No increase in the incidence of tumours was seen in treated animals, although the poor survival and limited range of tissues examined severely limited the power of this study to detect a tumorigenic compound.
The NOAEL was 40 ppm, equivalent to 2 mg/kg bw per day, on the basis of haematological changes at 160 ppm. The NOAEL for carcinogenicity was the highest concentration tested, 160 ppm, equivalent to 8 mg/kg bw per day (Hunter et al., 1976; Colley & Offer, 1977)
Groups of 50 Sprague-Dawley rats of each sex (controls, 100 of each sex) were fed diets containing diflubenzuron (purity, 97.6%) at a concentration of 0, 160, 620, 2500 or 10 000 ppm for 2 years. All animals were investigated for clinical signs, body weight, food consumption and gross and microscopic appearance of a wide range of tissues. Haematological investigations were performed on 10 rats of each sex per group at 12 and 24 months. No clinical chemical, urinary or ophthalmological investigations were performed, but as these parameters were unaffected in rats at 160 ppm in a previous study, this is considered not to be a significant omission.
The achieved dietary concentrations and homogeneity were satisfactory. The survival rate was similar in all groups and was > 50% at termination. Food consumption was similar in all groups, but body-weight gain was reduced by > 10% in females at 2500 and 10 000 ppm from week 4, achieving statistical significance at week 26. A range of erythrocyte parameters were altered in both males and females at concentrations > 620 ppm at 12 and 24 months, although there was no marked progression with duration of dosing (Table 9). The methaemoglobin and sulfhaemoglobin concentrations were increased significantly in males at the lowest concentration at 12 months, but there was no clear dose–response relationship, and the biological significance of the finding is debatable. Increased numbers of reticulocytes and the extent of bone-marrow hyperplasia indicated the rats were attempting to respond to the effects on erythrocytes. The only gross finding was enlarged spleens, and this was confirmed by the data on organ weights. The main treatment-related histopathological findings were pigmented (golden brown) macrophages in the spleen and liver and erythroid hyperplasia of the bone marrow. The background incidence of pigmented macrophages in the spleen was high, however, and there was no clear dose–response relationship. Evidence of irritation in the stomach was seen in males receiving concentrations > 2500 ppm that survived to termination. The overall incidence of tumours was low, with no evidence of atypical findings or any dose–response relationship.
Table 9. Findings in rats given diflubenzuron in the diet for up to 104 weeks
|
Finding |
Sex |
Dietary concentration (ppm) |
||||
|
0 |
160 |
620 |
2500 |
10 000 |
||
|
Mean intake (mg/kg bw per day) |
Males |
0 |
7.1 |
28 |
112 |
472 |
|
Females |
0 |
9.3 |
37 |
128 |
612 |
|
|
Week 52 |
||||||
|
Erythrocyte count (106/mm3) |
Males |
8.7 |
8.3 |
7.6* |
8.0 |
7.4* |
|
Females |
8.1 |
7.8 |
7.6 |
7.1* |
6.5* |
|
|
Haemoglobin (g/dl) |
Males |
17 |
16 |
15* |
16 |
15* |
|
Females |
15 |
15 |
14 |
14* |
13* |
|
|
Erythrocyte volume fraction (%) |
Males |
48 |
48 |
44 |
46 |
43* |
|
Females |
46 |
46 |
45 |
43 |
41* |
|
|
Reticulocyte count (%) |
Males |
0.9 |
0.8 |
1.6 |
1.7* |
2.1* |
|
Females |
1.0 |
1.1 |
1.8 |
3.1* |
5.0* |
|
|
Methaemoglobin (%) |
Males |
0.2 |
2.0* |
1.5 |
2.4* |
2.5* |
|
Females |
0.6 |
0.9 |
1.4 |
1.9* |
2.2* |
|
|
Sulfhaemoglobin (%) |
Males |
0.1 |
1.3* |
0.9* |
0.7 |
1.1* |
|
Females |
0.1 |
0.2 |
1.0* |
0.1 |
0.4 |
|
|
Week 104 |
||||||
|
Methaemoglobin (%) |
Males |
0.8 |
1.1 |
1.3 |
1.8* |
1.8* |
|
Females |
0.7 |
1.3 |
1.6* |
2.1* |
2.3* |
|
|
Sulfhaemoglobin (%) |
Males |
0.2 |
0.2 |
0.6 |
0.8 |
0.4 |
|
Females |
0.2 |
0.3 |
0.6 |
1.1* |
1.1* |
|
|
Myeloid:erythroid cell ratio |
Males |
2.5 |
1.6 |
1.8 |
1.5* |
1.5 |
|
Females |
1.9 |
1.1* |
1.3 |
1.3 |
1.1* |
|
|
Spleen weight (g) |
Males |
1.0 |
1.0 |
1.3 |
1.4* |
1.5* |
|
Females |
0.7 |
0.9 |
0.9 |
1.1* |
1.2* |
|
|
Histopathological findings |
||||||
|
Sternum, marrow hyperplasia (%) |
Males |
16 |
10 |
8 |
60* |
72* |
|
Females |
4 |
6 |
2 |
6 |
2 |
|
|
Sternum, erythroid hyperplasia (%) |
Males |
4 |
6 |
26* |
38* |
30* |
|
Females |
1 |
2 |
12* |
22* |
26* |
|
|
Liver, pigmented macrophages (%) |
Males |
22 |
20 |
50* |
82* |
72* |
|
Females |
26 |
38 |
74* |
80* |
86* |
|
|
Spleen, pigmented macrophages (%) |
Males |
66 |
84 |
86 |
88 |
74 |
|
Females |
80 |
90 |
100 |
94 |
100 |
|
|
Stomach, acanthosis or hyperkeratosis (%) |
Males |
1 |
0 |
3 |
11* |
24* |
|
Stomach, gastritis (%) |
Males |
1 |
0 |
0 |
7* |
21* |
From Burdock et al. (1984)
* p < 0.05
No NOAEL for toxicity could be identified, as the increased methaemoglobin and sulfhaemoglobin concentrations at 160 ppm (equal to 7.1 mg/kg bw per day) were consistent with the pattern of toxicity of diflubenzuron seen at other doses. The NOAEL for carcinogenicity was the highest dietary concentration, 10 000 ppm (equal to 470 mg/kg bw per day) (Burdock et al., 1984).
Diflubenzuron has been tested for genotoxicity in an adequate range of studies in vitro and in vivo (Table 10). The overall quality of the studies was acceptable, positive controls giving satisfactorily positive results and the concentration ranges of diflubenzuron being sufficient to induce signs of toxicity or precipitation.
Table 10. Results of assays for genotoxicity with diflubenzuron
|
End-point |
Test system |
Concentration or dose |
Purity (%) |
Results |
Reference |
|
In vitro |
|||||
|
Reverse mutation |
S. typhimurium TA98, TA100, TA1535, TA1537, TA1538 |
0, 8, 40, 200, 1000 µg/plate |
96.9 |
Negative + S9 |
Koorn (1990) |
|
Reverse mutation |
S. typhimurium TA98, TA100, TA1535, TA1537, TA1538; Saccharomyces cerevisiae D4 |
0, 0.1, 1, 10, 500 µg/plate |
98.5 |
Negative + S9 |
Brusick & Weir (1977a) |
|
Reverse mutation |
S. typhimurium TA98, TA100, TA1537, TA1538 |
0, 10, 100, 1000 µg/plate |
> 99 |
Negative + S9 |
MacGregor et al. (1979) |
|
Forward mutation |
L5178Y mouse lymphoma cells |
0, 1, 5, 19, 38, 75, 150, 300 µg/ml |
> 99 |
Negative + S9 |
MacGregor et al. (1979) |
|
Cell transformation |
BALBc/3T3 cells |
0, 20, 40, 80, 160, 310 µg/ml |
98.5 |
Negative |
Brusick & Weir (1977b) |
|
Unscheduled DNA synthesis |
WI-38 human cells |
0, 50, 100, 500, 1000 µg/ml |
98.5 |
Negative +S9 |
Brusick & Weir (1977c) |
|
Unscheduled DNA synthesis |
Wistar rat hepatocytes(primary culture) |
0, 1, 3, 10, 33, 100, 333 µg/ml |
96.9 |
Negative |
Enninga (1990) |
|
Chromosomal aberrations |
Chinese hamster ovary cells |
0, 100, 150, 200, 250 µg/ml |
97.6 |
Negative +S9 |
Taalman & Hoorn (1986) |
|
In vivo |
|||||
|
Dominant lethal mutation |
Albino (CR) mice |
1000, 2000 mg/kg bw (in corn oil, intraperitoneally) |
NR |
Negative |
Arnold et al. (1974)a |
|
Micronuclei |
Swiss mice, bone marrow |
0, 15, 150, 1500 mg/kg bw (in corn oil, by gavage) |
> 99 |
Negative |
MacGregor et al. (1979) |
a
Not validated (IBT study)Diflubenzuron was not genotoxic in vitro (in the presence or absence of metabolic activation) or in vivo.
In a two-generation study, groups of 32 male and 32 female Crl:CD(SD)BR (VAF/Plus) rats (28 of each sex in the F1 generation) received diets containing diflubenzuron (purity, 97.1%) at a concentration of 0, 500, 5000 or 50 000 ppm, 70 days before mating (1:1). The animals were examined routinely for clinical signs and body weight. Litters were culled, when possible, to four of each sex on day 4. Blood samples for haematological examination were taken from F0 and F1 parents before sacrifice. All pups and parental animals were examined grossly, whereas histopathological examinations were limited to the reproductive organs, liver and spleen of parental animals. Routine investigations of reproductive performance were supplemented with evaluations of developmental end-points including surface righting reflex, startle reflex, air righting reflex, vaginal opening and preputial separation.
The homogeneity and achieved concentrations of diflubenzuron in the diet were acceptable. The mean achieved intakes were 0, 42, 430 and 4300 mg/kg bw per day for males and 0, 36, 360 and 3800 mg/kg bw per day for females. Two deaths occurred, of a male at the highest dose and a female at the lowest, neither of which appeared to be related to treatment. The only clinical sign associated with treatment was pale faeces at the highest dose. Animals at this dose had reduced food consumption at week 1, but not subsequently. Water consumption was increased in all treated groups, but this was considered to be secondary to the high concentrations of diflubenzuron in the diet and not biologically significant. Reproductive parameters and sperm quality and quantity were not impaired by exposure to diflubenzuron. Pup weights were reduced in a dose-related manner in the F0 generation, but not in the F1 generation, and the reduction achieved statistical significance (p < 0.05) between day 4 and weaning in animals at 50 000 ppm. The body-weight gain of treated animals after weaning was similar to or greater than that of controls. Attainment of the air righting reflex and startle response was enhanced slightly in diflubenzuron-treated F0 litters but unchanged in F1 animals. Statistically significant (p < 0.01) alterations in erythrocyte parameters and increases in lymphocyte counts and platelet numbers were seen in all parental groups. The spleen was the primary target organ, with increases in weight, congestion and haemosiderosis at all doses and an increase in the incidence of congested red pulp in F0 animals at the two higher doses. Increased incidences of centrilobular hepatocyte hypertrophy were seen in both generations at concentrations > 5000 ppm, and the prevalence of brown pigmentation of Kupfer cells was increased in all treated groups.
The only effect on reproductive outcome and pup development was a reduction in pup body-weight gain during lactation, with statistically significant decreases in F1 pup weights on days 4, 8 and 21 of lactation. The NOAEL for reproductive effects was 50 000 ppm, equal to 4300 mg/kg bw per day, the highest dose tested. The NOAEL for toxicity in offspring was 5000 ppm, equal to 430 mg/kg bw per day, on the basis of reductions in body weight at 50 000 ppm in the F0 generation (although the Meeting noted that haematological end-points and the spleen were not investigated in young animals). No NOAEL could be identified for toxicity in parent animals, as haematological effects consistent with those seen in other studies with diflubenzuron were observed at all doses (Brooker, 1995).
Rats
The developmental toxicity of diflubenzuron (purity, 97.6%) was investigated in groups of 24 timed-mated female Crl:CD(SD)BR rats which received the compound by gavage in 1% tragacanth at 0 or a limit dose of 1000 mg/kg bw per day on days 6–15 of gestation. The dams were killed on day 20 of gestation and examined grossly, and the uterine contents were removed. About 50% of the fetuses were examined by dissection, followed by staining with Alizarin red S for skeletal investigations; the remainder were examined by sectioning and dissection. There were no deaths or evidence of clinical signs in the dams. Maternal body weights and reproductive parameters were unaffected by treatment. The fetal weights and sex ratio were similar in control and treated groups. Two major malformations were seen in the offspring of treated dams: a conjoined twin and a pup with a short body, mal-rotated hind limbs and a horseshoe kidney. Conjoined twins are generally considered to be a pre-implantation event and as such would have occurred before the first dose of diflubenzuron. The abnormalities in the other pup had been seen in previous studies in the laboratory, and an isolated incidence was considered not to be related to treatment. The incidences of bilobed thoracic centra and retarded ossification of the third and sixth sternebrae were higher in the treated group than in concurrent controls, but were within the range in contemporary controls in other studies. The NOAELs for maternal toxicity, embryotoxicity, fetal toxicity and teratogenicity were at the limit dose of 1000 mg/kg bw per day (Kavanagh, 1988a).
Rabbits
Groups of 16 timed-mated female New Zealand white rabbits received diflubenzuron (purity, 97.6%) by gavage in 1% tragacanth at 0 or a limit dose of 1000 mg/kg bw per day on days 7–19 of gestation. The does were killed on day 28 of gestation and examined grossly, and the uterine contents were removed. Fetuses were examined by dissection, followed by staining with Alizarin red S for skeletal investigations. One control died, and one treated animal was killed because it decveloped hindlimb paralysis. The latter effect was considered unlikely to be related to treatment, as it was an isolated finding, and no lesions were found in nerves or muscles in other studies with diflubenzuron. Maternal clinical signs, body weights and reproductive parameters were unaffected by treatment. Fetal weights and sex ratios were similar in control and treated groups. The overall incidences of malformations and variations were lower in treated animals than in controls, with no significant increase for any individual finding. The NOAEL for maternal toxicity, embryotoxicity, fetal toxicity and teratogenicity were at the limit dose of 1000 mg/kg bw per day (Kavanagh, 1988b).
(f) Special studies: Toxicity of metabolites
The acute toxicity of 4-chlorophenylurea was investigated in male Fischer 344 rats as part of a study of metabolism. The rats were dosed once with 4-chlorophenylurea (purity, 99.3%) at 190, 220 or 230 mg/kg bw in 1% gum tragacanth. No deaths were seen at the two higher doses, but pronounced clinical signs of central nervous system depression (lethargy, ataxia, loss of righting reflex) were seen within 30 min of dosing. The rat given 190 mg/kg bw showed mild signs of central nervous system depression within 90 min of dosing. Chromodacryorrhoea lasting 36–48 h was seen in all animals.
No reports of adverse effects or poisoning incidents associated with diflubenzuron were found, and no adverse effects have been reported during field use (Dykstra, 2001).
Diflubenzuron has been produced in a plant in The Netherlands since 1973, where employees involved in its production and formulation undergo regular medical examinations, including haematological analyses. Although no actual exposures have been described, no disturbances in the health status of these employees were observed that could be linked to exposure to diflubenzuron (Dykstra, 2001).
Diflubenzuron administered orally is absorbed to a limited extent in mice, rats and cats, the extent of absorption decreasing with increasing dose, from about 30% at 5 mg/kg bw to < 5% at 100 mg/kg bw in rats. The rate of absorption is rapid, with peak blood concentrations of radiolabel at about 4 h in rats given 5 mg/kg bw per day. The highest concentrations were found initially in liver and fat; at 7 days, significant concentrations of radiolabel remained in liver (170 ng equivalents/g) and erythrocytes (200 ng equivalents/g). The concentration of radiolabel in plasma of rats given 5 mg/kg bw fell from about 700 ng equivalents/g at 4 h to 3 ng equivalents/g on day 7. Excretion was rapid, 80–98% of the dose being excreted within 24 h. Absorbed diflubenzuron was excreted primarily in urine, with involvement of biliary excretion and enterohepatic circulation.
Studies of the metabolism of diflubenzuron in rats showed inconsistent results, the reasons being unclear. Unchanged diflubenzuron was the only component excreted in significant quantities in faeces. The results of urinary analyses indicated that absorbed diflubenzuron is metabolized extensively before excretion in the urine. The primary metabolic steps are hydroxylation of the anilino ring, cleavage of the ureido bridge, and conjugation, mainly with sulfate.
4-Chlorophenylurea, a residue of diflubenzuron that occurs in rice, has not been detected in significant quantities in studies of metabolism in rats. Its toxicity was thus not assessed in studies in mammalian systems. After oral administration, 4-chlorophenylurea is both absorbed to a greater extent (about 95%) and is more acutely toxic than diflubenzuron, with an LD50 of 1100 mg/kg bw. The Meeting considered that 4-chlorophenylurea should be considered for inclusion in the residue definition. Another plant metabolite, diflurobenzoic acid, does occur in significant quantities in rats and has acute toxicity after oral administration similar to that of diflubenzuron (LD50, 4600 mg/kg bw). Its toxicity was therefore considered to have been assessed in studies with diflubenzuron.
4-Chloroaniline has been reported to be a minor metabolite of diflubenzuron in plants, but did not appear to be a metabolite in rats in the most recent study. 4-Chloroaniline has been reported to produce tumours in rats and mice at a dose of about 3 mg/kg bw per day and to give positive responses in some assays for genotoxicity in vitro (WHO, 1996). The Meeting concluded that it had insufficient information to assess the toxicity of 4-chloroaniline.
The LD50 of diflubenzuron administered orally was > 4600 mg/kg bw in mice and rats; WHO (1999) has classified diflubenzuron as ‘unlikely to present an acute hazard in normal use’. Diflubenzuron also had little toxicity in rats exposed dermally, with an LD50 of > 10 000 mg/kg bw, or by inhalation, with an LC50 > 2.8 mg/l of air. No clinical signs were seen in these studies. A single dose of 10 000 mg/kg bw of a 25% w/w formulation of diflubenzuron given by gavage to mice and rats induced a slight (less than two-fold) but statistically significant increase in methaemoglobin concentration. Those of sulf-haemoglobin and Heinz bodies were unaffected. Diflubenzuron did not significantly irritate the skin or eyes of rabbits and did not irritate the skin of guinea-pigs exposed in a Magnusson and Kligman ‘maximization’ study.
Diflubenzuron showed a consistent profile of toxicity after repeated oral administration to mice, rats, and dogs. In agreement with the studies of the distribution of radiolabel, the primary target of the toxicity of diflubenzuron was erythrocytes. The mechanism of the haematotoxicity of diflubenzuron has not been elucidated, but haematotoxicity is a common finding with pesticides like diflubenzuron that are transformed to halogenated phenylamido derivatives. The most sensitive early end-point was increased concentrations of methaemoglobin and sulf-haemoglobin. The Meeting concluded that, because methaemoglobinaemia and sulfhaemoglobinaemia occurred only after saturation of reduction processes, it was more appropriate to use the statistical significance and dose–response relationships in a study rather than to set a numerical cut-off for adversity. The NOAELs for increased concentrations of methaemoglobin and sulfhaemoglobin were 1.2 mg/kg bw per day for mice, 2 mg/kg bw per day for rats and 2 mg/kg bw per day for dogs. Reduced erythrocyte counts and volume fractions were associated with the increases in methaemoglobin and sulfhaemoglobin. Heinz bodies were seen at doses > 32 mg/kg bw per day in mice and > 50 mg/kg bw per day in dogs, but were not seen in rats. The haematological effects showed both time-related and dose-related trends, the NOAEL for methaemoglobinaemia in dogs being > 250 mg/kg bw per day at 4 weeks, 50 mg/kg bw per day at 13 weeks and 2 mg/kg bw per day at 26 weeks. The only clinical sign of note was blue–grey extremities in mice after 1 week at doses > 160 mg/kg bw per day and after 6 weeks at > 6.4 mg/kg bw per day.
The main gross and histological findings were associated with haematotoxicity. These comprised erythroid hyperplasia of the bone marrow of rats and dogs, enlarged spleens in all three species and increased pigment deposition in the spleens of mice and rats. Increased pigmentation of a variety of cell types was seen in the liver. An increase in the severity of chronic hepatitis was seen in all groups in a 90-day study in rats, the LOAEL being 8 mg/kg bw per day. The NOAELs for pathological findings were 6.4 mg/kg bw per day in mice, 2 mg/kg bw per day in rats and 2 mg/kg bw per day in dogs. In the 13-week study in dogs and a 91-week study in mice, increased total haemoglobin and reticulocyte counts, bone-marrow hyperplasia and increased erythroid:myeloid ratios indicated that the haematopoietic stem cells were not affected, and that there had been a compensatory response to the effects of diflubenzuron.
The carcinogenic potential of diflubenzuron was investigated in one study in mice and two studies in rats. The incidences of tumours were not increased in any of these studies, at dietary concentrations equal to 840 mg/kg bw per day in mice and 470 mg/kg bw per day in rats.
The genotoxicity of diflubenzuron was investigated in an adequate battery of tests in vitro and in vivo. Negative results were obtained in all the studies. The Meeting concluded that diflubenzuron is unlikely to be genotoxic.
In view of the negative findings in assays for genotoxicity and carcinogenicity, the Meeting concluded that diflubenzuron is unlikely to pose a carcinogenic risk to humans.
In a two-generation study of reproductive toxicity in rats, no adverse effects were found on sperm quality or quantity, reproductive performance, litter size or attainment of developmental landmarks at the highest dietary concentration. The NOAEL for reproductive toxicity was the highest dietary concentration, equal to an average intake of 3800 mg/kg bw per day for males and 4300 mg/kg bw per day for females. Reductions in pup weight gain during lactation were seen at the highest dose in the F0 generation, with a NOAEL for toxicity of 360 mg/kg bw per day. Adult animals showed toxic effects consistent with the findings in other studies with repeated doses, including alterations in erythrocyte parameters at all dietary concentrations; the LOAEL was 36 mg/kg bw per day. The absence of a clear NOAEL for general toxicity in adult animals was not considered in assessing diflubenzuron, as NOAELs for the same effects were available from other studies in adult animals.
The developmental toxicity of diflubenzuron was investigated in rats and rabbits. There was no evidence of overt maternal toxicity, fetotoxicity, or teratogenicity in either species at the highest dose of 1000 mg/kg bw per day. The Meeting concluded that diflubenzuron is not fetotoxic or teratogenic.
Samples from pups and weanling animals in the multigeneration study were not examined for haematological or histopathological end-points. However, the fact that young animals exposed at about 1000 times the overall NOAEL for haematological effects showed no overt evidence of toxicity provided a degree of reassurance that young animals are not significantly more sensitive to diflubenzuron than adults.
Routine medical monitoring (including haematology) of workers in the production and formulation of diflubenzuron over 25 years did not reveal any adverse effects attributable to the compound.
The Meeting concluded that the available database on diflubenzuron was adequate to characterize the potential hazards to fetuses, infants, and children
The Meeting re-confirmed the previously established ADI of 0–0.02 mg/kg bw, based on the NOAEL for haematological effects of 2 mg/kg bw per day in the 2-year studies in rats and the 52-week study in dogs.
The Meeting concluded that, although methaemoglobinaemia is potentially an acute effect, the overall toxicological profile of diflubenzuron indicates that establishment of an acute reference dose is unnecessary. The absorption of diflubenzuron declined with increasing doses, and its excretion was relatively rapid, which would tend to limit systemic concentrations after high acute doses. It is likely that a metabolite, rather than diflubenzuron per se, is responsible for the effects on erythrocytes. Diflubenzuron has very low acute toxicity when given by various routes (oral, dermal and inhalation). Only marginal increases (less than doubling) in methaemoglobin concentrations were seen in mice and rats given 10 000 mg/kg bw of a formulation of diflubenzuron, equivalent to 2500 mg/kg bw, which is above the limit doses used in toxicological tests. No developmental toxicity was seen when diflubenzuron was given at up to a limit dose of 1000 mg/kg bw per day. There was no evidence of neurotoxicity in routine studies of toxicity.
Levels relevant to risk assessment
|
Species |
Study |
Effect |
NOAEL |
LOAEL |
|
Mouse |
91-week study of toxicity and carcinogenicitya |
Toxicity |
16 ppm (equal to 1.2 mg/kg bw per day) |
80 ppm (equal to 6.4 mg/kg bw per day) |
|
Carcinogenicity |
10 000 ppmb (equal to 840 mg/kg bw per day |
|||
|
Rat |
104-week study of toxicity and carcinogenicitya, c |
Toxicity |
40 ppm (equivalent to 2 mg/kg bw per day) |
160 ppm (equivalent to 8 mg/kg bw per day) |
|
Carcinogenicity |
10 000 ppmb (equal to 470 mg/kg bw per day |
– |
||
|
Two-generation study of reproductive toxicitya |
Parental toxicity |
– |
500 ppmd (equal to 36 mg/kg bw per day) |
|
|
Reproductive toxicity |
50 000 ppmb (equal to 3800 mg/kg bw per day) |
- |
||
|
Offspring toxicity |
5000 ppm (equal to 360 mg/kg bw per day) |
50 000 ppm (equal to 3800 mg/kg bw per day) |
||
|
Study of developmental toxicitye |
Maternal toxicity |
1000 mg/kg bw per dayb |
||
|
Embryo- and fetotoxicity |
1000 mg/kg bw per dayb |
|||
|
Rabbit |
Developmental toxicitye |
Maternal toxicity |
1000 mg/kg bw per dayb |
- |
|
Embryo- and fetotoxicity |
1000 mg/kg bw per dayb |
- |
||
|
Dog |
52-week study of toxicityf |
Toxicity |
2 mg/kg bw per day |
10 mg/kg bw per day |
a
Dietb
Highest dose testedc
Two studies combinedd
Lowest dose testede
Gavagef
CapsuleEstimate of acceptable daily intake for humans
0–0.02 mg/kg bw
Estimate of acute reference dose
Unnecessary
Studies that would provide information useful for continued evaluation of the compound
Summary of critical end-points for diflubenzuron
|
Absorption, distribution, excretion, and metabolism in mammals |
|
|
Rate and extent of oral absorption |
Rapid, maximum plasma concentration of radiolabel at 4 h; limited, 30% of a 5 mg/kg bw dose in bile and urine; less absorption at 100 mg/kg bw |
|
Distribution |
Extensive, highest concentrations in liver and erythrocytes |
|
Potential for accumulation |
Generally low, but some potential in erythrocytes and liver |
|
Rate and extent of excretion |
> 90% in 48 h |
|
Metabolism in animals |
Hydroxylation of anilino ring and cleavage of ureido bridge |
|
Toxicologically significant compounds |
Diflubenzuron; 4-chlorophenylurea (plant metabolite) |
|
Acute toxicity |
|
|
Rat, LD50, oral |
> 4600 mg/kg bw |
|
Rat, LD50 , intraperitoneal |
Not applicable |
|
Rat, LD50, dermal |
> 10 000 mg/kg bw |
|
Skin sensitization |
Negative, Magnusson and Kligman |
|
Short-term toxicity |
|
|
Target/critical effect |
Erythrocytes |
|
Lowest relevant oral NOAEL |
2 mg/kg bw per day (52-week study, dogs) |
|
Genotoxicity |
No genotoxic potential |
|
Long-term toxicity and carcinogenicity |
|
|
Target/critical effect |
Erythrocytes |
|
Lowest relevant NOAEL |
2 mg/kg bw per day (2-year study, rats) |
|
Carcinogenicity |
No carcinogenic potential |
|
Reproductive toxicity |
|
|
Reproduction target/critical effect |
None |
|
Lowest relevant reproductive NOAEL |
360 mg/kg bw per day; pup weight gain (rats) |
|
Developmental target/critical effect |
None |
|
Lowest relevant developmental NOAEL |
> 1000 mg/kg bw per day (rats and rabbits) |
|
Neurotoxicity |
No concern from other studies |
|
Medical data |
No adverse effects reported |
|
Summary |
Value |
Study |
Safety factor |
|
ADI |
0–0.02 |
2-year studies in rats and dogs |
100 |
|
Acute RfD |
Unnecessary |
|
|
Andre, J.C. (1996) Dermal absorption of 14C-diflubenzuron by male Sprague-Dawley rats. Unpublished report No. 6615-95-0275-AM-001 from Ricerca Inc., Ohio, USA. Submitted to WHO by Uniroyal Chemical Co. Inc., Bethany, CT, USA. GLP; FIFRA test guideline 85-3.
Arnold, D., Kennedy, G.L. & Keplinger, M.L. (1974) Mutagenic study with TH6040 in albino mice. Unpublished report No 622-05068 from Industrial Biotest Laboratories, Inc., USA. Submitted to WHO by Uniroyal Chemical Co. Inc., Bethany, CT, USA. (Not validated, but malpractice has not been linked with genotoxicity data from IBT).
Berczy, Z.S., Cobb, L.M. & Cherry, C.P. (1973) Acute inhalation toxicity to the rat of DU 112307 technical grade powder. Unpublished report No. PDR74/73849 from Huntingdon Research Centre, England. Submitted to WHO by Uniroyal Chemical Co. Inc., Bethany, CT, USA.
Brooker, A.J. (1995) Diflubenzuron technical. The effect on reproductive function of two generations of the rat. Unpublished report No. PDR 569/932539 from Huntingdon Research Centre, England. Submitted to WHO by Uniroyal Chemical Co. Inc., Bethany, CT, USA. GLP; OECD test guideline 416 & FIFRA 83-4.
Brusick, D. & Weir, R.J. (1977a) Mutagenicity evaluation of diflubenzuron technical batch FL 44/605201. Unpublished report No. 2683 from Litton Bionetics Inc., USA. Submitted to WHO by Uniroyal Chemical Co. Inc., Bethany, CT, USA.
Brusick, D. & Weir, R.J. (1977b) Evaluation of diflubenzuron. In vitro malignant transformation in Balb/3T3 cells. Unpublished report No. 2683 from Litton Bionetics, Inc., USA. Submitted to WHO by Uniroyal Chemical Co. Inc., Bethany, CT, USA.
Brusick, D. & Weir, R.J. (1977c) Evaluation of diflubenzuron. Unscheduled DNA synthesis in WI-38 cells. Unpublished report No. 2688from Litton Bionetics, Inc., USA. Submitted to WHO by Uniroyal Chemical Co. Inc., Bethany, CT, USA.
Burdock, G.A., Serota, D.G., Purvis, D, Andrews, J.P., Alsaker, R.D., Wentz, K.A. & Reno, I.E. (1980) Subchronic dietary toxicity study in rats. Diflubenzuron.. Unpublished report No. 553-119 from Hazleton Laboratories America, Inc., USA. Submitted to WHO by Uniroyal Chemical Co. Inc., Bethany, CT, USA. GLP.
Burdock, G.A., Wolfe, G.W., Hepner, K.E., Alsaker, R.D., Koka, M. & Phipps, R.B. (1984) Oncogenicity study in rats: Diflubenzuron. Project 553-122. Unpublished report No. 56645/08/1984 from Hazleton Laboratories America, Inc., USA. Submitted to WHO by Uniroyal Chemical Co. Inc., Bethany, CT, USA. GLP; unspecified FIFRA guideline.
Cameron, B.D., Henderson, A. & McGuire, G.M. (1990) The metabolism of [14C] diflubenzuron in the rat: Profiling of radioactivity in urine, feces and bile. Project No. 139768. Unpublished report No. 6255 from Inveresk Research International, Scotland. Submitted to WHO by Uniroyal Chemical Co. Inc., Bethany, CT, USA. GLP.
Chesterman, H., Heywood, R., Barker, M.H., Street, A.E. & Cherry, C.P. (1974) Du 112307. Toxicity in repeated dietary administration to beagle dogs (Repeated administration for 13 weeks). Unpublished report No. PDR169/74157 from Huntingdon Research Centre, England. Submitted to WHO by Uniroyal Chemical Co. Inc., Bethany, CT, USA.
Colley, J. & Offer, J.M. (1977). Effects of DU112307 in dietary administration to rats for 104 weeks: revaluated pathology data. Unpublished report No. PDR 171/75945 from Huntingdon Research Centre, England. Submitted to WHO by Uniroyal Chemical Co. Inc., Bethany, CT, USA.
Colley, J., Heywood, R., Street, A.E. & Gopinath, C. (1984) The effects of diflubenzuron given by oral administration with the feed on toxicity and tumor development in male and female HC/CFLP mice. Unpublished report No. PDR 360/831096/A from Huntingdon Research Centre, England. Submitted to WHO by Uniroyal Chemical Co. Inc., Bethany, CT, USA. GLP.
Davies, R.E. & Liggett, M.P. (1973) Irritant effects of DU 112307 (technical) on rabbit eye mucosa. Unpublished report No. 2170/176D/73 from Huntingdon Research Centre, England. Submitted to WHO by Uniroyal Chemical Co. Inc., Bethany, CT, USA. US FDA 191.12.
Dunsire, J.P., Cameron, B.D. & Spiers, G.C. (1990) The disposition of [14C] diflubenzuron in the rat (study performed to Japanese guidelines), Project No. 139197. Unpublished report No. 4924 by Inveresk Research International, Scotland.. Submitted to WHO by Uniroyal Chemical Co. Inc., Bethany, CT, USA. GLP; to unspecified Japanese test guideline.
Dykstra, A.C. (2001) Diflubenzuron—JMPR answers to a toxicology review. Unpublished report Submitted to WHO by Uniroyal Chemical Co. Inc., Bethany, CT, USA.
van Eldik, A. (1973) Acute toxicity studies with DU 112307 in mice and rats.. Unpublished report No. 56645/14/73 from Philips-Duphar, Netherlands. Submitted to WHO by Uniroyal Chemical Co. Inc., Bethany, CT, USA.
Enninga, I.C. (1990) Evaluation of DNA repair inducing ability of diflubenzuron in a primary culture of rat hepatocytes (with independent repeat). Unpublished report No. 002418 from RCC Notox BV Netherlands. Submitted to WHO by Uniroyal Chemical Co. Inc., Bethany, CT, USA. GLP: OECD test guideline 482 and FIFRA 798.5550.
Gay, M.H., Wang, R. & Long, S.K, (1999) Metabolism of [U-14C-phenyl]-4-chlorophenylurea by male Fisher rats, Project 98203P. Unpublished report from Uniroyal Chemical Co. Inc., CT, USA. Submitted to WHO by Uniroyal Chemical Co. Inc., Bethany, CT, USA. GLP? No QA signature.
Goldenthal, E.I. (1996) 21-day dermal toxicity study in rats. Unpublished report No. 399-186 from MPI Research, USA. Submitted to WHO by Uniroyal Chemical Co. Inc., Bethany, CT, USA. GLP; FIFRA test guideline 82-2.
Goodman, D.G. (1980) Histopathologic evaluation of rats administered diflubenzuron in the diet Unpublished report No. DI- 4279 from Clement Associates Inc., Washington, USA. Submitted to WHO by Uniroyal Chemical Co. Inc., Bethany, CT, USA.
Greenough, R.J. Goburdhun, R., Hudson, R. et al. (1985) Diflubenzuron. 52-week oral toxicity study in dogs. Unpublished report No. 2728 from Inveresk Research International, Scotland. Submitted to WHO by Uniroyal Chemical Co. Inc., Bethany, CT, USA. QA.
Hawkins, D.R., Jackson, A.J.S. & Roberts, N.L. (1980) Excretion of radioactivity after oral administration of 3H/14C-diflubenzuron to cats. Unpublished report No. PDR302/80443 from Huntingdon Research Centre, England. Submitted to WHO by Uniroyal Chemical Co. Inc., Bethany, CT, USA.
Hunter, B., Colley, J., Street, A.E., Heywood, R., Prentice, D.E. & Otter, J. (1976) Effects of DU112307 in dietary administration to rats for 104 weeks. Unpublished report No. PDR 171/75945 from Huntingdon Research Centre, England. Submitted to WHO by Uniroyal Chemical Co. Inc., Bethany, CT, USA.
Kavanagh, P. (1988a) Diflubenzuron. Oral (gavage) rat teratology limit study. Unpublished report No. PHD/11/87 from Toxicol Laboratories Ltd, England. Submitted to WHO by Uniroyal Chemical Co. Inc., Bethany, CT, USA. GLP; FIFRA 83-3.
Kavanagh, P. (1988b) Diflubenzuron. Oral (gavage) rabbit teratology limit study. Unpublished report No. PHD/12/87 from Toxicol Laboratories Ltd, England. Submitted to WHO by Uniroyal Chemical Co. Inc., Bethany, CT, USA. GLP; FIFRA 83-3.
Keet, C.M.J.F. (1977a) The effect of DU112307 WP 25% on the met-haemoglobin, sulph-haemoglobin levels and Heinz body formation after a single oral administration in male mice Unpublished report No. 56645/12/77 from Philips Duphar, Netherlands. Submitted to WHO by Uniroyal Chemical Co. Inc., Bethany, CT, USA.
Keet, C.M.J.F. (1977b) The effect of DU112307 WP 25% on the met-haemoglobin, sulph-haemoglobin and Heinz body formation after a single oral administration in rats. Unpublished report No. 56645/32/77 from Philips Duphar, Netherlands. Submitted to WHO by Uniroyal Chemical Co. Inc., Bethany, CT, USA.
Koopman, T.S.M. (1977) Acute dermal toxicity study with DU 112307 (technical) in rats., Unpublished report No. 56645/7/77 from Philips-Duphar, Netherlands. Submitted to WHO by Uniroyal Chemical Co. Inc., Bethany, CT, USA.
Koorn, J.C. (1990) Study to examine the possible mutagenic activity of diflubenzuron in the Ames Salmonella/microsome assay. Unpublished report No. 56645/74/90 from Duphar BV, Netherlands. Submitted to WHO by Uniroyal Chemical Co. Inc., Bethany, CT, USA. GLP.
de Lange, N. (1979) Diflubenzuron: Dermal absorption in the rabbit. Unpublished report No. 56654/9/79 from Duphar BV, Netherlands. Submitted to WHO by Uniroyal Chemical Co. Inc., Bethany, CT, USA.
MacGregor, J.T. Gould, D.H., Mitchell, A.D. & Sterling, G.P. (1979) Mutagenicity tests of diflubenzuron in the micronucleus test in E4 mice, the L5178Y mouse lymphoma forward mutation assay and the Ames Salmonella reverse mutation assay. Mutat. Res., 66, 45–53.
Newton, P.E. (1999) A 4-week inhalation toxicity study of Dimilin technical in rats. Unpublished report No. 399-205 from MPI Research, MI, USA. Submitted to WHO by Uniroyal Chemical Co. Inc., Bethany, CT, USA. GLP.
Prinsen, M.K. (1992) Sensitization study with diflubenzuron technical in guinea pigs (maximization test). Unpublished report No. B 91-0063/04 from TNO Nutrition and Food Research, Netherlands. Submitted to WHO by Uniroyal Chemical Co. Inc., Bethany, CT, USA. GLP; FIFRA 81-6.
Taalman, R.D.F.M. & Hoorn, A.J.W. (1986) Mutagenicity evaluation of diflubenzuron technical in an in vitro cytogenetic assay measuring chromosome aberration frequencies in Chinese hamster ovary (CHO) cells. Unpublished report No. 56645/36/1986 from Hazleton Biotechnologies, Netherlands.. Submitted to WHO by Uniroyal Chemical Co. Inc., Bethany, CT, USA. GLP; FIFRA guideline 84-2.
Taylor, R.E. (1973) Primary skin irritation study. Unpublished report No. Doos 136 from Harris Laboratories, USA. Submitted to WHO by Uniroyal Chemical Co. Inc., Bethany, CT, USA. US 191.11
WHO (1996) Diflubenzuron (WHO Environmental Health Criteria 184), Geneva.
WHO (1999) Recommended Classification of Pesticides by Hazard and Guidelines to Classification 1998–1999 (WHO/PCS/98.21/Rev. 1), Geneva, International Programme on Chemical Safety.
Wang, R. & Gay, M.H. (1999) Metabolism of [U-14C-anilino]-diflubenzuron by male Fisher rats, Project 98246P. Unpublished report from Uniroyal Chemical Co. Inc., CT, USA. Submitted to WHO by Uniroyal Chemical Co. Inc., Bethany, CT, USA. GLP? No QA signature; OPPTS 870.7485.
    See Also:
       Toxicological Abbreviations
       Diflubenzuron (EHC 184, 1996)
       Diflubenzuron (HSG 99, 1995)
       Diflubenzuron (Pesticide residues in food: 1981 evaluations)
       Diflubenzuron (Pesticide residues in food: 1983 evaluations)
       Diflubenzuron (Pesticide residues in food: 1984 evaluations)
       Diflubenzuron (Pesticide residues in food: 1985 evaluations Part II Toxicology)