
First draft prepared by
Richard A. Canady1, Raymond D. Coker2, S. Kathleen Egan1, Rudolf Krska3, Tine Kuiper-Goodman4, Monica Olsen5, James Pestka6, Silvia Resnik7 and Josef Schlatter8
1 Food and Drug Administration, Washington DC, USA
2
University of Greenwich, Kent, United Kingdom3
Tulln Institute for Agrobiotechnology, Centre for Analytical Chemistry, Tulln, Austria4
Health Canada, Ottawa, Canada5
National Food Administration, Uppsala, Sweden6
University of Michigan, Ann Arbor, Michigan, USA7
Commission for Scientific Research, University of Buenos Aires, Argentina8
Swiss Federal Office of Public Health, Zürich, SwitzerlandDeoxynivalenol (DON, vomitoxin) is a type B trichothecene, an epoxy-sesquiter-penoid. This mycotoxin occurs predominantly in grains such as wheat, barley, oats, rye, and maize, and less often in rice, sorghum, and triticale. The occurrence of deoxynivalenol is associated primarily with Fusarium graminearum (Gibberella zeae) and F. culmorum, both of which are important plant pathogens which cause Fusarium head blight in wheat and Gibberella ear rot in maize. A direct relationship between the incidence of Fusarium head blight and contamination of wheat with deoxynivalenol has been established. The incidence of Fusarium head blight is strongly associated with moisture at the time of flowering (anthesis), and the timing of rainfall, rather than the amount, is the most critical factor. F. graminearum grows optimally at a temperature of 25 °C and at a water activity above 0.88. F. culmorum grows optimally at 21 °C and at a water activity above 0.87. The geographical distribution of the two species appears to be related to temperature, F. graminearum being the commoner species and occurring in warmer climates. Deoxynivalenol has been implicated in incidents of mycotoxicoses in both humans and farm animals. The Committee has not previously evaluated this toxin.
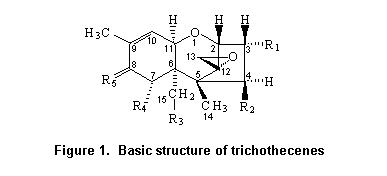
Most trichothecenes have a double bond at position C-9,10, a 12,13-epoxide ring, and a number of hydroxyl and acetoxy groups. The basic structure is shown in Figure 1. Trichothecenes can be divided into four types (A–D) according to characteristic functional groups. T-2 and HT-2 toxins are type A trichothecenes with an oxygen function different from a carbonyl function at the C-8 position. Type B trichothecenes have a carbonyl function at this position. The most frequently detected mycotoxin of this category is deoxynivalenol. Type C trichothecenes are characterized by a second epoxide function at C-7,8 or C-9,10, whereas type D include trichothecenes containing a macro cyclic ring between C-4 and C-15 with two ester linkages.
Trichothecenes are stable at 120 °C, moderately stable at 180 °C, and decompose within 30–40 min at 210 °C.
(a) Gastrointestinal metabolism
Cultures of 20% w/w suspensions of rat caecal contents were incubated anaerobically with [14C]deoxynivalenol at a concentration of 35 µg/ml for up to 24 h. A standard-co-elution method involving high-performance liquid chromatography (HPLC) was used to quantify the proportions of radiolabel associated with deoxynivalenol and with the de-epoxidated form. The latter represented 1.3% of the administered radiolabel immediately after addition of deoxynivalenol, 29% at 7 h, and 90% at 24 h; 60% co-eluted with deoxynivalenol at 7 h and 2% at 24 h (Worrell et al., 1989).
The metabolism of deoxynivalenol by intestinal flora was examined in extracts of porcine duodenum, jejunum, caecum, colon, and rectum after addition of 0.3 mg to 10 ml of pre-incubated suspensions containing 1 g of intestinal contents and anaerobic incubation for 24 h. The rate of recovery of deoxynivalenol was compared with that from inactivated suspensions that had been heated to 121 °C for 35 min before incubation with deoxynivalenol for 24 h. The only metabolite was identified by gas–liquid chromatography–mass spectometry (MS) as a de-epoxy derivative. Differences in the rates of metabolism were seen between active and inactivated suspensions from caecum, colon, and rectum but not those from duodenum and jejunum. The greatest de-epoxidation activity was seen in colon, and only 1% of the applied dose was recovered as deoxynivalenol from the active suspension (Kollarczik et al., 1994).
Deoxynivalenol was not converted to the de-epoxy metabolite in cultures of the contents of pig large intestine (including caecum, but not otherwise specified) in another study in which 1 ml of a 1-µg/ml solution of deoxynivalenol was added to 2 g of large intestinal contents and incubated anaerobically for 96 h. Nearly complete recovery of intact deoxynivalenol was reported. The intestinal contents of chickens treated identically showed nearly complete conversion of deoxynivalenol to the de-epoxy metabolite after 96 h. After 24 h of incubation, the rate of conversion was 56% of an applied concentration of 0.014 µg/ml, 69% of 0.14 µg/ml, and 70% of 1.4 µg/ml. Similarly, 35% of the applied deoxynivalenol was metabolized to the de-epoxy metabolite in bovine rumenal fluid after 96 h of incubation (He et al., 1992).
No metabolism of deoxynivalenol was observed in pigs dosed intragastrically with [14C]deoxynivalenol. The total recovery of radiolabel from faeces, urine, and bile of an intragastric dose of 0.6 mg/kg bw 24 h after dosing ranged from 82 to 100% for three pigs. No metabolites of deoxynivalenol were observed by gas chromatography (GC)–MS (Prelusky et al., 1988).
Deoxynivalenol did not disappear from 3-h cultures of sheep or cattle rumen after addition at a concentration of 2.5 mg/L to a 50% v/v solution of rumenal fluid and buffer (total volume, 10 ml), when metabolism was determined after incubation for 0.5, 1, 2, or 3 h. GC (flame ionization detector) was used to measure the disappearance of deoxynivalenol (Kiessling et al., 1984). Few details of the results were reported, and limitations in study design and analytical methods may have hampered observation of the metabolism of deoxynivalenol. The standard rate of recovery was reported to be only 43%, and the detection limit was 2 µg. The results of only three determinations after a 3-h incubation with sheep rumenal fluid were reported, and the results with bovine rumenal fluid were not reported.
In contrast, a decrease in deoxynivalenol concentration was reported after 6 h of incubation with bovine rumenal fluid, with nearly complete disappearance by 24 h of concentrations of 5 and 10 mg/L of culture medium. The concentrations also decreased after initial concentrations of deoxynivalenol of 50 and 100 mg/L in culture, but complete disappearance was not seen at 48 h. Analysis was conducted by HPLC and gas–liquid chromatography (King et al., 1984a).
(b) Bioavailability
Although deoxynivalenol appeared in the blood within 30 min after intake by sheep, the systemic bioavailability was only 7.5%. A single dose of 5 mg/kg bw of deoxynivalenol was administered by oral intubation to four 1-year-old male sheep, and repeated blood samples were taken over 30 h. Deoxynivalenol and the de-epoxy metabolite were determined by GC with electron capture detection (ECD). No deoxynivalenol or the de-epoxy metabolite could be detected in plasma within the 30-h observation period. Three male sheep were given a single intravenous dose of deoxynivalenol at 0.5 mg/kg bw, with blood sampling and analysis as after oral dosing. Systemic bioavailability was calculated from the ratio of the integrated area under the concentration–time curve times the dose for both oral and intravenous administration. Less than 0.3% of the oral dose and less than 2% of the intravenous dose was detected in plasma as the de-epoxy metabolite. Free deoxynivalenol accounted for an average of 24.8% of the absorbed dose measured in blood; the remainder was made up of the de-epoxy metabolite or the glucuronide conjugate of deoxynivalenol (Prelusky et al., 1985).
The oral absorption rate of deoxynivalenol in sheep was approximately 7% on the basis of recovery rates from urine and bile collected over 36 h from two sheep given 5 mg/kg bw of deoxynivalenol orally. Deoxynivalenol and the de-epoxy metabolite were analysed by GC–ECD. An average of 6.9% of the administered dose was recovered from urine and 0.11% from bile. Glucuronide-conjugated de-epoxy metabolite was the only form detected in bile (detection limit, 0.1 mg, corresponding to 0.04% of the administered dose). An average of 1.3% of the administered dose was recovered from urine as the de-epoxy metabolite or its conjugate, and 5.7% was recovered as deoxynivalenol or its conjugate (Prelusky et al., 1986a).
Rapid appearance of deoxynivalenol in blood was also observed in two dairy cows given a single oral dose of 920 mg of deoxynivalenol (equivalent to 1.84 mg/kg bw). Although the absolute bioavailability was not determined in this study, the serum concentrations (peak of 20 ng/ml at 4.7 h in one cow) and clearance from plasma to below the detection limit within 24 h suggested low systemic bioavailability. The concentrations of deoxynivalenol and the de-epoxy metabolite were measured by GC–MS (Prelusky et al., 1984).
In contrast to the low bioavailability seen in sheep and cows, relatively high bioavailability was observed in pigs. Blood, urine, bile, and faeces were collected over 24 h after an intragastric dose of 0.6 mg/kg bw of [14C]deoxynivalenol or an intravenous dose of 0.3 mg/kg bw. The proportions of radiolabel were assumed to represent those of administered deoxynivalenol, and the validity of this assumption was confirmed by GC–MS, which showed very little metabolism or conjugation. On the basis of measurements of the integrated area under the concentration–time curve for three animals treated intravenously and three treated intragastrically, the average systemic bioavailability of deoxynivalenol in pigs was estimated to be 55%. Approximately 95% of the administered dose was recovered as deoxynivalenol; the amount recovered as conjugated deoxynivalenol or as other metabolites was not reported quantitatively (Prelusky et al., 1988).
Although the absolute bioavailability of deoxynivalenol has not been measured in rats, 25% of an oral dose of 10 mg/kg bw was recovered in urine at 96 h, suggesting that the absorption rate in rats may be higher than in sheep or cows. HPLC and GC–MS analysis indicated that 25% of the radiolabel in 0–24-h urine was associated with unchanged deoxynivalenol and 10% with the de-epoxy metabolite (Lake et al., 1987). Similarly, 4.5 and 4.4% of an orally administered dose of 6 mg/kg bw was recovered in the urine of Wistar rats as free deoxynivalenol and the de-epoxy metabolite, respectively, within 96 h (Yoshizawa et al., 1983).
(c) Distribution
The distribution of [14C]deoxynivalenol was measured after a single oral dose of 2.2 mg in chickens (equivalent to 1.3–1.7 mg/kg bw on the basis of the reported body weights). The average distribution, measured as distintegrations per minute per gram of wet tissue (dpm/g), was 416 in blood, 570 in plasma, and 4345 in bile, and 19 in cutaneous fat, 10 in abdominal fat, 5 in breast muscle, 5.3 in thigh muscle, 91 in spleen, 205 in liver, 27 in heart, 733 in kidney, 21 in brain, and 5 in oviduct at 3 h. At 72 h, the average distribution was 0 dpm/g in blood, 0 in plasma, and 661 in bile, and 10 in cutaneous fat, 9.8 in abdominal fat, 0.5 in breast muscle, 2 in thigh muscle, 8 in spleen, 10 in liver, 0 in heart, 18 in kidney, 0 in brain, and 2 in oviduct. Radiolabel was observed only in cutaneous fat, kidney, gizzard, and bile 96 h after administration of [14C]deoxynivalenol. The tissue distribution after continuous intake of 2.2 mg/bird per day from the feed for 2, 4, or 6 days was similar to that after a single oral dose (Prelusky et al., 1986b).
A single intravenous injection of deoxynivalenol at 1 mg/kg bw to pigs resulted in substantially higher initial concentrations in plasma, kidney, and liver than in other tissues. Analysis by HPLC–MS 3 h after injection showed concentrations of 550 ng/g of plasma, 930 ng/g of kidney, 440 ng/g of liver, 330 ng/g of abdominal fat, 130 ng/g of back fat, 140 ng/g of lymph, 78 ng/g of lung, 69 ng/g of adrenals, 74 ng/g of spleen, 54 ng/g of testis, 29 ng/g of brain, 11 ng/g of heart, 19 ng/g of muscle, 16 ng/g of skin, 5 ng/g of intestine, and 4 ng/g of pancreas. At 24 h after injection, the concentrations were 18 ng/g in plasma, 10 ng/g in kidney, 8.2 ng/g in liver, 3.4 ng/g in abdominal fat, 12 ng/g in back fat, 0.8 ng/g in lymph, and 1 ng/g in lung, with none in the other tissues examined (Prelusky & Trenholm, 1991).
(d) Excretion
Excretion of deoxynivalenol and the de-epoxy metabolite after a 10-mg/kg oral dose of [14C]deoxynivalenol was examined in male PVG rats. At 96 h, 25% of the administered radiolabel was recovered in urine, 64% in faeces, and 0.11% in expired air (Lake et al., 1987).
Rapid elimination was reported of an oral dose of 2.2 mg of [14C]deoxynivalenol in chickens (equivalent to 1.3–1.7 mg/kg bw on the basis of the reported body weights). Recovery of radiolabel in excreta accounted for 79, 92, and 98% of the administered dose by 24, 48, and 72 h, respectively (Prelusky et al., 1986b).
A plasma elimination half-time of 3.9 h was reported after intravenous administration of deoxynivalenol to pigs at 1 mg/kg bw. The compound was recovered in bile and urine, as analysed by HPLC–MS (Prelusky & Trenholm, 1991).
A single dose of 5 mg/kg bw of deoxynivalenol was administered by oral intubation to four 1-year old male sheep, and repeated blood samples were taken over 30 h. Analysis for deoxynivalenol and the de-epoxy metabolite by GC–ECD showed complete elimination from plasma within 30 h. In three male sheep given a single intravenous dose of 0.5 mg/kg bw, with blood sampling and analysis as above, the half-life of elimination from plasma was 100–125 min (Prelusky et al., 1985).
Urine and bile were collected over 36 h from two sheep dosed orally with deoxynivalenol at 5 mg/kg bw. Deoxynivalenol and the de-epoxy metabolite were determined by GC–ECD. An average of 6.9% of the administered dose was recovered from urine, 0.11% from bile, and 64% from faeces (Prelusky et al., 1986a).
Two ewes were given an intravenous dose of [14C]deoxynivalenol at 4 mg/kg bw, and excretion in urine and bile was monitored over 24 h. An average of 91% of the administered radiolabel was recovered in urine and 6% in bile (Prelusky et al., 1987a).
Blood, urine, bile, and faeces were collected from pigs over 24 h after an intragastric dose of [14C]deoxynivalenol at 0.6 mg/kg bw or an intravenous dose of 0.3 mg/kg bw. After intravenous dosing, an average of 3.8% of the administered radiolabel was recovered in bile, < 0.3% in faeces, and 93% in urine. After oral dosing, bile accounted for an average of 2.5% of the administered dose, urine for 68%, and faeces for 20%. After oral intake, the peak concentration in plasma was reached within 15–30 min, remained elevated for about 9 h and then declined with a half-time of 7.1 h (Prelusky et al., 1988).
(e) Transmission into eggs and milk
Transmission of deoxynivalenol into eggs was studied in laying hens. Each hen was given a single oral dose of [14C]deoxynivalenol at 2.2 mg (equal to 1.3–1.7 mg/kg bw). The maximum amount of radiolabel in the first eggs laid within 24 h of dosing represented 0.087% of the administered dose (equal to 1.9 µg of deoxynivalenol or metabolites per egg). After repeated dosing for 6 days, the maximum amount of radiolabel per egg represented 0.19% of the administered daily dose (equal to 4.2 µg per egg of deoxynivalenol or metabolites) (Prelusky et al., 1987b).
Administration of feed containing [14C]deoxynivalenol at a concentration of 5.5 mg/kg over 65 days did not result in increased accumulation of deoxynivalenol or metabolites in chicken eggs. The maximum amount of radiolabel in eggs (equivalent to 1.7 µg of deoxynivalenol or metabolites per 60-g egg) was reached after 8 days of administration; the amount decreased slowly during subsequent weeks (Prelusky et al., 1989).
Two ewes were given [14C]deoxynivalenol intravenously at a dose of 4 mg/kg bw, and excretion of radiolabel into the milk was monitored every 4 h over 48 h. Oxytocin was used to stimulate lactation. Less than 0.25% of the administered dose was recovered. Gas–liquid chromatography–MS analysis showed that conjugated de-epoxy metabolite made up most of the recovered radiolabel. The highest concentration of deoxynivalenol was 61 ng/ml (comprising conjugated and unconjugated compound in an approximately 2:1 ratio). The highest concentration of the de-epoxy metabolite was 1200 ng/ml (with conjugated and unconjugated material in a 3:1 to 5:1 ratio) (Prelusky et al., 1987a).
Low concentrations of free and conjugated deoxynivalenol were also found in cows’ milk collected twice daily after administration of a single oral dose of 920 mg of deoxynivalenol in Fusarium-contaminated maize. The amount of deoxynivalenol was quantified by HPLC. The highest concentration was 4 ng/ml, comprising both conjugated and free deoxynivalenol. The concentrations of the de-epoxy metabolite were not assessed (Prelusky et al., 1984).
Eighteen primiparous Holstein cows at 13–22 weeks of lactation were divided into six groups according to their stage of lactation and milk yield and were observed for 10 weeks to determine the effect of deoxynivalenol in the diet on milk yield and transfer of deoxynivalenol and its de-epoxy metabolite to milk. Contaminated maize was added to the diets to provide concentrations of deoxynivalenol of 0, 5, and 12 mg/kg of dry matter concentrate, and daily intakes of 0.001, 0.085, and 0.21 mg/kg bw. The animals were weighed during weeks –2, 0, 2, 4, 6, 8, and 10. Feed intake was recorded daily, and pooled milk samples (from morning and evening milkings) were analysed every 14 days. The condition of the animals was scored at the beginning of week 8. Increasing concentrations of deoxynivalenol in the diet did not affect the feed intake or total milk output, but the output of milk fat and fat were reduced in both groups given deoxynivalenol, with the greatest effect at the intermediate dietary concentration. Overall energy efficiency was not affected because the reduced energy output in milk was compensated by increased body weight gain. No transfer of deoxynivalenol or the de-epoxy metabolite to milk was observed at the detection limit of 5 ng/ml by HPLC–MS (Charmley et al., 1993).
De-epoxidation was shown in rats (Yoshizawa et al., 1983; Lake et al., 1987; Worrell et al., 1989) and in pigs (Kollarczik et al., 1994), whereas He et al. (1992) showed an absence of de-epoxidation in pigs. De-epoxidation and glucuronide conjugation were demonstrated in cows (Côté et al., 1986; Yoshizawa et al., 1986), and glucuronide conjugation was found in sheep (Prelusky et al., 1985).
The de-epoxy metabolite of deoxynivalenol was identified in the urine and faeces of male Wistar rats given oral doses of deoxynivalenol at 8–11 mg/kg bw (dose not otherwise specified; source of deoxynivalenol not specified). The compounds were quantified by gas–liquid chromatography and identified by GC–MS (Yoshizawa et al., 1983).
No microsomal metabolism of deoxynivalenol was observed in fractions of male rabbit or male Wistar rat liver (Ohta et al., 1978; Côté et al., 1987).
A single 5-mg/kg bw dose of deoxynivalenol was administered by oral intubation to four 1-year-old male sheep, and repeated blood samples were taken over 30 h. The presence of glucuronide-conjugated metabolites was deduced from an increase in the recovery of the de-epoxy metabolite or deoxynivalenol after treatment with beta-glucuronidase. Three further male sheep were each given a single intravenous dose of deoxynivalenol at 0.5 mg/kg bw, with blood sampling and analysis as for oral dosing. Less than 0.3% of the administered oral dose and less than 2% of the intravenous dose was detected in plasma as the de-epoxy metabolite. Free deoxynivalenol accounted for an average of 25% and conjugated deoxynivalenol for 73% of the dose in blood during the observation period. In animals dosed intravenously, conjugated deoxynivalenol accounted for an average of 20% of the dose in blood. The clearance times for conjugated deoxynivalenol were considerably longer than those for free deoxynivalenol (elimination half-times, < 125 min for deoxynivalenol and > 6 h for conjugated deoxynivalenol after oral administration) (Prelusky et al., 1985).
Urine and bile were collected over 36 h from two sheep given deoxynivalenol orally at a dose of 5 mg/kg bw. Glucuronide-conjugated de-epoxy metabolite was the only form detected in bile (detection limit, 0.1 mg, corresponding to 0.04% of the administered dose). In urine, an average of 1.3% of the administered dose was recovered as the de-epoxy metabolite, alone or conjugated, and 5.7% as parent or conjugated deoxynivalenol (Prelusky et al., 1986a).
Blood, urine, bile, and faeces were collected from pigs over 24 h after they were given [14C]deoxynivalenol intragastrically at a dose of 0.6 mg/kg bw or intravenously at a dose of 0.3 mg/ kg bw. GC–MS analysis for deoxynivalenol and metabolites showed little metabolism or conjugation. About 95% of the administered dose was recovered as deoxynivalenol; the amounts recovered as conjugated deoxynivalenol or as other metabolites were not reported quantitatively (Prelusky et al., 1988).
(a) Effect on nutrients
During a 6-week feeding trial in groups of 10 male NMRI mice, the effects of dietary administration of deoxynivalenol at 0, 0.1, 1, or 10 mg/kg, equivalent to 0.014, 0.14, and 1.4 mg/kg bw, on food consumption and weight gain were investigated. Food intake was similar in the four groups, but the weight gain in the group receiving 10 mg/kg was significantly (p < 0.01) reduced. At the end of the feeding period, the animals were killed, and absorption of water, D-glucose, L-leucine, L-tryptophan, 5-methyltetrahydrofolic acid, and iron was measured in perfused jejunal segments in vitro. No effects were observed on absorption of water, leucine, tryptophan, or iron, but at the dietary concentration of 10 mg/kg, a slight but significant (p < 0.05) reduction in glucose transfer was measured. Furthermore, the transfer and the tissue accumulation of 5-methyltetrahydrofolic acid in the jejunal segment were significantly decreased, by up to 50%. When the heavy metal and trace element content of the liver, kidney, and small intestine was determined, the manganese and molybdenum content in liver was reduced at the deoxynivalenol concentration of 10 mg/kg of diet. The authors concluded that ingestion of feed containing deoxynivalenol at concentrations that occur in contaminated food and feed results in impairment of intestinal transfer and uptake of nutrients such as glucose and 5-methyltetrahydrofolic acid (Hunder et al., 1991).
(b) Effects on macromolecular synthesis
Most trichothecenes inhibit protein synthesis, their potency depending on structural substituents and requiring an unsaturated bond at the C9–C10 position and integrity of the 12,13-epoxy ring. Trichothecenes bind to the 60S subunit of eukaryotic ribosomes and interfere with the activity of peptidyltransferase. Deoxynivalenol, which lacks a substituent at C-4, inhibits chain elongation (Ehrlich & Daigle, 1987; Betina, 1989). Inhibition of protein synthesis is considered to be the primary toxic effect of trichothecenes, including deoxynivalenol. The ID50 for inhibition of protein synthesis in rabbit reticulocytes was 2 µg/ml, while that for T-2 toxin was 0.03 µg/ml (reviewed by Sato & Ueno, 1977). In vitro, deoxynivalenol is about 100 times less toxic than T-2 toxin, which has been more widely studied for its macromolecular effects. Owing to differences in lipophilicity and other possible effects, the toxicity of deoxynivalenol in vivo is greater than would be expected from its effects on protein synthesis in vitro (Sato & Ueno, 1977; Thompson & Wannemacher, 1986).
The effects of deoxynivalenol on synthesis of protein, DNA, and RNA (studied with radiolabelled amino acids, [14C]uridine, and [3H]thymidine) in spleen slices taken from 8–10-week-old rats and cultured for 90 min in Krebs Ringer phosphate buffer at pH 7.4 was studied at concentrations of 100, 1000, and 10 000 ng/ml. The minimum effective concentration for inhibition of protein and DNA synthesis was 1000 ng/ml (72% and 53% inhibition, respectively), whereas RNA synthesis was stimulated at this concentration (Friedman et al., 1996).
The toxicity of deoxynivalenol has been reviewed by WHO (1990), IARC (1993), and Rotter et al. (1996). Risk assessments that included toxicological reviews of deoxynivalenol have been published for Canada (Kuiper-Goodman, 1985), the Nordic Council (Eriksen & Alexander, 1998), The Netherlands (Pieters et al., 1999), and the European Union (Commission of the European Union, 1999).
The acute symptoms of poisoning with trichothecenes are characterized by skin irritation, feed refusal, vomiting, diarrhoea, haemorrhage, neural disturbance, abortion. and death. The LD50 values for deoxynivalenol and its 3-acetyl and 15-acetyl metabolites administered orally are shown in Table 1. Studies of the emetic effects of deoxynivalenol are summarized in Table 2.
Table 1. Acute oral toxicity of deoxynivalenol and metabolites
|
Species and strain |
Route |
Compound |
LD50 |
Reference |
|
Mouse, ddy, |
Oral |
Deoxynivalenol |
46 |
Yoshizawa & Morooka (1974) |
|
Intraperitoneal |
|
70 |
||
|
Intraperitoneal |
|
77 |
||
|
Mouse, B6C3F1, weanling |
Oral |
Deoxynivalenol |
78 |
Forsell et al. (1987) |
|
Intraperitoneal |
|
49 |
||
|
Mouse |
Intraperitoneal |
Deoxynivalenol |
43 |
Thompson & Wannemacher (1986) |
|
Subcutaneous |
|
45 |
||
|
Mouse, ddy, |
Oral |
3-Acetyldeoxynivalenol |
34 |
Yoshizawa & Morooka (1974) |
|
Intraperitoneal |
|
49 |
||
|
Intraperitoneal |
|
47 |
||
|
Mouse, B6C3F1, weanling |
Oral |
15-Acetyldeoxynivalenol |
34 |
Forsell et al. (1987) |
|
Chicken, Cobb, broiler, female |
Oral |
Deoxynivalenol |
140 |
Huff et al. (1981) |
|
Duck, Peking |
Subcutaneous |
Deoxynivalenol |
27 |
Yoshizawa & Morooka (1974) |
Table 2. Results of studies of emesis in animals treated with deoxynivalenol
|
Species |
Route |
Purity |
ED50 |
LOEL |
NOEL |
Reference |
|
Pig, |
Feed |
Purified |
|
0.100 |
0.075 |
Forsyth et al. (1977) |
|
Intraperitoneal |
|
|
0.050 |
0.025 |
||
|
Pig, |
Feed |
Purified |
0.085 |
0.07 (2/6) |
0.035 |
Young et al. (1983) and personal communication |
|
|
|
(estimated) |
|
|
||
|
Pig, |
Feed |
Purified |
|
0.05 (1/3) |
0.025 |
Pestka et al. (1987a) |
|
Intraperitoneal |
|
|
0.05 (1/3) |
0.025 |
||
|
Pig, |
Cannula |
|
0.075 (2/6) |
0.05 (1/5) |
0.025 |
Prelusky & Trenholm (1993) and personal communication |
|
Intravenous |
|
0.020 (2/4) |
0.02 (2/4) |
0.015 |
||
|
Pig, 7.5 kg |
Feed |
Contaminated corn |
|
0.8 |
0.6 |
Young et al., (1983) |
|
Pig, 34 kg |
Feed |
Inoculated corn |
|
|
0.42 |
Friend et al. 1984) |
|
Dog, 2–3 kg |
Subcutaneous |
Purified |
|
0.10 |
|
Yoshizawa & Morooka (1974) |
|
Dog |
Feed wheat |
Contaminated |
|
0.45 |
0.3 |
Hughes et al. (1999) |
|
Cat |
Feed wheat |
Contaminated |
|
0.4 |
0.3 |
Hughes et al. (1999) |
a
Additional data on emesis obtained by personal communication from D. Prelusky, Agriculture Canada, 1994The minimum single dose (LOEL) of deoxynivalenol that induced vomiting (emesis) in groups of three to six pigs weighing 9–10 kg was 0.1 mg/kg bw when given by oral gavage (NOEL, 0.075 mg/kg bw) and 0.05 mg/kg bw when given intrapertioneally (NOEL, 0.025 mg/kg bw) (Forsyth et al., 1977).
The minimum single emetic doses of deoxynivalenol and 15-acetyldeoxynivalenol in groups of three Yorkshire pigs weighing 10–15 kg were 0.050 and 0.075 mg/kg bw, respectively, when given either by gavage or intraperitoneally. After gavage, three of 15 pigs given the 15-acetyl metabolite and four of 15 given deoxynivalenol showed emesis at all doses from 20 to 200 µg/kg bw. After intraperitoneal administration, nine of 15 pigs showed emesis at all doses. The NOELs were 0.025 mg/kg bw for deoxynivalenol and 0.050 mg/kg bw for the 15-acetyl metabolite after either oral intubation or intraperitoneal injection (Pestka et al., 1987a).
In a pilot study, the median emetic dose (ED50) of purified deoxynivalenol, administered by gavage to groups of two to six Yorkshire pigs weighing 28–51 kg was 0.088 mg/kg bw (Young et al., 1983). Additional data provided by D. Prelusky, Agriculture and Agrifoods, Canada, indicated that the LOEL in this study was 0.07 mg/kg bw (for the two pigs that responded, and the NOEL was 0.035 mg/kg bw.
The ED50 values after single doses of deoxynivalenol (> 96%pure) administered by cannula into the stomach or intravenously to groups of four to six Yorkshire pigs, weighing 12–25 kg, which had fasted for 4 h, were 75 and 20 mg/kg bw by the two routes, respectively (Prelusky & Trenholm, 1993). Additional data provided by D. Prelusky, Agriculture and Agrifoods, Canada, indicated that after oral administration the LOEL was 0.05 mg/kg bw for the one pig that responded, and the NOEL was 0.025 mg/kg bw. After intravenous administration, the NOEL was 0.015 mg/kg bw.
In studies in which young pigs (7.5 kg) received feed containing heavily conta-minated mouldy corn, a dietary concentration of approximately 20 mg/kg (equal to 0.8 mg/kg bw) caused emesis, whereas no emesis was observed at 12 mg/kg feed (equal to 0.6 mg/kg bw) (Young et al., 1983).
In a study of feed inoculated with corn, no emesis was observed in 34-kg pigs at a dietary concentration of 14 mg/kg (equal to 0.42 mg/kg bw) (Friend et al., 1984).
Similarly, in studies in dogs and cats given a diet containing contaminated wheat, emesis occurred at doses of 0.45 and 0.4 mg/kg bw, respectively. The NOEL was 0.3 mg/kg bw for both species (for further experimental details, see section 2.2.2) (Hughes et al., 1999).
The minimum single emetic doses (LOELs) of deoxynivalenol and 15-acetyl-deoxynivalenol given subcutaneously to 6-month-old dogs weighing 2–3 kg were 0.1 and 0.2 mg/kg bw, respectively (Yoshizawa & Morooka, 1974).
The Committee noted that, in the studies described above, emesis occurred in pigs at much lower doses when deoxynivalenol was given by gavage than when it was given in the feed. This difference was attributed to a bolus effect of gavage. The usual exposure of humans would be comparable to administration in the feed.
At a dose of 46 mg/kg bw given by gavage, deoxynivalenol damaged the cells lining the gastrointestinal tract of 4-week-old ICR mice. Ulcers and cell infiltration were observed in the forestomach, and necrosis of immature crypt cells, cell infiltration in the mucosa, and cystic changes in the crypts were observed in the small intestine (Ito et al., 1993).
The results of these studies are summarized in Table 3.
Table 3 (a). Summary of short- and long-term studies of the toxicity of deoxynivalenol
|
Species, strain, sex, age |
Length of study (days) |
No. per group |
Dose |
Route |
|
|
mg/kg of diet |
mg/kg bw per day |
||||
|
Mouse, Swiss |
7–137 |
80 |
6.3 |
0.9 |
Diet, contam. wheat |
|
Mouse, BALB/c |
7 |
3 x 4 |
2.5, 5, 10, 20, 50 |
0.35, 0.67, 1.3, 2.7, 6.5 |
Diet |
|
30 |
4 |
10 |
1.3 |
||
|
Mouse, ICR, f, m, 21 days |
14 |
10–12 |
8, 12, 16 |
1.2, 1.8, 2.4 |
Diet |
|
14 |
|
4, 8 |
0.6, 1.2 |
||
|
Mouse, Swiss |
35 |
24 |
|
0.75, 2.5, 7.5 |
Diet |
|
Mouse, B6C3F1 |
56 |
8 |
0.5, 2, 5, 10, 25 |
0.07, 0.28, 0.7, 1.4, 3.5 |
Diet |
|
Mouse, B6C3F1 |
56 |
10 |
0.5, 2, 5, 10, 25 |
0.07, 0.28, 0.7, 1.4, 3.5 |
Diet, 15-acetyldeoxy-nivalenol |
|
Mouse, 22–25 g |
56 |
24 |
0.04 2 x/ week |
0.006 |
Diet |
|
Mouse, NMRI, |
42 |
10 |
0.1, 1, 10 |
0.014, 0.14,1.4 |
Diet |
|
Mouse, ICR, 18 g |
14 |
8 |
2, 4, 8 |
0.37–1.5 m |
Diet |
|
3, 6, 9 |
0.4–1.6 f |
||||
|
Mouse, 3 strains |
90 |
3–6 |
10 |
1.4 |
Diet |
|
Mouse, B6C3F1 |
730 |
50 |
1, 5, 10 |
|
Diet |
|
males |
|
|
|
0.1, 0.5, 1.1 |
|
|
females |
|
|
|
0.1, 0.6, 1.4 |
|
|
Rat, ICR, m |
91 |
50 |
6.3 |
0.5 |
Diet |
|
Rat Sprague-Dawley, m, f, weanling |
60 |
25 m |
|
0.25, 0.5, 1 |
Diet |
|
68 |
25 f |
|
|
||
|
Rat, Sprague-Dawley, m |
90 |
10 |
20 |
1 |
Diet |
|
Rat, Sprague-Dawley, m, f, 280 g |
|
2 |
4 x 2 |
40 x 2 |
Diet, pure deoxynivalenol |
|
Rat, Wistar, f, |
8 |
5 |
40 |
2 |
Diet, contam. maize |
|
|
|
40 |
2 |
Detoxified |
|
|
Broiler chicks, m, 1 day of age at beginning |
21 |
|
16 |
1.3 |
Diet, contam. wheat |
|
Broiler chicks, m, f, 1 day of age at beginning |
35 |
240 |
0.1, 1.0, 2.1, 3.4 + 10% 3-acetyldeoxynivalenol |
0.01, 0.1, 0.34 |
Diet, contam. oats |
|
Broiler chicks, m |
21 |
36 |
16 |
1.5 |
Diet, contam. wheat |
|
Broiler chicks, m |
21 |
36 |
15 |
1.3 |
Diet, contam. wheat |
|
Broiler chicks, |
37 |
45 |
1.8, 3.6, 5.3 + 50% other mycotoxins |
0.14, 0.3, 0.46 |
Diet, contam. maize |
|
Turkey poults, f |
21 |
24 |
20 |
1.6 |
Semi-purified deoxynivalenol |
|
Mallard duck, m, f, 1 year old |
14 |
10 |
5.8 |
1.5 |
Diet, contam. wheat |
|
Shrimp |
112 |
72 |
0.2, 0.5, 1 |
0.007, 0.018, 0.036 |
Diet, contam. wheat |
|
Cat, American shorthair, 1–9 years of age |
14 |
2–7 |
1, 2, 4, 6, 8, 10 |
0.05, 0.1, 0.2, 0.3, 0.4, 0.5 |
Diet, contam. wheat |
|
Dog, beagle or Brittanny, 1–7 years of age |
14 |
2–14 |
1, 2, 4, 6, 8, 10 |
0.075, 0.15, 0.3, 0.45, 0.6, 0.75 |
Diet, contam. wheat |
|
Pig |
|
|
2 |
0.08 |
Diet, contam. |
|
Pig |
|
|
|
|
|
|
8 kg |
21 |
ž 1 |
1–4.2 |
0.04, 0.09, |
Diet, contam. wheat |
|
60 kg |
42 |
|
|
0.18 |
|
|
Pig, 49 days, 14 kg, castrated m |
28 |
6 |
4.5 |
0.2 |
Diet, contam. wheat |
|
Pig, young |
21 |
|
1.3, 12, 20, 43 |
0.06, 0.6, 0.8, 1.6 |
Diet, contam. maize |
|
Pig, 84 days, 38 kg |
35 |
6 |
2.5 |
0.1 |
Diet, contam. maize |
|
Pig, Yorkshire, 6–7 weeks, 13 kg, castrated m |
28 |
6–8 |
0.95 , 1.8, |
0.08, 0.13, |
Diet, contam. |
|
2.8 |
0.18 |
maize, pair fed |
|||
|
Pig, 18 kg, castrated m |
42 |
8 |
4 |
0.26 initially, 0.16 at end |
Diet |
|
Pig, 25 kg, f, castrated m |
100 |
7–9 |
0.5, 1, 2, 4; control: 0.1–0.4 |
0.02, 0.04, 0.08, 0.16 |
Diet, contam. oats |
|
Pig, f, castrated m, 21 kg, 59 days |
95 |
7–11 |
0.7, 1.7, 3.5 |
0.04, 0.1, 0.2 |
Diet, contam. + 0.75 mg/kg zearalenone |
|
Pig, castrated m, 27 kg |
56 |
3 |
4.7 |
0.19 |
Diet, pure |
|
2.1–5.2 |
0.08–0.2 |
Diet, pure, compared to 16 samples of contam. maize |
|||
|
Pig, Yorkshire, 10–13 kg, castrated m |
32 |
6 |
1, 3 |
0.08, 0.24 |
Diet, pure (P) |
|
0.09, 0.22 |
Diet, contam. (N) |
||||
|
Pig, Yorkshire, 10–13 kg |
7 |
6 |
4, 9 |
0.17, 0.27 |
Diet, pure |
|
0.26, 0.53 |
Intraperitoneal, pure |
||||
|
Pig, 60 kg |
90 |
3–6 |
1 |
~ 0.04 |
Diet, pure |
|
Pig, 10 kg, f |
56 |
9 |
0.3, 0.6, 1.2 |
0.012, 0.024, 0.048 |
Diet, purified |
|
Lambs, m, f, 3–6 months, 18 kg |
28 |
3–4 |
16 |
0.94 |
Naturally contam. wheat |
|
Horse, 12.5 years, m, f, 444 kg |
40 |
5 |
40 mg/kg ration + hay 1.3 kg/day |
0.11 |
Diet, contam. barley |
|
Steer calves, 293 kg |
84 |
18 |
0.9, 3.7, 6.4, 9.2 |
0.01, 0.05, 0.07, 0.1 |
Diet, contam. barley |
|
Dairy cows, Holstein, early lactation |
21 |
2 |
0, 2.1, 6.3, 8.5 |
0.075, 0.22, 0.3 |
Diet, contam. barley |
Table 3 (b). Summary of short- and long-term studies of the toxicity of deoxynivalenol
|
Species, strain, sex, age |
Length of study (days) |
Effect |
LOEL |
NOEL |
Reference |
|
Mouse, Swiss |
7–137 |
Reduced body-weight gain |
0.9 |
|
Arnold et al. (1986a) |
|
Mouse, BALB/c |
7 |
Reduced feed intake, body-weight gain, thymus weight; decreased cardiac protein synthesis |
0.35 |
0.67 |
Robbana-Barnat et al. (1987) |
|
30 |
Cardiac lesions |
1.3 |
0.67 |
||
|
Mouse, ICR, f, m, 21 days |
14 |
Reduced feed intake Reduced growth |
< 1.2 |
|
Rotter et al. (1992) |
|
14 |
< 0.6 |
||||
|
Mouse, Swiss |
35 |
Reduced feed intake, decreased thymus weight; changes in spleen, thymus, lymph nodes, gut |
0.75 |
|
Arnold et al. (1986a) |
|
2.5 |
0.75 |
||||
|
Mouse, B6C3F1 |
56 |
Reduced body-weight gain and liver, kidney weights |
0.28 |
0.07 |
Forsell et al. (1986) |
|
0.7 |
0.28 |
||||
|
Mouse, B6C3F1 |
56 |
Reduced feed intake, body-weight gain; decreased kidney, spleen weights |
0.7 |
0.28 |
Pestka et al. (1986) |
|
Mouse, 22–25 g |
56 |
Reduced body-weight gain; intestinal necrosis, renal glomerular lesions; study inadequate |
0.006 |
|
Bilgrami et al. (1993) |
|
Mouse, NMRI, |
42 |
Reduced body-weight gain; impaired uptake of nutrients |
1.4 |
0.14 |
Hunder et al. (1991) |
|
Mouse, ICR, 18 g |
14 |
Reduced feed intake and growth |
0.37 m |
0.81 f |
Rotter et al. (1994a) |
|
Mouse, 3 strains |
90 |
Adverse effects on epididymides |
> 1.4 |
|
Sprando et al. (1999) |
|
Mouse, B6C3F1 |
730 |
Reduced body-weight gain; reduced tumour incidence |
0.5 |
0.1 |
Iverson et al. (1995) |
|
males |
|
||||
|
females |
|
||||
|
Rat, ICR, m |
91 |
Reduced feed intake and body-weight gain |
0.5 |
|
Arnold et al. (1986a) |
|
Rat Sprague-Dawley, m, f, weanling |
60 |
Reduced body-weight gain, reduced feed intake; decreased jejunum and spleen thymidine uptake |
0.25 f |
0.5 m |
Arnold et al. (1986b) |
|
68 |
1 m |
1 (f)/0.5 (m) |
|||
|
Rat, Sprague-Dawley, m |
90 |
Reduced body-weight gain |
1 |
|
Morrissey et al. (1985) |
|
Rat, Sprague-Dawley, m, f, 280 g |
|
Reduced feed intake (46% of control) |
2 |
|
Vesonder et al. (1979) |
|
Rat, Wistar, f, |
8 |
Reduced feed intake, body-weight gain; decreased absolute liver and thymus weights, increased haemoglobin, haematocrit, serum parameters |
2 |
|
Basilico et al. (1997) |
|
Only effect, reduced serum alkaline phosphatase activity |
|
|
|
||
|
Broiler chicks, m, 1 day of age at beginning |
21 |
Reduced feed efficiency |
1.3 |
|
Kubena et al. (1989) |
|
Broiler chicks, m, f, 1 day of age at beginning |
35 |
No effect on feed intake, weight gain, carcass weight, heart, or histological parameters |
|
0.21, 0.34 |
Bergsjø & Kaldhusdal (1994) |
|
Broiler chicks, m |
21 |
No effect on feed intake, body-weight gain, haematological, serum and histological parameters |
|
1.5 |
Harvey et al. (1997 ) |
|
Broiler chicks, m |
21 |
No effect on feed intake, body-weight gain, haematological or serum parameters; increased relative weight of heart, bursa, and gizzard |
1.3 |
|
Kubena et al. (1997) |
|
Broiler chicks, |
37 |
No effect on body-weight gain, feed conversion, or serum parameters; increased heart weight: dose-related, significant at highest dose |
0.46 |
0.3 |
Leitgeb et al. (1999) |
|
Turkey poults, f |
21 |
No effect on feed intake, body-weight gain, haematological, most serum parameters, histology, heart or kidney weights; reduced serum calcium |
1.6 |
|
Morris et al. (1999) |
|
Mallard duck, m, f, 1 year old |
14 |
No effect on serum, haematological, or histological parameters |
|
1.5 |
Boston et al. (1996) |
|
Shrimp |
112 |
Reduced growth rate, dose-related |
0.007 |
|
Trigo-Stockli et al. (2000) |
|
Cat, American shorthair, 1–9 years of age |
14 |
Emesis; reduced food intake |
0.4 |
0.3 |
Hughes et al. (1999) |
|
Dog, beagle or Brittanny, 1–7 years of age |
14 |
Emesis, reduced food intake |
0.45 |
0.3 |
Hughes et al. (1999) |
|
Pig |
|
Reduced body-weight gain |
0.08 |
|
Trenholm et al. (1984) |
|
Pig |
|
|
|
|
|
|
8 kg |
21 |
Reduced feed intake and body-weight gain |
0.18 |
0.09 |
Pollman et al. (1985) |
|
60 kg |
42 |
0.09 |
0.04 |
||
|
Pig, 49 days, 14 kg, castrated m |
28 |
Reduced feed intake and body-weight gain; renal lesions; interaction with fumonisin B1 |
0.2 |
|
Harvey et al. (1996) |
|
Pig, young |
21 |
Emesis |
0.8 |
0.6 |
Young et al. (1983) |
|
Feed refusal |
0.6 |
0.06 |
|||
|
Reduced body-weight gain |
0.06 |
|
|||
|
Pig, 84 days, 38 kg |
35 |
Reduced feed intake and body-weight gain |
0.1 |
|
Friend et al. (1992) |
|
Pig, Yorkshire, 6–7 weeks, 13 kg, castrated m |
28 |
Reduced body-weight gain; decreased thyroid weight, increased , thyroxineserum albumin and albumin:globulin ratio, decreased alpha-globulin |
0.08 |
|
Rotter et al. (1994b) |
|
(day 7) |
|
||||
|
0.13 |
0.08 |
||||
|
Pig, 18 kg, castrated m |
42 |
Reduced body-weight gain and feed intake; stomach corrugation; decreased serum protein |
0.26, transient |
|
Rotter et al. (1995) |
|
Pig, 25 kg, f, castrated m |
100 |
Reduced body-weight gain and feed intake |
0.16 |
0.08 |
Bergsjø et al. (1992) |
|
Pig, f, castrated m, 21 kg, 59 days |
95 |
Reduced feed uptake and body-weight gain, increased liver weight, decreased serum albumin |
0.1 |
0.04 |
Bergsjø et al. (1993a) |
|
Pig, castrated m, 27 kg |
56 |
Reduced feed intake (29%), reduced body-weight gain (27%) |
0.19 (pure) |
|
Foster et al. (1986) |
|
Greater reduced feed intake and body-weight gain |
0.2 |
||||
|
Pig, Yorkshire, 10–13 kg, castrated m |
32 |
Reduced body-weight gain |
0.09 N |
|
Prelusky et al. (1994) |
|
Reduced plasma alpha-globulin; cortisol |
0.24 P |
0.08 P |
|||
|
Pig, Yorkshire, 10–13 kg |
7 |
Reduced feed intake and body-weight gain |
0.17 |
|
Prelusky et al. (1997) |
|
Reduced feed intake and body-weight gain |
|||||
|
Pig, 60 kg |
90 |
No reduced body-weight gain; no clinical effects; interaction with ochratoxin A for some parameters |
|
0.04 |
Lusky et al. (1998) |
|
Pig, 10 kg, f |
56 |
No reduced body-weight gain |
|
0.048 |
Götz-Schröm et al. (1998) |
|
Lambs, m, f, 3–6 months, 18 kg |
28 |
No effect on feed intake, body-weight gain, haematological, serum or histological end-points |
|
0.94 |
Harvey et al (1986) |
|
Horse, 12.5 years, m, f, 444 kg |
40 |
No effect on feed intake, body-weight gain, or serum end-points |
|
0.11 |
Johnson et al. (1997) |
|
Steer calves, 293 kg |
84 |
No effect on feed intake, weight gain, or serum end-points |
|
0.1 |
Anderson et al. (1996) |
|
Dairy cows, Holstein, early lactation |
21 |
No effect on feed intake, weight gain, rumenal pH, or milk production |
|
0.3 |
Ingalls (1996) |
m, male; f, female; contam., contaminated
Mice: In a study lasting about 18 weeks, groups of 80 Swiss-Webster weanling male mice were fed either an ‘uncontaminated’ wheat diet containing deoxynivalenol at 0.05 mg/kg or a contaminated wheat diet containing 6.3 mg/kg, equivalent to approximately 0.9 mg/kg bw per day. The mice were killed serially between 7 and 137 days. A 10% decrease in body weight was seen which was related in part to decreased food intake. There were no significant pathological findings and only slight changes in haematological parameters, probably related to body weight. The NOEL was 0.9 mg/kg bw per day (Arnold et al., 1986a).
Groups of four BALB/c mice were fed diets containing deoxynivalenol at a concentration of 2.5, 5, 10, 20, or 50 mg /kg, equal to 0.35, 0.67, 1.3, 2.7, and 6.5 mg/kg bw per day, for 7 days (repeated in three replicate trials). Food intake was decreased at all doses. At 1.3 mg/kg bw, decreased body-weight gain, decreased thymus weight, and decreased cardiac protein synthesis were seen. When feeding was continued until day 30, cardiac lesions (calcified pericarditis foci) were also observed at this dose (Robbana-Barnat et al., 1987).
Groups of 10–12 young female ICR mice were fed diets containing deoxynivalenol at a concentration of 0, 4, 8, 12, or 16 mg/kg, equivalent to 0.6, 1.2, 1.8, and 2.4 mg/kg bw. Reduced feed intake was observed at the three higher doses and reduced growth at all doses (Rotter et al., 1992).
Groups of eight male and eight female outbred ICR mice aged 3 weeks and weighing 16–18 g, housed singly, were fed diets containing deoxynivalenol at a concentration of 0, 2, 4, or 8 mg/kg for 14 days. The authors calculated that the actual intakes were 0, 0.37, 0.76, and 1.5 mg/kgbw per day for the males and 0, 0.41, 0.81, and 1.6 mg/kg bw per day for the females. Food consumption was measured on days 7 and 14 of the experiment, and individual body weights were recorded on days 0, 7, and 14. Feed efficiency was calculated for both weeks of the experiment. Blood samples were collected at the end of the experiment and analysed for erythrocyte count, haemoglobin concentration, erythrocyte volume fraction, mean corpuscular volume, mean corpuscular haemoglobin, and mean corpuscular haemoglobin concentration. The feed consumption of the deoxynivalenol-fed animals was significantly reduced (p < 0.05), especially for the males, during each of the two 7-day test periods. For animals of each sex and during both weeks, the amounts consumed by animals at 2 and 4 mg/kg were similar. The weight gains of all treated males were significantly reduced after 7 days of exposure (p < 0.001), but only the males fed 8 mg/kg of diet gained less weight than the controls during week 2. Females at this concentration weighed less than the controls after the first week of exposure but gained more weight than the controls during the second week. The erythrocyte counts of treated animals were significantly lower than in the controls (p < 0.05), but the effect was seen primarily at 2 mg/kg of diet. The LOEL was 0.37 mg/kg bw per day and the NOEL was 0.81 mg/kg bw per day (Rotter et al., 1994a).
Groups of 24 Swiss-Webster-derived male weanling mice were given deoxy-nivalenol at a dose of 0, 0.75, 2.5, or 7.5 mg/kg bw per day by gavage for 35 days. Two control groups were given the solvent or were untreated. Most of the animals given the two higher doses died during the study. At 2.5 mg/kg bw per day, lesions were found in the spleen, thymus, lymph nodes, and gastrointestinal tract. Bone-marrow and haematological parameters were also affected at this dose. Decreased food consumption, decreased body weight, decreased relative weights of the thymus and heart, and increased relative weight of the stomach were seen at all doses (Arnold et al., 1986a).
Groups of eight weanling female B6C3F1 mice were fed diets containing deoxy-nivalenol at a concentration of 0.5, 2, 5, 10, or 25 mg/kg, equivalent to 0.07, 0.28, 0.7, 1.4, and 3.5 mg/kg bw per day for 56 days. Decreased body-weight gain was seen at doses > 0.28 mg/kg bw per day . The liver and kidney were affected at doses > 0.7 mg/kg bw per day (Forsell et al., 1986).
Groups of 10 weanling female B6C3F1 mice were fed diets containing 15-acetyldeoxynivalenol at a concentration of 0.5, 2, 5, 10, or 25 mg/kg, equivalent to 0.07, 0.28, 0.7, 1.4, and 3.5 mg/kg bw per day for 56 days. Decreased body-weight gain was seen at doses > 0.7 mg/kg bw per day, and the weights of the spleen and kidney were decreased (Pestka et al., 1986).
Rats: Groups of 50 male Sprague-Dawley rats were fed either an ‘uncontami-nated’ wheat diet containing deoxynivalenol at 0.05 mg/kg or a contaminated wheat diet containing 6.23 mg/kg, estimated to be equivalent to 0.5 mg/kg bw. Rats were killed serially up to 91 days. A 10% decrease in body weight was observed which was related in part to decreased food intake. There were no significant pathological findings; the slight changes in haematological parameters were probably related to the changes in body weight (Arnold et al., 1986a).
Groups of 25 male and female weanling Sprague-Dawley rats were fed diets containing purified deoxynivalenol to provide a dose of 0.25, 0.5, or 1 mg/kg bw per day for 60 days. Body weight decreases, attributed in part to reduced food intake, were seen at all doses in females and at the highest dose in males (both 5% less than controls, but statistically significant). Thymidine uptake was decreased in the jejunum and spleen of males at the two highest doses, although the effect was significant only at the highest dose. The average decreases in spleen were 2.6% for male controls, 2.8% at 0.25 mg/kg bw per day, 1.8% at 0.5 mg/kg bw per day, and 0.9% at 1.0 mg/kg bw per day; and 19%, 17%, 12%, and 9.2%, respectively, in the jejunum. No notable differences in thymidine labelling were observed in the oesophagus of males or in the spleen, jejunum, or oesophagus of females. No changes were observed in organ weights, haematological or bone-marrow variables, sequential multichannel autoanalyser variables, or histological appearance (Arnold et al., 1986b).
In a 90 day-study, groups of 10 male Sprague Dawley rats weighing 200 g were fed diets containing deoxynivalenol at 20 mg/kg, equivalent to about 1 mg/kg bw per day. At this dose, there was no feed refusal, but a 10% decrease in body-weight gain was observed. Serum enzyme activity, haematological end-points, histopathological appearance, and liver detoxication systems were unaffected (Morrissey et al., 1985).
Poultry: Chickens tolerate deoxynivalenol at a concentration of at least 5 mg/kg of diet, equivalent to about 0.45 mg/kg bw per day. At concentrations up to 5 mg/kg feed, in fact, some beneficial effects on food consumption and weight gain were observed in Leghorn chickens (up to 28 days) and broilers (up to 45 days). When laying Leghorn hens were fed diets containing deoxynivalenol at 0.7 mg/kg for 70 days, no effect was found on feed intake, body weight, egg production, egg yield, or the number of cracked eggs. With increasing doses of deoxynivalenol up to 5.2 mg/kg of feed for 168 days, egg and shell weight and shell thickness decreased. Turkey poults given feed containing deoxynivalenol at 0.5 mg/kg for 14 days showed slightly reduced feed intake and weight gain, which were not statistically significant (Trenholm et al., 1984). The Committee noted that insufficient experimental detail was provided.
Many studies have shown that the performance of chicken broilers and turkey poults is little affected by concentrations of deoxynivalenol up to about 16 mg/kg; some of the more recent studies are summarized in Table 3.
Mink: Mink given a choice between uncontaminated feed and deoxynivalenol-contaminated feed displayed a preference for the uncontaminated feed at a concentration of deoxynivalenol as low as 0.28 mg/kg. However, when no choice was available, the mink readily consumed feed containing deoxynivalenol at concentrations up to 1.2 mg/kg (equal to 0.20 mg/kg bw per day) with no apparent ill effects over a 28-day period. The study suggests that the sensitivity of mink is close to that of pigs and greater than that of rats and chickens (Gibson et al., 1993).
Cats: Wheat naturally contaminated with deoxynivalenol to a concentration of 37 mg/kg was used to manufacture feed containing the toxin at 0, 1, 2, 4, 6, 8, or 10 mg/kg, equivalent to 0, 0.05, 0.1, 0.2, 0.3, 0.4, and 0.5 mg/kg bw per day and fed to groups of two to seven mature American shorthair cats, 1–9 years old, for 14 days. The wheat also contained 15-acetyldeoxynivalenol at 1 mg/kg, but none of the other Fusarium toxins (detection limits, 0.1–0.5 mg/kg). The concentration of deoxy-nivalenol in the feed was unchanged after manufacture, indicating that the toxin was stable during conventional extrusion processing. The feed intake of the cats was significantly reduced when it contained deoxynivalenol at a concentration > 7.7 ± 1.1 mg/kg (equivalent to 0.38 mg/kg bw per day). Vomiting was common at the highest concentration (Hughes et al., 1999).
Dogs: The same diets were fed to groups of 2–14 mature male and female beagle or Brittany dogs, 1–7 years old for 14 days, equivalent to doses of deoxynivalenol of 0, 0.075, 0.15, 0.3, 0.45, 0.6, and 0.75 mg/kg bw per day. Dogs previously fed deoxynivalenol-contaminated food preferentially selected uncontaminated food, whereas dogs not previously exposed to deoxynivalenol-contaminated food consumed equal quantities of contaminated and uncontaminated food. The digestibility of the food was not affected when it contained 6 mg/kg. Feed intake was significantly reduced at concentrations of deoxynivalenol > 4.5 ± 1.7 mg/kg, equivalent to 0.34 mg/kg bw per day. Vomiting was common at the two higher doses (Hughes et al., 1999).
Pigs
Naturally contaminated wheat, maize, and oats
Maize infected with Gibberella zeae, in which about 25% of the kernels were seen to be damaged and containing deoxynivalenol at a concentration of 12 mg/kg, was added to the feed of pigs weighing 20–45 kg. Feed consumption was reduced, by 20% at a concentration of 3.6 mg/kg to 90% at 40 mg/kg. Weight loss was associated with the feed refusal. Feed was refused more frequently when it contained naturally contaminated maize than when equal concentrations of the pure compound. This indicates that additional factors are involved in the feed refusal response of pigs (Forsyth et al., 1977).
Pigs of two age groups, weighing 8 and 60 kg, were fed rations containing wheat naturally contaminated with deoxynivalenol at a concentration of 1–4.2 mg/kg (equal to 0.036, 0.09, and 0.18 mg/kg bw per day) for 21 days and 42 days, respectively. The younger animals had decreased feed intake at the highest dose, but their weight gain was not affected. In the older animals, feed intake and body-weight gain were affected at 0.09 mg/kg bw. Histological examination revealed no significant lesions or abnormalities in the tissues examined (Pollman et al., 1985).
Groups of six 49-day-old, 14-kg, castrated male pigs were fed a ration to which naturally contaminated wheat had been added, resulting in a deoxynivalenol concentration of 5 (actual, 4.5) mg/kg of feed, equal to 0.2 mg/kg bw per day (using a factor of 0.05 rather than 0.04), for 28 days. Feed intake and growth were not decreased, but mild renal nephrosis was observed in two pigs. An additive or greater interaction was observed when the diets also contained fumonisin B1 at 100 (actual, 47–56) mg/kg of feed (Harvey et al., 1996).
In young pigs weighing 30–80 kg and pregnant gilts, ingestion of a diet containing deoxynivalenol at concentrations > 2 mg/kg of feed, equivalent to > 0.08 mg/kg bw per day, resulted in decreased feed consumption and reduced weight gain. Pigs could ingest feed containing deoxynivalenol at up to 2 mg/kg of feed without serious adverse effects (Trenholm et al., 1984). The Committee noted that insufficient experimental details were provided for an assessment of the study.
Four trials were conducted in young pigs to evaluate the effect of deoxynivalenol-contaminated maize on performance. Mouldy maize containing deoxynivalenol at 875 mg/kg and zearalenone at 3.9 mg/kg was mixed with clean maize and other ingredients to provide feeds containing deoxynivalenol at concentrations ranging from 0.14 mg/kg (control) to 230 mg/kg. A dietary concentration of approximately 20 mg/kg caused emesis, 12 mg/kg caused almost complete feed refusal, and 1.3 mg/kg of feed (equivalent to 0.06 mg/kg bw per day) caused a significant reduction in feed intake and rate of weight gain. No lesions attributable to deoxynivalenol were observed in pigs fed up to 43 mg/kg feed for 21 days. Alterations in various serum characteristics were observed in pigs fed deoxynivalenol, but the effects could not be separated from those that result from low intake of food (Young et al., 1983).
Groups of six 84-day-old, 38-kg pigs were fed a ration to which naturally contaminated maize had been added, resulting in a deoxynivalenol concentration of 2.5 mg/kg, equivalent to 0.1 mg/kg bw per day, for 35 days. Decreased feed intake and growth were observed (Friend et al., 1992).
Groups of six to eight castrated male Yorkshire pigs, 6–7 weeks old and weighing 13 kg, were fed diets containing deoxynivalenol at a concentration of 0 (control), 0.95, 1.8, or 2.8 mg/kg for 28 days, equal to 0, 0.08, 0.13, and 0.18 mg/kg bw per day. The deoxynivalenol in the diet was from naturally contaminated maize, which also contained 15-acetyldeoxynivalenol (at about 25% the concentration of deoxynivalenol) and zearalenone (at about 4%). Feed consumption and body weight were recorded on days 2, 4, 7, 14, 21, and 28 of the study. Blood samples, collected on days 0, 7, and 28, were analysed for thyroxine, tri-iodothronine uptake, cortisol, and haematological parameters. Serum electrophoresis was conducted on samples collected on day 28. At sacrifice, the weights of the thyroid, thymus, spleen, and kidneys were recorded, and the stomachs were scored for colour, thickness, and inflammation. During the first 2 weeks of the experiment and also overall, food intake was decreased as the dietary deoxynivalenol concentration increased. Intake during the last 7 days was similar in all groups except that receiving 2.8 mg/kg of diet. A dose-related reduction was seen in weight gain in treated pigs during the first 7 days, but the overall daily gain over 28 days was similar in all groups. The absolute and relative weights of the thyroid were significantly lower (p <0.02 and p < 0.05, respectively) in pigs given the diets containing 1.8 and 2.8 mg/kg. The thyroxine concentration increased in response to increasing dietary concentrations of deoxy-nivalenol after 7 and 28 days (p < 0.017), and the albumin concentration increased in pigs fed increasing concentrations of deoxynivalenol at 28 days (p = 0.013). The alpha-globulin concentration showed a dose-related linear decrease (p = 0.016), and the albumin:globulin ratio in treated pigs was higher than in controls (p = 0.009). The NOEL was 0.08 mg/kg bw per day (Rotter et al., 1994b).
The effects of feeding a diet contaminated with deoxynivalenol at 4 mg/kg on performance and blood parameters were studied for 42 days in groups of eight male castrated Yorkshire pigs weighing 18 kg. On the basis of feed intake, the intake of deoxynivalenol was 0.26 and 0.16 mg/kg bw per day at the beginning and end of the experiment, respectively. Blood samples were collected weekly from all animals. Controls fed ad libitum and in pairs with treated animals were used to distinguish between differences in feed intake and effects of the deoxynivalenol-containing diet. Pigs fed the contaminated diet had on average a 20% lower feed intake and 13% lower weight gain than the controls fed ad libitum, but these parameters were similar in the pair-fed groups. At necropsy, no differences were found in absolute and relative organ weights, but the fundic region of the stomach of pigs fed the deoxynivalenol diet was more corrugated than that of either of the controls. When compared with both set of controls, the serum protein concentration and beta-globulin levels were reduced, although these differences had disappeared by the end of the 6-week experiment (Rotter et al., 1995).
A 100-day feeding trial was conducted to evaluate the effect of including deoxynivalenol-contaminated oats in the feed of groups of seven to nine growing pigs with initial weight of 25 kg to provide concentrations of 0.5, 1, 2, and 4 mg/kg in the complete diets, equivalent to 0.02, 0.04, 0.08, and 0.16 mg/kg bw per day. Performance was recorded as weight gain, feed intake, efficiency of feed use, and carcass quality. Restricted feeding was compared to feeding ad libitum. At the highest concentration of deoxynivalenol, feed intake, weight gain, and efficiency of feed use were decreased throughout the experiment. The groups fed diets containing the two highest concentrations of deoxynivalenol showed a dose-related decrease in weight gain during the first 8 weeks on experimental diets. No effects were observed in groups fed diets containing deoxynivalenol at 0.5 or 1 mg/kg. The carcass quality was not affected at any concentration (Bergsjø et al., 1992). Since the control diet contained deoxynivalenol at 0.1–0.4 mg/kg, changes due to low added concentrations of deoxynivalenol could not be detected.
Oats naturally contaminated with deoxynivalenol were included in feed mixtures at graded levels and given to groups of 7–11 female or castrated male growing pigs (59 days old, 21 kg) for 95 days. The concentrations of deoxynivalenol were 0, 0.7, 1.7, and 3.5 mg/kg of complete feed mixture given ad libitum, equal to 0.04, 0.1, and 0.2 mg/kg bw per day. Feed consumption, body-weight gain, weight at slaughter, biochemical and haematological data including serum immunoglobulin (Ig) A, clinical condition, and pathological and histopathological effects post mortem were recorded. The group that received the highest dose had significantly decreased body-weight gain throughout the experiment, decreased weight at slaughter, and reduced feed use efficiency. At the same concentration, the weight of the liver was increased, the concentrations of serum protein and albumin were decreased, and packed blood cell volume and serum calcium and phosphorus concentrations fell transiently. At the two higher doses, a statistically significant, dose-related decrease in daily feed consumption was observed. No other effects on haematological, biochemical, or immunological parameters were observed. Carcass quality was not affected in any group. The authors concluded that significant effects in growing pigs can be observed at a dietary deoxynivalenol concentration of 1.7 mg/kg, originating from naturally contaminated oats included in a diet that was otherwise adequate and contained only minor traces of other mycotoxins (zearalenone, 0.75 mg/kg of feed) (Bergsjø et al., 1993a).
Deoxynivalenol from naturally contaminated maize or purified
Groups of three castrated male Yorkshire pigs weighing 28 kg were given diets containing pure deoxynivalenol at a concentration of 4.7 mg/kg, maize inoculated with various strains of F. graminearum providing deoxynivalenol at 2.1–5.2 mg/kg of diet, uncontaminated maize, or naturally contaminated wheat ad libitum for 56 days. The feed intake of pigs receiving the diet containing pure deoxynivalenol at 0.19 mg/kg was reduced by 29% after 1 week and 18% after 7 weeks, and their weight gain was reduced by 27% and 20%, respectively, although the differences were not significant. The reductions in feed consumption and weight gain were generally greater in pigs given the diets inoculated with maize, reaching 40% and 37% after 7 weeks on a diet containing deoxynivalenol at 5.2 mg/kg (0.2 mg/kg bw per day). The difference was attributed to factors such as other fungal metabolites and differences in storage of the maize. No emesis occurred (Foster et al., 1986).
The toxic effects of deoxynivalenol were examined in castrated male Yorkshire pigs weighing 10–13 kg given feed into which deoxynivalenol was incorporated at a concentration of 0, 1, or 3 mg/kg, either as the purified toxin or as naturally contaminated maize, for 32 days. The estimated intakes of deoxynivalenol were 0.08 and 0.24 mg/kg bw per day of purified toxin and 0.09 and 0.22 mg/kg bw from the naturally contaminated feed. The diet also contained 7% 15-acetyldeoxynivalenol and 3% nivalenol. Growth performance and blood biochemical and haematological parameters were monitored throughout the study. At the higher concentrations, significantly reduced feed consumption and body-weight gain were evident soon after the start of feeding. While the weight gain of pigs fed the diet containing purified deoxynivalenol recovered after several days, the values for pigs fed the naturally contaminated diet remained depressed throughout the study. These observations might reflect the presence of other, unidentified toxic compounds in the naturally contaminated grain. Generally, the blood chemical parameters of pigs fed the contaminated diets were not different from those of controls, with the exception of reduced serum concentrations of alpha-globulin (significant at the highest concentration of either pure deoxynivalenol or naturally contaminated maize at day 32) and possibly increased cortisol concentrations in animals receiving the highest concentration in either diet. The effect of deoxynivalenol on the alpha-globulin fraction might have been independent of the feed refusal syndrome associated with this toxin. Alterations in several haematological end-points, including a higher erythroyte count, erythrocyte volume fraction, and platelet count, occurred sporadically at 3 mg/kg of either diet; however, these effects could not be separated from the influence of decreased feed intake and were of limited value in diagnosing the effects of dietary deoxynivalenol in pigs (Prelusky et al., 1994).
Purified deoxynivalenol
Groups of three to six pigs weighing 60 kg were used to study the health effects of purified deoxynivalenol and ochratoxin A in their feed, singly or in combination, and the presence of residues 90 days after intake. The pigs received diets containing ochratoxin A at 0.1 mg/kg with deoxynivalenol at 1 mg/kg, equivalent to 0.004 mg of ochratoxin A and 0.04 mg of deoxynivalenol per kg bw, respectively; ochratoxin A alone at 0.1 mg/kg; or deoxynivalenol alone at 1 mg/kg. Two controls received feed containing neither ochratoxin A nor deoxynivalenol. The pigs that received mycotoxins in their feed did not show clinical or haematological changes. The pigs that received both mycotoxins had hyperaemia in the gastric mucosa, and changes in the tubular epithelium were observed in one animal in each treated group. Few pathological lesions were found, but the Committee noted that there were few animals in the study. The observed antibody titres against pseudorabies (Aujeszky disease or ‘mad itch’), as a measure of effects on the immune system, suggest that non-specific defence mechanisms were not affected. The mean concentration of ochratoxin A in the kidneys of animals treated with both toxins was about 50% higher than that in the group given ochratoxin A alone, indicating a possible interaction. The concentration of ochratoxin A also appeared to be slightly increased in muscle of animals receiving both mycotoxins (Lusky et al., 1998).
Semi-synthetic potato-based, grain-free diets containing deoxynivalenol purified from inoculated rice cultures at a concentration of 0, 0.3, 0.6, or 1.2 mg/kg were fed with restriction to groups of nine sows weighing 10 kg over a period of 8 weeks, equivalent to 0, 0.012, 0.024, and 0.048 mg/kg bw per day. Body weight, biochemical and haematological end-points including serum IgA and insulin-like-growth factor-I, crude protein content in faeces, general condition, and pathological and histological findings post mortem were recorded. No significant effect was seen on weight gain, and the maximum body weight in all groups was about 30 kg. These results correspond to the results of clinical chemical and histological investigations. Serum IgA levels were increased by about 30% at the two higher doses, but these changes were not statistically significant (Götz-Schröm et al., 1998). Additional details were provided by M. Lauber (University of Hohenheim), who noted that the water content of the diet was high and may have affected feed consumption and weight gain.
The same group conducted three further unpublished trials. In the first, groups of five castrated male pigs weighing 10 kg were fed, with restriction, semi-synthetic potato-based, grain-free diets containing deoxynivalenol purified from inoculated rice cultures at a concentration of 0 or 4 mg/kg or wheat-based diets consisting of clean wheat or wheat inoculated with Fusarium culmorum, for 4 weeks, equivalent to an intake of deoxynivalenol of 0 or 0.16 mg/kg bw per day. The inoculated wheat also contained 5.8–12% 3-acetyldeoxynivalenol, 15-acetyldeoxynivalenol, and small quantities of nivalenol. The second and third trials were similar to the first, except that the diets were fed ad libitum and the dietary concentrations of deoxynivalenol were 0, 4, or 6 mg/kg diet, equivalent to 0, 0.16, and 0.24 mg/kg bw per day. The results were presented in graphical form. In the first trial, the maximum weight at the end of 4 weeks was about 28 kg in all groups; in the second trial, a dose-related decrease in body-weight gain was seen at each week, with weights of 35 kg for controls, 30 kg at 4 mg/kg, and 26 kg at 6 mg/kg at the end of 4 weeks of dosing. In the third trial, the maximum weight at the end of 4 weeks was about 30 kg in all groups. De-epoxidation of deoxynivalenol to the de-epoxy metabolite in faeces was more extensive with the wheat-based than the potato-based diets (information provided by M. Lauber, University of Hohenheim). The Committee noted that data on food intake were not provided, and only limited statistical analysis was done. Animals gained less weight on the potato-based diet than on the wheat-based diet, even when fed ad libitum.
Ruminants: The feed consumption of 10 non-lactating dairy cows decreased slightly when a wheat–oats diet containing deoxynivalenol at 6 mg/kg was fed at a rate of 1 mg/kg bw per day, with hay offered ad libitum. In surveys of Canadian grains carried out during the early 1980s, the deoxynivalenol content (maximum, 8.5 mg/kg) in eastern Canadian wheat was probably not high enough to account for reports of feed refusal, vomiting, and reproductive problems in livestock operations. This conclusion is based partly on the fact that formulated diets contain a maximum of 70–80% wheat. Consequently, the actual deoxynivalenol content of diets fed to farm animals would be much lower (Trenholm et al., 1984). The Committee noted that insufficient experimental details were provided.
Ruminants tend to be less susceptible to the effects of deoxynivalenol in feed concentrate, which is usually provided in addition to hay. Recent studies are summarized in Table 3.
Equidae: The results of one study are shown in Table 3.
Primates: In a limited study, changes in haemostasis were seen after single oral administration of deoxynivalenol at 1, 5, 10, 25, or 50 mg/kg bw or oral administration of deoxynivalenol at 1 or 5 mg/kg bw per day for 2 weeks to groups of one or two Macaca rhesus monkeys, with normalization of blood coagulation parameters within 45–60 days (Fomenko et al., 1991).
Groups of two male and two female infant cynomolgus monkeys were given pure deoxynivalenol at a dose of 0, 1, 2, or 5 mg/kg bw per day in milk by gavage for 200 days. Two males at the highest dose died during the first week of the study. In these animals, the histological effects, including atrophy of the thymus and spleen, were similar to those seen in rodents given deoxynivalenol, and the relative weight of the thymus was reduced. No significant pathological findings were observed in any other monkeys (F. Iverson, Health Canada, personal communication, 1986).
Mice: In a 2-year study, groups of 50 male and 50 female B6C3F1 mice were given diets containing deoxynivalenol (purity, > 95%; no 3-acetyl- or 15-acetyldeoxy-nivalenol) at a concentration of 0, 1, 5, or 10 mg/kg, equal to 0, 0.1, 0.5, and 1.1 mg/kg bw per day in males and 0, 0.1, 0.7, andor 1.6 mg/kg bw per day in females. Survival was not significantly affected. Average daily food consumption was unchanged in females, but that of males was significantly reduced by about 8% at the two higher doses. The graphical presentation of body-weight changes indicated that the decreases in body weight (and in body-weight gain) at 500 days were 8.7% (13%) at 1 mg/kg, 21% (32%) at 5 mg/kg, and 38% (56%) at 10 mg/kg of diet in females and 1% (1.6%), 6.8% (11%), and 21% (33%) for males, respectively. Females, showed a 56% increase in serum IgA and a < 10 % increase in IgG at 5 and 10 mg/kg of feed, and there were sporadic changes in haematological and clinical chemical end-points; however, these changes were considered not to be biologically relevant. The relative weight of the liver was decreased in males at 5 and 10 mg/kg; at 10 mg/kg, the relative weight of the spleen was decreased and the relative weight of the testis significantly increased. No increase in the incidence of preneoplastic or neoplastic changes was observed. In fact, there was a statistically significant, dose-related decrease in the incidences of preneoplastic and neoplastic lesions in the liver and in that of non-neoplastic lesions affecting large islets of the pancreas. In the liver, this negative trend probably resulted from the known positive correlation between body weight and the appearance of spontaneous hepatic neoplasms in this strain of mouse. The NOEL was 1 mg/kg of diet, equal to 0.1 mg/kg bw per day (Iverson et al., 1995).
Deoxynivalenol was tested for its potential to initiate or promote skin tumours in a two-stage regimen in female Sencar mice. Initiation was tested by applying a single topical dose of 200 µg followed by multiple treatments with the promoter 12-O-tetradecanoylphorbol 13-acetate. The test for promotion involved initiation with the carcinogen 7,12-dimethylbenz[a]anthracene followed by multiple treatments with 50 µg of deoxynivalenol. Appropriate control groups were included. The mice were observed for 26 weeks, and skin tumours were counted. Deoxynivalenol was neither an initiator nor a promoter. When it was tested as an initiator, no statistically significant difference was found in the cumulative number of tumours or the number of tumour-bearing mice. When it was administered as a promoter, no tumours were observed. Histopathological examination of the skin showed that deoxynivalenol induced mild diffuse squamous hyperplasia, but there was no progression of the lesion to neoplasia (Lambert et al., 1995).
The results of studies for genotoxicity summarized in Table 4 indicate that deoxynivalenol did not cause gene mutation in vitro but that it caused chromosomal aberration in vitro and in vivo.
Table 4. Results of assays for the genotoxicity of deoxynivalenol
|
End-point |
Test object |
Concentration |
Results |
Reference |
|
in vitro |
||||
|
Reverse mutation |
S. typhimurium TA98, TA100, TA1535, TA1537 a |
0.4–400 mg/plate |
Negative |
Wehner et al. (1978); Kuczuk et al. (1978) |
|
Reverse mutation |
S. typhimurium TA98, TA100a |
0.7–500 mg/plate |
Negative |
Knasmuller et al. (1997) |
|
Chromosomal aberration |
E. coli PQ37a |
5–500 mg/assay |
Negative |
Knasmuller et al. (1997) |
|
Gene mutation |
Chinese hamster lung V79 cells at Hprt locusb |
1–3 mg/mLc |
Negative |
Rogers & Heroux-Metcalf (1983) |
|
Unscheduled DNA synthesis |
Rat primary hepatocytes |
0.1–1000 mg/mL |
Negative |
Bradlaw et al. (1985) |
|
DNA repair |
E. coli K12 (2 strains) |
0.7–500 mg/mL |
Negative |
Knasmuller et al. (1997) |
|
Chromosomal aberrationd |
Chinese hamster V79 cells |
1 mg/mL |
Positive |
Hsia et al. (1988) |
|
Chromosomal aberration |
Rat primary hepatocytes |
0.001–100 mg/ml |
Positive |
Knasmuller et al. (1997) |
|
Negative |
||||
|
Gap-junctional communication |
Chinese hamster V79 cells |
0.1–0.5 mg/mL |
Inhibited |
Jone et al. (1987) |
|
Cell transformation |
BALB/c3T3 cells |
0.1–1.6 mg/mL |
Positive |
Sheu et al. (1988) |
|
In vivo |
||||
|
Chromosomal aberration |
Mouse bone-marrow cells |
3 mg/kg bw 2 x/week by gavage |
Positive |
Bilgrami et al. (1993) |
|
Negative |
||||
a
With and without activation with S9b
With and without activation with hepatocytesc
Reduced colony size at 1 mg/mL; 90% cell lethality at 10 mg/mLd
Mainly chromatid breakse
Dubious, since gaps were included in the analysis(a) Effects on reproductive organs
Mice: The potential of deoxynivalenol to affect testicular morphology and testicular and epididymal sperm counts was assessed in three strains of mice: IL-6KO [B6129-IL6 (tmlKopf) (IL-6 gene-deficient)], WT [B6129F2 (wild-type to B6129-IL6 with an intact IL-6 gene)], and B6C3F1 mice. The treated mice received deoxynivalenol at a concentration of 10 mg/kg in their diet (equivalent to 1.5 mg/kg bw per day) for 90 days. The body weight of treated animals was significantly lower than that of controls. Slight, not statistically significant changes were observed in relative testis weight and testicular spermatid counts, but no histological changes were seen. The diameter of the seminiferous tubules, the height of the seminiferous epithelium, and the number of Sertoli cell nucleoli per cross-sectioned seminiferous tubule in the treated groups were not significantly different from those of their respective untreated controls. IL-6KO and B6C3 F1 mice had significantly lower caudal epididymal weights than controls. These changes were not due to decreased sperm counts, and the finding suggests that deoxynivalenol may have an adverse affect on the epididymides (Sprando et al., 1999).
Pigs: Diets containing uncontaminated wheat, wheat contaminated with deoxy-nivalenol at 3.7 mg/kg, or maize inoculated with Fusarium at 4.2 mg/kg was fed to groups of 12–18 23-kg male and female Yorkshire pigs (equivalent to 0, 0.14, and 0.17 mg/kg bw per day) for 7 weeks. The diets caused a 23–29% reduction in feed consumption. The weight gain of animals on the diets containing contaminated wheat or maize was 30% and 72% less than that of controls, respectively, suggesting that there were additional metabolites in the maize diet. Histological examination of the testis (seminiferous epithelium) and ovary (follicle) revealed no significant differences in sexual development attributable to the diet (Friend et al., 1986a).
The results of these studies are summarized in Table 5.
Table 5. Reproductive and developmental effects of deoxynivalenol (purified, unless otherwise specified)
|
Species, strain, sex, age |
Study |
No. per group |
Dose |
Route |
Effect |
LOEL |
NOEL |
Reference |
|
|
mg/kg of diet |
mg/kg bw per day |
||||||||
|
Mouse, Swiss Webster, weanling |
Reproductive toxicity, 1 generation, in utero; 2 litters |
7–20 |
|
0.38, 0.75, 1.5, 2 |
Diet |
Maternal toxicity and/ or embryotoxicity |
0.38 |
|
Khera et al. (1984) |
|
Rat, Sprague Dawley, 30 days |
Reproductive toxicity, 1 generation, in utero; 65 days |
15 m, 15 f |
|
0.25, 0.5, 1 |
Diet |
Maternal toxicity and/ |
|
1 |
Khera et al. (1984) |
|
Rat, Sprague Dawley, 165 g |
Reproductive toxicity |
10 m, 25 f |
20 |
2 |
Diet |
Reduced fertility |
2 |
|
Morrissey & Vesonder (1985) |
|
Mouse, Swiss Webster, 30 g |
Developmental toxicity, days 8–11 |
15–19 |
|
0.5, 1, 2.5, 5, 10, 15 |
Gavage |
Teratogenic effects, increased resorptions; skeletal abnormalities |
5 |
2.5 |
Khera et al. (1982) |
|
1 |
0.5 |
||||||||
|
Rat, Fischer 344 |
Developmental toxicity, days 1–21 |
23 f |
0.5, 2, 5 |
0.025, 0.1, 0.25 |
Diet |
No teratogenic or reproductive effects; decreased dam weight |
0.1 |
0.025 |
Morrissey (1984) |
|
Rat |
Developmental toxicity, days 7–15 |
|
|
0.2, 1, 5, 10 |
Gavage |
Fetotoxic effects; delayed ossification |
1 |
0.2 |
Tutel’ian et al. (1991) |
|
Rabbit |
Developmental toxicity, days 0–30 |
13–15 |
0, 7.5,15, 30, 60, 120, 240 |
0.3, 0.6, 1, 1.6, 1.8, 2 |
Diet |
Increased fetal resorp- tion; reduced maternal and fetal weights |
1 |
0.6 |
Khera et al. (1986) |
|
White Leghorn laying hens, 20–23 weeks old |
Developmental toxicity, 70 days |
12 |
0.12, 2.5, 3.1, 4.9 + 12% 3-acetyldeoxynivalenol |
0.006, 0.12, 0.15, 0.25 |
Diet, naturally contaminated oats |
No effect on food intake, weight gain, egg production, fertility, hatchability, perinatal mortality, chick viability, body weight; developmental anomalies: delayed ossification, cloacal atresia, cardiac anomalies |
0.12 |
|
Bergsjø et al. (1993b) |
|
Pig, Yorkshire, 178 days old |
Developmental toxicity, days 1–54 of gestation |
8–10 |
0.13, 1.7, 3.5 |
0.003, 0.04, 0.07 |
Diet, naturally contaminated |
Maternal toxicity; decreased fetal weight; no gross malformations |
0.07 |
0.04 |
Friend et al. (1983) |
|
Pig, Yorkshire, 90 kg |
Developmental toxicity, throughout gestation and lactation |
6–10 |
0.2, 3.8, 6.2 |
0.003, 0.06, 0.09 |
Diet, naturally contaminated, restricted feed intake |
No maternal toxicity, no fetal effects or effects on piglets except transiently decreased kidney weights |
|
0.09 |
Friend et al. (1986b) |
Mice: Groups of 15 weanling mice of each sex (F0) were fed diets containing deoxynivalenol at concentrations that resulted in a dose of 0 or 2 mg/kg bw per day, and groups of seven male and 10–20 female mice received diets providing a dose of 0, 0.38, 0.75, or 1.5 mg/kg bw per day. The diets were fed continuously to the F0 parents and their progeny for the duration of the two experiments. After 30 days, the mice were allowed to mate within their experimental groups for a maximum of three 5-day trials. Females found to have mated successfully were allowed to litter normally. The F1a progeny of 10 dams in the control group and that receiving deoxynivalenol at 1.5 mg/kg bw per day were cross-fostered at birth, whereas the remaining F1a progeny were reared by their natural dams. The offspring were examined up to 21 days of age and were then discarded. The F0 mice were re-bred to produce F1b litters, which were killed on day 19 of gestation, and the fetuses were examined for gross, visceral, and skeletal malformations. The feed and water intakes and body weights of male and female F0 mice were reduced, as were the numbers of live pups and postnatal survivors, the postnatal body weight of F1a progeny, the number of live fetuses, and the mean weight of F1b fetuses. No adverse effects were found on the fertility of male and female F0 mice, and there were no major malformations in the F1b generation. Cross-fostering of the offspring of control dams and those at 1.5 mg/kg bw per day adversely affected postnatal survival and body weight after prenatal exposure or after combined pre- and postnatal exposure (Khera et al., 1984).
Rats: Groups of 15 male and 15 female Sprague-Dawley rats, 30 days of age, were fed diets containing deoxynivalenol (purity, 99%) to deliver a dose of 0, 0.25, 0.5, or 1 mg/kg bw per day. After 6 weeks of feeding, the rats were bred within groups, and the males were then discarded. The mated females were maintained on their respective diets throughout gestation and were killed on the last day of gestation; the fetuses were evaluated for effects on prenatal development. No reproductive effects were noted. Except for dilatation of the renal pelvis and urinary bladder, the significance of which was unclear, no other adverse effects were observed in the pups. Decreased body weight, related to decreased food consumption, was observed in dams at the two higher doses (Khera et al., 1984).
Groups of 10 male and 25 female Sprague-Dawley rats weighing 165 g were fed a diet containing purified deoxynivalenol at a concentration of 20 mg/kg (equal to about 2 mg/kg bw) for 60 and 15 days, respectively, before mating. Rats that ate the deoxynivalenol-supplemented diet throughout gestation and lactation showed no clinical signs of toxicity but had lower body weights than pair-fed rats. Only 50% of the matings between treated rats resulted in pregnancy, compared with 80% in controls fed ad libitum or pair-fed. No differences were seen in the sex ratio, survival rate, or average number and weight of litters. The weight gains of pups were comparable in all groups up to postnatal day 14, but between days 14 and 21, control male and female pups had significantly better weight gain than pups of treated dams. No treatment-related histological abnormalities were found in the testes or ovaries of treated pups (Morrissey & Vesonder, 1985).
Pigs: From the time of breeding at an average age of 178 days and a body weight of 121 kg, three groups of 12 Yorkshire gilts were offered ad libitum one of three diets containing 70% wheat and deoxynivalenol at a concentration of 0.1, 1.7, or 3.5 mg/kg from naturally contaminated wheat, equal to 0.002, 0.04, and 0.07 mg/kg bw per day. The gilts were housed and fed individually and were slaughtered on day 50–54 of gestation. The reproductive tract, oesophagus, stomach, large intestine, liver, heart, kidney, bladder, and adrenals were examined. The growth rate of gilts given the highest concentration of deoxynivalenol was significantly less (p < 0.01) than that of other gilts, probably as a result of reduced feed intake. The differences in organ weights were not significant. The fetal mortality rate, although lowest for gilts fed the highest concentration of deoxynivalenol, was not significantly different among the groups. There were significant linear trends towards lower fetal weight, decreased fetal length, and reduced osmolality of allantoic fluid with increasing concentration of deoxynivalenol which could not be attributed to a direct physiological or toxicological effect of deoxynivalenol. There was no increase in the frequency of fetal resorptions, and no gross malformations were observed, but the fetuses were not examined microscopically (Friend et al., 1983).
Groups of 6–10 Yorkshire gilts weighing 91 kg were fed restricted quantities (2 kg/day) of wheat diets containing deoxynivalenol at a concentration of 0.2, 3.8, or 6.2 mg/kg from naturally contaminated wheat, equal to 0.003, 0.06, and 0.09 mg/kg bw per day, respectively until farrowing, and unrestricted quantities of the same diets thereafter until weaning (total, 114 days). No effects on maternal weight gain or on the number and size of piglets at weaning or at time of market were observed (Friend et al., 1986b).
Mice: Deoxynivalenol dissolved in distilled water was given by oesophageal intubation to groups of 15–19 pregnant Swiss Webster mice on days 8–11 of gestation. The incidence of resorptions was 100% at 10 or 15 mg/kg bw per day and 80% at 5 mg/kg bw per day. At the lowest dose, the number of live fetuses and the average fetal weight were below those in controls. Visceral anomalies considered to be teratogenic effects were observed mainly in this group and included exencephaly (26%), syndactyly (19%), and hypoplastic cerebellum (93%). Low incidences of skeletal and visceral anomalies were found in the fetuses of dams at 1, 2.5, and 5 mg/kg bw per day. The skeletal malformations occurred in a dose-related manner and included lumbar vertebrae with fused arches or partly absent centra and absent or fused ribs attributed to retarded ossification (biologically not significant). There was no apparent maternal toxicity. No teratogenic or embryotoxic effects were seen in mice at 0.5 mg/kg bw per day (Khera et al., 1982).
Rats: The teratogenic potential of purified deoxynivalenol was studied by feeding a certified rat feed to which deoxynivalenol was added at a concentration of 0.0, 0.5, 2.0, or 5.0 mg/kg, equivalent to 0.025, 0.1, and 0.25 mg/kg bw per day ad libitum to groups of 23 female Fischer 344 rats throughout gestation. There were no overt signs of toxicity in the dams and no statistically significant differences in feed consumption in comparison with the control group. The dams receiving the two higher concentrations of deoxynivalenol tended to weigh less at term than other females, and their carcass weights were significantly lower (by 5%) than those of the control group after removal of the pups and uterus. The weights of the pups were unaffected by maternal treatment. Deoxynivalenol had no statistically significant adverse effects on the incidence of gross, skeletal, or visceral abnormalities, and neither dams nor pups showed any significant histopathological changes (Morrissey, 1984).
Rats were given an aqueous solution of deoxynivalenol by stomach tube, providing a dose of 0.2, 1, 5, or 10 mg/kg bw per day, on days 7–15 of gestation. On the basis of fetotoxic effects (skeletal abnormalities such as delayed ossification), the NOEL was 0.2 mg/kg bw per day (Tutel’ ian et al., 1991).
Rabbits: Groups of 13–15 adult female New Zealand white rabbits were fed diets containing deoxynivalenol (purity, > 98%) at a concentration of 0, 7.5, 15, 30, 60, 120, or 240 mg/kg throughout gestation, equal to 0, 0.3, 0.6, 1, 1.6, 1.8, and 2 mg/kg bw per day. An additional pair-fed control group was added for the group given 1.6 mg/kg bw per day. The incidence of fetal resorption was 100% in the females fed 1.8 or 2 mg/kg bw per day; although an increased incidence of resorption was also observed at 1 and 1.6 mg/kg bw per day, it was similar to that in the pair-fed controls. Maternal weight was decreased in the pair-fed controls and in rabbits receiving 1 or 1.6 mg/kg bw per day, with associated reductions in mean fetal weight of 7%, 7%, and 28%, respectively. No teratogenic effects were observed (Khera et al., 1986).
(i) Altered host resistance and humoral and cell-mediated responses
Mice: The studies in mice summarized in this section are shown in Table 6.
Table 6. Studies on the immunotoxicity of purified deoxynivalenol in mice
|
Length of study |
Route |
Effect |
LOEL |
NOEL |
Reference |
||
|
mg/kg bw per day |
mg/kg of diet |
mg/kg bw per day |
mg/kg of diet |
||||
|
5 weeks |
Gavage |
Antibody response |
0.75 |
|
ND |
|
Tryphonas et al. (1984) |
|
5 weeks |
Diet |
Host resistance, lymphocyte proliferation |
0.5 |
|
0.25 |
|
Tryphonas et al. (1986) |
|
2-4 weeks |
Diet |
Host resistance, delayed-type hypersensitivity, antibody response |
5a |
25 |
1a |
5 |
Pestka et al. (1987b) |
|
1–2 weeks |
Diet |
Antibody response, lymphocyte proliferation |
1.5a |
10 |
0.75a |
5 |
Robbana-Barnat et al. (1988) |
|
4 weeks |
Drinking- water |
Host resistance |
0.12 |
|
0.024 |
|
Sugita-Konishi et al. (1998) |
|
1 week |
Gavage |
Host resistance |
6.25 |
|
ND |
|
Atroshi et al. (1994) |
|
6 weeks |
Diet |
Serum immunoglobulin A |
0.4a |
2 |
0.1a |
0.5 |
Forsell et al. (1986) |
|
4–12 weeks |
Diet |
Serum immunoglobulin A |
2a |
10 |
0.4a |
2 |
Greene et al. (1994) |
|
12 weeks |
Diet |
Kidney immunoglobulin A deposition, immuno-globulin A-associated nephropathy |
0.4a |
2 |
ND |
|
Greene et al. (1994) |
|
2–7 days |
Gavage |
Cytokine expression |
2 |
|
0.5 |
|
Zhou et al. (1998) |
a Calculated from feed intake and body weight
Groups of 12 male weanling Swiss Webster mice were given deoxynivalenol by gavage at a dose of 0.75 or 2.5 mg/kg bw per day for 5 weeks. The antibody response to sheep red blood cells was suppressed, and the lower dose decreased the weights of the spleen and thymus (Tryphonas et al., 1984).
In a follow-up study by the same group, immune function was studied in groups of 6–10 male weanling Swiss Webster mice fed purified deoxynivalenol at 0, 0.25, 0.5, or 1 mg/kg bw per day for 5 weeks. Spleen plaque-forming cells and serum antibody responses to sheep red blood cells were unaffected at any dose. At the two higher doses, deoxynivalenol induced a dose-related reduction in the time to death after a challenge with Listeria monocytogenes and increased proliferative capacity in splenic lymphocytes stimulated with phytohaemagglutinin. No effects were observed at 0.25 mg/kg bw. The authors estimated that the NOEL for immunotoxicity in mice was 0.25–0.5 mg/kg bw per day (Tryphonas et al., 1986).
After 2–3 weeks on a diet containing deoxynivalenol at 25 mg/kg, equal to 5 mg/kg bw per day, groups of five female B6C3F1 mice showed depressed plaque-forming cell response to sheep red blood cells, delayed hypersensitivity response to keyhole limpet haemocyanin, and reduced ability to clear L. monocytogenes in comparison with pair-fed controls, whereas a diet containing 5 mg/kg, equal to 1 mg/kg bw per day, had no effect on these parameters. The effects on resistance to Listeria and delayed hypersensitivity seen after 2–3 weeks disappeared when feeding was extended to 8 weeks; however, the effects on the plaque-forming cell response were detected after both 2 and 8 weeks of ingestion of the mycotoxin. The NOEL for deoxynivalenol was 1.0 mg/kg bw per day (Pestka et al., 1987b).
Groups of eight female B6C3F1 mice were fed AIN 76A semi-purified diets containing purified deoxynivalenol at 0, 0.5, 2, 10, or 25 mg/kg (equal to 0, 0.1, 0.4, 1, 2, and 5 mg/kg bw per day) for 6 weeks. Leukocyte counts were depressed at doses > 10 mg/kg of diet. The NOEL for this parameter was 1 mg/kg per day (Forsell et al., 1986).
Groups of 4–17 male BALB/c mice, 4–6 weeks old, were fed diets containing deoxynivalenol at a concentration of 0, 2.5, 5, 10, 20, or 50 mg/kg, equivalent to 0, 0.37, 0.75, 1.5, 3, and 7.5 mg/kg bw per day, for 1 or 2 weeks. Control animals were pair-fed at the highest dose. At concentrations > 10 mg/kg of diet, reductions were seen in the response to sheep red blood cells, splenic leukocyte responses to phytohaemagglutinin and lipopolysaccharide, and thymic responses to phytohaemag-glutinin; the weight of the thymus was reduced, with extensive atrophy. The NOEL was 5 mg/kg of diet, equivalent to 0.75 mg/kg bw per day (Robbana-Barnat et al., 1988).
Groups of 10 male BALB/c mice, 7 weeks of age, were given deoxynivalenol in their drinking-water at a concentration of 0, 0.2, 1, or 3 mg/L for 4 weeks, equivalent to intakes of 0, 0.024, 0.12, and 0.36 mg/kg bw per day, and resistance to Salmonella enteritidis was evaluated on day 14. These concentrations of deoxynivalenol did not cause refusal of water or feed. Deaths due to S. enteritidis infection were observed at 1 and 3 mg/L but not at 0.2 mg/L. In mice given drinking-water containing deoxynivalenol at 2 mg/L, both IgM antibody (p < 0.005) (humoral) and delayed-type hypersensitivity (p < 0.05) (cell-mediated) responses to S. enteritidis were significantly suppressed. The authors reported a LOEL, based on water intake, of 0.12 mg/kg bw per day (Sugita-Konishi et al., 1998). The Committee noted that the data on S. enteritidis infectivity were presented in a descriptive fashion without statistical analysis.
Groups of five lactating, inbred Han:NMR1 mice were given deoxynivalenol at 12.5 mg/kg bw for 1 day or at 6.25 mg/kg bw for 7 consecutive days by gavage, and their resistance to the mastitic pathogens Staphylococcus hyicus and Mycobacterium avium was examined. No suppression of the immune response was observed. Rather, both treatments enhanced resistance to S. hyicus but not to M. avium. In mice infected with S. hyicus, administration of deoxynivalenol for 1 day increased total serum IgA, whereas administration for 7 days increased IgA, IgM, and IgG (Atroshi et al., 1994). Enhanced host resistance is seen frequently when trichothecenes are administered just before challenge with a model pathogen (Bondy & Pestka, 2000).
Chickens: Groups of 10 female white Leghorn chicks, 1 day old, were fed diets containing uncontaminated wheat or naturally contaminated wheat containing deoxynivalenol at a concentration of 18 mg/kg, equivalent to 2.25 mg/kg bw per day, for 18 weeks. The contaminated diet resulted in a suppressed antibody response to Newcastle disease vaccine given at week 14. When groups of three 1-day-old broilers were fed a diet containing 50 mg/kg, equivalent to 6.25 mg/kg bw per day, a suppressed lymphocyte blastogenesis response was seen (Harvey et al., 1991).
Pigs: Groups of six to eight castrated male Yorkshire pigs (6–7 weeks old, weighing 13 kg) were given diets amended with maize naturally contaminated with deoxynivalenol at a concentration of 0, 0.95, 1.8, or 2.8 mg/kg of feed, equal to 0.08, 0.13, and 0.18 mg/kg bw per day for 28 days. The diet also contained 15-acetyldeoxynivalenol at about 25% the concentration of deoxynivalenol and zearalenone at about 4%. Antibody responses to sheep red blood cells were delayed in animals exposed to the two highest concentrations; the results for pair-fed controls indicated that this was not solely a nutritional effect. The treatments had no effect on peripheral blood mononuclear cell proliferative responses to the mitogens concanavalin A, phytohaemagglutinin, and pokeweed mitogen. At the end of the experiment, the total leukocyte count was found to be increased with increasing deoxynivalenol concentration, apparently due to increases in segmented and band neutrophil counts. No alterations were seen in monocyte and eosinophil counts. The NOEL for the most sensitive immune parameter was 0.08 mg/kg bw per day (Rotter et al., 1994b). It should be noted that castration might alter the sensitivity of pigs, as was seen in mice (Greene et al., 1994).
The effects on the immune response of diets containing naturally contaminated oats containing deoxynivalenol at a concentration of 0.6 (control), 1.8, or 4.7 mg/kg of feed (equivalent to 0.024, 0.072, and 0.2 mg/kg bw) for 9 weeks were investigated in groups of eight male and female growing Norwegian Landrace pigs. The immune response was evaluated on the basis of primary and secondary antibody titres after injection of five antigens: human serum albumin, sheep red blood cells, paratuberculosis vaccine, tetanus toxoid, and diphtheria toxoid. Tests for delayed hypersensitivity and lymphocyte stimulation were also performed. A significant, dose-dependent reduction in secondary antibody response to tetanus toxoid was observed. A slightly higher mitogen response after phytohaemagglutinin stimulation was seen in lymphocytes from animals given the two higher doses of deoxynivalenol when compared with the group given the lowest dose after 9 weeks, but this result was considered inconclusive. No other indication of dose-dependent inhibition or stimulation of immune response was found, and there was no evidence for the presence of IgA-associated nephropathy (Øvernes et al., 1997). The Committee noted that this study was limited by the absence of a toxin-free control group, and no LOEL or NOEL could be identified.
(ii) Altered serum IgA levels
Mice: Groups of eight weanling female B6C3F1 mice were fed AIN 76A semi-purified diet containing purified deoxynivalenol at a concentration of 0, 0.5, 2, 10, or 25 mg/kg, equal to 0, 0.1, 0.4, 2, and 5 mg/kg bw per day, for 6 weeks. The serum IgA levels were increased at doses > 0.4 mg/kg bw per day, with no effect at 0.1 mg/kg bw per day. The serum IgM level was decreased in animals at 5 mg/kg bw per day. The NOEL was 0.1 mg/kg bw per day (Forsell et al., 1986).
The same group subsequently reported that the serum IgA level could be induced maximally in female B6C3F1 mice by feeding them a diet containing deoxynivalenol at 25 mg/kg, equal to 5 mg/kg bw per day. The effect was detectable after 4 weeks of treatment, and the level increased to 17 times the control level after 24 weeks. Concurrent decreaseswere seen in serum IgM and IgG. Comparison with diet-restricted controls showed that these effects on the Ig isotype were not due solely to reduced food intake (Pestka et al., 1989).
In a later study, the same group compared the sensitivity of groups of seven to nine male and female B6C3F1 mice, 8–10 weeks old, and found that a dietary concentration of deoxynivalenol of at least 10 mg/kg was necessary to induce consistent, significant increases in serum IgA level in males and females at 4, 8, and 12 weeks; 2 mg/kg had no effect. This would indicate a NOEL for deoxynivalenol of 0.4 mg/kg bw per day (Greene et al., 1994).
In a 2-year study, B6C3F1 mice were given diets containing purified deoxy-nivalenol at a concentration of 0, 1, 5, or 10 mg/kg of feed, equal to 0, 0.1, 0.5, and 1.1 mg/kg bw per day in males and 0, 0.1, 0.7, and 1.6 mg/kg bw per day in females. A linear, dose-related increase in serum IgA and IgG levels was observed in female but not male mice. The increase seen, about 1.5- fold, was much smaller than those found in studies of shorter duration from the laboratory of Pestka. The authors suggested that feeding deoxynivalenol for 2 years might have allowed for adaptation, thus masking earlier effects (Iverson et al., 1995). The Committee suggested that differences in the diets used (Purina certified feed in the last study and AIN-76A semi-purified diet in the previous studies) might also have played a role.
Pigs: In two studies (see section 2.2.2), groups of 7–11 female or castrated male growing Norwegian Landrace pigs were fed diets amended with oats naturally contaminated with deoxynivalenol at a concentration of 0, 0.7, 1.7, or 3.5 mg/kg, equal to 0.04, 0.1, and 0.2 mg/kg bw per day. No differences in serum IgA levels was detected, and no evidence for IgA-associated nephropathy was found (Bergsjø et al., 1993a).
The mechanistic basis for the increase in serum IgA induced by deoxynivalenol has been examined in detail, typically by giving a single concentration of 10–25 mg/kg of feed, equal to 2–5 mg/kg bw per day, to 8–10-week-old B6C3F1 mice to achieve the maximal response. Peyer’s patch lymphocytes and, to a lesser extent, splenic lymphocytes isolated from female B6C3F1 mice fed purified deoxynivalenol at 25 mg/kg of feed produced significantly more IgA than cultures derived from mice receiving diets ad libitum or restricted control diets. These results suggest that deoxynivalenol enhances differentiation to IgA secreting cells at the level of Peyer’s patches, which affects the systemic immune compartment (Pestka et al., 1989, 1990a,b; Bondy & Pestka, 1991).
With an ex-vivo approach and neutralizing antibodies, it was found that the potential for enhanced IgA production exists in mouse lymphocytes as early as 2 h and as late as 24 h after a single oral exposure to purified deoxynivalenol at 5 or 25 mg/kg bw (Yan et al., 1997). This effect may be related to an increased capacity to secrete the helper cytokines interleukin (IL)-2, IL-5, and IL-6. Both CD4+ and macrophage cells appear to be involved in this process. Thus, increased cytokine expression may be partly responsible for upregulation of IgA secretion in mice exposed orally to deoxynivalenol (Yan et al., 1998).
(iii) IgA-associated nephropathy
An increase in serum IgA level in female B6C3F1 mice after ingestion of a diet containing deoxynivalenol at 25 mg/kg, equal to 5 mg/kg bw day, for 24 weeks resulted in marked deposition of IgA in the kidney mesangium, mimicking common human glomerulonephritis (Pestka et al., 1989; Dong & Pestka, 1993). This effect has since been observed in several strains of mice. These IgA deposits can persist in the kidney for at least 16 weeks after 8 weeks’ feeding of deoxynivalenol (Dong & Pestka, 1993).
Administration to groups of seven to nine male and female B6C3F1 mice of a diet containing purified deoxynivalenol at a concentration of 2 or 10 mg/kg of feed (equal to 0.4–2 mg/kg bw per day) resulted at week 12 in a significant increase in renal mesangial IgA, in a dose-related manner, and to a greater extent in male mice. Other effects included haematuria and increased IgA immune complexes (Greene et al., 1994).
Another common feature of human IgA-associated nephropathy and the deoxynivalenol–mouse model is the involvement of polyvalent ‘natural’ IgA, which may be associated with immune complex formation and subsequent glomerulo-nephritis (Rasooly & Pestka, 1992, 1994; Rasooly et al., 1994; Yan et al., 1997).
Intermittent dietary intake by 8–10-week-old female mice of purified deoxy-nivalenol was less effective in inducing IgA-associated nephropathy than continuous exposure, perhaps due to the ability of mice to stop eating contaminated feed until it is replaced with control feed (Banotai et al., 1999a).
The presence of purified deoxynivalenol at 5 or 10 mg/kg of feed, equal to 1 or 2 mg/kg bw per day, induced IgA-associated nephropathy in murine models of systemic lupus erythematosus but did not exacerbate the manifestations of lupus (Banotai et al., 1999b).
(iv) Cytokine expression
The ability of deoxynivalenol to alter the expression of cytokines transiently is important because such effects can disrupt normal regulation of a wide variety of immune functions. Deoxynivalenol can up-regulate cytokine production in murine models in vitro and in vivo (Heller et al., 1990; Dong et al., 1994; Warner et al., 1994; Azcona-Olivera et al., 1995a,b; Ouyang et al., 1995, 1996a; Ji et al., 1998; Wong et al., 1998). The concentrations required for effects in vitro (50–1000 ng/ml) are readily attained within minutes in plasma, lymph, and other tissues of mice given 5 or 25 mg/kg bw by gavage and can last for several hours (Azcona-Olivera et al., 1995a). Thus, in-vitro approaches are suitable for exploring the mechanisms of action of deoxynivalenol in vivo.
Superinduction of cytokine gene expression by deoxynivalenol is mediated by both transcriptional and post-transcriptional mechanisms. For example, transcriptional mechanisms involving NF-B and AP-1 have been described for IL-2 in T-cell lines (Ouyang et al., 1996b; Li et al., 2000) and IL-6/TNF-alpha in cloned macrophage cell lines at deoxynivalenol concentrations of 100–250 ng/ml (Wong, 2000). With transcriptional inhibitors, superinduction of IL-2 mRNA expression by deoxynivalenol was found to be due partly to markedly increased IL-2 mRNA stability in T cells (Li et al., 1997) and IL-6/tumour necrosis factor (TNF)-alpha mRNA stability in macrophages (Wong, 2000).
The effects of deoxynivalenol on cytokine mRNA expression in groups of three male B6C3F1 mice were investigated after a single oral dose of deoxynivalenol at 0, 0.1, 0.5, 1, 5, or 25 mg/kg bw. The abundance of cytokine mRNA in spleen and Peyer’s patches (indicators of the systemic and mucosal immune compartments, respectively) were assessed 2 h after exposure by reverse transcriptase-polymerase chain reaction in combination with hybridization analysis. At 5 and 25 mg/kg bw, deoxynivalenol significantly induced the mRNAs for the proinflammatory cytokines IL-1beta, IL-6, and TNF-alpha; the T helper 1 cytokines interferon (IFN)-gamma and IL-2; and the T helper 2 cytokines IL-4 and IL-10, whereas lower doses had no effect. IL-12p40 mRNA was also induced. but IL-12p35 mRNA was not. The effects were more pronounced in spleen than in Peyer’s patches. IL-5 and TGF-alpha mRNAs were expressed constitutively in spleen and Peyer’s patches but were not affected by deoxynivalenol. The NOEL was 1 mg/kg bw per day (Zhou et al., 1997).
The same authors subsequently examined the effects of repeated doses of deoxynivalenol on cytokine expression. Groups of three male B6C3F1 mice, 8–10 weeks old, were given oral doses of purified deoxynivalenol at 0, 0.5, 2, or 5 mg/kg bw per day for 2, 4, or 7 days, and cytokine mRNAs were assessed 2 h after the last treatment in spleen and Peyer’s patches. After administration of 2 or 5 mg/kg bw per day, the relative abundance of IL-1beta, IL-6, TNF-alpha, IL-12 p35, IL-12p40, IL-2, and IL-10 mRNAs increased in a dose-related manner, whereas IFN-gamma and IL-4 mRNAs were unaffected. The NOEL was 0.5 mg/kg per day (Zhou et al., 1998).
(v) Apoptosis in lymphoid tissue
High doses of trichothecenes promote rapid onset of leukocyte apoptosis (programmed cell death), which is manifested as immunosuppression. Flow cytometry was used to demonstrate that deoxynivalenol inhibits or enhances apoptosis in a concentration-dependent manner in T cells, B cells, and IgA+ cells isolated from spleen, Peyer patches, and thymus. Induction of apoptosis was dependent on the lymphocyte subset, tissue source, and glucocorticoid induction (Pestka et al., 1994).
Deoxynivalenol-induced apoptosis was observed in murine macrophage cells in vitro. These results are relevant to whole animals, since administration of trichothecenes to rodents in vivo results in apoptosis in thymus, spleen, bone marrow, and liver (Ihara et al., 1997; Shinozuka et al., 1997; Ihara et al., 1998; Miura et al., 1998; Shinozuka et al., 1998).
(i) Biogenic amines
Groups of six male Sprague-Dawley rats weighing 180 g and 4-week-old white Leghorn cockerels were given purified deoxynivalenol at 2.5 mg/kg bw once by gavage. Whole brains collected 2, 6, 12, 24, and 48 h after treatment did not show altered concentrations of monoamine neurotransmitters or their metabolites. In a second experiment, in which brains collected 24 h after dosing were dissected into five regions, biogenic monamines were assayed by HPLC with ECD. Deoxynivalenol significantly increased the concentrations of serotonin (102–180% greater than control) and 5-hydroxyindole-3-acetic acid (27–79% greater than control) in all regions in rats, but did not significantly change the regional concentrations of noradrenaline and dopamine. In poultry, however, the treatment decreased the concentrations of noradrenaline in the hypothalamus and hippocampus and decreased those of dopamine in the pons and medulla oblongata. These results suggest that deoxynivalenol influences the metabolism of biogenic amines in brain and that there may be intraspecies differences in the central effects of this mycotoxin (Fitzpatrick et al., 1988a,b).
The effect of deoxynivalenol on brain amine concentrations was investigated in pigs, in which the toxin causes suppression of feed intake (anorexia) in susceptible animals. After administration of a single dose of deoxynivalenol at 0.25 mg/kg bw intravenously to groups of eight male castrated Yorkshire pigs, aged 10–13 weeks and weighing 15–23 kg, the concentrations of the endogenous catecholamines noradrenaline, dopamine, 3,4-dihydroxyphenyl acetic acid, and homovanillic acid and the indoleamines serotonin and 5-hydroxyindoleacetic acid were determined by HPLC with electrochemical detection in five brain regions periodically over 24 h after dosing. The effects of deoxynivalenol were specific to each transmitter, time, and brain region. The concentrations of the main transmitters (noradrenaline, dopamine, and serotonin) were statistically significantly different from those of controls in the hypothalamus, frontal cortex, and cerebellum up to 8 h after dosing. Overall, the concentration of noradrenaline in the hypothalamus was increased twofold within 1 h, decreasing thereafter, and that of dopamine in these regions was depressed; the concentration of serotonin, which increased initially(by 1 h) in the hypothalamus, dropped significantly below that of controls in both the hypothalamus and frontal cortex at 8 h. The authors considered that these were not neurochemical changes associated with chemical-induced anorexia but that the neurochemical effects of a single exposure to deoxynivalenol are due to peripheral toxicological events, such as vomiting, which can overwhelm the more subtle central feed refusal activity (Prelusky et al., 1992).
Groups of four castrated male specific pathogen-free Yorkshire pigs, aged 8–12 weeks and weighing 15–20 kg, were fitted with an indwelling catheter in the foramen magnum of the brain and given six doses of deoxynivalenol at 0 (saline), 10 (intravenous), or 30 (intragastric) µg/kg bw at 30-min intervals; the concentrations of neurotransmitters were measured in cerebrospinal fluid, as a reflection of brain activity. The cerebrospinal fluid was collected twice a day for 3 days before dosing and at 2-h intervals for 28 h and twice a day for an additional 3 days after dosing. The pigs showed no overt clinical signs of toxicosis, and the doses given did not induce emesis. The spinal fluid samples were analysed for the presence of 3-methoxy-4-hydroxyphenylethylene, 3,4-dihydroxyphenylacetic acid, 5-hydroxyindole acetic acid, homovanillyl alcohol, and homovanillic acid. Analyses for dopamine, normetanephrine, metanephrine, methoxytyramine, serotonin, and vanillic acid showed that they were present in quantities below the detection limit. A rapid, sustained increase (by about 50% in all four pigs) was found in the concentration of 5-hydroxyindole-3-acetic acid after intragastric administration, which remained elevated for up to 20 hours after oral dosing, and to a lesser extent after intravenous dosing, for up to 6 h (LOEL, 0.18 mg/kg bw after gavage and 0.06 mg/kg bw after intravenous administration). The author considered that these results indicated increased serotoninergic activity in the central nervous system and supported the theory of a link between elevated brain serotonin turnover and decreased feed intake. Alterations in dopamine metabolism were also observed. After intragastric dosing, a delayed increase in homovanillyl alcohol concentration (about 20% in three of four pigs) was seen, which suggested to the authors that the dopaminergic response was enhanced as serotoninergic activity diminished. After intravenous dosing, a rapid drop in homovanillic acid concentration (about 30% in three of four pigs) was observed, returning to normal within 36 h after dosing. The author suggested that this result indicated a direct toxic effect, possibly by inhibition of dopamine-metabolizing enzymes (Prelusky, 1993).
(ii) Effects of anti-emetic compounds and receptor-specific compounds
The effects of deoxynivalenol were investigated on gastric emptying and intestinal propulsion in groups of eight male ICR mice weighing 25–30 g and groups of eight male Wistar rats weighing 150–200 g and on gastrointestinal myoelectric activity in rats. Gastric emptying and intestinal transit were evaluated after gavage with a milk meal containing a marker (51CrO4Na2), and radiolabel was measured in the stomach and in 10 segments of the small intestine. The myoelectric activity of the antrum, duodenum, and jejunum was assessed by implanting electrodes for long-term electromyographic recording. Deoxynivalenol given orally at 10–1000 µg/kg bw 10 min before the test meal inhibited gastric emptying in a dose-related manner, but administration of 5 µg/kg bw intracerebrovascularly had no effect. Intestinal propulsion was reduced at the highest dose only. The inhibition of gastric emptying induced by deoxynivalenol was antagonized by ondansetron and granisetron given subcutane-ously (50 µg/kg bw) but not by ondansetron given intracerebrovascularly at 10 µg/kg bw. The anti-emetic compounds metaclopramide and domperidone at 1 mg/kg bw subcutaneously and methylsergide, ritanserin, and cisapride at 2 mg/kg bw subcutaneously did not modify the deoxynivalenol-induced inhibition of gastric emptying. In rats, gavage with a 2.5-ml milk meal increased the frequency of antral spike bursts from 1.9 ± 0.9/min in the fasted state to 4.7 ± 0.4/min, and disrupted intestinal migrating motor complexes for 85 ± 11 min. Oral administration of deoxynivalenol at 50–100 µg/kg bw 10 min before the meal did not modify the frequency of antral spike bursts but induced migrating motor complexes on the small intestine after the meal. This effect was reversed by ondansetron at 10 µg/kg bw subcutaneously. The authors concluded that, in rodents, deoxynivalenol inhibits gastric emptying by inducing intestinal migrating motor complexes through a peripheral action at the serotonin 3 receptors (Fioramonti et al., 1993).
In an investigation of the efficacy of several classes of receptor-specific antagonists in blocking the action of neurotransmitters possibly involved in the emetic effect of deoxynivalenol, groups of two castrated male specific pathogen-free Yorkshire pigs aged 6–8 weeks and weighing 15–20 kg were fitted with cannulae in the jugular vein and stomach. Each pig was used in up to four randomly assigned trials over a 4-week period, the time between trials ranging from 5 to 7 days. The ED50 in pigs given deoxynivalenol (purity, > 96%) was 75 µg/kg bw when it was administered intragastrically and 20 µg/kg bw intravenously. After anti-emetic pretreatment, the pigs were given deoxynivalenol at 80 µg/kg bw intravenously or 300 µg/kg bw intragastrically, and the onset of emesis was monitored. Certain specific antagonists of the serotonin3 receptor (ICS 205-930, BRL 43694 A) were found to prevent deoxy-nivalenol-induced vomiting, indicating that serotonin plays an important role in chemically induced emesis. The serotonin2-receptor antagonists cyprohepta-dine and sulpiride were also moderately effective, but only at high doses. Compounds with strong anticholinergic activity were effective but apparently act directly at the emetic centre and can thus prevent emesis regardless of the cause. No effect was seen with antihistaminic and antidopaminergic anti-emetics, except those that also have considerable anticholinergic activity, or with intravenously administered chlorpromazine, which has been speculated to block specific receptors in the brain chemoreceptor trigger zone reportedly involved in initiating emesis (Prelusky & Trenholm, 1993).
Groups of four specific pathogen-free castrated male Yorkshire pigs, 8–12 weeks old and weighing 15–20 kg, were fitted with cannulae in the jugular vein and the fundic region of the stomach. The effect of deoxynivalenol (purity, > 96%) on the plasma concentrations of serotonin, its metabolite 5-hydroxyindole-3-acetic acid, and their precursor tryptophan was investigated, as a reflection of an induced peripheral serotoninergic system. Typical values for the plasma concentrations of the three compounds were established, and changes were measured for 8 h after administration of deoxynivalenol intragastrically at 30 or 300 µg/kg bw or intravenously at 10 or 100 µg/kg bw. No effect was found, even at doses sufficient to induce emesis. The author concluded that deoxynivalenol has no peripheral effect that could account for the increased serotoninergic activity reflected by altered feeding behaviour or emesis (Prelusky, 1994).
The competitive potency of deoxynivalenol against several radioactive ligands that have a high affinity for serotonin receptor subgroups, such as [125I]lysergic acid, was investigated in a membrane receptor-binding assay in vitro. The brains were removed from 16 castrated male Yorkshire pigs, 12–14 weeks old and weighing 18–22 kg, and dissected on ice. The densities of receptor sites and the displacement profiles in 12 regions of the brain were investigated. Overall, deoxynivalenol had only minimal ability to block the serotonin ligands tested. The median concentration for inhibition of binding was at least 5 mmol/L, and a concentration of 100 mmol/L was ineffective in certain regions. In contrast, several standard serotonin antagonists had a 103–105 times greater ability than deoxynivalenol to displace binding of these ligands. As these results indicated that deoxynivalenol has only weak affinity for the serotonin receptor subtypes investigated, the author suggested that, unless relatively high concentrations of the toxin are present, its pharmacological effects in vivo may be mediated by mechanisms other than a functional interaction with serotoninergic receptors at the central level (Prelusky, 1996).
The ability of cyproheptadine, a serotonin antagonist at the serotonin2 receptor and a known appetite stimulant, to attenuate the adverse effect of deoxynivalenol was investigated in three trials with 21-day-old male ICR mice weighing 15–18 g. Groups of 10 mice received diets containing combinations of cyproheptadine and deoxynivalenol (purity, 99%), providing doses of deoxynivalenol of 4–16 mg/kg (equivalent to 0.6–2.4 mg/kg bw per day) and of cyproheptadine of 1.2–20 mg/kg (equivalent to 0.19–3 mg/kg bw). Cyproheptadine was administered in the feed for 2 days before addition of deoxynivalenol, and the two agents were then administered concurrently for 12 days. Cyproheptadine effectively offset the reduction in feed intake caused by deoxynivalenol, but only at certain doses. At a dose of deoxy-nivalenol of 4 mg/kg of feed, the optimal dose of cyproheptadine was 1.2–2.5 mg/kg of feed; at 8 mg/kg of feed, cyproheptadine was required at 2.5 mg/kg of feed; at 12 mg/kg of feed, the required dose of cyproheptadine was 2.5–5.0 mg/kg feed; and at 16 mg/kg of feed, cyproheptadine at 5–10 mg/kg feed was required. At lower doses of cyproheptadine ( 5 mg/kg of feed), alone or in combination with the lowest dose of deoxynivalenol tested, a modest increase in weight gain was noted, but this was not seen at higher concentrations of deoxynivalenol. The authors concluded that serotininergic mechanisms probably mediate the deoxynivalenol-induced reduction in feed intake. The finding that cyproheptadine significantly attenuated the effect of deoxynivalenol indicates the involvement of the serotonin2 receptor in this process (Prelusky et al., 1997).
(iii) Role of the chemosensitive area postrema
Conditioned aversion to the taste of saccharin was used to assess the aversive effects of deoxynivalenol in rats and to examine the putative role of the chemosensitive area postrema in the brain. In the first experiment, groups of seven adult male Long Evans rats weighing 330–370 g drank a 0.15% saccharin solution and then received an intraperitoneal injection of deoxynivalenol (purity, 98%) at 0.125 mg/kg bw or the vehicle, propylene glycol, at 0.5 ml/kg bw. In subsequent tests, the rats conditioned with deoxynivalenol had significant (p < 0.01), two- to fourfold lower absolute and relative intakes of saccharin than control rats, which showed a strong preference for the saccharin solution. In the second experiment, the area postrema of the brainstem was ablated by cauterization in groups of six adult male rats; another six rats received sham lesions. After a 10-day recovery, all rats drank the 0.15% saccharin solution for 2 days and were then given an intraperitoneal injection of deoxynivalenol at 0.125 mg/kg bw. In subsequent preference tests, the sham-operated rats showed a significant (p < 0.01) aversion to saccharin, while the area postrema-ablated rats showed a preference for the saccharin solution. The authors concluded that systemic administration of deoxynivalenol to rats after a novel taste induces conditioned taste aversions, which are mediated by the area postrema (Ossenkopp et al., 1994).
The haemolytic effects of deoxynivalenol on rat erythrocytes were studied at concentrations of 130, 200, and 250 µg/ml over 11 h. Complete haemolysis was achieved at the two higher concentrations by 10 and 7 h, but the lower concentration induced insignificant haemolysis. This finding suggests that there is a threshold below which the lytic reaction does not occur. An additional test conducted in the presence of mannitol, glutathione, ascorbic acid, alpha-tocopherol, and histidine showed that these compounds inhibited the haemolytic reaction to the toxins. The authors suggested that deoxynivalenol acts on prokaryotic cells in three ways: by penetrating the phospholipid bilayer and acting at the subcellular level; by interacting with cellular membranes; and by free radical-mediated phospholipid peroxidation. More than one mechanism probably operates at the same time (Rizzo et al., 1992).
Deoxynivalenol, fusarenon-X, and nivalenol suppressed the growth of a human hepatoblastoma cell line (HuH-6KK) at 0.15 mg/L in a serum-free medium without an extracellular matrix (1 x 10⁵ cells/ml), while aflatoxins did not inhibit growth even at 5 mg/L. The medium contained insulin, transferrin, ethanolamine, and selenite. The viability and growth of cells was evaluated in a MTT [3-(4,5-dimethylthiazol-2-yl)-2,5-diphenyl-2H-tetrazolium bromide] reduction assay. In a chemiluminescence assay, the IC50 for deoxynivalenol was 1.1 mg/L (Isshiki et al., 1992, 1995).
Cellular injury caused by deoxynivalenol was assessed by means of a series of enzymic and functional indexes in 4-h-old cultures of primary rat hepatocytes exposed for 24 h to deoxynivalenol at 10–2500 ng/ml. Clear evidence of cytotoxicity was obtained, as leakage of lactate dehydrogenase and alanine and aspartate amino-transferases was significantly increased (p = 0.05), while intracellular protein concentration and cell viability were significantly decreased (p < 0.01). The severity of morphological effects was dose-related, and the lesions were seen at concentra-tions > 10 ng/ml. Cytotoxic effects occurred in a dose-dependent manner, with a threshold at 50 ng/ml. Cell viability, measured as reduction of 3-(4,5-dimethylthia-zolyl-2)-2,5-diphenyltetrazolium bromide (MTT), and the intracellular protein content were affected at 10 ng/ml, with an IC50 of 1200 ng/ml (Tseng, 1998).
The effects of a 2-week exposure to low concentrations of deoxynivalenol on the structural and functional characteristics of the human colonic adenocarcinoma cell lines Caco-2 and T84 were examined. Scanning electron microscopic analysis of the apical surfaces of Caco-2 cells showed reduction or abnormal formation of brush borders in the presence of deoxynivalenol at 50, 100, or 200 ng/ml. Monolayer integrity, measured as the transepithelial electrical resistance of tight junctions, was studied in Caco-2 and T84 cells cultured on permeable membranes. The integrity of Caco-2 cells was significantly reduced at all three doses of deoxynivalenol. A dose-related increase in permeability to Lucifer yellow, significant at a dose of 100 ng/ml of deoxynivalenol, was also observed in these cells. The integrity of T84 cells was significantly reduced at 100 and 200 ng/ml, and permeability to Lucifer yellow was significantly increased at 200 ng/ml. Alkaline phosphatase activity in Caco-2 cells was reduced from day 6 to day 15 of culture in the presence of 100 or 200 ng/ml of deoxynivalenol, whereas adding 50 or 100 ng/ml of deoxynivalenol for 15 or 20 days significantly decreased sucrase-isomaltase activity. The protein content was attenuated only by treatment with 200 ng/ml throughout the experiment. The results indicate that deoxynivalenol interferes with structural and functional characteristics of differentiation in enterocytes at low doses (Kasuga et al., 1998).
The human haematopoietic progenitors, granulocyte–monocyte colony-forming units (CFU-GM), were grown in culture in the presence of deoxynivalenol at 3, 90, or 300 ng/ml for up to 14 days. Complete inhibition of growth was observed at the highest dose at all times; partial inhibition was seen at 90 ng/ml, and at 3 ng/ml colonies were inhibited at day 7, with some recovery during the next 7 days. The authors proposed that the haematological lesions observed during human intoxication are due to destruction of haematopoietic progenitors such as CFU-GM (Parent-Massin et al., 1994).
Rat CFU-GM were cultured in the presence of deoxynivalenol at 3, 30, or 300 ng/ml for up to 14 days. Complete inhibition of growth was observed at the highest dose at all times. With 30 ng/ml, increased growth of colonies was observed; no toxicity was observed at 3 ng/ml (Parent-Massin & Thouvenot, 1995).
CFU-GM from human umbilical cord blood or from rat bone marrow were cultured in the presence of deoxynivalenol at 4–400 ng/ml for 14 days. Deoxynivalenol rapidly inhibited human and rat CFU-GM in a concentration-dependent manner at doses of 100–400 ng/ml. The IC50 values for human CFU-GM were 12 ng/ml on days 7 and 10 and 16 ng/ml on day14; those for rat CFU-GM were 100 ng/ml on day 7, 60 ng/ml on day 10, and 64 ng/ml on day 14, the human cells being significantly more sensitive than rat cells. The authors reported that previous studies in their laboratory had shown that deoxynivalenol was about 10 times less toxic to human CFU-GM and about 100 times less toxic to rat CFU-GM than T-2 or HT-2 toxin (Lautraite et al., 1997).
As trichothecenes are known to induce haematological disorders such as neutropenia, thrombopenia, and aplastic anaemia in human and animals, the same group also studied the effect of deoxynivalenol at concentrations of 3–75 ng/ml and other trichothecenes in a model of human erythroblastic progenitors. Human cells were as sensitive to trichothecenes as human CFU-GM, except that deoxynivalenol caused only a slight decrease in proliferation at the highest dose (Rio et al., 1997).
The effects of deoxynivalenol at a concentration of 0, 30, 60, or 400 ng/ml for up to 72 h on the expression of the sequentially expressed activation markers CD69, CD25, and CD71 and on proliferation of human CD4+ and CD8+ lymphocytes provided by three healthy women were studied in culture. After 6 h at the highest concentration, less CD69 was expressed in exposed cultures than in controls, but after 24 and 48 h of exposure, an increased frequency of cells expressing CD69 was found, indicating a delay in down-regulation of CD69 expression. At 24 h, stimulation of CD25 expression was observed at doses below the IC50 value, while suppression was found at higher doses. The pattern differed from that of CD69 expression, in that increased expression of CD25 did not occur after exposure to the highest concentration of the toxin and no stimulation was found after 48 h of exposure, indicating that the response was inhibited and not delayed. The effects of the toxin on CD71 expression were similar to those on CD25 expression. The authors concluded that deoxynivalenol exerts its main antiproliferative action early in the cell cycle, before or in conjunction with CD25 expression. Cell proliferation, measured by bromodeoxyuridine (BrdU) flow cytometry, was inhibited by 8%, 19% and 99% at the three concentrations of deoxynivalenol, respectively (Johannisson et al., 1999). The Committee noted that inclusion of results obtained with a concentration of about 200 ng/ml would have been informative.
Individual differences in sensitivity and the individual and combined effects of deoxynivalenol, T-2 toxin, diacetoxyscirpenol, and nivalenol on production of IgM, IgA, and IgG were studied in human lymphocytes in vitro. All four trichothecenes effectively inhibited mitogen-induced lymphocyte proliferation and immunoglobulin production in a dose-dependent manner, with limited variation in sensitivity between individuals. The IC50 values for immunogloblulin production by deoxynivalenol (approximately 120 ng/ml) were similar to those in the tests for proliferation. Greater IgA synthesis than in controls was observed in cell cultures exposed to the lower doses of deoxynivalenol. Combined exposure to two of the toxins resulted mainly in additive or antagonistic effects, although synergistic effects could not be excluded. The authors concluded that the total intake of type A and B trichothecenes should be taken into account in risk assessments (Thuvander et al., 1999).
The history of mycotoxicosis due to scabbed grains, which cause feed refusal and emesis, in monogastric animals was reviewed by Vesonder & Hesseltine (1980). Feed refusal by pigs and equines fed scabbed barley was reported in 1928. In 1972, maize naturally contaminated with F. graminearum resulted in feed refusal and emesis in pigs, and led to the identification of deoxynivalenol (Vesonder et al., 1973).
In 1984, complete feed refusal was observed in weanling pigs on a farm in Queensland, Australia, which was associated with the presence of F. graminearum in wheat, triticale, and barley. These grains contained deoxynivalenol at 34, 10, and < 0.1 mg/kg, respectively, and zearalenone was found at concentrations of 6.2, 2.8, and 0.1 mg/kg of feed. The feed intake of growing pigs was reduced, and young gilts were found to have red, swollen vulvas, indicating that both mycotoxins played a role in this outbreak (Moore et al., 1985).
Feed refusal by pigs was observed in 1986 in Argentina. The concentrations of deoxynivalenol were found to be 1–40 mg/kg in wheat and 1.7–8 mg/kg in formulated feed (Marpegan et al., 1988).
An episode of suboptimal growth, poor feathering, and behavioural abnormalities in broilers in Scotland during the winter of 1980–81 was considered to be associated with mould-contaminated maize and wheat in the feed, from which fusaria were isolated in persistently high numbers. Four species, F. culmorum, F. tricinctum, F. nivale, and F. moniliforme, were identified. Chloroform extracts of the raw materials and of an artificial medium in which three of the Fusarium species were cultured proved toxic to cultures of a human epithelial cell line (HEp II). The mycotoxins deoxynivalenol, zearalenone, and diacetoxyscirpenol were identified by thin-layer chromatography (TLC) in some extracts, and several other areas of the chromatograms were found to be toxic to the HEp II cell system. These may have contained toxins for which standards were not available or, alternatively, previously uncharacterized fungal metabolites. The authors concluded that the toxins produced by the fusaria were major contributing factors to the symptoms in the birds (Robb et al., 1982).
In 1987, an epizootic at a wildlife research centre in Maryland, USA, caused symptoms in 80% of 300 captive whooping cranes (Grus americana) and sandhill cranes (G. canadensis) and the deaths of 15 of these birds. Gross examination revealed dehydration, atrophy of fat, renal insufficiency, and small spleens, which were considered inconclusive findings. Extensive testing resulted in isolation of Fusarium spp. from constituents of the grain-based diet, and low concentrations of T-2 toxin (1–2 mg/kg) and deoxynivalenol (0.4 mg/kg) were isolated from pelleted feed (Olsen et al., 1995).
The acute effects of deoxynivalenol—nausea, vomiting, diarrhoea, abdominal pain, headache, dizziness, and fever—can develop within 30 min of exposure and are difficult to distinguish from gastrointestinal conditions attributed to microbes, such as the preformed emetic toxins from Bacillus cereus. No deaths attributed to deoxynivalenol have been reported in humans (Luo, 1988).
Acute outbreaks of red mould toxicosis affecting humans and involving F. graminearum have been reported in China, India, and Japan. Deoxynivalenol has also been investigated for its possible role in chronic diseases such as oesophageal cancer, stomach cancer, liver cancer, and a form of osteoarthritis. Some of these studies were reviewed previously (IARC, 1993; Kuiper-Goodman, 1994; Wild & Hall, 1996).
About 35 outbreaks of acute human illness were reported in China between 1961 and 1985 that were attributed to consumption of scabby wheat and mouldy maize, with at least 7818 victims. Typically, the persons became ill 5–30 min after consumption, with symptoms of nausea, vomiting, diarrhoea, abdominal pain, headache, dizziness, and fever. No deaths were reported. In an outbreak in 1984 in Xingtai County, 362 of 383 (94%) persons who ate mouldy maize became ill. Analysis by TLC of five samples associated with symptoms in this outbreak, with approximate limits of detection (LODs) of 0.1, 0.04, and 0.05 mg/kg for deoxynivalenol, T-2 toxin, and zearalenone, respectively, indicated the presence of deoxynivalenol at 3.8–93 mg/kg and zearalenone at 0.13–0.59 mg/kg in four samples; one sample contained deoxynivalenol at 0.34 mg/kg and zearalenone at 0.004 mg/kg; neither T-2 toxin nor nivalenol was found. The authors reported the presence of deoxynivalenol at a concentration of 1–40 mg/kg in scabby wheat collected from three villages and significantly higher concentrations of deoxynivalenol in wheat samples collected during the food poisoning incident than in samples not associated with the incident (Luo, 1988). The Committee noted that deoxynivalenol was probably responsible for the mycotoxicoses involving scabby wheat and mouldy maize, as zearalenone is relatively non-toxic after a single exposure.
No cases of acute illness were observed in Henan, China, in 1985 among 191 peasant families who ate scabby wheat containing deoxynivalenol at a concentration of 0.016–3.3 mg/kg (mean, 0.92 mg/kg) and nivalenol at a mean concentration of 0.13 mg/kg (both measured by GC–ECD). On the basis of a loss of deoxynivalenol during processing of about 30% and an intake of 560 g/person, the authors estimated an intake of deoxynivalenol of 380–520 µg/adult, which, for a body weight of 50 kg, would give an intake of 7.5–10 µg/kg bw. The authors indicated that the concentrations of deoxynivalenol in the following year were 0.007–0.18 mg/kg (Guo et al., 1989).
In Linxian, China, a high-risk area for oesophageal cancer (mortality rate, 132 per 100 000), no cases of acute disease were observed among oesophageal cancer patients who consumed a staple diet containing maize and maize meal containing deoxynivalenol at concentrations of 0.36–13 mg/kg (mean, 5.4 mg/kg) and nivalenol at 0.054–2.8 mg/kg (mean, 0.76 mg/kg), both analysed by TLC and HPLC, in 1985–86 (Hsia et al., 1988). The Committee noted that, as the intake of maize was not given, the intake of deoxynivalenol could not be estimated.
Studies conducted in 1989 to compare maize samples collected randomly from families with oesophageal cancer patients in Linxian with samples from families with no such cancer in Shangqiu (mortality rate from this cancer, 16 per 100 000) indicated that the mean concentration of deoxynivalenol in maize was 0.57 mg/kg (range, 0.017–3.5 mg/kg) in Linxian and 0.099 mg/kg (range, 0.011– 0.61 mg/kg) in Shangqiu. The samples were analysed by GC–ECD (Luo et al., 1990).
The natural occurrence of mycotoxins was compared in staple foods from high- and low-risk areas for oesophageal cancer in China. A total of 54 samples of maize and 40 samples of wheat intended for human consumption were collected during January and February 1995 from Linxian and Shangqui counties in Henan Province, high- and low-risk areas for oesophageal cancer, and were analysed for fumonisins and trichothecenes by GC–MS and for zearalenone by HPLC. The prevalence of trichothecenes and zearalenone in maize samples from the high-risk area was 3.7- and 11-fold higher (p < 0.01), respectively, than that in maize from the low-risk area. Significantly higher mean concentrations were found in the high-risk area than in the low-risk area, for deoxynivalenol (0.4 versus 0.05 mg/kg), 15-acetyldeoxynivalenol (0.24 versus undetected), nivalenol (0.086 versus 0.059), and zearalenone in maize and of deoxynivalenol (0.08 versus 0.04 mg/kg) and nivalenol in wheat. Fumonisins were found in 79% of maize samples from the high-risk area and 50% of samples from the low-risk area, but the concentration was similar: about 3.4 mg/kg. The authors concluded that the concentrations of trichothecenes and zearalenone correlated with the incidence of oesophageal cancer (Gao & Yoshizawa, 1997).
Fungal and mycotoxin contamination of 220 maize or wheat samples and 34 maize samples from four locations in Cixian County, an area with a high incidence of oesophageal carcinoma, was analysed in 1990–94; 26 maize samples collected from an area with a relatively low incidence of oesophageal carcinoma in Zanhuang County, with similar dietary customs, were analysed for mycotoxins in 1990. The maize and wheat were severely contaminated, F. moniliforme and Penicillium spp. being the predominant fungi in maize and these as well as Alternaria alternata and Aspergillus flavus in wheat. HPLC showed low concentrations of deoxynivalenol (0.05–0.17 mg/kg) in the four areas with a high incidence of oesophageal carcinoma and none in the control area. The authors concluded that fungal and mycotoxin contamination of foodstuffs in Cixian County is common (Zhang et al., 1998). The Committee noted that the units may be in error since the values appear to be lower than expected.
Consumption of fermented maize pancakes was associated with increased rates of death from stomach cancer in rural Linqu County in Shandong Province, China. To determine whether mycotoxins accounted for the increased risk, specimens of maize, maize meal, unfermented and fermented pancake batter, and cooked fermented pancakes from 16 households in five villages in Linqu County were obtained in 1996. The samples were analysed for aflatoxins, fumonisins, zearalenone, deoxynivalenol, and 15-acetyldeoxynivalenol, the limit of detection for the last two compounds being 0.5 mg/kg. No aflatoxin was detected, but fumonisins were detected in 6–19% of the maize products at concentrations of 0.6–7.2 mg/kg. Deoxynivalenol and 15-acetyldeoxynivalenol were detected in 58 and 17% of the raw maize specimens, respectively, and zearalenone was detected in 15% of the maize meal specimens. Analysis for deoxynivalenol showed that 33% of the raw maize samples and 21% of the cooked pancakes contained > 1 mg/kg (maximum, 2.7 mg/kg and 1.5 mg/kg, respectively). The concentrations of mycotoxins did not increase with fermentation. The authors concluded that the concentrations were similar to or lower than those found in the USA, and did not increase the risk for gastric cancer among people who consumed fermented pancakes (Groves et al., 1999). The Committee noted that differences in the rate of stomach cancer among the five villages were not reported and a control area with a low rate of stomach cancer was not included. The detection limits for the mycotoxins were high. The amount and frequency of pancakes consumed was not given, and this could be considerably greater than that in the USA.
The natural occurrence of aflatoxin B1, fumonisins, and trichothecenes was investigated in maize samples harvested in areas of low and high risk of primary liver cancer, Penlai (Sandong) and Haimen (Jiangsu), respectively, in China, during 1993. In Haimen, 40 samples contained a mean concentration of deoxynivalenol of 0.89 mg/kg, and in Penlai, 13 kernel samples contained a mean of 0.49 mg/kg. The authors concluded that co-contamination of Chinese maize with aflatoxin B1, fumonisins, and deoxynivalenol is common (Wang et al., 1995).
A total of 35 maize and wheat samples from several areas of high and low incidence of Kashin-Beck disease (endemic osteoarthritis deformans) in China were surveyed in 1989 for contamination with mycotoxins, including fusarochromanone, produced by F. equiseti. Trichothecenes were analysed by GC–ECD (LOD, 0.005 mg/kg; recovery, > 96%). Deoxynivalenol was found at significantly higher concentra-tions in all high-incidence areas (range, 0.005–3.9 mg/kg) than in low-incidence areas (range, 0.002–0.7 mg/kg), with mean concentrations of 0.25 versus 0.05 mg/kg, 1.0 versus 0.27 mg/kg, and 0.51 versus 0.18 mg/kg in three areas of comparison. In addition, the concentrations of 15-acetyldeoxynivalenol and 3-acetyldeoxynivalenol, while somewhat lower than those of deoxynivalenol and nivalenol (which were about 10% those of deoxynivalenol) were also significantly higher in all high-incidence areas than in low-incidence areas. Fusarochromanone was not identified, regardless of the incidence of the disease (Luo et al., 1992).
In 1987, an acute outbreak of disease, affecting about 50 000 persons in the Kashmir valley in India, was attributed to consumption of bread made from wheat damaged by rain. The wheat was reported to contain several trichothecenes, including deoxynivalenol (0.34–8.4 mg/kg in 11 of 24 samples), acetyldeoxynivalenol (0.6–2.4 mg/kg in 4 of 24 samples), nivalenol (0.03–0.1 mg/kg in 2 of 24 samples), and T-2 toxin (0.55–4 mg/kg in 3 of 24 samples) (Bhat et al., 1989a,b). Interviews with about 150 affected families revealed that only persons who had eaten wheat products had become ill, showing mainly mild gastrointestinal tract symptoms for about 2 days. The authors estimated a NOEL of 0.44 µg/kg bw per day, on the basis of the lowest concentration of deoxynivalenol found in wheat (0.34 mg/kg), an average intake of 67 g of wheat products, and a mean body weight of 52 kg (Bhat et al., 1987). The Committee noted that, as samples were not collected until 4 months after the outbreak, a clear association of specific samples with specific cases of illness or lack of illness was not established. Furthermore, many of the collected samples contained other, more toxic trichothecenes, which may have contributed to the overall disease profile Therefore, the actual NOEL for trichothecene-associated human illness, expressed as equivalents of deoxynivalenol, could not be identified from these studies.
Deoxynivalenol has a 12,13-epoxy group, three OH functions, and an alpha,beta-unsaturated keto group. Its chemical name is therefore 12,13-epoxy-3alpha,7alpha,15-trihydroxy trichothec-9-ene-8-one. Its molecular formula, C15H20O6, shows that its relative molecular mass is 296.3. Deoxynivalenol crystallizes as colourless needles, with a melting-point of 151–153 °C. Its specific rotation has been determined to be [alpha]20D= +6.35. The alpha,beta unsaturated keto function results in absorption of ultra-violet (UV) radiation of short wavelength, but the UV spectrum of deoxynivalenol is not characteristic. As it is a type B trichothecene, deoxynivalenol is soluble even in water and in polar solvents such as aqueous methanol, aqueous acetonitrile, and ethyl acetate. Deoxynivalenol is stable in organic solvents (Shepherd & Gilbert, 1988), but ethyl acetate and acetonitrile are the most suitable solvents, particularly for long-term storage (Pettersson, 2000).
The 12,13-epoxy group is extremely stable to nucleophilic attack, and deoxy-nivalenol is stable at 120 °C and is not decomposed under mildly acidic conditions. The three hydroxyl groups can be derivatized (e.g. esterified), for instance before GC analysis.
Figure 2 gives the structures of the five common type B trichothecenes, deoxynivalenol, nivalenol, 3-acetyldeoxynivalenol, 15-acetyldeoxynivalenol, and fusarenon X, with the typical basic tetracyclic, sesquiterpenoid ring system.
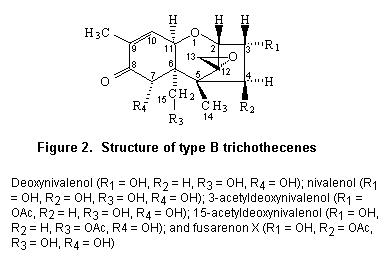
As the 12,13-epoxy trichothecenes are closely related, physicochemical analytical methods are usually designed to determine more than one trichothecene. However, the naturally occurring trichothecenes in cereals can be divided into polar substances carrying a keto group at C8 (type B trichothecenes) and less polar type A toxins which contain no keto function at C8 and generally fewer free hydroxyl groups. Hence, the analytical procedures usually differ in the extraction, clean-up, and end determination steps, depending on which group of trichothecenes is to be analysed.
Several methods for trichothecenes based on TLC are included in the Official Methods of Analysis of AOAC International. HPLC and GC methods were reviewed in detail by Scott et al. (1993) and Langseth & Rundberget (1998). The analysis of mycotoxins, including trichothecenes, has also been reviewed by Cole (1986), WHO (1990), Chu (1991), Steyn et al. (1991), Gilbert (1992a), Scott (1995), Trucksess (1995), and Lawrence & Scott (2000). Various immunochemical methods, especially enzyme-linked immunosorbent assays (ELISAs), have been established for the determination of selected trichothecenes, as reviewed by Morgan (1989), Candlish (1991), and Park & Chu (1996). The method chosen depends on the instrumentation available, the required detection limit, the matrix composition, and the analyte properties.
The choice of analytical method also depends on the availability of appropriate calibrants of defined concentration. Comparative studies (Pettersson, 1998; Josephs et al., 2001) clearly show that determination of the concentration of calibrant solutions is still a serious problem in the analysis of deoxynivalenol, resulting in a coefficient of variation (CV) > 20% (Schuhmacher et al., 1996). Studies in which a common calibrant was provided to participants resulted in much better agreement for naturally contaminated samples (CV = 19%). A major task of the Standard, Measurement and Testing project of the European Union (Pettersson, 1998) was to check the purity of calibrants for trichothecenes and to develop a common procedure.
The purity of trichothecenes is often claimed to be high (> 95%), but the bound solvent or water is not always taken into account. The concentration of dissolved trichothecene calibrants should therefore be checked, e.g. by spectrophotometry. Owing to the extensive absorption below lambda = 220 nm, methanol is not suitable for UV determination, especially of type A trichothecenes, which have an absorption maximum around 205 nm in methanol. Therefore, for spectrophotometric determina-tion of both A and B trichothecenes, acetonitrile is the recommended solvent (Pettersson, 1998). Values for the molar absorptivity of B trichothecenes ranging from 4500 to 7040 are found in the literature, but the Standard, Measurement and Testing project suggested use of 6400 as the molar absorptivity for all type B trichothecenes in acetonitrile, and a spectrophotometric method for assessing the purity of solid A and B trichothecenes has been developed within the framework of the project. In addition to the UV method, HPLC separation is recommended for determination of impurities, with a final comparison of the concentrations of new and old calibrants by GC. Owing to the lack of an UV-absorbing keto-group and with the double bond between C-9 and C-10, which allow B trichothecenes to absorb at 219 nm relatively well, spectrophotometric determination of concentrations cannot be recommended for A trichothecenes.
The commonest methods for final separation and detection of mycotoxins such as trichothecenes in agricultural commodities are still based on TLC. This method is simple and economical, and, with the introduction of high-performance TLC and scanning instruments, the efficiency and precision of separation are comparable to those achieved with other types of chromatography. TLC is still commonly used for the final separation step in the determination of deoxynivalenol. Reagents such as sulfuric acid and para-anisaldehyde are required, however, to visualize the non-fluorescent, short wavelength (lambdamax = 220 nm) absorbing deoxynivalenol (Scott et al., 1970; Ueno et al., 1973). Besides the spray reagents which are specific for the 12,13-epoxy group of the trichothecenes (e.g. 4-para-nitrobenzylpyridine or nicotinamide in combination with 2-acetylpyridine), AlCl3 is probably the most useful reagent for visualizing deoxynivalenol and other type B trichothecenes. AlCl3 has been tested in a collaborative study for the determination of deoxynivalenol by AOAC International (Eppley et al., 1986).
ELISAs have been developed for rapid screening or quantification of tricho-thecenes in cereals, and both ELISA and TLC are used for rapid detection of deoxynivalenol. In less complex matrices, such as pure cereals, these methods can also be used for quantification of deoxynivalenol. ELISAs involve use of specific antibodies, which are derived by a series of complex procedures including immunogen synthesis, immunization of animals, isolation, and characterization of antibodies. ELISAs are selective, sensitive, rapid, and easy to use, and clean-up, if any, is minimal. Owing to the multiple properties of trichothecenes, however, production of useful antibodies against these compounds has proved difficult. A wide range of ELISAs has been developed that involve polyclonal IgG and IgY antibodies, and monoclonal antibodies have been elicited for use in direct and indirect competitive assays. Usually, acetonitrile and water, methanol and water, pure methanol, or water is used as the extraction solvent.
A rapid method has been introduced in which Mycosep is used for clean-up, with fluorimetric detection of deoxynivalenol derivatized with zirconylnitrate and ethylenediamine in methanol (Malone et al., 1998).
Trichothecenes Appendix 1 lists the performance of tests that have been developed to screen for deoxynivalenol. The most sensitive ELISA methods have been developed for 3-acetyldeoxynivalenol, with an LOD of 0.3–1 ng/g, which requires acetylation of the toxin in cereal extract before assay for deoxynivalenol and therefore results in determination of the sum of deoxynivalenol and its acetylated derivatives. ELISAs have also been developed to enable direct determination of deoxynivalenol, but with less sensitivity (LOD = 20–300 ng/g). Accurate quantification of deoxynivalenol by immunological assays is often limited because of the remarkable cross-reactivity of deoxynivalenol-related compounds (Xu et al., 1988; Park & Chu, 1996). Nevertheless, when chromatographic instruments are not available, ELISAs are an interesting alternative for determining deoxynivalenol. Typical detection limits for deoxynivalenol by TLC are 20–300 ng/g.
The one-step solid-phase extraction clean-up and subsequent fluorimetric analysis of deoxynivalenol in grains allows detection within less than 30 min with an LOD of 100 ng/g. No values have yet been published, however, for the recovery or the precision of the method.
A comparative study organized by Schuhmacher et al. (1996) showed that participating laboratories in which ELISAs were used had difficulty in determining deoxynivalenol in pure organic solvents, with a CV of 21%, for example. In addition, overestimates and matrix dependence were observed. In a study carried out 1998 (Josephs et al., 2001), laboratories in which ELISA methods were used to determine deoxynivalenol found significantly higher concentrations than those in which HPLC and GC were used. The reason for the higher values found in maize samples in one study was additional contamination of the sample with 15-acetyldeoxynivalenol at a concentration of 477 ng/g, determined by GC–ECD. This compound cannot be distinguished from deoxynivalenol with most ELISA systems.
(a) Extraction
The relatively polar deoxynivalenol and other type B trichothecenes are usually extracted by mechanical shaking or blending with aqueous acetonitrile or aqueous methanol. Other solvents, such as water and polyethylene glycol, chloroform and ethanol, and chloroform and methanol have also been used. Use of aqueous acetonitrile provides cleaner extracts than use of aqueous methanol. In an assessment of extraction procedures for deoxynivalenol, longer extraction times were required for naturally contaminated samples than for those that had been spiked (Trenholm et al., 1985). It is therefore recommended that extraction efficiency be evaluated with naturally contaminated samples when possible.
(b) Clean-up
While clean-up is usually not required for immunoassays, physicochemical methods commonly involve extensive clean-up procedures. The main methods used in the analysis of trichothecenes are liquid–liquid partitioning, solid-phase extraction, column chromatography, immunoaffinity columns, and multifunctional clean-up columns. If necessary, interfering lipids can be removed by extracting the sample with n-hexane or another non-polar solvent before further clean-up.
Liquid–liquid partitioning is conventionally performed by shaking the sample extract with a non-miscible solvent in a separation funnel. For this type of clean-up, the aqueous phase can be supported on a column packed with solid hydrophilic matrix (ClinElut® or Extrelut®) and the organic solvent percolated down the column to elute the purified toxin.
Column chromatography can involve use of various stationary phases (silica gel, aluminium oxide, Florisil, charcoal, and C8 or C18 reversed phases) corresponding to the required polarity range of the adsorbent. The column packing material used most frequently for deoxynivalenol is a mixture of charcoal, alumina, and Celite. Modern solid-phase extraction columns are a potential alternative to the conventional column chromatographic methods. Solid-phase extraction columns are generally delivered prepacked in disposable plastic cartridges and are available with the adsorbents listed above. Gel permeation chromatography has also been used for clean-up in the analysis of deoxynivalenol.
Application of immunoaffinity columns for purification before instrumental methods has been used successfully for several mycotoxins. When the aqueous sample extract is applied to the immunoaffinity column, the analyte molecules are bound to antibodies which are linked to an organic carrier material. Before washing, the toxins can be eluted by denaturating the antibodies with pure organic solvents. However, immunoaffinity columns for most trichothecenes are not available commercially, and the columns are applicable to only one toxin. Furthermore, low recovery of deoxynivalenol was found with a commercial immunoaffinity column (Scott & Trucksess, 1997). An HPLC method involving both a charcoal–alumina–Celite column and a commercial immunoaffinity column gave reasonable recoveries, with an LOQ of 50 ng/g for cereals (Reutter, 1999).
Supercritical-fluid extraction combined with GC–ECD appears to be suitable for the determination of deoxynivalenol and related trichothecenes (Josephs et al., 1998; Krska, 1998). The heavy investment and maintenance costs for a supercritical-fluid extraction apparatus and the poor recovery of deoxynivalenol (50%) remain problems, however, which limit the applicability of these methods in routine analysis.
Another development in clean-up methods is the simple, rapid, multifunctional clean-up column MycoSep™ (Romer, 1986; Weingärtner et al., 1997). These columns consist of packing material containing various adsorbents, such as charcoal, Celite, and ion-exchange resins, which are housed in a plastic tube between filter discs, with a rubber flange at the lower end containing a porous frit and a one-way valve. When the column is inserted into a culture tube, the flange seals tight, thus forcing the extract through the packing material. The pure extract appears at the top of the plastic tube. The Mycosep® column allows sample purification within 10–30 s. A major advantage of this column is that no time-consuming rinsing steps are required, as in solid-phase extraction. In addition, nearly all the interfering substances are retained on the column, and the trichothecenes are not adsorbed onto the packing material. Mycosep® columns are among the most frequently used commercial columns for clean-up of deoxynivalenol in combination with HPLC and GC.
(c) Separation and detection
ELISA and TLC are used for the quantitative determination of deoxynivalenol. GC is widely used, particularly for simultaneous determination of several trichothecenes as their trimethylsilyl, pentafluoropropionyl, heptafluorobutyryl, and trifluoroacetyl derivatives, with ECD, flame ionization detection, MS, or tandem MS detection. The choice of derivatization reagent depends on the type of trichothecene to be analysed and the method of detection. The conjugated carbonyl group makes type B trichothecenes sensitive to ECD, while enhanced sensitivity of type A trichothecenes, which lack this group, is obtained when fluoroacylation is used. Trimethylsilylation allows more selective derivatization of type B trichothecenes, with less background interference than with fluoroacylation or derivatization with heptafluorobutyryl- or pentafluoropropionylimidazole (Poole, 1978). Trimethylsilyl ethers are made by derivatizing all hydroxyl groups with reagents such as N,O-bis(trimethylsilyl)acetamide, trimethylchlorosilane, and trimethylsilylimidazole. When a single compound is used, however, two peaks may arise for type B trichothecenes, owing to incomplete derivatization. Such problems can be avoided by using derivatization mixtures such as TRI-SIL TBT® and Sylon BTZ, which contain trimethylsilylimidazole (40 ± 5%), N,O-bis(trimethylsilyl)acetamide (35 ± 5%), and trimethylchlorosilane (25 ± 5%).
Several suitable HPLC methods have been published for the determination of type B trichothecenes in food and cereals. Separation is usually achieved on a C18 reversed-phase column with methanol–water mixtures as the mobile phase. Use of acetonitrile (UV cut-off, 190 nm) instead of methanol (UV cut-off, 210 nm) in aqueous mixtures is preferable, however, in view of the convenient cut-off value and better transmission at the important 220-nm wavelength. Deoxynivalenol and nivalenol have been determined by HPLC with UV detection at 222 nm. Nevertheless, time-consuming clean-up is required for the determination of deoxynivalenol in complex matrices, such as food and feed. A German standard method for determination of deoxynivalenol, which is being validated in a second round trial, involves an HPLC method that includes a time-consuming three-step clean-up with liquid–liquid partitioning with petroleum ether, solid-phase extraction with a charcoal–alumina–Celite mixture, and use of an immunoaffinity column.
Analytical performance characteristics comparable to those of GC methods can be achieved by HPLC combined with pre- or post-column derivatization (Maycock & Utley, 1985). The post-column derivatization procedure that has been developed by Sano et al. (1987) involves alkaline decomposition of deoxynivalenol and nivalenol to generate formaldehyde, and subsequent reaction with acetoacetate and ammonium acetate to form a fluorescent derivative. In view of the problems associated with use of GC, this method is an interesting alternative for reliable, accurate determination of deoxynivalenol, even at the lower range of nanograms per gram. LC–MS instruments, particularly those with atmospheric pressure chemical ionization interfaces, have been used for the determination and identification of trichothecenes, including deoxynivalenol, at trace concentrations (Razzazi-Fazeli et al., 1999). Owing to the decreasing cost of suitable LC–MS instruments, this technique is also being used for the determination of mycotoxins. ECD has also been described for the determination of deoxynivalenol (Sylvia et al., 1986).
The method used in a recent comparative study (Josephs et al., 2001) reflects the techniques being used by most European laboratories involved in analysing deoxynivalenol. The trial for the determination of deoxynivalenol in cereals comprised 28 laboratories in Europe, Singapore, and the USA. Deoxynivalenol was purified from the raw extracts by solid-phase extraction on MycoSep™ or Florisil-active charcoal columns (nine laboratories). Two participants used immunoaffinity columns, and one used the Extrelut® technique in combination with solid-phase extraction on Fluorisil for clean-up. Deoxynivalenol was determined by GC–ECD (five laboratories), GC–MS (two laboratories), HPLC–UV–diode array detection (six laboratories), and HPLC–fluorescence detection (one laboratory). Four laboratories used ELISA for determination of deoxynivalenol. It should be emphasized that the ELISA methods used for determination of deoxynivalenol cannot distinguish between deoxynivalenol, 3-acetyldeoxynivalenol, 15-acetyldeoxynivalenol, and 3,15-diacetyldeoxynivalenol, since the antibodies are elicited against 3,7,15-triacetyldeoxynivalenol. The LODs of the methods used by the participants ranged from 0.30 to 110 ng/g, the recoveries varied from 60 to 100%, and the reported CVs of the methods ranged from 3 to 15%.
In a comparative study organized by Gilbert (1992a), the participants who used TLC for determination of deoxynivalenol found interference in extracts of maize. Accordingly, most of the participants changed from TLC to HPLC.
(d) Performance characteristics
Trichothecenes Appendix 2 lists the performance characteristics of quantitative methods for trichothecenes. Figure 3 shows a typical chromatogram obtained after separation and detection with GC–ECD after trimethylslylation of five B trichothecenes. The method thus allows simultaneous quantification of several B trichothecenes. The typical detection limits of quantitative methods for the determination of deoxynivalenol in cereals are 100–1600 ng/g (HPLC–UV), 6–40 ng/g (HPLC–MS), 20 ng/g with HPLC–fluorescence detection) 20–50 ng/g and even lower with GC–ECD, and down to approximately 5 ng/g with GC–MS with heptafluorobutyryl and pentafluoropropionyl derivatives. Typical recoveries were 70–110%. The results of the comparative studies (Schuhmacher et al., 1996; Pettersson, 1998; Josephs et al., 2001) indicate that the analysis of the most relevant Fusarium mycotoxin, deoxynivalenol, is still not satisfactory. This is clear in the comparison of determinations of deoxynivalenol within the framework of the Standard, Measurement and Testing project organized by Pettersson (1998) involving 20 participants from 12 countries, in which no common calibrant was provided and for which the CV was 60%. The values for a naturally contaminated wheat sample ranged from 185 to 1100 ng/g, after rejection of outliers. In general, the results of the study showed relatively wide variation in both repeatability and reproducibility for all trichothecenes analysed. The Community Bureau of Reference comparative studies (Pettersson, 1998) and studies for the certification of deoxynivalenol in wheat and maize were different (Gilbert, 1992a,b), since mainly HPLC methods were used.
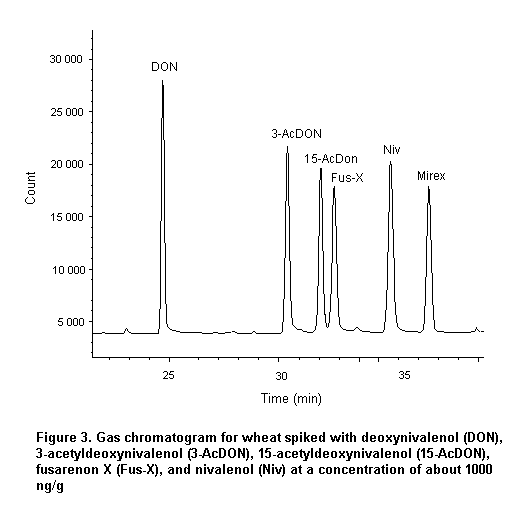
The main objective of the project funded by the Commission of the European Union is to improve the analysis of trichothecenes with GC methods and to obtain better agreement among laboratories. The main methodological problems in the project coordinated by Pettersson (1998) were:
|
• |
differences in the response to trichothecenes of pure calibrants and matrix-assisted calibrants; |
|
• |
non-linearity of calibration curves; |
|
• |
too high a recovery; |
|
• |
drifting response for trichothecenes; |
|
• |
high variation in repeatability of runs with MS detection; |
|
• |
carry-over or ‘memory’ effects from previous samples; and |
|
• |
matrix interference. |
Although a standardized GC method for deoxynivalenol and other trichothecenes is needed, these problems and sources of variation must be addressed. Otherwise, the method will not be robust enough and will result in wide variations in reproducibility and repeatability.
Generation of meaningful survey data requires collection of representative samples from carefully selected batches of food which, in turn, are representative of clearly defined locations (e.g. country, region within a country). For general aspects of the sampling protocols see Trichothecenes Appendix 6.
The variability of measurements of deoxynivalenol in barley and wheat has been studied by Freese et al. (2000) and Whitaker et al. (2000), respectively. Freese et al. collected 225-kg bulk samples from six batches of barley and riffle-divided each sample into 16 samples of 0.1 kg, 16 samples of 0.8 kg, and 16 samples of 7 kg. The samples were comminuted in a Romer mill, and 50-g portions were taken from each sample for determination of deoxynivalenol. An evaluation of the analytical results indicated that the variation associated with sample preparation and analysis was of greater significance than sampling variance for all sample sizes and that the variation was not significantly reduced by increasing the sample size. In a further experiment, 10 samples of about 2.5 kg were taken from each of 10 truck loads of barley, by sampling methods prescribed by the Grain Inspection, Packers and Stockyards Administration (1995). Each 2.5-kg sample was comminuted in a Romer mill, and two 50-g portions were taken from each sample. A single determination of deoxynivalenol was made on the extract from the first portion, whereas duplicate determinations were performed on the second portion, by an ELISA procedure. In this instance, an evaluation of the variance associated with the sampling, sample preparation, and analytical steps indicated an approximately equal contribution from each step. It was concluded that sample sizes of 100–200 g were adequate, assuming that they were obtained by riffle division of a large bulk sample. However, it was also concluded that batches might be stratified to different degrees, depending on the amount of mixing during handling, and that stratification could have a significant effect on sampling variance.
Whitaker et al. (2000) adopted a similar approach in studying the variances in sampling, sample preparation, and analysis during determination of deoxynivalenol in wheat. A 20-kg bulk sample was taken from each of 24 commercial batches, and each sample was riffle-divided into 32 samples weighing 0.45 kg (1lb). Each 0.45-kg sample was finely comminuted in a Romer mill, which was set to produce a representative, comminuted 25-g portion automatically. Deoxynivalenol was determined in each of 768 (24 x 32) 25-g portions by the Romer FluoroQuant™ fluorimetric procedure, and the analytical data were used to determine total variance (sampling, sample preparation, and analysis). Twenty comminuted samples, with a wide range of concentrations of deoxynivalenol, were selected from the residual 768 comminuted samples, and eight 25-g portions were taken from each sample by riffle division. The Romer method was then used to determine the deoxynivalenol concentration in four replicate extracts prepared from each 25-g portion. The combined variance for sample preparation and analysis and the analytical variance alone were estimated by the SAS procedures (Statistical Analysis System Institute, Inc., 1997). The total CV varied from 260 (batch concentration, 0.02 mg/kg deoxynivalenol) to 7.9 (14 mg/kg). For a batch concentration of deoxynivalenol of 5.0 mg/kg, the CVs associated with sampling, sample preparation, and analysis were 6.3, 10, and 6.3%, respectively. The sampling variance was specific to a 0.45-kg sample, the sample preparation variance to a Romer mill and a 25-g analytical sample, and the analytical variance to the Romer FluoroQuant method. The total variance was 13%. The low variance associated with the sampling step (relative to those of other mycotoxins and other commodities) is due partly to the small kernel count of wheat (about 30 kernels per gram), which is about 10 times higher than that of shelled maize and 30 times higher than that of shelled groundnuts.
During preharvest of crops with Fusarium head blight, the fungi kill some developing seeds, resulting in shrunken, shrivelled kernels of low weight. In general, at concentrations up to 1 mg/kg mycotoxins such as deoxynivalenol are typically found near the surface of the kernel, whereas at high concentrations they may be more evenly distributed (Charmley & Prelusky, 1994). Many of the shrivelled kernels can be removed by the use of gravity separators, which separate particles on the basis of differences in specific gravity, size, shape, and surface texture. The concentrations of deoxynivalenol after storage were always lower in samples from which the infected kernels were removed before storage than in samples that contained infected kernels (Wilcke et al., 1999). The disappearance of deoxynivalenol during cleaning of grain, such as removal of infected kernels and washing, has been reported to be up to 74% (Charmley & Prelusky, 1994); however, the degree of decontamination varies among studies. Washing barley and maize three times in distilled water reduced the deoxynivalenol concentration by 65–69%. Using 1 mol/L sodium carbonate solution for the first wash reduced the concentration by 72–74%. Soaking barley, maize, or wheat in a 0.1 mol/L sodium carbonate solution for 24–72 h caused a 42–100% reduction in toxin concentration.
Natural degradation of deoxynivalenol has been observed in cereal grain both in the field and during storage. Several explanations have been put forward for how the concentrations of mycotoxins are decreased in a natural system. The concentra-tion of free mycotoxin in natural ecosystems may be the result of concurrent synthesis, transport, conjugation, release from bound forms, and degradation by the plant or by other microbes (Karlovski, 1999).
The effectiveness of milling practices in reducing trichothecene concentrations in flour fractions from that in whole grain has been reviewed (Patey & Gilbert, 1989; Scott, 1991; Charmley & Prelusky, 1994). Milling usually resulted in a higher concentration of deoxynivalenol in bran, shorts, and feed flour and lower concentra-tions in straight-grade flour. The distribution of deoxynivalenol in the various milling fractions of wheat depends to a large extent on the degree of fungal penetration of the endosperm (Nowicki et al., 1988). In other words, milling grain in which the deoxynivalenol contamination is located predominantly at the surface of the kernel would result in flour with a low deoxynivalenol concentration. The ability of fungi to penetrate the kernel appears to vary among different varieties of wheat. Dry milling of maize containing deoxynivalenol gave a higher concentration in germ meal than wet milling, after which the highest concentrations were in steep liquor and gluten.
The trichothecenes are stable at 120 °C, moderately stable at 180 °C, and decompose within 30–40 min at 210 °C (Kamimura, 1989). Neira et al. (1997) showed an average reduction of 44% in the deoxynivalenol concentration in dough and in the final baked products. Approximately half of the reduction occurred after the dough fermentation step.
In a study of the effect of high-temperature and high-pressure processing of foods spiked with deoxynivalenol, no significant reduction was found after processing in extruded maize grits, extruded dry dog food, or autoclaved moist dog food. Autoclaved cream-style maize showed a reduction of only 12% (Wolf-Hall et al., 1999).
During cooking of noodles and spaghetti, trichothecenes may leach into the boiling water to a considerable extent (Scott, 1991).
Trichothecenes are not stable in the presence of alkali. Only 18–28% of deoxynivalenol in maize was retained during tortilla fabrication, in which the maize was first boiled in calcium hydroxide solution (Abbas et al., 1988).
Deoxynivalenol was not metabolized by yeast strains of technological relevance (Böswald et al., 1995).
Microbiological transformation could be used to transform deoxynivalenol to less toxic metabolites such as the de-epoxy metabolite (Yoshizawa et al., 1986; Figure 4). However, only mixed cultures have been used in the microbiological methods, whereas a defined isolate is a requirement for feed additives.
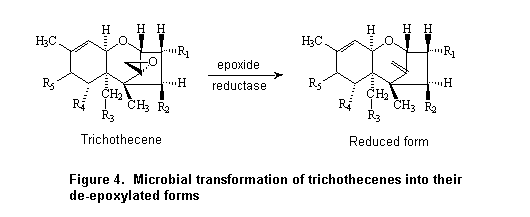
Several studies were conducted to investigate the ability of microorganisms isolated from rumen fluid and soil to degrade or biotransform deoxynivalenol under anaerobic or aerobic conditions in liquid culture (King et al., 1984a). He et al. (1992) detected transformation of 50% of deoxynivalenol to the de-epoxy metabolite in the first culture of soil microorganisms but no further transformation in later subcultures. Anaerobic degradation of deoxynivalenol has been studied extensively (Binder et al., 1998), and rumenal bacteria capable of transforming deoxynivalenol and 3-acetyldeoxynivalenol to a the de-epoxy metabolite have been isolated. The rumenal contents of a fistulated cow were used as a natural habitat for the enrichment and isolation of anaerobic bacteria (Binder et al., 2000). The active bacterium is a gram-positive, non-spore-forming, strictly anaerobic, irregular rod belonging to the genus Eubacterium. The efficiency of this bacterium as a feed additive, commercially available as such in e.g. South America, has been tested in feeding trials with pigs and chickens. Microbes in rumenal fluid had no effect on the concentration of deoxynivalenol (Kiessling et al., 1984).
Mouldy maize was detoxified microbially by incubation with the contents of the large intestine of chickens, and the response of young pigs fed this detoxified deoxynivalenol-contaminated feed was evaluated. A significant amount of the deoxynivalenol in the maize had been transformed to the de-epoxy metabolite. Microbial inocula from rumenal fluid, soil and the contents of the large intestines of chickens and of pigs were tested for their ability to transform deoxynivalenol in vitro. Microorganisms in the chicken intestinal contents completely transformed pure deoxynivalenol, and this activity was retained through six serial subcultures. No alteration of the toxin was detected after incubation with pig intestinal contents, whereas 35% of the deoxynivalenol was metabolized in the original culture of rumenal fluid and 50% was metabolized by the soil sample. About 50% of the deoxynivalenol in mouldy maize in culture medium was transformed by microorganisms from chicken intestine (He et al., 1993).
A mixed microbial culture capable of metabolizing deoxynivalenol was obtained from soil samples by an enrichment culture procedure. A bacterium isolated from the enrichment culture completely removed exogenously applied deoxynivalenol from the culture medium after incubation for 1 day (Shima et al., 1997). The main metabolite was identified as 3-keto-4-deoxynivalenol. This compound had remarkably less (one-tenth) immunosuppressive toxicity than deoxynivalenol, indicating that the 3-OH group on deoxynivalenol is likely to be involved in its immunosuppressive effects.
The concentration of deoxynivalenol remained stable when deoxynivalenol-containing wort was fermented with strains of Saccharomyces cerevisae for 7–9 days (Scott et al., 1992).
In a study of the transmission of deoxynivalenol from naturally contaminated barley and wheat malts into beer, the deoxynivalenol content increased markedly during mash production. The increase was suggested to be due to enzymatic activity in the malt. Deoxynivalenol was stable after the wort was boiled for 90 min. Fermentation did not affect the initial toxin content of the wort. The concentration in finished beer was similar to that in the respective malt (Niessen & Donhauser, 1993).
Argentina, Brazil, Canada, China, Finland, Germany, Italy, Norway, Sweden, the United Kingdom, Uruguay, and the USA submitted data on contamination of grains and food products with deoxynivalenol to FAO/WHO. Other data on contamination of food by these toxins were taken from the published literature for 1990 through early 2000. Previous data were reviewed in Environmental Health Criteria 105 (WHO, 1990). As the information available was not complete in many cases, most of the authors were contacted; many of them sent details on sampling and analytical methods and some also sent unpublished data.
The data on the natural occurrence of deoxynivalenol are summarized in Appendix A. The criteria for accepting data on food contamination included the date of the report between 1990 and 2000, use of adequate analytical methods for this toxin, and random collection of samples. Details of the sampling procedures are given in Appendix A and in Trichothecenes Appendix 6. The data were analysed on a case-by-case basis. When no information was provided about sampling or analytical methods, the data where not included.
The Appendix includes the primary reference (P), the reference for sampling (S), and the references for the analytical method (A) given by the authors. Mean values were calculated when the mean of positive samples was given or values for ‘not detected’ were given as half the detection limit. The mean values in the Appendix therefore indicate the mean of all samples, with those below the limit of detection taken as 0, with some exceptions, as shown.
In the decade 1980–90, deoxynivalenol occurred commonly, particularly in wheat and maize, at concentrations usually < 1000 µg/kg (WHO, 1990). This value was therefore chosen for comparison with concentrations reported in the decade 1990–2000. A concentration of 100 µg/kg was used to compare the concentration of deoxynivalenol with those of T-2 and HT-2 toxins.
The analytical methods used to derive the data included in Appendix A were GC–ECD, GC–MS, TLC, HPLC, and ELISA, and the details are described in Trichothecenes Appendix 5. Methods for ELISAs were included in Trichothecenes Appendix 5 only when the paper provided information on recovery or when the extraction solvent was not methanol–water. In approximately half of the reports, deoxynivalenol was quantified by GC with ECD or MS, and in one-fourth of the reports by TLC. The recovery of the toxin in various substrates sometimes affected the data on occurrence more than the sensitivity of the method. When the extraction and clean-up steps are effective, low limits of detection or quantification can be obtained even with low-cost methods such as TLC.
Some authors defined LODs and LOQs in different ways. The LOD was sometimes expressed as two or three times the noise over background, and sometimes as the smallest quantity of the standard that could be detected. The LOQ was sometimes defined as five or six times the noise (measured in standard solutions), without taking into account recovery in the matrix, while other investigators included the data on recovery in their estimation of the LOQ. Investigators should report the method by which they calculated the LOD and LOQ, in order to standardize the procedure. Intake can best be estimated by considering studies in which the recovery was > 60% the LOQ. Analytical methods, particularly with regard to recovery, in different matrixes require constant improvement.
No specific sampling method has been reported for these toxins. Those used are described in Trichothecenes Appendix 6.
Some interesting studies were not included in Appendix A, as they could not be used to estimate the total dietary intake of the toxin. These include reports of the occurrence of the toxin in areas where disease was found, estimates of variations in the concentration of deoxynivalenol in different lots, studies on genetic variation, samples of grains with scab symptoms, and comparisons of the presence of deoxy-nivalenol in mouldy and healthy grains or in different parts of the plant. In other cases, the results reported were insufficient to be entered in Appendix A, as for example when deoxynivalenol was expressed as total type B trichothecenes obtained after hydrolysis (Perkowski et al., 1990; Luo et al., 1992; Okoye, 1993; Chu & Gy, 1994; Trigo-Stockli et al., 1995; Menna et al., 1997; Perkowski et al., 1997; Li et al., 1999; Perkowski, 1999; Sohn et al., 1999; Wetter et al., 1999; Chelkowski et al., 2000; Freese et al., 2000).
In one study, beans were found to be contaminated by trichothecenes (deoxy-nivalenol, diacetoxyscirpenol, and T-2 toxin). As the samples were not collected at random, the data were not included in Appendix A. However, the quantities of toxins detected were substantial and warrant investigation in other legumes (Tseng et al., 1995).
Deoxynivalenol was also detected in soya beans, with discolouration damage, and in some soya bean products from a pilot plant. The concentrations ranged from not detectable to 490 µg/kg in whole soya beans, from < 10 µg/kg to 420 µg/kg in hulls, from < 5 µg/kg to 600 µg/kg in meal, and from not detectable to 30 µg/kg in crude unrefined oil (Jacobsen et al., 1995). In Appendix A, only five samples of soya beans were found to have no detectable deoxynivalenol.
In the United Kingdom, samples of traditional foods were reported to be contaminated with deoxynivalenol at concentrations similar to those found in wheat (Patel et al., 1996).
As shown in Appendix A, deoxynivalenol was a frequent contaminant of cereal grains such as wheat (11 444 samples, 57% contaminated), maize (5349 samples, 40% contaminated), oats (834 samples, 68% contaminated), barley (1662 samples, 59% contaminated), rye (295 samples, 49% contaminated), and rice (154 samples, 27% contaminated). It has also been detected in some wheat and maize products, such as wheat flour, bread, breakfast cereals, noodles, baby and infant foods, and cooked pancakes. It has been reported in barley products and beer: more than 50% of 321 beer samples analysed were contaminated with deoxynivalenol (Niessen et al., 1993; Scott et al., 1993; Moltó et al., 2000).
In some countries, such as Germany and Italy, the presence of deoxynivalenol was reported in grains grown organically and by conventional techniques.
Although a large amount of data was summarized (23 380 samples), information on some products in various parts of the world is still lacking.
Some authors presented data on distribution in the form of frequency tables or histograms (for example Müller et al., 1997a,b). Fontán et al. (1994) showed that the Fisher–Tippett distribution could be adjusted adequately for the data on the 1990–92 wheat harvests in Argentina. Some individual data were almost discrete, owing to rounding, and could not be used for the distribution analysis. For this purpose, only data on deoxynivalenol contamination of wheat were available.
Figure 5 presents Q–Q plots of the log-transformed data for the 1994 and 1997 harvests in Argentina, the 1999 harvest in Italy, and the 1998 harvest in the United Kingdom. Similar patterns were found for the harvest in Finland in 1998 (data not shown). For the analysis, only values greater than 20 µg/kg (LOD) for the United Kingdom, 50 µg/kg (LOD) for Italy, and 48 µg/kg (LOQ) for Argentina were considered. In all cases, goodness-of-fit tests were applied. The p values obtained (> 0.5) indicated that the log-normal distribution provided an adequate model for these data.
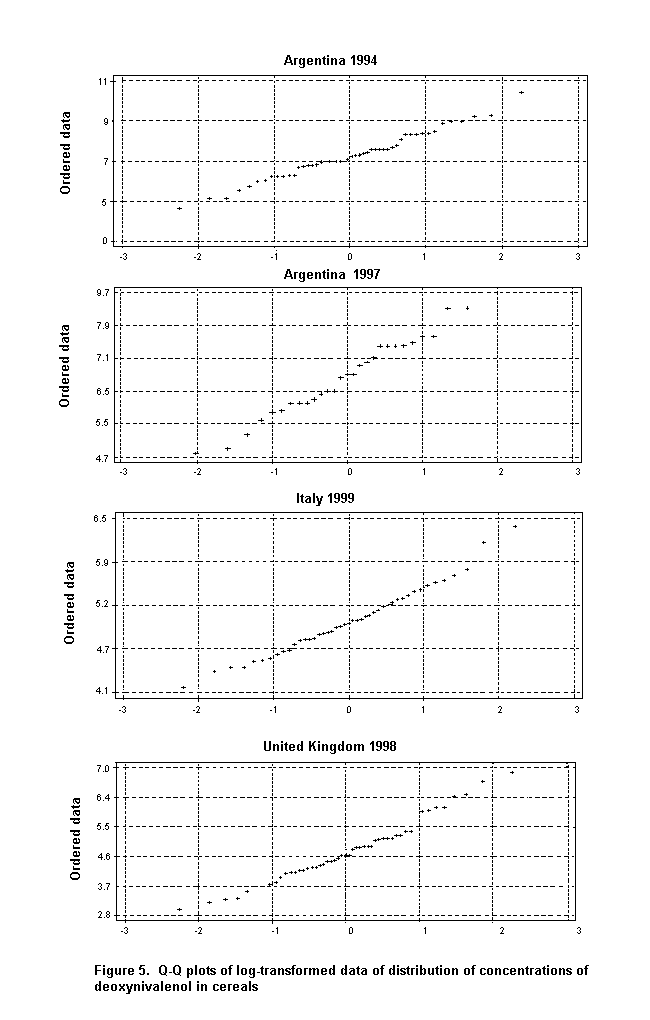
The distribution function for processed products such as bread could be different from that adjusted for raw cereal, as contamination tends to be more homogeneous during processing. The adjusted distribution function could therefore belong to other distribution families (Schollenberger et al., 2000a).
Most of the information on contamination with deoxynivalenol has been reported for wheat (11 000 samples) and maize (6000 samples). These large data sets allow determinations of annual variation in concentrations. For instance, wheat harvested in Germany, Norway and the Russian Federation in various years showed similar annual variations in contamination (Appendix A). Data from Canada obtained in consecutive years showed that the average contamination in hard wheat was lower than that in soft wheat but that the annual variation in the two products was similar. Figure 6 shows the annual variation in the average contamination of wheat and the frequency of contamination in Argentina from a survey conducted in the main production area between 1985 and 1999.
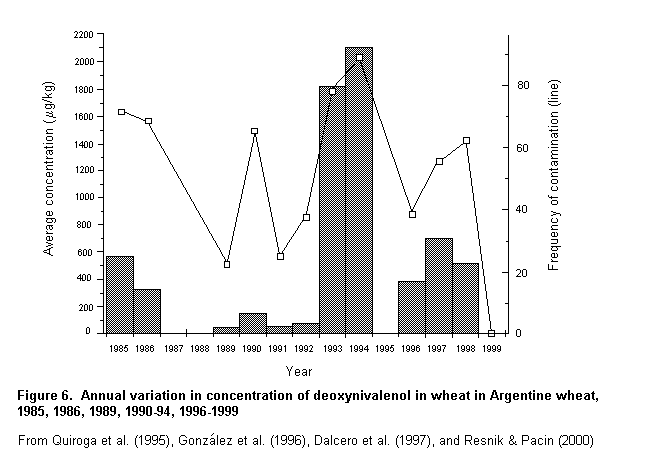
The annual variation in the average concentration of deoxynivalenol in maize in Canada and New Zealand in 1987–94 is shown in Figure 7.
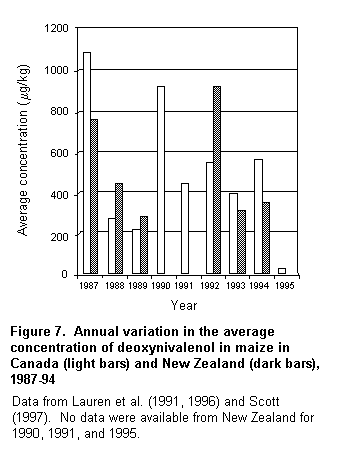
Although there were annual variations, the mean concentrations of deoxynivalenol in maize in Argentina, Canada, and Uruguay over the past 5 years were < 120 µg/kg (Appendix A). Oats and barley also showed annual variations in contamination with deoxynivalenol (Appendix A). These are clearly observed when the frequency of contamination is high, which has been the case for barley for some years. These results emphasize the need for regular screening for deoxynivalenol in cereal crops. The annual variation observed could be due mainly to heavy rainfall between flowering and harvest, which facilitates F. graminearum infection and accumulation of deoxynivalenol (Trigo-Stockli et al., 1998).
The dietary intake of deoxynivalenol was assessed according to the recommen-dations of a FAO/WHO workshop on methods for assessing exposure to contaminants and toxins, which was held in Geneva in June 2000 (WHO, 2000). The workshop recommended that the median concentration be given when data on individual samples were available, whereas a mean should be given when only pooled or aggregated data were available. In the case of commodities that contribute significantly to intake, distribution curves should be generated to allow risk managers to determine the effects on dietary intake of different maximum levels.
The workshop further recommended that international estimates of dietary intake should be calculated by multiplying the mean or median concentration by the values for consumption of the commodity in the five GEMS/Food regional diets (WHO, 1998). The diets (African, European (which includes Australia, Canada, New Zealand, and the USA), Far Eastern, Latin American, and Middle Eastern) were established on the basis of information on food balance sheets compiled by FAO. As such information is available for most countries, the data are comparable across countries and regions of the world. The regional diets represent the average availability of food commodities per capita rather than actual food consumption.
The report of the workshop noted that national intake estimates should also be reported when available, as they may provide information about intake by specific population subgroups or extreme consumers, which cannot be derived from GEMS/Food regional diets.
For this assessment, concentrations of deoxynivalenol in food commodities and in some processed foods were reported to FAO/WHO or were obtained from the literature. The quality and reporting of the data are discussed in the previous section. Since the dietary intakes were based on the GEMS/Food regional diets, which include information on consumption of raw or minimally processed foods, concentrations of deoxynivalenol in processed foods were not used to estimate dietary intake.
Information was available on the concentrations of 10 commodities: barley, maize, popcorn, oats, rice, rye, sorghum, triticale, wheat, and other cereals. Data were received from 28 countries, representing four of the five GEMS/Food regional diets (Table 7); no data were reported for the Middle Eastern diet. Of the 10 commodities for which data were available for the intake assessment, data on barley, maize, and wheat predominated, with limited reports on popcorn, oats, rice, rye, sorghum, triticale, and other cereals (Table 8).
Table 7. Countries for which information on deoxynivalenol concentrations were available (by GEMS/Food regional diet)
|
African |
European |
Far Eastern |
Latin American |
|
South Africa |
Austria |
China |
Argentina |
|
|
Bulgaria |
India |
Brazil |
|
|
Canada |
Indonesia |
Chile |
|
|
Finland |
Japan |
Uruguay |
|
|
Germany |
Korea, Republic of |
|
|
|
Italy |
Papua New Guinea |
|
|
|
Netherlands |
Philippines |
|
|
|
New Zealand |
Thailand |
|
|
|
Norway |
Viet Nam |
|
|
|
Poland |
|
|
|
|
Russian Federation |
|
|
|
|
Sweden |
|
|
|
|
United Kingdom |
|
|
|
|
USA |
|
|
Table 8. Numbers of countries for which data on concentrations of deoxynivalenol were available, by commodity
|
Commodity |
No. of countries |
Data used in intake estimates |
|
|
No. of data points |
No. of individual samples represented |
||
|
Barley |
11 |
33 |
1 778 |
|
Maize |
17 |
78 |
5 719 |
|
Oats |
7 |
28 |
834 |
|
Popcorn |
2 |
2 |
50 |
|
Rice |
4 |
13 |
203 |
|
Rye |
4 |
12 |
295 |
|
Sorghum |
1 |
1 |
15 |
|
Triticale |
1 |
1 |
10 |
|
Wheat |
18 |
209 |
14 200 |
|
Other cereals |
2 |
4 |
254 |
Most of the data available for this evaluation were pooled; that is, each data point represented the mean concentration in a number of individual samples. In calculating the mean values, samples in which the concentration was below the LOQ or LOD were assumed to have a value of zero. The maximum analytical value and the number of samples with concentrations below the LOD or LOQ were also reported for each data point. A total of 375 data points (mean values) representing about 23 000 individual samples were included in the intake assessment (Table 8). Of those 375 data points, 243 were reported from countries represented by the GEMS/Food European diet. The remaining 132 data points represented intake of the nine commodities for the other regional diets.
For each commodity, the data were sorted according to the country groupings of the GEMS/Food regional diets. The number of data points reported, the number of individual samples represented, the highest maximum analytical value reported, the proportion of samples with concentrations below the LOD or LOQ, and the average of all mean values are summarized in Table 9. For each commodity, the mean of all data, weighted by sample size, is also reported.
The concentrations of deoxynivalenol used in estimating dietary intakes are summarized by commodity and region in Table 9.
Table 9. Summary of data on concentrations of deoxynivalenol in grains in GEMS/Food regional diets
|
Commodity |
Far Eastern |
African |
Latin American |
European |
Total |
|
Barley |
|
|
|
|
|
|
No. of data points |
9 |
|
9 |
15 |
33 |
|
No. of individual samples |
309 |
|
842 |
627 |
1 778 |
|
Unweighted mean (µg/kg) |
130 |
|
370 |
860 |
530 |
|
Maximum value (µg/kg) |
3 800 |
|
34 000 |
26 000 |
34 000 |
|
% < LOD or LOQ |
34 |
|
53 |
28 |
41 |
|
Weighted mean, all samples: 718 µg/kg |
|||||
|
Maize |
|
|
|
|
|
|
No. of data points |
23 |
4 |
21 |
30 |
78 |
|
No. of individual samples |
1 110 |
683 |
2 421 |
1 300 |
5 719 |
|
Unweighted mean (µg/kg) |
200 |
130 |
66 |
640 |
330 |
|
Maximum value (µg/kg) |
6 500 |
2 800 |
4 300 |
19 000 |
19 000 |
|
% < LOD or LOQ |
35 |
13 |
93 |
11 |
52 |
|
Weighted mean, all samples: 175 µg/kg |
|||||
|
Popcorn |
|
|
|
|
|
|
No. of data points |
|
|
1 |
1 |
2 |
|
No. of individual samples |
|
|
42 |
8 |
50 |
|
Unweighted mean (µg/kg) |
|
|
0 |
2 000 |
980 |
|
Maximum value (µg/kg) |
|
|
0 |
4 500 |
4 500 |
|
% < LOD or LOQ |
|
|
100 |
50 |
92 |
|
Weighted mean, all samples: 310 µg/kg |
|||||
|
Oats |
|
|
|
|
|
|
No. of data points |
|
|
1 |
27 |
28 |
|
No. of individual samples |
|
|
6 |
828 |
834 |
|
Unweighted mean (µg/kg) |
|
|
0 |
140 |
130 |
|
Maximum value (µg/kg) |
|
|
0 |
2 600 |
2 600 |
|
% < LOD or LOQ |
|
|
100 |
3 |
32 |
|
Weighted mean, all samples: 89 µg/kg |
|||||
|
Rice |
|
|
|
|
|
|
No. of data points |
|
|
11 |
2 |
13 |
|
No. of individual samples |
|
|
173 |
30 |
203 |
|
Unweighted mean (µg/kg) |
|
|
33 |
2 600 |
430 |
|
Maximum value (µg/kg) |
|
|
960 |
9 500 |
9 500 |
|
% < LOD or LOQ |
|
|
86 |
43 |
80 |
|
Weighted mean, all samples: 150 µg/kg |
|||||
|
Rye |
|
|
|
|
|
|
No. of data points |
|
|
|
12 |
12 |
|
No. of individual samples |
|
|
|
295 |
295 |
|
Unweighted mean (µg/kg) |
|
|
|
39 |
39 |
|
Maximum value (µg/kg) |
|
|
|
1 300 |
1 300 |
|
% < LOD or LOQ |
|
|
|
51 |
51 |
|
Weighted mean, all samples: 65 µg/kg |
|||||
|
Sorghum |
|
|
|
|
|
|
No. of data points |
|
|
1 |
|
1 |
|
No. of individual samples |
|
|
15 |
|
15 |
|
Unweighted mean (µg/kg) |
|
|
0 |
|
0 |
|
Maximum value (µg/kg) |
|
|
0 |
|
0 |
|
% < LOD or LOQ |
|
|
100 |
|
100 |
|
Weighted mean, all samples: 0 |
|||||
|
Triticale |
|
|
|
|
|
|
No. of data points |
|
|
|
1 |
1 |
|
No. of individual samples |
|
|
|
10 |
10 |
|
Unweighted mean (µg/kg) |
|
|
|
92 |
92 |
|
Maximum value (µg/kg) |
|
|
|
200 |
200 |
|
% < LOD or LOQ |
|
|
|
20 |
20 |
|
Weighted mean, all samples: 92 µg/kg |
|||||
|
Wheat |
|
|
|
|
|
|
No. of data points |
19 |
|
32 |
158 |
209 |
|
No. of individual samples |
1 354 |
|
2 081 |
10 765 |
14 200 |
|
Unweighted mean (µg/kg) |
560 |
|
490 |
310 |
360 |
|
Maximum value (µg/kg) |
20 000 |
|
30 000 |
21 000 |
30 000 |
|
% < LOD or LOQ |
19 |
|
40 |
44 |
38 |
|
Weighted mean, all samples: 390 µg/kg |
|||||
|
Other cereals |
|
|
|
|
|
|
No. of data points |
1 |
|
|
3 |
4 |
|
No. of individual samples |
29 |
|
|
225 |
254 |
|
Unweighted mean (µg/kg) |
330 |
|
|
56 |
120 |
|
Maximum value (µg/kg) |
2 300 |
|
|
570 |
2 300 |
|
% < LOD or LOQ |
59 |
|
|
55 |
55 |
|
Weighted mean, all samples: 46 µg/kg |
|||||
Barley: Data on the concentrations of deoxynivalenol in barley were received from 11 countries. Of the 1778 samples analysed, 41% had concentrations below the LOD or LOQ. The unweighted means by region ranged from 130 µg/kg in the Far Eastern diet to 860 µg/kg in the European diet. The weighted mean for all samples combined was 720 µg/kg, and the maximum analytical value reported was 34 000 µg/kg.
Maize: Seventeen countries reported data on a total of 5719 samples of maize. Of these, 52% contained concentrations below the LOD or LOQ. The unweighted means across regional diets ranged from 66 µg/kg in the Latin American to 640 µg/kg in the European diet. The weighted mean of all samples combined was 180 µg/kg, and the maximum analytical value reported was 19 000 µg/kg.
Popcorn: Only two countries (Argentina and USA) reported data on popcorn. Of the 50 samples, 92% had concentrations below the LOQ. The weighted mean for all samples was 310 µg/kg, and the maximum analytical value reported was 4500 µg/kg.
Oats: Seven countries representing only two regional diets submitted data on a total of 834 samples of oats. Most of the data came from countries with the European diet; only one record representing six samples (all with concentrations below the LOQ) was reported for the Latin American diet. Thirty-two percent of all samples had concentrations below the LOQ. The maximum analytical value reported was 2600 µg/kg.
Rice: Only four countries representing two regional diets submitted data on rice, representing a total of 203 samples. Overall, 80% of the samples had concentrations below the LOD or LOQ. The maximum analytical value reported was 9500 µg/kg. The weighted mean concentration in all samples was 150 µg/kg.
Rye: Four countries, all with the European regional diet, submitted data on a total of 295 samples of rye. Just over half (51%) of the samples had concentrations below the LOQ. The maximum analytical value reported was 1300 µg/kg, and the unweighted mean was 39 µg/kg; the weighted mean for all samples was 65 µg/kg.
Sorghum: Only one country reported data on 15 samples of sorghum. Deoxy-nivalenol was not detected in any of the samples.
Triticale: Only one data point representing 10 samples was reported for triticale. The mean value was 92 µg/kg; the maximum analytical value was 200 µg/kg.
Wheat: Eighteen countries with three regional diets reported data on 14 200 samples of wheat. Overall, 38% of the samples had concentrations below the LOD or LOQ. A maximum analytical value of 30 000 µg/kg was reported for two sample sets. The unweighted means ranged from 310 µg/kg for the European diet to 560 µg/kg for the Far Eastern. The weighted mean for all samples was 390 µg/kg.
Other cereals: Only two countries submitted data on a total of 254 samples of cereal grains other than those specified above. Overall, 55% of the samples had concentrations below the LOD or LOQ. The maximum analytical value reported was 2300 µg/kg. Both the unweighted and the weighted means for all samples were 46 µg/kg.
The average intakes of deoxynivalenol were calculated by multiplying the weighted mean concentration of each commodity by the corresponding amount of each commodity consumed in each of the five GEMS/Food regional diets (Table 10). As limited data were available on the concentrations of all commodities in diets other than the European one, a mean concentration for each commodity could not be derived for each region.
Table 10. Grain consumption (g per person per day) in GEMS/Food regional diets
|
Commodity |
African |
European |
Far Eastern |
Latin American |
Middle Eastern |
|
Barley |
1.8 |
20 |
3.5 |
6.5 |
1 |
|
Maize |
110 |
8.8 |
31 |
42 |
48 |
|
Oats |
0.2 |
2 |
0 |
0.8 |
0 |
|
Popcorn |
0.2 |
0.2 |
0.2 |
0.2 |
0.2 |
|
Rice |
100 |
12 |
280 |
86 |
49 |
|
Rye |
0 |
1.5 |
1 |
0 |
0 |
|
Sorghum |
27 |
0 |
9.7 |
0 |
2 |
|
Triticale |
0 |
0 |
1 |
0 |
0 |
|
Wheat |
28 |
180 |
110 |
120 |
330 |
|
Other cereals |
0 |
4.3 |
1.3 |
0 |
0.8 |
Intakes were estimated per person per day and converted to intake per kilogram of body weight per day, assuming a body weight of 60 kg, as recommended by FAO/WHO for international intake assessments (WHO, 1985). The results are reported separately for each GEMS/Food regional diet in Tables 11–15. The intakes from the different diets are compared in Table 16.
Table 11. Estimated intakes of deoxynivalenol from the GEMS/Food African diet
|
Commodity |
Weighted mean concentration (µg/kg) |
Consumption |
Intake |
% of total intake |
||
|
ng/person per day |
µg/person per day |
µg/kg bw per day |
||||
|
Barley |
720 |
1.8 |
1 300 |
1.3 |
0.022 |
3 |
|
Maize |
180 |
110 |
19 000 |
19 |
0.31 |
40 |
|
Oats |
89 |
0.2 |
18 |
0 |
< 0.001 |
< 1 |
|
Popcorn |
310 |
0.2 |
62 |
0.1 |
0.001 |
< 1 |
|
Rice |
150 |
100 |
16 000 |
16 |
0.26 |
33 |
|
Rye |
65 |
0 |
0 |
0 |
0 |
0 |
|
Sorghum |
0 |
27 |
0 |
0 |
0 |
0 |
|
Triticale |
92 |
0 |
0 |
0 |
0 |
0 |
|
Wheat |
390 |
28 |
11 000 |
11 |
0.18 |
24 |
|
Other cereals |
46 |
0 |
0 |
0 |
0 |
0 |
|
Total intake |
|
|
46 000 |
46 |
0.78 |
100 |
Table 12. Estimated intakes of deoxynivalenol from the GEMS/Food Latin American diet
|
Commodity |
Weighted mean concentration (µg/kg) |
Consumption |
Intake |
% of total intake |
||
|
ng/person per day |
µg/person per day |
µg/person µg/kg bw |
||||
|
Barley |
720 |
6.5 |
4 700 |
4.7 |
0.078 |
7 |
|
Maize |
180 |
42 |
7 300 |
7.3 |
0.12 |
10 |
|
Oats |
89 |
0.8 |
71 |
0.1 |
0.001 |
< 1 |
|
Popcorn |
310 |
0.2 |
62 |
0.1 |
0.001 |
< 1 |
|
Rice |
150 |
86 |
13 000 |
13 |
0.22 |
18 |
|
Rye |
65 |
0 |
0 |
0 |
0 |
0 |
|
Sorghum |
0 |
0 |
0 |
0 |
0 |
0 |
|
Triticale |
92 |
0 |
0 |
0 |
0 |
0 |
|
Wheat |
390 |
120 |
45 000 |
45 |
0.76 |
64 |
|
Cereal, other |
46 |
0 |
0 |
0 |
0 |
0 |
|
Total intake |
|
|
70 000 |
70 |
1.2 |
100 |
Table 13. Estimated intakes of deoxynivalenol from the GEMS/Food European diet
|
Commodity |
Weighted mean concentration (µg/kg) |
Consumption (g/person per day) |
Intake |
% of total intake |
||
|
ng/person per day |
µg/person per day |
µg/kg bw per day |
||||
|
Barley |
720 |
20 |
14 000 |
14 |
0.24 |
16 |
|
Maize |
180 |
8.8 |
1 500 |
1.5 |
0.026 |
2 |
|
Oats |
89 |
2.0 |
180 |
0.2 |
0.003 |
< 1 |
|
Popcorn |
310 |
0.2 |
62 |
0.1 |
0.001 |
< 1 |
|
Rice |
12 |
12 |
1 800 |
1.8 |
0.030 |
2 |
|
Rye |
65 |
1.5 |
97 |
0.1 |
0.002 |
< 1 |
|
Sorghum |
0 |
0 |
0 |
0 |
0 |
0 |
|
Triticale |
92 |
0 |
0 |
0 |
0 |
0 |
|
Wheat |
390 |
180 |
69 000 |
69 |
1.2 |
79 |
|
Other cereals |
46 |
4.3 |
200 |
0.2 |
0.003 |
< 1 |
|
Total intake |
|
|
87 000 |
87 |
1.4 |
100 |
Table 14. Estimated intakes of deoxynivalenol from the GEMS/Food Middle Eastern diet
|
Commodity |
Weighted mean concentration (µg/kg) |
Consumption (g/person per day) |
Intake |
% of total intake |
||
|
ng/person per day |
µg/person per day |
µg/kg bw per day |
||||
|
Barley |
718 |
1.0 |
720 |
0.7 |
0.012 |
1 |
|
Maize |
175 |
48 |
8 500 |
8.5 |
0.14 |
6 |
|
Oats |
89 |
0 |
0 |
0 |
0 |
0 |
|
Popcorn |
312 |
0.2 |
62 |
0.1 |
0.001 |
0 |
|
Rice |
150 |
49 |
7 300 |
7.3 |
0.12 |
5 |
|
Rye |
65 |
0 |
0 |
0 |
0 |
0 |
|
Sorghum |
0 |
2.0 |
0 |
0 |
0 |
0 |
|
Triticale |
92 |
0 |
0 |
0 |
0 |
0 |
|
Wheat |
388 |
330 |
127 000 |
130 |
2.1 |
88 |
|
Other cereals |
46 |
0.8 |
37 |
< 0.1 |
0.001 |
< 1 |
|
Total intake |
|
|
144 000 |
140 |
2.4 |
100 |
Table 15. Estimated intakes of deoxynivalenol from the GEMS/Food Far Eastern diet
|
Commodity |
Weighted mean concentration (µg/kg) |
Consumption |
Intake |
% of total intake |
||
|
ng/person per day |
µg/person per day |
µg/person µg/kg bw |
||||
|
Barley |
720 |
3.5 |
2 500 |
2.5 |
0.042 |
3 |
|
Maize |
180 |
31 |
5 500 |
5.5 |
0.091 |
6 |
|
Oats |
89 |
0 |
0 |
0 |
0 |
0 |
|
Popcorn |
310 |
0.2 |
62 |
0.1 |
0.001 |
< 1 |
|
Rice |
150 |
280 |
42 000 |
42 |
0.70 |
44 |
|
Rye |
65 |
1.0 |
65 |
0.1 |
0.001 |
< 1 |
|
Sorghum |
0 |
9.7 |
0 |
0 |
0 |
0 |
|
Triticale |
92 |
1.0 |
92 |
0.1 |
0.002 |
< 1 |
|
Wheat |
390 |
110 |
45 000 |
45 |
0.74 |
47 |
|
Cereal, other |
46 |
1.3 |
60 |
0.1 |
0.001 |
< 1 |
|
Total intake |
|
|
95 000 |
95 |
1.6 |
100 |
Table 16. Comparison of intakes of deoxynivalenol in the GEMS/Food regional diets
|
Commodity |
African |
European |
Far Eastern |
Latin American |
Middle Eastern |
|||||
|
µg/kg |
% total |
µg/kg |
% total |
µg/kg |
% total |
µg/kg |
% total |
µg/kg |
% total |
|
|
bw |
intake |
bw |
intake |
bw |
intake |
bw |
intake |
bw |
intake |
|
|
Barley |
0.022 |
3 |
0.24 |
16 |
0.042 |
3 |
0.078 |
7 |
0.012 |
1 |
|
Maize |
0.31 |
40 |
0.026 |
2 |
0.091 |
6 |
0.12 |
10 |
0.14 |
5.9 |
|
Oats |
< 0.001 |
< 1 |
0.003 |
< 1 |
0 |
0 |
0.001 |
< 1 |
0 |
0 |
|
Popcorn |
0.001 |
< 1 |
0.001 |
< 1 |
0.001 |
< 1 |
0.001 |
< 1 |
0.001 |
0 |
|
Rice |
0.26 |
33 |
0.03 |
2 |
0.70 |
44 |
0.22 |
18 |
0.12 |
5 |
|
Rye |
0 |
0 |
0.002 |
< 1 |
0.001 |
< 1 |
0 |
0 |
0 |
0 |
|
Sorghum |
0 |
0 |
0 |
0 |
0 |
0 |
0 |
0 |
0 |
0 |
|
Triticale |
0 |
0 |
0 |
0 |
0.002 |
< 1 |
0 |
0 |
0 |
0 |
|
Wheat |
0.18 |
24 |
1.2 |
79 |
0.74 |
47 |
0.76 |
64 |
2.1 |
88 |
|
Other cereals |
0 |
0 |
0.003 |
< 1 |
0.001 |
< 1 |
0 |
0 |
0.001 |
< 1 |
|
Total intake |
0.78 |
100 |
1.4 |
100 |
1.6 |
100 |
1.2 |
100 |
2.4 |
100 |
The total intake of deoxynivalenol in micrograms per kilogram of body weight per day was estimated to be 0.78 from the African diet, 1.2 from the Latin American diet, 1.4 from the European diet, 1.6 from the Far Eastern diet, and 2.4 from the Middle Eastern diet. The main source of intake in Europe, Latin America, and the Middle East was wheat (64–88% of total intake), whereas the sources in the other two regions were more varied: wheat, rice, and maize in the African region and wheat and rice in the Far East. The estimates of average intake were based on the assumption that consumers choose foods randomly with respect to the distribution of concentrations of contaminants and will, therefore, be exposed to an approximation of the mean of that distribution over time. It should be noted that any reduction in the concentration of deoxynivalenol as a result of processing has not been taken into consideration in this assessment.
The distribution of dietary intake could not be assessed from the available data. Nonetheless, high intakes can be approximated by multiplying the average intake by a factor of two for a single food and by a factor of three for the total diet (WHO, 1985).
Information on food consumption patterns or deoxynivalenol intakes was submitted by Argentina, Norway, Sweden, the United Kingdom, and the USA. When only data on food consumption were reported, the weighted mean concentrations of deoxynivalenol were used to estimate dietary intake.
Information on the consumption of maize meal was reported from Argentina. The intake of deoxynivalenol was calculated by multiplying these amounts by the weighted concentration in maize (Table 17) (Solovey et al., 1999).
Table 17. Estimated intake of deoxynivalenol from maize meal in Argentina, assuming a deoxynivalenol concentration of 180 µg/kg (weighted mean of all data)
|
Population |
Body weight (kg) |
Eaters only |
Per capita |
||||
|
Maize meal consumption |
Deoxynivalenol intake |
Maize meal consumption (g/person per day) a |
Deoxynivalenol intake |
||||
|
µg/person per day |
µg/kg bw |
µg/person per day |
µg/kg bw |
||||
|
Males, |
14 |
200 |
35 |
2.5 |
15 |
2.7 |
0.19 |
|
Males, |
61 |
230 |
40 |
0.66 |
7.5 |
1.3 |
0.02 |
|
Males, |
78 |
250 |
44 |
0.56 |
20 |
3.5 |
0.04 |
|
Females, |
14 |
200 |
35 |
2.5 |
13 |
2.3 |
0.17 |
|
Females, |
56 |
220 |
38 |
0.68 |
11 |
1.9 |
0.03 |
|
Females, |
58 |
220 |
38 |
0.65 |
12 |
2.0 |
0.04 |
a Data from Solovey et al. (1999)
Norway submitted information on the consumption of oats, rye, and wheat by eight population subgroups, and deoxynivalenol intake was calculated from the weighted mean concentrations in these commodities (Table 18). Estimates of dexoynivalenol intake from grain were provided for two population subgroups in Sweden (Table 19).
Table 18. Intake of deoxynivalenol from grains in Norway
|
Population |
Food |
Deoxynivalenol concentrationa (µg/kg) |
Body weight (kg) |
Median consumption |
95th percentile consumption |
||||
|
Grain |
Deoxynivalenol |
Grain |
Deoxynivalenol |
||||||
|
µg/person per day |
µg/kg bw per day |
µg/person per day |
µg/kg bw per day |
||||||
|
Males and females, |
|||||||||
|
6 years |
Oats |
89 |
23 |
6.2 |
0.55 |
0.02 |
26 |
2.3 |
0.10 |
|
|
Rye |
65 |
23 |
13 |
0.82 |
0.04 |
25 |
1.6 |
0.07 |
|
|
Wheat |
390 |
23 |
180 |
69 |
3.0 |
380 |
150 |
6.4 |
|
Males and females, |
|||||||||
|
10 years |
|
|
|
|
|
|
|
|
|
|
|
Oats |
89 |
35 |
8.2 |
0.73 |
0.02 |
34 |
3.0 |
0.09 |
|
|
Rye |
65 |
35 |
16 |
1.0 |
0.03 |
32 |
2.1 |
0.06 |
|
|
Wheat |
390 |
35 |
230 |
89 |
2.5 |
490 |
190 |
5.4 |
|
Males, |
|||||||||
|
16–29 years |
Oats |
89 |
75 |
7.5 |
0.67 |
0.01 |
76 |
6.8 |
0.09 |
|
|
Rye |
65 |
75 |
15 |
1.0 |
0.01 |
31 |
2.0 |
0.03 |
|
|
Wheat |
390 |
75 |
280 |
110 |
1.4 |
700 |
270 |
3.6 |
|
Males, |
|||||||||
|
30–59 years |
Oats |
89 |
83 |
7.7 |
0.69 |
0.01 |
63 |
5.6 |
0.067 |
|
|
Rye |
65 |
83 |
14 |
0.93 |
0.01 |
28 |
1.8 |
0.02 |
|
|
Wheat |
390 |
83 |
240 |
92 |
1.1 |
570 |
220 |
2.6 |
|
Males, |
|||||||||
|
60–79 years |
Oats |
89 |
79 |
6.5 |
0.58 |
0.01 |
67 |
6.0 |
0.08 |
|
|
Rye |
65 |
79 |
13 |
0.84 |
0.01 |
25 |
1.6 |
0.02 |
|
|
Wheat |
390 |
79 |
190 |
75 |
0.95 |
720 |
280 |
3.5 |
|
Females, |
|||||||||
|
16–29 years |
Oats |
89 |
63 |
6.3 |
0.56 |
0.01 |
45 |
4.0 |
0.06 |
|
|
Rye |
65 |
63 |
11 |
0.72 |
0.01 |
19 |
1.2 |
0.02 |
|
|
Wheat |
390 |
63 |
190 |
76 |
1.2 |
440 |
170 |
2.7 |
|
Females, |
|||||||||
|
30–59 years |
Oats |
89 |
65 |
5.8 |
0.52 |
0.01 |
46 |
4.1 |
0.06 |
|
|
Rye |
65 |
65 |
10 |
0.66 |
0.01 |
18 |
1.2 |
0.02 |
|
|
Wheat |
390 |
65 |
170 |
68 |
1.0 |
390 |
150 |
2.3 |
|
Females, |
|||||||||
|
60–79 years |
Oats |
89 |
69 |
5.1 |
0.46 |
0.01 |
56 |
5.0 |
0.07 |
|
|
Rye |
65 |
69 |
10 |
0.65 |
0.01 |
17 |
1.1 |
0.02 |
|
|
Wheat |
390 |
69 |
160 |
61 |
0.88 |
360 |
140 |
2.0 |
Sources of information on food consumption and body weight: children 6 and 10 years, Norkost (1997); males and females > 16 years,
Langseth et al. (2000)
a
Weighted mean of all data
Table 19. Intake of deoxynivalenol from cereals by children and adults in Sweden (eaters only)
|
Population |
Food |
Consumption |
Deoxynivalenol concentration (µg/kg) |
Deoxynivalenol intake |
||
|
(g/person per day) |
(ng/kg bw per day)a |
|||||
|
Mean |
95th percentile |
Mean |
95th percentile |
|||
|
Children, |
Wheat |
76 |
120 |
70 |
140 |
230 |
|
Rye |
27 |
58 |
14 |
10 |
22 |
|
|
Oats |
28 |
64 |
8.5 |
6.3 |
14 |
|
|
Adults |
Wheat |
78 |
140 |
70 |
78 |
140 |
|
Rye |
36 |
77 |
14 |
7.5 |
16 |
|
|
Oats |
34 |
75 |
8.5 |
4.1 |
9.1 |
|
From Olsen et al. (1998)
a
Based on individual body weightsThe United Kingdom provided the mean, median, and 97.5th percentile consumption of grains by two population subgroups. The intakes of dexoynivalenol were calculated from the weighted mean concentrations in each of the grains (Table 20).
Table 20. Estimated intake of deoxynivalenol in the United Kingdom (eaters only)
|
Population |
Food |
Deoxynivalenol concentrationa |
% eaters |
Consumption (g/person per day)b |
Deoxynivalenol intake (µg/person per day) |
||||
|
Mean |
Median |
97.5th %tile |
Mean |
Median |
97.5th %tile |
||||
|
Children, |
Barley |
720 |
< 1 |
1.1 |
0.6 |
2.1 |
0.79 |
0.43 |
1.5 |
|
Maize |
180 |
66 |
10 |
6.6 |
37 |
1.8 |
1.2 |
6.4 |
|
|
Oats |
89 |
25 |
4.1 |
2.2 |
18 |
0.37 |
0.20 |
1.6 |
|
|
Rye |
65 |
1 |
2.0 |
1.7 |
4.9 |
0.13 |
0.11 |
0.32 |
|
|
Wheat |
390 |
99 |
47 |
45 |
100 |
18 |
17 |
39 |
|
|
Adults, |
Barley |
720 |
< 1 |
4.9 |
4.7 |
8.7 |
3.5 |
34 |
6.2 |
|
Maize |
180 |
50 |
12 |
7.6 |
50 |
2.2 |
13 |
8.8 |
|
|
Oats |
89 |
25 |
12 |
7.6 |
41 |
1.0 |
6.8 |
3.6 |
|
|
Rye |
65 |
9 |
7.4 |
3.7 |
39 |
0.48 |
2.4 |
2.5 |
|
|
Wheat |
390 |
99 |
130 |
120 |
250 |
49 |
47 |
97 |
|
a
Weighted mean of all datab
From Gregory et al. (1990, 1992)Table 21. Estimated intake of deoxynivalenol from grains in the USA (3-day average)
|
Population |
Intake |
|||||||||
|
µg/person per day |
µg/kg bw per daya |
|||||||||
|
Mean |
50th |
90th |
95th |
97.5th |
Mean |
50th |
90th |
95th |
97.5th |
|
|
Males and females, |
25 |
25 |
40 |
45 |
51 |
1.5 |
1.4 |
2.3 |
2.7 |
3.0 |
|
Males and females, |
35 |
33 |
53 |
60 |
66 |
1.0 |
0.97 |
1.6 |
1.8 |
2.0 |
|
Males, |
46 |
42 |
71 |
80 |
90 |
0.72 |
0.65 |
1.2 |
1.4 |
1.5 |
|
Females, |
35 |
31 |
53 |
61 |
80 |
0.63 |
0.55 |
1.0 |
1.2 |
1.5 |
|
Males, > 20 years |
53 |
44 |
95 |
120 |
150 |
0.66 |
0.54 |
1.2 |
1.5 |
1.9 |
|
Females, > 20 years |
31 |
29 |
53 |
62 |
71 |
0.49 |
0.43 |
0.85 |
1.0 |
1.2 |
From US Department of Agriculture (1996); grains comprised barley, maize, oats, popcorn, rice, rye, and wheat
a
Based on reported body weightsTable 21 shows the intake of dexoynivalenol from grain in the USA. The intakes were based on data on consumption collected in a nationwide survey (US Department of Agriculture, 1996). The amount of each grain (barley, maize, oats, popcorn, rice, rye, and wheat) consumed was multiplied by the weighted mean concentration of dexoynivalenol. The total intake is the sum of the intakes from all grains.
The occurrence of deoxynivalenol is associated primarily with F. graminearum (Gibberella zeae) and F. culmorum, which cause Fusarium head blight in wheat and Gibberella ear rot in maize. F. graminearum grows optimally at a temperature of 25 °C and will grow down to about 0.88 water activity (wa). F. culmorum grows optimally at 21 °C and will grow down to 0.87 wa. The geographical distribution of the two species appears to be related to temperature (Pitt & Hocking, 1997).
The incidence of Fusarium head blights in grain is most closely related to moisture at the time of flowering (anthesis), and the timing of rainfall, rather than the amount of rain, is the most critical factor. All Fusarium spp. can survive saprophytically on crop debris, and this is considered to be the principal reservoir of inoculum; other important sources are grass and broad-leaved weeds (for reviews, see Miller, 1994; Parry et al., 1995; D’Mello et al., 1997). A direct relationship between the incidence of ear blight and the deoxynivalenol contamination of wheat has been established (Snijders & Perkowski, 1990; Dill-Macky & Jones, 2000). Consequently, measures taken to control or minimize Fusarium infection will also reduce the formation of deoxynivalenol. Such measures include culture techniques, growing resistant cultivars, and use of fungicides or biological antagonists. The measures were summarized by Parry et al. (1995) and are briefly described below.
Culture control techniques include suitable crop rotation, appropriate use of fertilizers, irrigation, and weed control. Maize–wheat rotation increases the incidence of Fusarium head blight and should be avoided, whereas removal or ploughing in of crop debris reduces the incidence in wheat. Direct drilling or minimal cultivation increases the risk of infection when Fusarium-contaminated debris is present. High concentrations of nitrogen fertilizer may increase plant water stress, but the effect on Fusarium head blight is unclear. Effective weed control may be useful in reducing Fusarium inoculum, but the efficacy of weed control in reducing Fusarium head blight is debated. Irrigation may avoid water stress and reduce the severity of Fusarium foot rot in wheat, which may serve as an inoculum for the development of head blight. Overhead irrigation has been shown to increase the severity of the disease.
Differences between cultivars in susceptibility to Fusarium head blight has been recognized for more than 100 years. Most cultivars of wheat are susceptible, and only a few are moderately resistant. Few reports of immune species exist. Limited work has been done on breeding resistance into species other than wheat.
The effect of previous crop residues and tillage on Fusarium head blight in wheat were examined by Dill-Macky & Jones (2000), who confirmed that the incidence and severity of the disease were greatest when wheat followed maize and least when wheat followed soya beans. In addition, the incidence and severity were lower in molboard plow plots than in either chisel (reduced-till) or no-till plots. They suggested that changes in tillage practices, principally the move to conservation tillage and reduced-till systems, contributed to the recent epidemics of Fusarium head blight in midwestern USA.
Experimental work in plots revealed significant differences in the activity of fungicides against the Fusarium head blight pathogens (D’Mello et al., 1998). Those that effectively controlled the mycotoxin-producing pathogens also decreased the concentrations of deoxynivalenol in grain. Other reports indicated, however, that use of certain fungicides under certain circumstances increased the toxin concentra-tion in the grain (Milus & Parsons, 1994). Homdork et al. (2000) found that application of tebuconazole, which was also used by Milus & Parsons (1994), before infection allowed good control of Fusarium head blight and reduced the formation of deoxynivalenol. Jennings et al. (2000) found that tebuconazole, metconazole, and carbendazim effectively controlled the mycotoxin-producing F. graminearum and F. culmorum. Use of these products also decreased the concentrations of deoxynivalenol in the grain. Azoxystrobin appeared to be less effective and even stimulated deoxynivalenol production.
Parry et al. (1995) suggested that biological control measures could be a useful alternative to fungicide treatment, since the period during which the cereals are sensitive to the disease is short. There are few reports of such control of Fusarium head blight, and none seems to have been used in practice. Experimental use of biological control against diseases attributed to Fusarium spp. has been reported (Kempf & Wolf, 1989; Mao et al., 1998; Hoefnagels & Linderman, 1999).
Numerous chemicals have been tested for their ability to decontaminate trichothecene-contaminated grain or feed. Sodium bisulfite treatment of grain results in the greatest reduction in deoxynivalenol (Young et al., 1986). The concentrations of the reagents used and the treatment time appeared to affect the reduction; however, the concentrations would not be suitable for baked products for human consumption as they would change the rheological properties of the flour. Flour derived from sodium bisulfite-tempered wheat contained only low concentrations of deoxynivalenol, but the baking of that flour increased the amount of deoxynivalenol. This result was due partially to the fact that sodium bisulfite reacts with deoxynivalenol to form deoxynivalenol–sulfur adducts, which are unstable to high temperatures and basic pH. Accerbi et al. (1999) investigated the effect of combining sodium bisulfite and extrusion processing on deoxynivalenol concentrations in wheat grain and milled fractions. The extrusion process did not change the concentrations from those in unextruded milled flour or wholemeal flour.
Gaseous chemicals have also been tested for their ability to decontaminate deoxynivalenol-contaminated maize and wheat. In the laboratory, chemical treatment with moist ozone, ammonia, and microwave and convection heat treatment reduced the deoxynivalenol concentrations in mouldy grain (Young et al., 1986).
Treatment of deoxynivalenol in methanol with hypochlorite bleach containing added sodium hydroxide gave rise to a single major product, the 9alpha,10alpha,12beta,13beta-diepoxy-8,15-hemiketal (Burrows & Szafraniec, 1987).
Natural and modified clay minerals (e.g. bentonite, zeolithe, and diatomite) showed little or no binding to deoxynivalenol, in contrast to their extensive binding to aflatoxin B1 (Thimm et al., 2000).
The chemical binding agent polyvinylpyrrolidone had no effect on the reduced feed intake and body-weight gain of pigs fed diets containing deoxynivalenol (Friend et al., 1984).
Toxicological studies
Deoxynivalenol is metabolized in particular by de-epoxidation and glucuroni-dation, generally to less toxic metabolites.
It may have adverse health effects after single, short-term, or long-term administration. After single administration, deoxynivalenol has two characteristic toxicological effects: decreased feed consumption (anorexia) and emesis (vomiting). Both effects have been linked to increased central serotoninergic activity. Single doses of deoxynivalenol also damage rapidly dividing cells, such as those of the gastrointestinal tract. These characteristic effects have been observed with other trichothecenes, although differences in potency were seen.
Many early studies were conducted in which deoxynivalenol-contaminated cereal was incorporated into the feed of livestock. In later studies, purified deoxynivalenol was generally administered to experimental animals. In studies in livestock, feed naturally contaminated with deoxynivalenol tended to be more toxic than feed to which purified deoxynivalenol had been added. This result was attributed to the presence of additional fungal metabolites. Low concentrations of zearalenone or the 3- or 15-acetyldeoxynivalenol precursors were found in some cases.
After short- or long-term administration, one of the most consistent effects observed in most species was reduced growth. This was often the most sensitive parameter in routine studies of toxicity. At higher doses, the thymus, spleen, heart, and liver were affected. In a 2-year study in mice, a slight reduction in body weight observed at the lowest dose (0.1 mg/kg bw per day) was considered not to be biologically significant. Since no other changes were seen at this dose, the NOEL was 0.1 mg/kg bw per day.
A working group convened by IARC in 1993 placed deoxynivalenol in Group 3, ‘not classifiable as to its carcinogenicity to humans’. A study of carcinogenicity in mice conducted since that time showed fewer tumours of the liver in treated male mice than in controls. The Committee concluded that the lower incidence was due to the reduced body-weight of the treated animals. No significant difference in tumour incidence was seen in female mice.
Deoxynivalenol was not mutagenic in bacteria, but chromosomal aberrations were observed both in vitro and in vivo, suggesting that deoxynivalenol is genotoxic. However, in the one study conducted in vivo, most of the aberrations consisted of gaps, and the overall significance of the results was considered to be equivocal.
Deoxynivalenol was teratogenic but not maternally toxic when given to pregnant mice at 5 mg/kg bw per day by gavage over a short critical period (days 8–11) of gestation, but not when given at 2.5 mg/kg bw per day. When deoxynivalenol was administered in the feed, the NOEL for maternal toxicity and fetotoxicity was 0.38 mg/kg bw per day.
The results of two studies in mice suggested that deoxynivalenol can suppress host resistance to Listeria monocytogenes and Salmonella enteritidis, with a NOEL of 0.25 mg/kg bw per day in the first study and a LOEL of 0.12 mg/kg bw per day in the second. Antibody responses were also affected by deoxynivalenol, the NOEL being 1 mg/kg bw per day in mice. In pigs given naturally contaminated feed, the NOEL was 0.08 mg/kg bw per day.
Observations in humans
Many outbreaks of acute human disease involving nausea, vomiting, gastro-intestinal upset, dizziness, diarrhoea, and headache have been reported in Asia. These outbreaks have been attributed to consumption of Fusarium-contaminated grains and, more recently, to the presence of deoxynivalenol at reported concentrations of 3–93 mg/kg in grain for human consumption. Occasionally, other trichothecenes were present as well, but at much lower incidence and much lower concentrations. When the contaminated food was replaced with uncontaminated food, the signs and symptoms disappeared. In one study, these effects were not observed after consumption of grain containing deoxynivalenol at reported concentrations of 0.4–13 mg/kg, but there may have been underreporting or false-negative results at the higher concentrations. In two studies, none of the health effects described above were observed after consumption of grain containing deoxynivalenol at 0.02–3.5 mg/kg. Most of the studies on acute effects in humans were population-based or ecological studies.
Sampling protocols and analytical methods
Studies of variations during sampling for deoxynivalenol have been reported. In one study, 225-kg bulk samples were collected from six batches of barley, and each was riffle-divided into 16 test samples of 0.1 kg, 16 test samples of 0.8 kg, and 16 test samples of 7 kg and analysed. The results indicated that the variation associated with sample preparation and the analytical steps were of greater significance than the sampling variance for all sizes of test sample and that the variation was not substantially reduced by increasing the test sample size. In another study with a similar approach to studying variance in sampling, sample preparation, and analysis associated with the determination of deoxynivalenol in wheat, a 20-kg bulk sample was taken from each of 24 commercial batches, and each bulk sample was riffle-divided into 32 test samples of 0.45 kg each. For a batch concentration of deoxynivalenol of 5.0 mg/kg, the coefficient of variation was 6.3% for sampling, 10% for sample preparation, and 6.3% for analytical steps. The total variation was 13%. The low variation associated with the sampling step (relative to that for other mycotoxins and other commodities) is due partly to the high kernel count of wheat (about 30 kernels per gram), which is about 10 times higher than that of shelled maize and 30 times higher than that of shelled peanuts.
Official methods and other validated methods have been developed for the analysis of deoxynivalenol in cereals and foodstuffs. The introduction of improved clean-up columns based on charcoal, alumina, and modified diatomaceous earth before determination by TLC, gas, or liquid chromatography has simplified and accelerated the analysis of deoxynivalenol. Use of these columns in combination with GC and ECD or MS detection after derivatization of deoxynivalenol is the commonest technique for quantification. This technique allows simultaneous determination of deoxynivalenol and other trichothecenes at concentrations of a few nanograms per gram, even in complex food matrices. However, matrix problems may occur in GC analysis. LC with fluorescence detection after post-column derivatization or UV detection in combination with rigorous clean-up is a suitable alternative. LC with MS detection can be used for direct, simultaneous determination of several trichothecenes, but its high cost prohibits its routine use. TLC, particularly high performance, is still a convenient method for quantifying deoxynivalenol. TLC and ELISA methods are also good means for screening for deoxynivalenol.
Interlaboratory comparisons clearly showed that further improvements are needed in analytical methods for deoxynivalenol with respect to recovery, accuracy, and precision of measurements. Wider availability of reference materials for deoxy-nivalenol and regular international comparative studies are needed to improve internal and external quality assurance.
Levels and patterns of contamination of food commodities
Data on the concentrations of deoxynivalenol in food commodities were received from Argentina, Brazil, Canada, China, Finland, Germany, Italy, the Netherlands, Norway, Sweden, the United Kingdom, Uruguay, and the USA and were also obtained from the literature. Gas chromatography with electron capture or mass spectrometric detection was the commonest technique used for the quantification of deoxynivalenol, followed in order by thin-layer chromatography, liquid chromatography, and ELISA. Data were excluded from the evaluation when no information was provided on the analytical method or sampling protocol. The remaining data were used only if the samples had been collected at random and if the analytical methods used were considered to be adequate.
Deoxynivalenol was found to be a frequent contaminant of cereal grains, such as wheat (11 444 samples, 57% positive), maize (5349 samples, 41% positive), oats (834 samples, 68% positive), barley (1662 samples, 59% positive), rye (295 samples, 49% positive), and rice (154 samples, 27% positive). It was also detected in buckwheat, popcorn, sorghum, triticale and in some processed food products such as wheat flour, bread, breakfast cereals, noodles, baby and infant foods, and cooked pancakes. In addition, it has been reported in barley products, malt, and beer. The mean concentrations in data sets in which samples containing deoxynivalenol were found were 4–9000 µg/kg for barley, 3–3700 µg/kg for maize, 4–760 µg/kg for oats, 6–5100 µg/kg for rice, 13–240 µg/kg for rye, and 1–5700 µg/kg for wheat.
The submitted data showed wide annual variation in the deoxynivalenol concentrations in most of the cereals tested. These results emphasize the need for regular screening for deoxynivalenol in cereal crops.
Carry-over of deoxynivalenol to food products of animal origin does not appear to be of concern because animals refuse feed when the mycotoxin is present at high concentrations, and deoxynivalenol undergoes rapid metabolism and elimination in livestock species.
Food consumption/dietary intake assessment
The average intake of deoxynivalenol at the international level can be estimated by multiplying the average concentration by the estimated average food consumption. The GEMS/Food regional diets (Africas, European, Far Eastern, Latin American, and Middle Eastern), which are based on the average consumption of commodities, were used in the dietary intake assessment. Most of the data on mean concentrations of deoxynivalenol that were available for this evaluation were pooled; that is, each data point represented the mean concentration in a number of individual samples.
Data on processed food products were excluded from estimates of dietary intake. A total of 375 data points representing about 23 000 individual samples were included in the assessment. Of these data points, 243 were reported from countries represented by the GEMS/Food European-type diet. The remaining 132 data points represented the nine commodities in the other four geographical regions. As few data were available on the concentrations of deoxynivalenol in all commodities in regions other than Europe, a single mean concentration weighted by sample size was calculated for each commodity from the available data. The weighted mean concentration for each commodity (barley, maize, oats, rice, rye, wheat, popcorn, sorghum, and triticale) was multiplied by the respective value for consumption in each of the five GEMS/Food regional diets.
The total intake of deoxynivalenol was estimated to range from 0.77 µg/kg bw per day in the African diet to 2.4 µg/kg bw per day in the Middle Eastern diet. The major source of intake in three of the five regional diets (European, Latin American, and Middle Eastern) was wheat (64–88% of total intake), whereas the sources in the other two regional diets were more varied (wheat and rice in the Far Eastern and wheat, rice, and maize in the African diet). These estimates of average intake were based on the assumption that consumers choose foods randomly with respect to the distribution of the concentration of the contaminant and will, therefore have an intake that approximates the mean of that distribution over time. Although it was not possible to estimate high intakes from the available data, they may be approximated by multiplying the average intake by a factor of two for a single food and three for the total diet. Possible reductions in the concentrations of deoxynivalenol resulting from processing were not taken into consideration in this assessment.
In general, more data on the occurrence of deoxynivalenol in food products are required for better estimates of intake. The Committee noted that the distribution of concentrations of contaminants in processed products might differ from that in raw cereals; contamination tends to be more homogeneous after processing. Despite the uncertainty associated with the data on both concentration and food consumption, they provide useful preliminary estimates of contamination and intake at the international level.
Prevention and control
Preharvest measures to control Fusarium infection can also reduce the formation of deoxynivalenol. Reducing the inoculum of Fusarium in host debris and other reservoirs in the field seems to be one important control measure. Consequently, reduced tillage seems to increase the concentrations of deoxynivalenol in subsequent crops. Crop rotation is also important in reducing the inoculum, and rotation of wheat and maize with non-host crops has been recommended. Use of appropriate fungicides and the timing of their application is another important measure for controlling Fusarium head blight. Good agricultural practice, such as immediate drying after harvest and proper storage, prevents further contamination with deoxynivalenol.
Physical, chemical, and biological methods have been used to decontaminate grains containing trichothecenes. Some of the treatments reduce the concentration of toxin, while others are ineffective. Cleaning methods, such as gravity separation and washing procedures, can reduce the concentrations of deoxynivalenol in wheat and maize. The effectiveness of milling practices for reducing the concentration of deoxynivalenol in flour depends to a large extent on the degree of fungal penetration of the endosperm. Thermal processing is usually ineffective. Chemical and biological decontamination processes cannot yet be applied on a commercial scale.
The results of a 2-year feeding study in mice did not suggest that deoxynivalenol presents a carcinogenic hazard. The Committee considered that this study was appropriate for evaluation of other long-term effects. Although the mean body weight of animals at the lowest dose was lower than that of controls, the difference was considered not to be biologically significant, and no toxicological changes were observed at this dose. The Committee established a provisional maximum tolerable daily intake (PMTDI) of 1 µg/kg bw on the basis of the NOEL of 100 µg/kg bw per day in this study and a safety factor of 100. The Committee concluded that intake at this level would not result in effects of deoxynivalenol on the immune system, growth, or reproduction.
The Committee recognized that deoxynivalenol can cause outbreaks of acute illness in humans; however, the available data did not permit the establishment of a level below which no acute effects would be expected to occur.
Estimation of the dietary intake of deoxynivalenol on the basis of the single weighted mean concentrations and the GEMS/Food regional diets resulted in values that exceeded the PMTDI for four of the five regional diets. The Committee noted that there was considerable uncertainty in the intake estimates because of uncertainties in the values for concentration and consumption used in the assessment. Furthermore, food processing would be expected to reduce the levels of deoxynivalenol to varying extents, which would result in lower estimates of dietary intake.
Recommendations
|
• |
The results of comparative studies of toxicity and toxicokinetics would help to clarify species differences in sensitivity to deoxynivalenol. |
|
• |
Studies are needed on the combined effects of deoxynivalenol and other trichothecenes that may be present in human food. As the trichothecenes have similar toxic properties, albeit with different potencies, the Committee recommended that toxic equivalency factors be developed for the trichothecenes, if sufficient data become available. Since deoxynivalenol is the most extensively studied trichothecene, the Committee further recommended that toxic equivalency factors be established relative to deoxynivalenol. |
|
• |
In view of the widespread human exposure to deoxynivalenol, further studies on the genotoxicity of deoxynivalenol should be conducted, as well as a study of carcinogenicity in a second species (rat). |
|
• |
More detailed, analytical epidemiological studies of human disease should be conducted in those areas of the world where the presence of scabby wheat or mouldy maize is a cyclic, endemic event. Such data would help to establish a dose–response relationship between the intake of deoxynivalenol (and other trichothecenes) and acute illness and allow the identification of a NOEL based on human data. |
|
• |
For surveys of concentrations of deoxynivalenol, the accuracy and comparability of analytical measurements of the toxin in processed foods should be improved. |
|
• |
Additional data on the distribution of contamination and national food consumption patterns, particularly in countries where deoxynivalenol is prevalent, are needed. |
|
• |
Information on the effects of processing and its impact on levels of contamination by deoxynivalenol are needed for better estimates of dietary intake. |
|
• |
Better tools should be developed for the prevention of Fusarium plant diseases that result in production of deoxynivalenol in cereal crops. |
Abbas, H.K., Mirocha, C.J., Rosiles, R. & Carvajal, M. (1988) Decomposition of zearalenone and deoxynivalenol in the process of making tortilla from corn. Cereal Chem., 65, 15–19
Abouzied, M. (2000) A very sensitive rapid ELISA test for the detection and quantification of the trichothecene mycotoxins deoxynivalenol (deoxynivalenol). In: Proceedings of the X International IUPAC symposium of mycotoxins and phytotoxins, 21–25. May 2000, São Paulo.
Abouzied, M.M., Azcona, J.I., Braselton, W.E. & Pestka J.J. (1991) Immunochemical assessment of mycotoxins in 1989 grain foods: Evidence for deoxynivalenol (vomitoxin) contamination. Appl. Environ. Microbiol., 57, 672–677.
Accerbi, M., Rinaldi, E.A. & Ng, P.K.W. (1999) Utilization of highly deoxynivalenol-contaminated wheat via extrusion processing. J. Food Prot., 61, 1485–1487.
Adler, A., Lew, H., Edinger, W. & Oberforster, M. (1992) Moniliformin in durum wheat. In: Proceedings of the 3rd European Seminar on Fusarium Mycotoxins, Taxonomy, Pathogenicity and Host Resistance, 22–24 September 1992, Radzikow, Plant Breeding and Acclimatization Institute, pp. 22–27.
Ali, N., Sardjono, Yamashita, A. & Yoshizawa, T. (1998) Natural co-occurrence of aflatoxins and Fusarium mycotoxins (fumonisins, deoxynivalenol, nivalenol and zearalenone) in corn from Indonesia. Food Addit. Contam., 15, 377–384.
Anderson, V.L., Boland, E.W. & Casper, H.H. (1996) Effects of vomitoxin (DON) from scab infested barley on performance of feedlot and breeding beef cattle. J. Anim. Sci., 74, 208.
Apro, N., Resnik, S. & Ferro Fontán, C. (1987) [Representative samples for mycotoxins analysis.] An. Asoc. Quím. Argentina, 75, 501–510 (in Spanish).
Arnold, D.L., McGuire, P.F., Nera, E.A., Karpinski, K.F., Bickis, M.G., Zawidzka, Z.Z., Fernie, S. & Vesonder, R.F. (1986a) The toxicity of orally administered deoxynivalenol (vomitoxin) in rats and mice. Food Chem. Toxicol., 24, 935–941.
Arnold, D.L., Karpinski, K.F., McGuire, P.F., Nera, E.A., Zawidzka, Z.Z., Lok, E., Campbell, J.S., Tryphonas, L. & Scott, P.M. (1986b) A short-term feeding study with deoxynivalenol (vomitoxin) using rats. Fundam. Appl. Toxicol., 6, 691–696.
Atanassov, Z., Nakamura, C., Petkov, P., Panayotov, I., Kaneda, C. & Yoshizawa, T. (1995) Natural occurrence of Fusarium myvotoxins in wheat grain collected from Dobroudja, the biggest wheat-producing region in Bulgaria. Wheat Inform. Serv., 81, 13–17.
Atroshi, F., Rizzo, A.F., Veijalainen, P., Lindberg, L.A., Honkanen, B.T., Andersson, K., Hirvi, T. & Saloniemi, H. (1994) The effect of dietary exposure to DON and T-2 toxin on host resistance and serum immunoglobulins of normal and mastitic mice. J. Anim. Physiol. Anim. Nutr., 71, 223–233.
Azcona-Olivera, J.I., Ouyang, Y., Murtha, J., Chu, F.S. & Pestka, J.J. (1995a) Induction of cytokine mRNAs in mice after oral exposure to the trichothecene vomitoxin (deoxynivalenol): Relationship to toxin distribution and protein synthesis inhibition. Toxicol. Appl. Pharmacol., 133, 109–120.
Azcona-Olivera, J.I., Ouyang, Y.L., Warner, R.L., Linz, J.E. & Pestka, J.J. (1995b) Effects of vomitoxin (deoxynivalenol) and cycloheximide on IL-2, 4, 5 and 6 secretion and mRNA levels in murine CD4+ cells. Food Chem. Toxicol., 33, 433–441.
Banotai, C., Greene-Mcdowelle, D.M., Azcona-Olivera, J.I. & Pestka, J.J. (1999a) Effects of intermittent vomitoxin exposure on body weight, immunoglobulin levels and haematuria in the B6c3f(1) mouse. Food Chem. Toxicol., 37, 343–350.
Banotai, C., Azcona-Olivera, J.I., Greene-McDowelle, D.M. & Pestka, J.J. (1999b) Effects of vomitoxin ingestion on murine models for systemic lupus erythematosus. Food Chem. Toxicol., 37, 533–543.
Barna-Vetró, I., Gyöngyösi, À. & Làszló, S. (1997) Immunodiagnostics for mycotoxin determination. Hung. Agric. Res., 2, 16–19.
Barna-Vetro, I., Gyongyosi, A. & Solti, L. (1994) Monoclonal antibody-based enzyme-linked immunosorbent assay of fusarium T-2 and zearalenone toxins in cereals. Appl. Environ. Microbiol., 60, 729–731.
Basilico, M.Z., Sartore, A.L. & Basilico, J.C. (1997) [Detoxification of corn contaminated with deoxynivalenol (vomitoxin) using sodium bisulfite. Effect on Wistar rats]. Inf. Technol., 8, 57–63 (in Spanish).
Berger, U., Oehme, M. & Kuhn, F. (1999) Quantitative determination and structure elucidation of type A- and B-trichothecenes by HPLC/ion trap multiple mass spectrometry. J. Agric.Food Chem., 47, 4240–4245.
Bergsjø, B. & Kaldhusdal, M. (1994) No association found between the ascites syndrome in broilers and feeding of oats contaminated with deoxynivalenol up to thirty-five days of age. Poultry Sci., 73, 1758–1762.
Bergsjø, B., Matre, T. & Nafstad, I. (1992) Effects of diets with graded levels of deoxynivalenol on performance in growing pigs. Zentralbl. Veterinarmed. A, 39, 752–758.
Bergsjø, B., Langseth, W., Nafstad, I., Jansen, J.H. & Larsen, H.J. (1993a) The effects of naturally deoxynivalenol-contaminated oats on the clinical condition, blood parameters, performance and carcass composition of growing pigs. Vet. Res. Commun.,17, 283–294.
Bergsjø, B., Herstad, O. & Nafstad, I. (1993b) Effects of feeding deoxynivalenol-contaminated oats on reproduction performance in white Leghorn hens. Br. Poultry Sci., 34, 147–159.
Betina, V. (1989) Structure–activity relations among mycotoxins. Chem. Biol. Interactions, 71, 105–146.
Bhat, R.V., Ramakrishna, Y., Sashidhar, R.B. & Nahdi, S. (1987) Trichothecene mycotoxicosis; report on the investigations on the aetiology of a suspected disease outbreak due to products made from rain damaged wheat in the Kashmir Valley. Food Drug Toxicol. Res. Centre, ??, ??–??.
Bhat, R.V., Beedu, S.R., Ramakrishna, Y. & Munshi, K.L. (1989a) Outbreak of trichothecene mycotoxicosis associated with consumption of mould-damaged wheat production in Kashmir Valley, India. Lancet, i, 35–37.
Bhat, R.V., Ramakrishna, Y. & Sashidhar, R.B. (1989b) Outbreak of mycotoxicosis in Kashmir Valley, India. Nutr. News Natl Inst. Nutr., 10.
Bilgrami, K.S., Rahman, M.F., Masood, A. & Sahay, S.S. (1993) DON induced histopathological abnormalities in mice (Mus musculus). Natl Acad. Sci. Lett. (India), 16, 161–162.
Binder, E.M., Binder, J., Ellend, N., Schaffer, E., Krska, R. & Braun, R. (1998) Microbiological degradation of deoxynivalenol and 3-acetyl-deoxynivalenol. In: Miraglia, M., Van Egmond, H.P., Brera, C. & Gilbert, J., eds, Mycotoxins and Phycotoxins—Developments in Chemistry, Toxicology and Food Safety, Denver, Colorado: Alaken Publisher, pp. 279–285.
Binder, E.M., Heidler, D., Schatzmayr, G., Binder, J., Thimm, Fuchs, E.N., Krska, R. & Braun, R. (2000) Microbial detoxification of mycotoxins in animal feed. Presentation at the X International IUPAC symposium on mycotoxins and phycotoxins, Guarujá, May 21–25.
Blaas, W., Kellert, M., Steinmeyer, S., Tiebach, R. & Weber, R. (1984) [Investigation of the cereal content of deoxynivalenol and nivalenol in the lower µg/kg range.] Z. Lebensm. Untersuch. Forsch., 179, 104–108 (in German).
Boca, R.T., González, H.H.L., Pacin, A.M, Resnik, S. & Souza, J. (2000) [Contaminant mycoflora and natural ocurrence of mycotoxins in evaluation trials of soybean varieties in the Pamp,Buenos Aires Province]. In: III Latinoamerican Congress of Mycotoxicology, 6–10 November 2000, Córdoba (in Spanish).
Bondy, G.S. & Pestka, J.J. (1991) Dietary exposure to the trichothecene vomitoxin (deoxynivalenol) stimulates terminal differentiation of Peyer’s patch B cells to IgA secreting plasma cells. Toxicol. Appl. Pharmacol., 108, 520–530.
Bondy, G.S. & Pestka, J.J. (2000) Immunomodulation by fungal toxins. J. Toxicol. Environ. Health., 3, 109–143.
Boston, S., Wobeser, G. & Gillespie, M. (1996) Consumption of deoxynivalenol-contaminated wheat by mallard ducks under experimental conditions. J. Wildl. Dis., 32, 17–22.
Böswald, C., Engelhardt, G., Vogel, H. & Wallnöfer P.R. (1995) Metabolism of the Fusarium mycotoxins zearalenone and deoxynivalenol by yeast strains of technological relevance. Nat. Toxins, 3, 138–144.
Bradlaw, J.A., Swentzel, K.C., Alterman, E. & Hauswirth, J.W. (1985) Evaluation of purified 4-deoxynivalenol (vomitoxin) for unscheduled DNA synthesis in the primary rat hepatocyte-DNA repair assay. Food Chem. Toxicol., 23, 1063–1067.
Broggi, L.E., González, H.H.L., Moltó, G., Pacin, A., Resnik, S.L. & Cano, G. (1999a) [Natural ocurrence of mycotoxins and toxicogenic capacity of Fusarium graminearum and Microdochium nivale isolates in rice.] In: VIII Argentine Congress of Food Science and Technology, Rafaela, Santa Fe, 13–16 May 1999 (in Spanish).
Broggi, L.E., Pacin, A., Gonzàlez, H.H.L., Resnik, S.L, Cano, G. & Taglieri, D. (1999b) [Distribution of contaminating mycoflora and natural occurrence of mycotoxins in distinct fractions in rice production. In: 2 Symposium and 65th Meeting of high complexity Laboratories, ALAC 99, 18–20 November 1999, Buenos Aires.
Broggi, L.E., Pacin, A. & Resnik., S.L. (2000) Natural occurrence of mycotoxins in corn from Entre Ríos Province, Argentina. Unpublished data submitted to WHO and FAO by Ana Pacin.
Burrows, E.P. & Szafraniec, L.L. (1987) Hypochlorite-promoted transformations of tricho-thecenes, 3. deoxynivalenol. J. Nat. Prod., 50, 1108–1112.
Cahill, L.M., Kruger, S.C., McAlice, B.T., Ramsey C.S., Prioli, R. & Kohn, B. (1999) Quantification of deoxynivalenol in wheat using an immunoaffinity column and liquid chromatography. J. Chromatogr. A, 859, 23–28
Candlish, A.A.G. (1991) The determination of mycotoxins in animal feeds by biological methods. In: Smith, J.E. & Henderson, R.S., eds, Mycotoxins and Animal Foods: The Determination of Mycotoxins in Animal Feeds by Biological Methods, Boca Raton, Florida: CRC Press, pp. 223–246.
Cao, Y.J., Cai, M., Zhou, S.N. & Yan, X.P. (1994) A survey of natural occurrence of vomitoxin in corn and wheat flour in Jiangsu Province. Chin. J. Food Hyg., 6, 36–37.
Charmley L.L. & Prelusky D.B. (1994) Decontamination of Fusarium mycotoxins. In: Miller, J.D. & Trenholm H.L., eds, Mycotoxins in Grain—Compounds Other than Aflatoxin, St Paul, Minnesota:Eagan Press, pp. 421–435.
Charmley, E., Trenholm, H.L., Thompson, B.K., Vudathala, D., Nicholson, J.W.G., Prelusky, D.B. & Charmley, L.L. (1993) Influence of level of deoxynivalenol in the diet of dairy cows on feed intake, milk production, and its composition. J. Dairy Sci.,76, 3580–3587.
Chelkowski, J., Perkowski, J., Grabarkiewicz-Szcesna J., Kostecki, M. & Golinski, P. (2000) Toxigenic fungi and mycotoxins in cereals grains and feeds in Poland. COST 835. Unpublished data submitted by A. Logrieco.
China (undated) GB5009. National standard methods for food chemistry.
Chu, F.S. (1991) Detection and determination of mycotoxins. In: Sharma, R.P. & Salunkhe, D.K., eds, Mycotoxins and Phytoalexins, Boca Raton: CRC Press, pp. 33–79.
Chu, F.S. & Gy, Li. (1994) Simultaneous occurrence of fumonisin B1 and other mycotoxins in moldy corn collected from the People’s Republic of China in regions with high incidences of esophageal cancer. Appl. Environ. Microbiol., 60, 847–852.
Cole, R.J. (1986) Modern Methods in the Analysis and Structural Elucidation of Mycotoxins, Orlando, Florida: Academic Press.
Commission of the European Union (1999) Opinion on Fusarium toxins. Part 1: Deoxynvivalenol (DON). Scientific Committee on Food, Annex VI to the Minutes of the 119th Plenary Meeting, p. 9.
COPANT (1998) [Panamerican Standards 989/78.] Panamerican Committee for Technical Standards, Buenos Aires (in Spanish).
Côté, L.-M., Dahlem, A.M., Yoshizawa, T., Swanson, S.P. & Buck, W.B. (1986) Excretion of deoxynivalenol and its metabolite in milk, urine and feces of lactating dairy cows. J. Dairy Sci., 69, 2416–2423.
Côté, L.-M., Buck, W. & Jeffrey, E. (1987) Lack of hepatic microsomal metabolism of deoxynivalenol and its metabolite DOM-1. Food Chem. Toxicol., 25, 291–296.
Council for Agricultural Science and Technology (CAST) (1989) Mycotoxins: Economic and Health Risks (Task Force Report No. 116, November). Ames, Iowa: CAST.
Croteau, St.M., Prelusky, D.B. & Trenholm, H.L. (1994) Analysis of trichothecene mycotoxins by gas chromatography with electron capture detection. J. Agric.Food Chem., 42, 928–933.
Dahlem, A.M., Swanson, S.P., Côté, L.-M., Yoshizawa, T. & Buck, W.B. (1986) Quantitation of deoxynivalenol and its metabolite in bovine urine and feces by gas chromatography with electron-capture detection. J. Chromatogr. Biomed. Appl., 378, 226–231.
Dalcero, A., Torres, A., Etcheverry, M., Chulze, S. & Varsavsky, E. (1997) Occurrence of deoxynivalenol and Fusarium graminearum in Argentinian wheat. Food Addit. Contam., 14, 11–14.
Dill-Macky, R. & Jones, R.K. (2000) The effect of previous crop residues and tillage on Fusarium head blight of wheat. Plant Dis., 84, 71–76.
D’Mello, J.P.F., Porter, J.K., MacDonald A.M.C. & Placinta, C.M. (1997) Fusarium mycotoxins. In: D’Mello, J.P.F., ed., Handbook of Plant and Fungal Toxicants, Boca Raton, Florida: CRC Press, p. 287.
D’Mello ,J.P.F., MacDonald, A.M.C., Postel, D., Dijksma, T.P., Dujardin, A. & Placinta, C.M. (1998) Pesticide use and mycotoxin production in Fusarium and Aspergillus phytopathogens. Eur. J. Plant Pathol., 104, 741–751.
Dong, W.M. & Pestka, J.J. (1993) Persistent dysregulation of IgA production and IgA nephropathy in the B6C3F1 mouse following withdrawal of dietary vomitoxin (deoxynivalenol). Fundam. Appl. Toxicol., 20, 38–47.
Dong, W.M., Azconaolivera, J.I., Brooks, K.H., Linz, J.E. & Pestka, J.J. (1994) Elevated gene-expression and production of interleukin-2, interleukin-4, interleukin-5, and interleukin-6 during exposure to vomitoxin (deoxynivalenol) and cycloheximide in the EL-4 thymoma. Toxicol. Appl. Pharmacol., 127, 282–290.
Ehrlich, K.C. & Daigle, K.W. (1987) Protein synthesis inhibition by 8-oxo-12,13- epoxytrichothecenes. Biochem. Biophys. Acta, 923, 206–213.
Ellend, N., Binder, J., Krska, R. & Horvath, E.M. (1997) Contamination of Austrian corn with Fusarium toxins in autumn 1996. Cereal Res. Commun., 25, 359–360.
Eppley, R.M., Trucksess, M.W., Nesheim, S., Thorpe, C.W., Wood, G.E. & Bohland, A.E. (1984) Deoxynivalenol in winter wheat: Thin layer chromatographic method and survey. J. Assoc. Off. Anal. Chem., 67, 43–45.
Eppley, R.M., Trucksess, M.W., Nesheim, S., Thorpe, C.W. & Pohland, A.E. (1986) Thin layer chromatographic method for determination of deoxynivalenol in wheat: Collaborative study. J. Assoc. Off. Anal. Chem., 69, 37–40.
Eriksen, G.S. & Alexander, J., eds (1998) Fusarium Toxins in Cereals —A Risk Assessment (TemaNord 1998:502). Copenhagen: Nordic Council of Ministers, 115 pp.
Eskola, M., Parikka, P. & Rizzo, A. (2000a) Trichothecenes, ochratoxin A and zearalenone contamination and Fusarium infection in Finnish cereal samples in 1998. Unpublished document. Helsinki: Department of Chemistry, National Veterinary and Food Research Institute. Submitted by A. Rizzo.
Eskola, M., Rizzo, A. & Soupas, L. (2000b) Occurrence and amounts of some Fusarium toxins in Finnish cereal samples in 1998. Unpublished socument. Helsinki: Department of Chemistry. National Veterinary and Food Research Institute. Submitted by A Rizzo.
FAO (1994) Sampling plans for aflatoxin analysis in peanuts and corn. FAO Food and Nutrition Paper No. 55.
FAO/WHO (2000) Method of determination of DON in cereals and cereal products—TLC method. Unpublished document.
Fernandez, C., Stack, M. & Musser, S. (1994) Determination of deoxynivalenol in 1991 US winter and spring wheat by high-performance thin-layer chromatography. J. Assoc. Off. Anal. Chem. Int., 3, 628–630.
Fioramonti, J., Dupuy, C., Dupuy, J. & Bueno, L. (1993) The mycotoxin, deoxynivalenol, delays gastric emptying through serotonin-3 receptors in rodents. J. Pharmacol. Exp. Ther., 266, 1255–1260.
Fitzpatrick, D.W., Boyd, K.E., Wilson, L.M. & Wilson, J.R. (1988a) Effect of the trichothecene deoxynivalenol on brain biogenic monoamines concentrations in rats and chickens. J. Environ. Sci. Health B, 23, 159–170.
Fitzpatrick, D.W., Boyd, K.E. & Watts, B.M. (1988b) Comparison of the trichothecenes deoxynivalenol and T-2 toxin for their effects on brain biogenic monoamines in the rat. Toxicol. Lett., 40, 241–245.
Fomenko, V.N., Adzhigitov, F.I., Shariya, M.I. & Belova, E.G. (1991) Changes in hemostasis system after administration of mycotoxin deoxynivalenol (vomitoxin) to Macaca-rhesus monkeys. Gematol. Transfuziol., 36, 17–19.
Fonseca, H. (1991) [Sampling system for aflatoxins analysis in grains.] Rev. Microbiol., 21, 66–70 (in Spanish).
Fontán, F.C., Resnik, S., Pacin, A. & Quiroga, N. (1994) [Distribution functions of DON in wheat, harvest 1990 to 1992.] In: Proceedings of VI Argentine Congress on the Science and Technology of Food, Buenos Aires, 6–9 April 1994, pp. 105–107 (in Spanish).
Forsell, J.H., Witt, M.F., Tai, J.H., Jensen, R. & Pestka, J.J. (1986) Effects of 8-week exposure of the B6C3F1 mouse to dietary deoxynivalenol (vomitoxin) and zearalenone. Food Chem. Toxicol., 24, 213–219.
Forsell, J.H., Jensen, R., Tai, J.-H., Witt, M., Lin, W.S. & Pestka, J.J. (1987) Comparison of acute toxicities of deoxynivalenol (vomitoxin) and 15-acetyldeoxynivalenol in the B6C3F1 mouse. Food Chem. Toxicol., 25, 155–162.
Forsyth, D.M., Yoshizawa, T., Morooka, N. & Tuite, J. (1977) Emetic and refusal activity of deoxynivalenol to swine. Appl. Environ. Microbiol., 34, 547–552.
Foster, B.C., Trenholm, H.L., Friend, D.W., Thompson, B.K. & Hartin, K.E. (1986) Evaluation of different sources of deoxynivalenol (vomitoxin) fed to swine. Can. J. Anim. Sci., 66, 1149–1154.
Freese, L., Friedrich, R., Kendall, D. & Tanner, S. (2000) Variability of deoxynivalenol measurements in barley. J. Assoc. Off. Anal. Chem. Int., 83, 1259–1263.
Friedman, L., Gaines, D.W., Eppley, R., Smith, M.C., Chi, R.K. & Braunberg, R.C. (1996) Effects of T-2 toxin (T2), deoxynivalenol (DON), zearalenone (Z) and DON+Z on macromolecular synthesis by male rat spleen slices. FASEB J., 10, A458
Friend, D.W., Trenholm, H.L., Fiser, P.S., Thompson, B.K. & Hartin, K.E. (1983) Effect on dam performance and fetal development of deoxynivalenol (vomitoxin)-contaminated wheat in the diet of pregnant gilts. Can. J. Anim. Sci., 63, 689–698.
Friend, D.W., Trenholm, H.L., Young, J.C., Thompson, B. & Hartin, K.E. (1984) Effects of adding potential vomitoxin (deoxynivalenol) detoxicants or a F. graminearum inoculated corn supplement to wheat diets to pigs. Can. J. Anim. Sci., 64, 733–741
Friend, D.W., Thompson, B.K., Trenholm, H.L., Hartin, K.E. & Prelusky, D.B. (1986a) Effects of feeding deoxynivalenol-contaminated wheat diets to pregnant and lactating gilts and on their progeny. Can. J. Anim. Sci., 66, 229–236.
Friend, D.W., Trenholm, H.L., Thompson, B.K., Fiser, P.S. & Hartin, K.E. (1986b) Effect of feeding diets containing deoxynivalenol (vomitoxin)-contaminated wheat or corn on the feed consumption, weight gain, organ weight and sexual development of male and female pigs. Can. J. Anim. Sci., 66, 765–776.
Friend, D.W., Thompson, B.K., Trenholm, H.L., Boermans, H.J., Hartin, K.E. & Panich, P.L. (1992) Toxicity of T-2 toxin and its interaction with deoxynivalenol when fed to young pigs. Can. J. Anim. Sci.,72, 703–711.
Furlong, E. & Valente Soares, L. (1995) Gas chromatographic method for quantitation and confirmation of trichothecenes in wheat. J. Assoc. Off. Anal. Chem. Int., 78, 386–390.
Furlong, E., Valente Soares, L., Lasca, C. & Kohara, E. (1995) Mycotoxins and fungi in wheat harvested during 1990 in test plots in the state of São Paulo, Brazil. Mycopathologia, 131, 185–190.
Gao, H.P. & Yoshizawa, T. (1997) Further study on fusarium mycotoxins in corn and wheat from a high-risk area for human esophageal cancer in China. Mycotoxins, 45, 51–55.
Gendloff, E.H., Pestka, J.J., Dixon, D.E. & Hart, L.P. (1987) Production of a monoclonal antibody to T-2 toxin with strong cross-reactivity to T-2 metabolites. Phytopatology, 77, 57–59.
Gibson, M.K., Bursian, S.J. & Aulerich, R.J. (1993) Effects of deoxynivalenol on feed consumption and body weight gains in mink (Mustela vison). Bull. Environ. Contam. Toxicol., 51, 6–11.
Gilbert, J. (1992a) Deoxynivalonol in wheat and maize flour reference materials—1. An intercomparison of methods. Food Addit.Contam., 9, 71–81.
Gilbert, J. (1992b) Deoxynivalonol in wheat and maize flour reference materials—2. Preparation and certification. Food Addit.Contam., 9, 119–135.
Golinski, P., Perkowski, J., Kostecki, M., Grabarkiewicz-Szcesna J.& Chelkowski, J. (1996) Fusarium species and Fusarium toxins in wheat in Poland—A comparison with neighbour countries. Sydowia, 48, 12–22.
Gonzalez, H.H.l., Pacin, A., Resnik, S. L. & Martínez, E. (1996) Deoxynivalenol and contaminant mycoflora in freshly harvested Argentinian wheat in 1993. Mycopathologia, 135, 129–134.
González, H.H.L., Martínez, E.J., Pacin, A.M., Resnik, S.L. & Sydenham, E.W. (1999a) Natural co-occurrence of fumonisins, deoxynivalenol, zearalenone and aflatoxins in field trial corn in Argentina. Food Addit. Contam., 16, 565–569.
González, H.H.L., Martínez, E.J., Pacin, A. & Resnik, S.L. (1999b) Relationship between Fusarium graminearum and Alternaria alternata contamination and deoxynivalenol occurrence on Argentinian durum wheat. Mycopathologia, 144, 97–102.
Götz-Schröm, S., Schollenberger, M., Lauber, U., Müller, H.-M. & Drochner, W. (1998) [Effect of purified deoxynivalenol in growing pigs-results.] In: Proceedings of the 20th Workshop on Mycotoxins, Bundesanstalt für Getreide-, Kartoffel- und Fettforschung, Detmold, Germany, pp. 171–175 (in German).
Grain Inspection, Packers and Stockyards Administration (1995) Grain Inspection Handbook 1, Grain Sampling, Washington DC.
Greene, D.M., Azcona-Olivera, J.I. & Pestka, J.J. (1994) Vomitoxin (deoxynivalenol) induced IgA nephropathy in the B6C3F1 mouse: Dose–response and male predilection. Toxicology, 92, 245–260.
Gregory, J.R., Foster, K., Tyler, H. & Wiseman, M. (1990) Dietary and Nutritional Survey of British Adults, London: Her Majesty’s Stationery Office.
Gregory, J.R., Collins, D.L, Davies, P.S.W., Hughes, J.M. & Clarke, P.C. (1992) National Diet and Nutrition Survey; Children Aged 11/2 to 41/2 Years. Volume 1: Report of the Diet and Nutrition Survey. London: Her Majesty’s Stationery Office.
Groves, F.D., Zhang, L., Chang, Y.S., Ross, P.F., Casper, H., Norred, W.P., You, W.C. & Fraumeni, J.F., Jr (1999) Fusarium mycotoxins in corn and corn products in a high-risk area for gastric cancer in Shandong Province, China. J. AOAC Int., 82, 657–662.
Guo, H. W., Liu, Q.P., Hu, Z.H., Xu, D. D., Tanaka, T., Ueno, Y. & Wu, Q.F. (1989) The contamination of Fusarium toxins in wheat and the intake of these toxins by farmer. Chin. J. Food Hyg., 1, 20–24.
Guo, H.W., Zhu, Y.Z. & Liu, Q.P. (1995) A survey of natural occurrence of deoxynivalenol in corn and wheat flour in Shangai. Chin. J. Food Hyg., 7, 39–40.
Hack, R., Maertlbauer, E. & Terplan, G. (1989) A monoclonal antibody-based enzyme immunoassay for the detection of T-2 toxin at picogram levels. Lett. Appl. Microbiol., 9, 133–135.
Hart, L.P. (1998) Variability of vomitoxin in truckloads of wheat in a wheat scab epidemic year. Plant Dis., 82, 625–630.
Harvey, R.B., Kubena, L.F., Corrier, D.E., Witzel, D.A., Phillips, T.D. & Heidelbaugh, N.D. (1986) Effects of deoxynivalenol in a wheat ration fed to growing lambs. Am. J. Vet. Res., 47, 1630–1632.
Harvey, R.B., Kubena, L.F., Huff, W.E., Elissalde, M.H. & Phillips, T.D. (1991) Hematologic and immunologic toxicity of deoxynivalenol (DON)-contaminated diets to growing chickens. Bull. Environ. Contam. Toxicol., 46, 410–416.
Harvey, R.B., Edrington, T.S., Kubena, L.F., Elissalde, M.H., Casper, H.H., Rottinghaus, G.E. & Turk, J.R. (1996) Effects of dietary fumonisin B1-containing culture material, deoxynivalenol-contaminated wheat, or their combination on growing barrows. Am. J. Vet. Res., 57, 1790–1794.
Harvey, R.B., Kubena, L.F., Rottinghaus, G.E., Turk, J.R., Casper, H.H. & Buckley, S.A. (1997) Moniliformin from Fusarium fujikuroi culture material and deoxynivalenol from naturally contaminated wheat incorporated into diets of broiler chicks. Avian Dis., 41, 957–963.
He, P., Young, L.G. & Forsberg, C. (1992) Microbial transformation of deoxynivalenol (vomitoxin). Appl. Environ. Microbiol., 58, 3857–3863.
He, P., Young, L.G. & Forsberg, C. (1993) Microbially detoxified vomitoxin-contaminated corn for young pigs. J. Anim.Sci., 71, 963–967.
Heller, R.A., Song, K., Onasch, M.A., Fischer, W.H., Chang, D. & Ringold, G.M. (1990) Complementary DNA cloning of a receptor for tumor necrosis factor and demonstration of a shed form of the receptor. Proc. Natl Acad. Sci. USA, 87, 6151–6155.
Hietaniemi, V. & Kumpulainen, J. (1991) Contents of Fusarium toxins in Finnish and imported grains and feeds. Food Addit. Contam., 8, 171–182.
Hoefnagels, M.H. & Linderman, R.G. (1999) Biological suppression of seedborne Fusarium spp. during cold stratification of Douglas fir seeds. Plant Dis., 83, 845–852.
Homdork, S., Fehrmann, H. & Beck, R. (2000) Effect of field application of tebuconazole on yield, yield components and the mycotoxin content of Fusarium-infected wheat grain. J. Phytopathol., 148, 1–6.
Home Grown Cereals Authority (1999) Investigation of Fusarium infection and mycotoxin levels in harvested wheat grain (1998). Project Report No. 207. Unpublished data supplied by the Home Grown Cereals Authority, London.
Home Grown Cereals Authority (2000) Survey of mycotoxins in stored grain from the 1999 harvest in the UK. Project Report No. 230. Unpublished data supplied by the Home Grown Cereals Authority, London.
Hsia, C.C., Wu, J.L., Lu, X.Q. & Li, Y.S. (1988) Natural occurrence and clastogenic effects of nivalenol, deoxynivalenol, 3-acetyl-deoxynivalenol, 15-acetyl-deoxynivalenol, and zearalenone in corn from a high-risk area of esophageal cancer. Cancer Detect. Prev., 13, 79–86.
Huff, W.E., Doerr, J.A., Hamilton, P.B. & Vesonder, R.F. (1981) Acute toxicity of vomitoxin (deoxynivalenol) in broiler chickens. Poultry Sci., 60, 1412–1414.
Hughes, D.M., Gahl, M.J., Graham, C.H. & Grieb, S.L. (1999) Overt signs of toxicity to dogs and cats of dietary deoxynivalenol. J. Anim. Sci., 77, 693–700.
Hunder, G., Schumann, K., Strugala, G., Gropp, J., Fichtl, B. & Forth, W. (1991) Influence of subchronic exposure to low dietary deoxynivalenol, a trichothecene mycotoxin, on intestinal absorption of nutrients in mice. Food Chem. Toxicol., 29, 809–814.
Hunter, K.W., Brimfield, A.A., Miller, M., Finkelman, F.D. & Chu, S.F. (1985) Preparation and characterization of monoclonal antibodies to the trichothecene mycotoxin T-2. Appl. Environ. Microbiol., 49, 168–172
IARC (1993) IARC Monographs on the Evaluation of Carcinogenic Risks to Humans, Vol. 56, Some Naturally Occurring Substances: Food Items and Constituents, Heterocyclic Aromatic Amines and Mycotoxins, Lyon, 599 pp.
Ingalls, J.R. (1996) Influence of deoxynivalenol on feed consumption by dairy cows. Anim. Feed Sci. Technol., 60, 297–300.
Ihara, T., Sugamata, M., Sekijima, M., Okumura, H., Yoshino, N. & Ueno, Y. (1997) Apoptotic cellular damage in mice after T-2 toxin-induced acute toxicosis. Nat. Toxins., 5, 141–145.
Ihara, T., Yamamoto, T., Sugamata, M., Okumura, H. & Ueno, Y. (1998) The process of ultrastructural changes from nuclei to apoptotic body. Virchows Arch., 433, 443–447.
Isshiki, K., Mine, H. & Shinohara, K. (1992) Effects of some food additives and mycotoxins on the growth of HuH-6KK cells. In: Beuvery, E.C., Griffiths, J.B. & Zeijlemaker, W.P., eds, Animal Cell Technology, Amsterdam: Kluwer, pp. 559–563.
Isshiki, K., Asano, M. & Yamashoji, S. (1995) Cytotoxicity testing for food safety evaluation. In: Beuvery, E.C., Griffiths, J.B. & Zeijlemaker, W.P., eds, Animal Cell Technology: Developments for the 21st Century, Amsterdam: Kluwer, pp. 999–1003.
Ito, E., Okusu, M. & Terao, K. (1993) Light and scanning electron microscopical observations on gastro-intestinal tracts injured by trichothecenes. Maikotokishin, 38, 11–18.
Iverson, F., Armstrong, C., Nera, E., Truelove, J., Fernie, S., Scott, P., Stapley, R., Hayward, S. & Gunner, S. (1995) Chronic feeding study of deoxynivalenol in B6C3F1 male and female mice. Teratog. Carcinog. Mutag., 15, 283–306.
Jacobsen, B., Harlin, S., Swanson, R., Lambert, R., Beasley, V. & Sinclair, J. (1995) Occurrence of fungi and mycotoxins associated with field mold damaged soybeans in the midwest. Plant Dis., 79, 86–89.
Janardhana, G.R., Raveesha, K.A. & Shetty, H.S. (1999) Mycotoxin contamination of maize grains grown in Karnataka (India). Food Chem. Toxicol., 37, 863–868.
Jennings, P., Turner, J.A. & Nicholson, P. (2000) Overview of Fusarium ear blight in the UK—Effect of fungicide treatment on disease control and mycotoxin production. In: Pests & Diseases, Vol. 2, London: BCPC Publications, pp.707–712.
Jewers, K. (1987) [Related problems with sample collection for mycotoxins quantification and results interpretation.] In: Second International Conference on Mycotoxins (FAO/WHO/UNEP MYC 87/8.1), Thailand, 1987.
Ji, G.E., Park, S.Y., Wong, S.S. & Pestka, J.J. (1998) Modulation of nitric oxide, hydrogen peroxide and cytokine production in a clonal macrophage model by the trichothecene vomitoxin (deoxynivalenol). Toxicology, 125, 203–214.
Johannisson, A., Bjorkhag, B., Hansson, W., Gadhasson, I.L. & Thuvander, A. (1999) Effects of four trichothecene mycotoxins on activation marker expression and cell proliferation of human lymphocytes in culture. Cell Biol. Toxicol., 15, 203–215.
Johnson, P.J., Casteel, S.W. & Messer, N.T. (1997) Effect of feeding deoxynivalenol (vomitoxin)-contaminated barley to horses. J. Vet. Diagn. Invest., 9, 219–221.
Jone, C., Erickson, L., Trosko, J.E. & Chang, C.C. (1987) Effect of biological toxins on gap-junctional intercellular communication in Chinese hamster V79 cells. Cell Biol. Toxicol., 3, 1–15.
Josephs, R. (1999) Development, application and characterisation of analytical methods for the determination of agriculturally important Fusarium mycotoxins, Thesis, Technical University, Vienna.
Josephs, R.D., Krska, R., Grasserbauer, M. & Broekaert, J.A.C. (1998) Determination of thrichothecene mycotoxins in wheat by use of supercritical fluid extraction and HPLC-DAD or GC-ECD. J. Chromatogr. A, 795, 297–304.
Josephs, R.D., Schuhmacher, R. & Krska, R. (2001) International interlaboratory study for the determination of the Fusarium mycotoxins zearalenone and deoxynivalenol in agricultural commodities. Food Addit.Contam., in press
Junta Nacional de Granos (1984) Resolución No. 26120/84. [Grain sampling method.], Buenos Aires (in Spanish).
Kamimura, H. (1989) Removal of mycotoxins during food processing. In: Natori, S., Hashimoto, K. & Ueno, Y., eds, Mycotoxins and Phycotoxins ’88, Amsterdam: Elsevier Science Publisher, pp.169–176.
Karlovski, P. (1999) Biological detoxification of fungal toxins and its use in plant breeding, feed and food production. Nat. Toxins, 7, 1–23.
Kasuga, F., Hara Kudo, Y., Saito, N., Kumagai, S. & Sugita Konishi, Y. (1998) In vitro effect of deoxynivalenol on the differentiation of human colonic cell lines Caco-2 and T84. Mycopathologia, 142, 161–167.
Kawamura, O., Satoshi, N., Sonomi, S., Ohtani, K., Yoshitugu, S., Tanaka, T. & Ueno, Y. (1990) Survey of T-2 toxin in cereals by an indirect enzyme-linked immunosorbent assay. Food Agric. Immunol., 2, 173–180.
Kempf, H.J. & Wolf, G. (1989) Erwina herbicola as a biocontrol agent of Fusarium culmorum and Puccinia recondita f. sp. Tritici on wheat. Phytopathology, 79, 990–994.
Khera, K.S., Whalen, C., Angers, G., Vesonder, R.F. & Kuiper-Goodman, T. (1982) Embryotoxicity of 4-deoxynivalenol (vomitoxin) in mice. Bull. Environ. Contam. Toxicol., 29, 487–491.
Khera, K.S., Arnold, D.L., Whalen, C., Angers, G. & Scott, P.M. (1984) Vomitoxin (4-deoxynivalenol): Effects on reproduction of mice and rats. Toxicol. Appl. Pharmacol., 74, 345–356.
Khera, K.S., Whalen, C. & Angers, G. (1986) A teratology study on vomitoxin (4-deoxynivalenol) in rabbits. Food Chem. Toxicol., 24, 421–424.
Kiessling, K.H., Pettersson, H., Sandholm, K. & Olsen, M. (1984) Metabolism of aflatoxin, ochratoxin, zearalenone, and three trichothecenes by intact rumen fluid, rumen protozoa, and rumen bacteria. Appl. Environ. Microbiol., 47, 1070–1073.
Kim, J., Kang, H, Lee, D., Lee, Y. & Yoshizawa, T. (1993) Natural occurrence of Fusarium mycotoxins (trichothecenes and zearalenone) in barley and corn in Korea. Appl. Environ. Microbiol., 59, 3798–3802.
King, R.R., McQueen, R.E., Levesque, D. & Greenhalgh, R. (1984a) Transformation of deoxynivalenol (vomitoxin) by rumen microorganisms. J. Agric.Food Chem., 32, 1181–1183.
King, R.R., Greenhalgh, R. & Blackwell, B.A. (1984b) Oxidative transformation of deoxynivalenol (vomitoxin) for quantitative and chemical confirmatory purposes. J. Agric. Food Chem., 32, 72–75.
Knasmuller, S., Bresgen, N., Kassie, F., Mersch-Sundermann, V., Gelderblom, W., Zohrer, E. & Eckl, P.M. (1997) Genotoxic effects of three Fusarium mycotoxins, fumonisin B1, moniliformin and vomitoxin in bacteria and in primary cultures of rat hepatocytes. Mutat. Res., 391, 39–48.
Kollarczik, B., Gareis, M. & Hanelt, M. (1994) In vitro transformation of the fusarium mycotoxins deoxynivalenol and zearalenone by the normal gut microflora of pigs. Nat. Toxins, 2, 105–110.
Kotal, F., Holadova, K., Hajslova, J., Poustak, J. & Radova, Z. (1999) Determination of trichothecenes in cereals. J. Chromatogr. A, 830, 219–225.
Krska, R. (1998) Performance of modern sample preparation techniques in the analysis of Fusarioum mycotoxins in cereals. J. Chromatogr. A, 815, 49–57.
Krska, R., Schuhmacher, R., Weingärtner, J. & Grasserbauer, M. (1997) Modern sample preparation techniques for the analysis of Fusarium mycotoxins in cereals. Cereal Res. Commun., 25, 327–329.
Kubena, L.F., Huff, W.E., Harvey, R.B., Phillips, T.D. & Rottinghaus, G.E. (1989) Individual and combined toxicity of deoxynivalenol and T-2 toxin in broiler chicks. Poultry Sci., 68, 622–626.
Kubena, L.F., Edrington, T.S., Harvey, R.B., Buckley, S.A., Phillips, T.D., Rottinghaus, G.E. & Casper, H.H. (1997) Individual and combined effects of fumonisin B1 present in Fusarium moniliforme culture material and T-2 toxin or deoxynivalenol in broiler chicks. Poultry Sci., 76, 1239–1247.
Kuczuk, M.H., Benson, P.M., Heath, H. & Hayes, A.W. (1978) Evaluation of the mutagenic potential of mycotoxins using Salmonella typhimurium and Saccharomyces cerevisiae. Mutat. Res., 53, 11–20.
Kuiper-Goodman, T. (1985) Potential human health hazards and regulatory aspects. In: Scott, P.M., Trenholm, H.L. & Sutton, M.D., eds, Mycotoxins: A Canadian Perspective (NRCC No. 22848), National Research Council of Canada, Ottawa, pp. 103–111.
Kuiper-Goodman, T. (1994) Prevention of human mycotoxicoses through risk assessment and risk management. In: Miller, J.D. & Trenholm, H.L., eds, Mycotoxins in Grain: Compounds Other than Aflatoxin, St Paul, Minnesota: Eagan Press, pp. 439–469.
Lake, B.G., Phillips, J.C., Walters, D.G., Bayley, D.L., Cook, M.W., Thomas, L.V., Gilbert, J., Startin, J.R. & Baldwin, N.C.P. (1987) Studies on the metabolism of deoxynivalenol in the rat. Food Chem. Toxicol., 25, 589–592.
Lambert, L.A., Hines, F.A. & Eppley, R.M. (1995) Lack of initiation and promotion potential of deoxynivalenol for skin tumorigenesis in Sencar mice. Food Chem. Toxicol., 33, 217–222.
Langseth, W. (2000) [A survey on the occurrence of mycotoxins in cereals on the Norwegian market.] Oslo: National Vetrinary Institute.
Langseth, W. & Clasen, P. (1992) Automation of the clean-up procedure for determination of trichothecenes in cereals using the charcoal alumina column. J. Chromatogr., 603, 290–293.
Langseth, W. & Elen, O. (1996) Differences between barley, oats and wheat in the occurrence of deoxynivalenol and other trichothecenes in Norwegian grain. J. Phytopathol., 144, 113–118.
Langseth, W. & Elen, O. (1997) The occurrence of deoxynivalenol in Norwegian cereals—Differences between years and districts, 1988–1996. Acta Agric. Scand. B, 47, 176–184.
Langseth, W. & Rundberget, T. (1998) Instrumental methods for determination of nonmacrocyclic trichothecens in cereals, foodstuff and cultures. J. Chromatogr. A, 815, 103–121.
Langseth, W., Elen, O. & Rundberget, T. (2000) Occurrence of mycotoxins in Norwegian cereals 1988–1999. Oslo, National Veterinary Institute, Department of Chemistry. Unpublished data submitted by W. Langseth.
Lauren, D.R. & Agnew, M.P. (1991) Multitoxin screening method for Fusarium mycotoxins in grains. J. Agric. Food Chem., 39, 502–507.
Lauren, D.R., Agnew, M.P., Smith, W.A. & Sayer, S.T. (1991) A survey of the natural occurrence of Fusarium mycotoxins in cereals in New Zealand in 1986–1989. Food Addit. Contam., 8, 599–605.
Lauren, D.R., Jensen, D.J., Smith, W.A. & Dow, B.W. (1996) Mycotoxins in New Zealand maize: A study of some factors influencing contamination levels in grain. N. Z. J. Crop Hort. Sci., 24, 13–20.
Lautraite, S., Parent-Massin, D., Rio, B. & Hoellinger, H. (1997) In vitro toxicity induced by deoxynivalenol (DON) on human and rat granulomonocytic progenitors. Cell Biol. Toxicol., 13, 175–183.
Lawrence, J.F. & Scott, P.M. (2000) Determination of mycotoxins and phycotoxins. In: Barceló, D., ed., Sample Handling and Trace Analysis: Techniques, Applications and Quality Assurance, Amsterdam: Elsevier, pp. 413–456.
Lee, Y., Kim, J. Lee, D., Kang, H. & Yoshizawa, T. (1995) Natural occurrence of trichothecenes and zearalenone in the 1993 barley crop in Korea. J. Food Hyg. Soc. Jpn, 36, 85–88.
Leitgeb, R., Lew, H., Wetscherek, W., Bohm, J. & Quinz, A. (1999) Influence of fusariotoxins on growing and slaughtering perfomance of broilers. Bodenkultur, 50, 57–66.
Lew, H., Adler, A., Thimm, N., Krska, K., Wiedner, G. & Schuh, M. (2000a) Occurrence of toxigenic fungi and related mycotoxins in plants, food and feed in Austria. COST 835. Unpublished. Submitted by A. Logrieco
Lew, H., Adler, A., Thimm, N., Krska, K., Wiedner, G. & Schuh, M. (2000b) Fusarium species and Fusarium toxins in Austrian maize. Bodenkultur (in press).
Li, Y.W. (1997) A survey of natural occurrence of deoxynivalenol in wheat. Unpublished data.
Li, S.G., Ouyang, Y.L., Dong, W.M., Pestka, J.J. & Dong, W.M. (1997) Superinduction of IL-2 gene expression by vomitoxin (deoxynivalenol) involves increased mRNA stability. Toxicol. Appl. Pharmacol., 147, 331–342.
Li, F.Q., Luo, X.Y. & Yoshizawa, T. (1999) Mycotoxins (trichothecenes, zearalenone and fumonisins) in cereals associated with human red-mold intoxications stored since 1989 and 1991 in China. Nat. Toxins, 7, 93–97.
Li, S.G., Ouyang, Y.L., Yang, G.H. & Pestka, J.J. (2000) Modulation of transcription factor Ap-1 activity in murine El-4 thymoma cells by vomitoxin (Deoxynivalenol). Toxicol. Appl. Pharmacol., 163, 17–25.
Ligler, F.S., Bredehorst, R., Talebian, A., Shriver, L.C., Hammer, C.F., Sheridan, J.P., Vogel, C.W. & Gaber, B.P. (1987) A homogeneous immunoassay for the mycotoxin t-2 utilizing liposomes, monoclonal antibodies, and complement. Anal. Biochem., 163, 369–375.
Liu, G.H., Hou, G.L., Guo, Z.H. Wang, W.R., Zhang, R.A. & Hou, F.L. (1992) A survey of natural occurrence of deoxynivalenol in corn and wheat flour in Shangai. Chin. J. Hyg. Res., 21, 205–207.
Liu, W., Langseth, W., Skinnes, H., Elen, O.N. & Sundheim, L. (1997) Comparison of visual head blight ratings, seed infection levels, and deoxynivalenol production for assessment of resistance in cereals inoculated with Fusarium culmorum. Eur. J. Plant Pathol., 103, 589–595.
Lops, R., Pascale, M., Pancaldi, D. & Visconti, A. (1998) [Fungal infections and the presence of deoxynivalenol in wheat grains from various Italian regions.] Inf. Fitopatol., 4, 60–66 (in Italian).
Lu, G., Xie, Y. & Li, F.L. (1992) A survey of natural occurrence of deoxynivalenol in cereals in Anhui Province. Chin. J. Hyg. Res., 21, 260–262.
Lu, G., Li, L. & Xue, Y. (1994) [Studies on deoxynivalenol contamination in grain and its products in Anhui Province.] Chung Hua Yu Fang I Hsueh Tsa Chih, 28, 27–30 (in Chinese).
Luo, X.Y. (1988) Outbreaks of moldy cereals poisoning in China. In: Issues in Food Safety, Washington DC: Toxicology Forum, Inc., pp. 56–63.
Luo, X.Y. & Li, Y.W. (1991) A survey of natural occurrence of deoxynivalenol in corn and wheat flour in Hebei and Henan Province. Unpublished data.
Luo, Y., Yoshizawa, T. & Katayama, T. (1990) Comparative study on the natural occurrence of Fusarium mycotoxins (trichothecenes and zearalenone) in corn and wheat from high- and low-risk areas for human esophageal cancer in China. Appl. Environ. Microbiol., 56, 3723–3726.
Luo, Y., Yoshizawa, T., Yang, J.S., Zhang, S.Y. & Zhang, B.J. (1992) A survey of Fusarium mycotoxins (trichothecenes, zearalenone and fusarochromanone) in corn and wheat samples from Shaanxi and Shanxi Provinces, China. Mycotoxin Res., 8, 85–91.
Lusky, K., Gobel, R., Tesch, D., Tenner, G., Haider, W., Kruger, M. & Lippert, A. (1998) Studies on the effects of ochratoxin A and deoxynivalenol toxicity on the health of pigs and tissue residue concentrations. Tierarztl. Umsch., 53, 623–630.
Mallman, C. (2000) Mycotoxins in Brazil. Unpublished report.
Malone, B.R., Humphrey, C.W., Romer, T.R. & Richard, J.L. (1998) One-step solid phase extraction clean-up and fluorometric analysis of deoxynivalenol in grains. J. AOAC Int., 81, 448–452.
Mao, W., Lumsden, R.D., Lewis, J.A. & Hebbar, P.K. (1998) Seed treatment using pre-infiltration and biocontrol agents to reduce damping-off of corn caused by species of Pythium and Fusarium. Plant Dis., 82, 294–299.
Marasas, W., Van Rensburg, S. & Mirocha,C. (1979) Incidence of Fusarium species and their mycotoxins, deoxynivalenol and zearalenone in corn produced in esophageal cancer areas in Transkei. J. Agric. Food Chem., 27, 1109.
Marpegan, M.R., Perfumo, C.J., Godoy, H.M., Sala de Miguel, M., Diaz, E. & Risso, M.A. (1988) Feed refusal of pigs caused by fusarium mycotoxins in Argentina. J. Vet. Med. A, 35, 610–616.
Martinez, N.S., Barreto. D., Carmona, M., Cano, G. & Pacin, A.M. (2000) [Study of fungal contamination and mycotoxins in barley.] In: III Latinoamerican Congress on Mycotoxicology, 6–10 November 2000, Córdoba (in Spanish).
Märtlbauer, E., Dietrich, R. & Terplan, G. (1991) [Experience with immunoassays for the determination of mycotoxins in food.] Arch. Lebensmittelhyg., 42, 3–6 (in German).
Marx, H., Gedek, B. & Kollarczik, B. (1995) Comparative investigations on mycotoxicological status of alternatively and conventionally grown crops. Z. Lebensm. Unters. Forsch., 201, 83–86.
Maycock, R. & Utley, D. (1985) Analysis of some trichothecene mycotoxins by liquid chromatography. J. Chromatogr., 347, 429–433.
Menna, M., Lauren, D. & Hardacre, A. (1997) Fusaria and Fusarium toxins in New Zealand maize plants. Mycopathologia, 139, 165–173.
Miller, J.D. (1994) Epidemiology of Fusarium ear diseases of cereals. In: Miller, J.D. & Trenholm H. L., eds, Mycotoxins in Grain—Compounds Other than Aflatoxin, St Paul, Minnesota: Eagan Press, pp. 19–36.
Mills, C.E.N., Alcock, S.M., Lee, H.A. & Morgan, M.R.A. (1990) An enzyme-linked immunosorbent assay for deoxynivalenol in wheat, utilizing novel hapten derivatization procedures. Food Agric. Immunol., 2, 109–118.
Milus, E.A. & Parsons, C.E. (1994) Evaluation of foliar fungicides for controlling Fusarium head blight of wheat. Plant Dis., 78, 697–699.
Mirocha, C.J., Kolaczkowski, E., Xie, W., Yu, H. & Jelen. H.-H. (1998) Analysis of deoxynivalenol and its derivatives (batch and single kernel) using gas chromatography / mass spectrometry. J. Agric. Food Chem., 46, 1414–1418.
Miura, K., Nakajima, Y., Yamanaka, N., Terao, K., Shibato, T. & Ishino, S. (1998) Induction of apoptosis with Fusarenon-X in mouse thymocytes. Toxicology, 127, 195–206.
Möller, T. & Gustavsson, H. (1992) Determination of type A and B trichothecenes in cereals by gas chromatography with electron capture detection. J. AOAC Int., 75, 1049–1053.
Molto, G., Samar, M.M., Resnik, S., Martinez, E.J. & Pacin, A. (2000) Occurrence of trichothecenes in Argentinean beer. A preliminary exposure assessment. Food Addit. Contam., 17, 809–813.
Moore, C.J., Blaney, B.J., Spencer, R.A. & Dodman, R.L. (1985) Rejection by pigs of mouldy grain containing deoxynivalenol. Aust. Vet. J., 62, 60–62.
Morgan, M.R.A. (1989) Mycotoxin immunoassays: With special reference to ELISAs. Tetrahedron, 45, 2237–2249.
Morooka, N., Uratsuji N., Yoshizawa, T. & Yamamoto H. (1972) Studies on the toxic substances in barley infected with Fusarium spp. J. Food Hyg. Soc. Jpn, 13, 368–375.
Morris, C.M., Li, Y.C., Ledoux, D.R., Bermudez, A.J. & Rottinghaus, G.E. (1999) The individual and combined effects of feeding moniliformin, supplied by Fusarium fujikuroi culture material, and deoxynivalenol in young turkey poults. Poultry Sci., 78, 1110–1115.
Morrissey, R.E. (1984) Teratological study of Fischer rats fed diet containing added vomitoxin. Food Chem. Toxicol., 22, 453–457.
Morrissey, R.E. & Vesonder, R.F. (1985) Effect of deoxynivalenol (vomitoxin) on fertility, pregnancy, and postnatal development of Sprague-Dawley rats. Appl. Environ. Microbiol., 49, 1062–1066.
Morrissey, R.E., Norred, W.P. & Vesonder, R.F. (1985) Subchronic toxicity of vomitoxin in Sprague-Dawley rats. Food Chem. Toxicol., 23, 995–999.
Mulders, J. & Van Impelen-Peek Hilde, A.M. (1986) Gas chromatographic determination of deoxynivalenol in cereals. Z. Lebensm. Unters. Forsch., 183, 406–409.
Müller, H. & Schwadorf, K. (1993) Natural occurrence of Fusarium toxins in wheat grown in a southwestern area of Germany. Mycopathologia, 121, 115–121.
Müller, H.M., Reimann, J., Schumacher, U. & Schwadorf, K. (1997a) Fusarium toxins in wheat harvested during six years in an area of southwest Germany. Nat. Toxins, 5, 24–30
Müller, H., Reinmann, J., Schumacher, U. & Schwadorf, K. (1997b) Natural occurrence of Fusarium toxins in barley harvested during five years in an area of southwest Germany. Mycopathologia, 137, 185–192.
Müller, H.M., Reimann, J., Schumacher, U. & Schwadorf, K. (1998) Natural occurrence of Fusarium toxins in oats harvested during five years in an area of southwest Germany. Food Addit. Contam., 15, 801–806.
Neira, M.S., Pacin, A.M., Martínez, E.J., Moltó, G. & Resnik, S.L (1997) The effect of bakery processing on natural deoxynivalenol contamination. Int. J. Food Microbiol., 37, 21–25.
Niessen, L. & Donhauser, S. (1993) Fate of deoxynivalenol in the process of brewing and its prevalence in commercial beer. In: Occurrence and Significance of Mycotoxins, Slough: Central Science Laboratory, pp. 203–207.
Niessen, L., Böhm-Schrami, M., Vogel, H. & Donhauser, S. (1993) Deoxynivalenol in commercial beer—Screening for the toxin with an indirect competitive ELISA. Mycotoxin Res., 9, 99–108.
Norkost (1997) GEMS/Food spreadsheet
Nowicki, T.M., Gaba, D.G., Dexter, J.E., Matsuo, R.R. & Clear, R.M. (1988) Retention of the Fusarium mycotoxin deoxynivalenol in wheat during processing and cooking of spagetti and noodles. J. Cereal Chem., 8, 189–202.
Ohta, M., Matsumoto, H., Ishii, K. & Ueno, Y. (1978) Metabolism of trichothecene mycotoxins. Part 2: Substrate specificity of microsomal deacetylation of trichothecenes. J. Biochem., 84, 697–706.
Okoye, Z.S. (1993) Fusarium mycotoxins nivalenol and 4-acetyl-nivalenol (fusarenon-X) in mouldy maize harvested from farms in Jos district, Nigeria. Food Addit. Contam., 10, 375–379.
Olavarria, J. (1992) [Mycotoxins quantification in grain and subproducts. Problems associated with sampling and procedure for application limits.] IPA Platina, 67, 18–25 (in Spanish).
Olsen, G.H., Carpenter, J.W., Gee, G.F., Thomas, N.J. & Dein, F.J. (1995) Mycotoxin-induced disease in captive whooping cranes (Grus americana) and sandhill cranes (Grus canadensis). J. Zoo Wildl. Med., 26, 569–576.
Olsen, M., Thuvander, A., Méller, T., Enghardt Barbieri, H., Staffas, A., Jansson, A., Salmonsson, A.-C., Axberg, K. & Hulf, K. (1998) Mycotoxins—Levels, Intake and Risks (Report 22/98), Uppsala: National Food Administration.
Onji, Y., Aoki, Y., Tani, N., Umebayashi, K., Kitada, Y. & Dohi, Y. (1998) Direct analysis of several Fusarium mycotoxins in cereals by capillary gas chromatography–mass spectrometry. J. Chromatogr. A, 815, 59–65.
Ossenkopp, K.P., Hirst, M. & Rapley, W.A. (1994) Deoxynivalenol (vomitoxin)-induced conditioned taste aversions in rats are mediated by the chemosensitive area postrema. Pharmacol. Biochem. Behav., 47, 363–367.
Ouyang, Y.L., Azcona Olivera, J.I. & Pestka, J.J. (1995) Effects of trichothecene structure on cytokine secretion and gene expression in murine CD4+ T-cells. Toxicology, 104, 187–202.
Ouyang, Y.L., Azcona Olivera, J.I., Murtha, J. & Pestka, J.J. (1996a) Vomitoxin-mediated IL-2, IL-4, and IL-5 superinduction in murine CD4+ T cells stimulated with phorbol ester calcium ionophore: Relation to kinetics of proliferation. Toxicol. Appl. Pharmacol., 138, 324–334.
Ouyang, Y.L., Li, S. & Pestka, J.J. (1996b) Effects of vomitoxin (deoxynivalenol) on transcription factor NF-kappa B/Rel binding activity in murine EL-4 thymoma and primary CD4+ T cells. Toxicol. Appl. Pharmacol., 140, 328–336.
Øvernes, G., Matre, T., Sivertsen, T., Larsen, H.J.S., Langseth, W., Reitan, L.J. & Jansen, J.H. (1997) Effects of diets with graded levels of naturally deoxynivalenol-contaminated oats on immune response in growing pigs. J. Vet. Med. A. Physiol. Pathol. Clin. Med., 44, 539–550.
Pacin, A. & Resnik, S. L. (2000) Mycotoxins in Argentina. Unpublished data.
Pacin, A., Resnik, S.L., Neira, M.S., Moltó, G. & Martínez, E. (1997) Natural occurrence of deoxynivalenol in wheat, wheat flour and bakery products in Argentina. Food Addit. Contam., 14, 327–331.
Parent-Massin, D. & Thouvenot, D. (1995) In vitro toxicity of trichothecenes on rat haematopoietic progenitors. Food Addit. Contam., 12, 41–49.
Parent-Massin, D., Fuselier, R. & Thouvenot, D. (1994) In vitro toxicity of trichothecenes on human haematopoietic progenitors. Food Addit. Contam., 11, 441–447.
Park, J.J. & Chu, F.S. (1996) Assessment of immunochemical methods for the analysis of trichothecene mycotoxins in naturally occurring moldy corn. J. AOAC Int., 79, 465–471.
Park, J.C., Zong, M.S. & Chang, I.-M. (1991) Survey of the presence of the fusarium mycotoxins nivalenol, deoxynivalenol and T-2 toxin in Korean cereals of the 1989 harvest. Food Addit. Contam., 8, 447–451.
Park, K.J., Park, A.R. & Lee, Y.W. (1992) Natural occurrence of Fusarium mycotoxins of the 1990 barley crop in Korea. Food Addit. Contam., 9, 639–645.
Parry, D.W., Jenkinson, P. & McLeod, L. (1995) Fusarium ear blight (scab) in small grain cereals: a review. Plant Pathol., 44, 207–238
Pascale, M., De Girolamo, A., Visconti, A. & Pancaldi, D. (2000a) [Occurrence of deoxynivalenol in cereal products in 1998 from some areas of northern Italy.] Inf. Fitopatol., 10, 68–73 (in Italian).
Pascale, M., De Girolamo, A., Visconti, A. & Pancaldi, D. (2000b) Instituto Tossine e Micotossine da Parassiti Vegetali. Consiglio Nazionele delle Ricerche, Bari. Unpublished data submitted by M. Solfrizzo.
Patel, S., Hazel, C.M., Winterton, A.G. & Mortby, E. (1996) Survey of ethnic foods for mycotoxins. Food Addit. Contam., 13, 833–841.
Patey, A.L. & Gilbert, J. (1989) Fate of Fusarium mycotoxins in cereals during food processing and methods for their detoxification. In: Chelkowski, J., ed., Fusarium: Mycotoxins, Taxonomy and Pathogenicity, Amsterdam: Elsevier, pp. 399–420.
Perkowski, J. (1999) Badania zawartosci toksyn fuzaryjnych w ziarnie zbóz. (Fusarium toxins) Rocs (COST 835). AR Pozn. Rozprawy Nauk., 295, 1–136 (in Polish).
Perkowski, J., Plattner, R.D., Golinski, P., Vesonder, R.F. & Chelkowski, J. (1990) Natural occurrence of deoxynivalenol, 3-acetyl deoxynivalenol, 15-acetyl deoxynivalenol, nivalenol, 4,7-dideoxynivalenol and zearalenone in Polish wheat. Mycotoxin Res., 6, 7–12.
Perkowski, J., Jelen, H., Kiecana, I. & Golinski, P. (1997) Natural contamination of spring barley with group A trichothecene mycotoxins in south-eastern Poland. Food Addit. Contam., 14, 321–325.
Pestka, J.J., Lin, W.S. & Forsell, J.H. (1986) Decreased feed consumption and body-weight gain in the B6C3F1 mouse after dietary exposure to 15-acetyldeoxynivalenol. Food Chem. Toxicol., 24, 1309–1313.
Pestka, J.J., Tai, J.H., Witt, M.F., Dixon, D.E. & Forsell, J.H. (1987a) Suppression of immune response in the B6C3F1 mouse after dietary exposure to the Fusarium mycotoxins deoxynivalenol (vomitoxin) and zearalenone. Food Chem. Toxicol., 25, 297–304.
Pestka, J.J., Lin, W.S. & Miller, E.R. (1987b) Emetic activity of the trichothecene 15-acetyldeoxynivalenol in swine. Food Chem. Toxicol., 25, 855–858.
Pestka, J.J., Moorman, M.A. & Warner, R.L. (1989) Dysregulation of IgA production and IgA nephropathy induced by the trichothecene vomitoxin. Food Chem. Toxicol., 27, 361–368.
Pestka, J.J., Dong, W., Warner, R.L., Rasooly, L. & Bondy, G.S. (1990a) Effect of dietary administration of the trichothecene vomitoxin (deoxynivalenol) on IgA and IgG secretion by Peyer’s patch and splenic lymphocytes. Food Chem. Toxicol., 28, 693–699.
Pestka, J.J., Dong, W., Warner, R.L., Rasooly, L., Bondy, G.S. & Brooks, K.H. (1990b) Elevated membrane IgA positive and CD4 positive (T helper) populations in murine Peyer’s patch and splenic lymphocytes during dietary administration of the trichothecene vomitoxin (deoxynivalenol). Food Chem. Toxicol., 28, 409–420.
Pestka, J.J., Yan, D. & King, L.E. (1994) Flow cytometric analysis of the effects of in vitro exposure to vomitoxin (deoxynivalenol) on apoptosis in murine T, B and IgA+ cells. Food Chem. Toxicol., 32, 1125–1136.
Pettersson, H. (1992) Trichothecene analysis in Swedish cereals 1987–1990. In: Taxonomy, Pathogenicity and Host Resistance, Radzikow: Plant Breeding and Acclimatization Institute, pp. 37–41.
Pettersson H. (1993) Trichothecene analysis in Swedish cereals 1987–1990. Hod. Rosl. Aklim Nasien, 37, 37–41.
Pettersson H. (1998) Intercomparison of trichothecene analysis and feasibility to produce certified calibrants and reference materials, European Commission, BCR information, Report EUR 18214 EN.
Pettersson, H. (2000) Department of Animal Nutrition and Management at the Agricultural University, Uppsala. Unpublished data submitted by H. Pettersson.
Pieters, M.N., Fiolet, D.C.M. & Baars, A.J. (1999) Deoxynivalenol: Derivation of concentration limits in wheat and wheat containing food products (RIVM Natural Toxins Project 388802 018). Bilthoven: National Institute of Public Health and the Environment, p. 32.
Piñeiro, M. (2000) Mycotoxins in Uruguay. Unpublished. report Laboratorio Tecnológico del Uruguay. Submitted by Maya Piñeiro.
Piñeiro M. & Silva G. (1997) Fusarium toxins in Uruguay: Head blight, toxin levels and grain quality. Cereal Res. Commun., 25, 805–806,
Piñeiro, M., Giribone, A.G. & Silva, G. (1994) [DON levels in cereal based foods and feeds in Uruguay.] In: Proceeding of I Latinoamerican Congress of Mycotoxicology, p.97 (in Spanish).
Piñeiro, M., Dawson, R. & Costarrica, M.L. (1996) Monitoring program for mycotoxin contamination in Uruguayan food and feeds Nat. Toxins, 4, 242–245.
Pitt, J.I. & Hocking, A.D. (1997) Fungi and Food Spoilage, Gaithersburg, Maryland: Aspen Publisher.
Plattner, R.D., Beremand, M.N. & Powell, R.G. (1989) Analysis of trichothecene mycotoxins by mass spectrometry and tandem mass spectrometry. Tetrahedron, 45, 2251–2262.
Pollmann, D.S., Koch, B.A., Seitz, L.M., Mohr, H.E. & Kennedy, G.A. (1985) Deoxynivalenol-contaminated wheat in swine diets. J. Anim. Sci., 60, 239–247.
Poole, C.F. (1978) In: Blau, K. & King, G., eds, Handbook of Derivatives for Chromatography, New York: Heyden & Sons, p. 152.
Prado, G., Oliveira, M., Ferreira, S., Corrêa, T. & Affonso, B. (1997) [Natural occurrence of deoxinivalenol and T-2 toxin in post harvest corn.] Cienc. Tecnol. Aliment., 17, 259–262 (in Spanish).
Prelusky, D.B. (1993) The effect of low-level deoxynivalenol on neurotransmitter levels measured in pig cerebral spinal fluid. J. Environ. Sci. Health B, 28, 731–761.
Prelusky, D.B. (1994) The effect of deoxynivalenol on serotoninergic neurotransmitter levels in pig blood. J. Environ. Sci. Health B, 29, 1203–1218.
Prelusky, D.B. (1996) A study on the effect of deoxynivalenol on serotonin receptor binding in pig brain membranes. J. Environ. Sci. Health B, 31, 1103–1117.
Prelusky, D.B. & Trenholm, H.L. (1991) Tissue distribution of deoxynivalenol in swine dosed intravenously. J. Agric. Food Chem., 39, 748–751.
Prelusky, D.B. & Trenholm, H.L. (1993) The efficacy of various classes of anti-emetics in preventing deoxynivalenol-induced vomiting in swine. Nat. Toxins, 1, 296–302.
Prelusky, D.B., Trenholm, H.L., Lawrence, G.A. & Scott, P.M. (1984) Nontransmission of deoxynivalenol (vomitoxin) to milk following oral administration to dairy cows. J. Environ. Sci. Health B, 19, 593–609.
Prelusky, D.B., Veira, D.M. & Trenholm, H.L. (1985) Plasma pharmacokinetics of the mycotoxin deoxynivalenol following oral and intravenous administration to sheep. J. Environ. Sci. Health B, 20, 603–624.
Prelusky, D.B., Hamilton, R.M.G., Trenholm, H.L. & Miller, J.D. (1986a) Tissue distribution and excretion of radioactivity following administration of carbon-14-labeled deoxynivalenol to white Leghorn hens. Fundam. Appl. Toxicol., 7, 635–645.
Prelusky, D.B., Veira, D.M., Trenholm, H.L. & Hartin, K.E. (1986b) Excretion profiles of the mycotoxin deoxynivalenol following oral and intravenous administration to sheep. Fundam. Appl. Toxicol., 6, 356–363.
Prelusky, D.B., Trenholm, H.L., Hamilton, R.M.G. & Miller, J.D. (1987a) Transmission of carbon-14 deoxynivalenol to eggs following oral administration to laying hens. J. Agric. Food Chem., 35, 182–186.
Prelusky, D.B., Veira, D.M., Trenholm, H.L. & Foster, B.C. (1987b) Metabolic fate and elimination in milk, urine and bile of deoxynivalenol following administration to lactating sheep. J. Environ. Sci. Health B, 22, 125–148.
Prelusky, D.B., Hartin, K.E., Trenholm, H.L. & Miller, J.D. (1988) Pharmacokinetic fate of carbon-14-labeled deoxynivalenol in swine. Fundam. Appl. Toxicol., 10, 276–286.
Prelusky, D.B., Hamilton, R.M.G. & Trenholm, H.L. (1989) Transmission of residues to eggs following long-term administration of carbon-14 labelled deoxynivalenol to laying hens. Poultry Sci., 68, 744–748.
Prelusky, D.B., Yeung, J.M., Thompson, B.K. & Trenholm, H.L. (1992) Effect of deoxynivalenol on neurotransmitters in discrete regions of swine brain. Arch. Environ. Contam. Toxicol., 22, 36–40.
Prelusky, D.B., Gerdes, R.G., Underhill, K.L., Rotter, B.A., Jui, P.Y. & Trenholm, H.L. (1994) Effects of low-level dietary deoxynivalenol on haematological and clinical parameters of the pig. Nat. Toxins, 2, 97–104.
Prelusky, D.B., Rotter, B.A., Thompson, B.K. & Trenholm, H.L. (1997) Effect of the appetite stimulant cyproheptadine on deoxynivalenol-induced reductions in feed consumption and weight gain in the mouse. J. Environ. Sci. Health B, 32, 429–448.
Quiroga, N., Resnik, S. L., Pacin, A., Martínez, E., Pagano, A., Riccobene, I. & Neira, S. (1995) Natural occurrence of trichothecenes and zearalenone in Argentinean wheat. Food Control, 6, 201–204.
Rajakylä, E., Laasasenaho, K. & Sakkers, P.J.D. (1987) Determination of mycotoxins in grain by high-performance liquid chromatography and thermospray liquid chromatography–mass spectrometry. J. Chromatogr., 384, 391–402.
Rasooly, L. & Pestka, J.J. (1992) Vomitoxin-induced dysregulation of serum-IgA, serum-IgM, and serum-IgG reactive with gut bacterial and self antigens. Food Chem. Toxicol., 30, 499–504.
Rasooly, L. & Pestka, J.J. (1994) Polyclonal autoreactive IgA increase and mesangial deposition during vomitoxin-induced IgA nephropathy in the BALB/c mouse. Food Chem. Toxicol., 32, 329–336.
Rasooly, L., Abouzied, M.M., Brooks, K.H. & Pestka, J.J. (1994) Polyspecific and autoreactive IgA secreted by hybridomas derived from Peyer’s patches of vomitoxin-fed mice: Characterization and possible pathogenic role in IgA nephropathy. Food Chem. Toxicol., 32, 337–348.
Rava, E. (1996) Mycotoxins in maize products of the 1994–1995 marketing season. Mycotoxin Res., 12, 25–30.
Rava, E., Viljoen, J.H., Kailmeyer, H. & de Jager, A. (1996) Fungi and mycotoxins in South African maize of the 1993 crop. Mycotoxin Res., 12, 15–24.
Razzazi-Fazeli, E., Böhm, J. & Luf, W. (1999) Determination of nivalenol and deoxynivalenol in wheat using liquid chromatography–mass spectrometry with negative ion atmospheric pressure chemical ionisation. J. Chromatogr. A, 854, 45–55.
Resnik, S.L. & Pacin, A. (2000) Sampling plans for mycotoxins. Unpublished data.
Resnik, S.L., Martinez, J.E. & Pacin, A. (2000) Storage influence on corn aflatoxins, zearalenone and deoxynivalenol contamination, in Argentina. Unpublished data.
Reutter, M. (1999) Zearalenone and deoxynivalenol in cereals and feed stuffs of Schleswig-Holstein: Investigation of the harvest 1998. In: Proceedings of the 21st Mycotoxin Workshop, 7–9 June 1999, Jena, Germany. Jena: Gesellschaft für Mykotoxinforschung e.V., Bundesinstitut für gesundheitlichen Verbraucherschutz und Veterinärmedizin.
Ridascreen® DON (2000) [Enzyme immunoassay for the quantitative determination of deoxynivalenol] (Art.No. 2901), R-Biopharm GmbH, Darmstadt, Germany (in German).
Rio, B., Lautraite, S. & Parent-Massin, D. (1997) In vitro toxicity of trichoethecenes on human erythroblastic progenitors. Human Exp. Toxicol., 16, 673–679.
Rizzo, A.F., Atroshi, F., Hirvi, T. & Saloniemi, H. (1992) The hemolytic activity of deoxynivalenol and T-2 toxin. Nat.Toxins, 1, 106–110.
Robb, J., Kirkpatrick, K.S. & Norval, M. (1982) Association of toxin-producing fungi with disease in broilers. Vet. Rec., 111, 389–390.
Robbana-Barnat, S., Loridon-Rosa, B., Cohen, H., Lafarge-Frayssinet, C., Neish, G.A. & Frayssinet, C. (1987) Protein synthesis inhibition and cardiac lesions associated with deoxynivalenol ingestion in mice. Food Addit. Contam., 4, 49–56.
Robbana-Barnat, S., Lafarge-Frayssinet, C., Cohen, H., Neish, G.A. & Frayssinet, C. (1988) Immunosuppressive properties of deoxynivalenol. Toxicology, 48, 155–166.
Rogers, C.G. & Heroux-Metcalf, C. (1983) Cytotoxicity and absence of mutagenic activity of vomitoxin (4-deoxynivalenol) in a hepatocyte-mediated mutation assay with V79 Chinese hamster lung cells. Cancer Lett., 20, 29–35.
Romer, T.R. (1986) Use of small charcoal/alumina cleanup columns in determination of trichothecene mycotoxins in foods and feeds. J. Assoc. Off. Anal. Chem., 69, 699–703.
Romer Labs Inc. (1995) Quantitative method for DON, AFT B1 and Zearalenona. Method My 840, version 94.2.
Romer Labs Inc. (1999) AccuToxTM DON Quantitative Method, Ver. 99.1: 1–4
Rosen, R.T. & Rosen, J.D. (1983) Quanitification and confirmation of four fusarium mycotoxins in corn by gas chromatography–mass spectrometry–selected ion monitoring. J. Chromatogr., 283, 223–230.
Rotter, B.A., Rotter, R.G., Thompson, B.K. & Trenholm, H.L. (1992) Investigations in the use of mice exposed to mycotoxins as a model for growing pigs. J. Toxicol. Environ. Health, 37, 329–339.
Rotter, B.A., Thompson, B.K. & Rotter, R.G. (1994a) Optimization of the mouse bioassay for deoxynivalenol as an alternative to large animal studies. Bull. Environ. Contam. Toxicol., 53, 642–647.
Rotter, B.A., Thompson, B.K., Lessard, M., Trenholm, H.L. & Tryphonas, H. (1994b) Influence of low-level exposure to fusarium mycotoxins on selected immunological and hematological parameters in young swine. Fundam. Appl. Toxicol., 23, 117–124.
Rotter, B.A., Thompson, B.K. & Lessard, M. (1995) Effects of deoxynivalenol-contaminated diet on performance and blood parameters in growing swine. Can. J. Anim. Sci., 75, 297–302.
Rotter, B.A., Prelusky, D.B. & Pestka, J.J. (1996) Toxicology of deoxynivalenol (vomitoxin). J. Toxicol. Environ. Health, 48, 1–34.
Ryu, J.C., Yang, J.S., Song, Y.S., Kwon, O.S., Park, J. & Chang, I.M. (1996) Survey of natural occurrence of trichothecene mycotoxins and zearalenone in Korean cereals harvested in 1992 using gas chromatography/mass spectrometry. Food Addit. Contam., 13, 333–341.
Samar, M.M., Neira, M.S., Resnik, S.L. & Pacin, A. (2000) Effect of fermentation on naturally occurring deoxynivalenol (DON) in the Argentinean bread processing technology. Unpublished data.
Sano, A., Satoshi, M., Masao, S. & Shoji, T. (1987) High-performance liquid chromatographic method for determining trichothecene mycotoxins by post-column fluorescence derivatization. J. Chromatogr., 410, 427–436.
Sato, N. & Ueno, Y. (1977) Comparative toxicities of trichothecenes. In: Rodricks, J.V., Hesseltine, C.W. & Mehlman, M.A., eds, Mycotoxins in Animal and Human Health, Park Forest South, Illinois: Pathotox.
Saubois, A., Nepote, M.C. & Basilico, J.C. (1992) Incidence of Fusarium toxins in corn and milling byproducts. Arch. Latinoam. Nutr., 42, 168–172.
Schneider, L., Pichler, H. & Krska, R. (2000) An enzyme linked immunoassay for the determination of deoxynivalenol in wheat based on chicken egg yolk antibodies. Fresenius J. Anal. Chem., 367, 98–100.
Schollenberger, M., Lauber, U., Terry Jara, H., Suchy, S., Drochner, W. & Müller, H.-M. (1998) Determination of eight trichothecenes by gas chromatography–mass spectrometry after sample clean-up by two-stage solide phase extraction. J. Chromatogr. A, 815, 123–132.
Schollenberger, M., Suchy, S., Jara, H.T., Drochner, W. & Muller, H.M. (1999) A survey of Fusarium toxins in cereal-based foods marketed in an area of southwest Germany. Mycopathologia, 147, 49–57.
Schollenberger, M., Jara, H.T., Suchy, S., Drochner, W. & Muller, H.M., (2000a) Occurrence of Fusarium toxins in wheat for food use harvested 1998 in southwest Germany. Institute of Animal Nutrition, Hohenheim, Stuttgart, Germany. Unpublished data.
Schollenberger, M., Jara, H.T., Suchy, S., Drochner, W. & Muller, H.M. (2000b) Fusarium toxins in wheat flour collected in an area of southwest Germany. Institute of Animal Nutrition, Hohenheim, Stuttgart, Germany. Unpublished data.
Schollenberger, M., Suchy, S., Jara, H.T., Rüfle, M., Drochner, W. & Muller, H.M. (2000c) Further survey of Fusarium toxins in cereal-based foods marketed in an area of southwest Germany. Institute of Animal Nutrition, Hohenheim, Stuttgart, Germany. Unpublished data.
Schuhmacher, R., Apfalter, S., Krska, R. & Grasserbauer, M. (1996) Quality assurance for the analysis of the mycotoxins deoxynivalenol in cereals. In: Proceedings der österr. Lebensmittelchemikertage 1996.
Schwadorf, K. & Müller, H. M. (1991) Determination of trichothecenes in cereals by gas chromatography with ion trap detection. J. Chromatogr., 32, 137–142.
Scott, P. (1991) Possibilities of reduction or elimination of mycotoxins present in cereal grain. In: Chelkowski, J., ed., Cereal Grain: Mycotoxins, Fungi and Quality in Drying and Storage, Amsterdam: Elsevier, pp. 529–572.
Scott, P.M. (1993) Gas chromatography of mycotoxins. In Betina, V., ed., Chromatography of Mycotoxins—Techniques and Applications, Amsterdam: Elsevier, pp. 373–425.
Scott, P.M. (1995) Mycotoxin methodology. Food Addit. Contam., 12, 395–403.
Scott, P.M. (1997) Multi-year monitoring of Canadian grains and grain-based foods for trichothecenes and zearalenone. Food Addit. Contam., 14, 333–339.
Scott, P.M. & Trucksess, M.W. (1997) Application of immunoaffinity columns to mycotxin analysis. J. AOAC Int., 80, 941–949.
Scott, P.M., Lawrence, J.W. & van Walbeek, W. (1970) Detection of mycotoxins by thin-layer chromatography application to screening of fungal extracts. Appl. Microbiol., 20, 839–842.
Scott, P.M., Lau, P.Y. & Kanhere, S.R. (1981) Gas chromatography with electron capture and mass spectrometric detection of deoxynivalenol in wheat and others grains. J. Assoc. Off. Anal. Chem., 64, 1364–1371
Scott, P.M., Kanhere, S.R. & Tarter, E.J. (1986) Determination of nivalenol and deoxynivalenol in cereals by electron–capture gas chromatography. J. Assoc. Off. Anal. Chem., 69, 889–893.
Scott, P.M., Lombaert, G.A., Pellaers, P., Bacler, S., Kanhere, S.R., Sun, W.F., Lau, P.-Y. & Weber, D. (1989) Application of capillary gas chromatography to a survey of wheat for five trichothecenes. Food Addit. Contam., 6, 489–500.
Scott, P.M., Kanhere, S.R., Daley, E. F. & Faber, J.M. (1992) Fermentation of wort containing deoxynivalenol and zearalenone. Mycotoxin Res., 8, 58–65.
Scott, P.M., Kanhere, R.S. & Weber, D. (1993) Analysis of Canadian and imported beers for Fusarium mycotoxins by gas chromatography–mass spectometry. Food Addit. Contam., 10, 381–389.
Scudamore, K.A., Nawaz, S. & Hetmanski, M.T. (1998) Mycotoxins in ingredients of animal feeding stuffs: II. Determination of mycotoxins in maize and maize products. Food Addit. Contam., 15, 30–55.
Seidel, V., Lang, B., Fraissler, S., Lang, C., Schiller, K., Filek, G. & Lindner W. (1993) Analysis of trace levels of trichothecene mycotoxins in Austrian cereals by gas chromatography with electron capture detection. Chromatographia, 37, 191–200.
Shepherd, M.J. & Gilbert, J. (1988) Long-term storage stability of deoxynivalenol standard reference solutions. J. Agric. Food Chem., 36, 305–308.
Sheu, C.W., Moreland, F.M., Lee, J.K. & Dunkel, V.C. (1988) Morphological transformation of BALB/3T3 mouse embryo cells in vitro by vomitoxin. Food Chem. Toxicol., 26, 243–245.
Shim, W.B., Kim, J.C., Seo, J.A. & Lee, Y.W. (1997) Natural occurrence of trichothecenes and zearalenone in Korean and imported beers. Food Addit. Contam., 14, 1–5.
Shima, J., Takase, S., Takahasi, Y., Iwai, Y., Fujimoto, H., Yamazaki, M. & Ochi, K. (1997) Novel detoxification of the trichothecene mycotoxin deoxynivalenol by a soil bacterium isolated by enrichment culture. Appl. Environ. Microbiol., 63, 3825–3830.
Shinozuka, J., Guanmin, L., Uetsuka, K., Nakayama, H. & Doi, K. (1997) Process of the development of T-2 toxin-induced apoptosis in the lymphoid organs of mice. Exp. Anim., 46, 117–126.
Shinozuka, J., Suzuki, M., Noguchi, N., Sugimoto, T., Uetsuka, K., Nakayama, H. & Doi, K. (1998) T-2 toxin-induced apoptosis in hematopoietic tissues of mice. Toxicol. Pathol., 26, 674–681.
Sinha, R.C., Savard, M.E. & Laum, R. (1995) Production of monoclonal antibodies for the specific detection of deoxynivalenol and 15-acetyldeoxynivalenol by ELISA. J. Agric. Food Chem., 43, 1740–1744.
Snijders, C.H.A. & Perkowski, J. (1990) Effects of head blight caused by Fusarium culmorum on toxin content and weight of kernels. Phytopathology,80, 566–570.
Soares, L.M. & Furlani, R. (1996) Survey of mycotoxins in wheat and wheat products sold in health food stores of the City of Campinas, State of Sao Paulo. Rev. Microbiol., 27, 41–45.
Sohn, H.B., Seo, J.A. & Lee, Y.W. (1999) Co-occurrence of Fusarium mycotoxins in mouldy and healthy corn from Korea. Food Addit. Contam., 16, 153–158.
Solovey, M.M.S, Somoza, C., Cano, G., Pacin, A. & Resnik, S. (1999) A survey of fumonisins, deoxynivalenol, zearalenone and aflatoxins in corn-based food products in Argentina. Food Addit. Contam., 16, 325–329.
de Souza J.C., Resnik, S.L., Pacin, A.M., González, H.H.L., Boca, R.T., Burak, R. & Broccoli, A.M. (2000) Contaminant mycoflora and natural mycotoxins co-occurrence in field trial popcorn in Argentina. In: X International IUPAC Symposium on Mycotoxins and Phycotoxins, 21–25 May 2000, Guarujá–Sao Paulo.
Spanjer, M.C. (2000) Deoxynivalenol in grains and grain products. Dutch Inspectorate for Health Protection, Amsterdam. Unpublished data submitted by H.P. van Egmond.
Sprando, R.L., Pestka, J., Collins, T.F.X., Rorie, J., O’Donnell, M., Hinton, D. & Chirtel, S. (1999) The effect of vomitoxin (deoxnivalenol) on testicular morphology, testicular spermatid counts and epididymal sperm counts in Il-6ko [B6129-Il6 (Tmlkopf) (Il-6 gene deficient)] and Wt [B6129f2 (wild type to B6129-Il6 with an intact Il-6 gene)] mice. Food Chem. Toxicol., 37, 1073–1079.
Stenwig, H., Langseth, W. & Sandli, D. (1992) The occurrence of thrichothecenes and moulds in barley and oats sampled in Norway. In: Radzików, 22.–24 September 1992, IHAR, Third European Fusarium Seminar, pp. 42–50.
Statistical Analysis System Institute, Inc. (1997) SAS Program 6.12, Cary, North Carolina.
Steyn, P.S., Thiel, P.G. & Trinder, D.W. (1991) In: Smith, J.E. & Henderson, R.S., eds, Mycotoxins and Animal Foods, Boca Raton, Florida: CRC Press Inc., pp. 165–221.
Stoloff, L. (1997) In: Mycotoxicology Newsletter, No. 8.
Sugita-Konishi,.Y., Hara, K.Y., Kasuga, F. & Kumagai, S. (1998) The effects of trichothecenes on host defense against infectious diseases. Maikotokishin (Tokyo), 47, 19–23.
Swanson, St.P., Dahlem, A.M., Rood, H.D., Côte, L.-M., Buck, W.B. & Yoshizawa, T. (1986) Gas chromatographic analysis of milk for deoxynivalenol and its metabolite dom-1. J. Assoc. Off. Anal. Chem., 69, 41–43.
Sylvia, V.L., Phillips, T.D., Clemint, B.A., Green, J.L., Kubena, L.F. & Heidelbaugh, N.D. (1986) Effect of vesicular arbuscular mycorrhizal fungi and phosphorus on the survival and growth of flowering dogwood (cornus-Florida) J. Chromatogr., 362, 79–85.
Tacke, B.K. & Casper, H.H. (1996) Determination of deoxynivalenol in wheat, barley and malt by column cleanup and gas chromatography with electron capture detection. J. AOAC Int., 79, 472–475.
Tanaka, T., Hasegawa, A., Matsuki, Y., Ishii, K. & Ueno Y. (1985) Improved methodology for the simultaneous detection of the trichothecene mycotoxins deoxynivalenol and nivalenol in cereals. Food Addit. Contam., 2, 125–137.
Tanaka, T., Akihiko, H., Matsuki, Y., Lee, U.S. & Ueno, Y. (1986) A limited survey of fusarium mycotoxins nivalenol, deoxynivalenol and zearalenone in 1984 UK harvested wheat and barley. Food Addit. Contam., 3, 247–252.
Tanaka, T., Yamamoto, S., Akihiko, H., Aoki, N., Besling, J.R., Yoshitsugu, S. & Ueno, Y. (1990) A survey of the natural occurrence of Fusarium mycotoxins, deoxynivalenol, nivalenol and zearalenone, in cereals harvested in the Netherlands. Mycopathologia, 110, 19–22.
Thimm, N., Wei, G., Ottner, F., Schwaighofer, B. & Binder, E.M. (2000) Adsorption of mycotoxins—Characterisation of the specifity of different clays. In: X International IUPAC Symposium on Mycotoxins and Phytotoxins, Guarujá, 21–25 May.
Thompson, W.L. & Wannemacher, R.W., Jr (1986) Structure–function relationships of 12,13-epoxytrichothecene mycotoxins in cell culture: Comparison to whole animal lethality. Toxicon, 24, 985–994.
Thuvander, A., Wikman, C. & Gadhasson, I. (1999) In vitro exposure of human lymphocytes to trichothecenes: Individual variation in sensitivity and effects of combined exposure on lymphocyte function. Food Chem. Toxicol., 37, 639–648.
Thuvander, A., Möller, T., Enghardt Barbieri, H., Janson, A., Salomonsson ,A.C. & Olsen, M. (2000a) Dietary intake of some important mycotoxins by the Swedish population. Food Addit. Contam. (in press).
Thuvander, A., Möller, T., Enghardt Barbieri, H., Janson, A., Salomonsson, A.C. & Olsen, M. (2000b) Swedish National Food Administration, Uppsala. Unpublished data submitted by M. Olsen.
Trenholm, H.L., Hamilton, R.M., Friend, D.W., Thompson, B.K. & Hartin, K.E. (1984) Feeding trials with vomitoxin (deoxynivalenol)-contaminated wheat: Effects on swine, poultry, and dairy cattle. J. Am. Vet. Med. Assoc., 185, 527–531.
Trenholm, H.L., Warner, R.M. & Prelusky, D.B. (1985) Assessment of extraction procedures in the analysis of naturally contaminated grain products deoxynivalenol (vomitoxin). J. Assoc. Off. Anal. Chem., 68, 645–649.
Trigo-Stockli, D., Curran, S. & Pedersen, J. (1995) Distribution and occurrence of mycotoxins in 1993 Kansas wheat. Cereal Chem., 72, 470–474.
Trigo-Stockli, D., Sanchez-Mariñez, R., Cortez-Rocha, M. & Pedersen, J. (1998) Comparison of the distribution and occurrence of Fusarium graminearum and deoxynivalenol in hard red winter wheat for 1993–1996. Cereal Chem., 75, 841–846.
Trigo-Stockli, D.M., Obaldo, L.G., Dominy, W.G. & Behnke, K.C. (2000) Utilization of deoxynivalenol-contaminated hard red winter wheat for shrimp feeds. J. World Aquaculture Soc., 31, 247–254.
Trucksess, M.W. (1995) Mycotoxins. J. AOAC Int., 78, 135–141.
Trucksess, M.W., Nesheim, S. & Eppley, R.M. (1984) Thin layer chromatographic determination of deoxynivalenol in wheat and corn. J. Assoc. Off. Anal. Chem., 67, 40–43.
Trucksess, M., Flood, M., Mossoba, M. & Page, S. (1987) High performance thin layer chromatographic determination of deoxynivalenol, fusarenone-X and nivalenol in barley, corn and wheat. J. Agric. Food Chem., 35, 445–448.
Trucksess, M.W., Thomas, F., Young, K., Stack, M.E., Fulgueras, W.J. & Page, S.W. (1995) Survey of deoxynivalenol in US 1993 wheat and barley crops by enzyme-linked immunosorbent assay (ELISA). J. AOAC Int., 78, 631–636.
Trucksess, M.W., Ready, D.W., Pender, M.K., Ligmond, C.A., Wood, G.E. & Page, S.W. (1996) Determination and survey of deoxynivalenol in white flour, whole wheat flour, and bran. J. AOAC Int., 79, 883–887.
Tryphonas, H., O’Grady, L., Arnold, D.L., McGuire, P.F., Karpinski, K. & Vesonder, R.F. (1984) Effect of deoxynivalenol (vomitoxin) on the humoral immunity of mice. Toxicol. Lett., 23, 17–24.
Tryphonas, H., Iverson, F., So, Y., Nera, E.A., McGuire, P.F., O’Grady, L., Clayson, D.B. & Scott, P.M. (1986) Effects of deoxynivalenol (vomitoxin) on the humoral and cellular immunity of mice. Toxicol. Lett., 30, 137–150.
Tseng, H.H. (1998) Cytotoxicity of food mycotoxins, natural food additives and natural aromas in primary cultured rat hepatocytes. Shipin Kexue (Taipei), 25, 799–812.
Tseng, T.C., Tu, J.C. & Soo, L.C. (1995) Natural occurrence of mycotoxins in Fusarium infected beans. Microbios, 84, 21–28.
Tutelyan, V. A. (1998) Occurrence of Fusarium mycotoxins in cereals in Russia. In: Miraglia, M., van Egmond, H., Brera, C. & Gilbert, J., eds, Mycotoxins and Phycotoxins—Developments in Chemistry, Toxicology and Food Safety, Denver, Colorado: Alaken Publishers, pp. 99–104.
Tutelyan, V., Eller, K., Sobolev, V., Pimentova, V., Zakharova, L. & Muzychenko, N. (1990) A survey of the occurrence of deoxynivalenol in wheat from 1986–1988 harvest in the USSR. Food Addit. Contam., 7, 521–525.
Tutel’ian, V.A., Krinitskaia, N.A., Avreneva, L.I., Kuzmina, E.E., Levitskaia, A.B. & Kravchenko, L.V. (1991) [Embryotoxic effects of deoxynivalenol mycotoxin (vomitoxin) in rats]. Gig. Sanit., 10, 49–51 (in Russian).
Ueno, Y., Sato, N., Ishii, K., Sakai, K., Tsunoda, H. & Enomoto, M. (1973) Biological and chemical detection of trichothene mycotoxins of Fusarium species. Appl. Microbiol., 25, 699–704.
UNEP/FAO/WHO (1988) Manual of Food Quality Control. Introduction to Food Sampling (Food and Nutrition Paper 14/9), Geneva.
US Department of Agriculture (1996) Continuing Survey of Food Intakes by Individuals, 1998–1991 (CD-ROM PB96-501747INC.) Springfield, Virginia: National Technical Information Service.
Usleber, E., Renz, V., Märtlbauer, E. & Terplan, G. (1992) Studies on the application of enzyme immunoassays for the fusarium mycotxins deoxynivalnol, 3-acetyldeoxynivalenol, and zearalenone. J. Vet. Med. B, 39, 617–627.
Van Egmond, H. (2000) CEN Doc Nr CEN/TC275/WG5 N239.
Vega, H.M., Saelzer, F.R., Herlitz, B.E., Rios, G.G., Bastias, T.C., Olavarria, M.J., Madariaga, B.R. & Rebufel, A.P. (1998) [Mycotoxins from Fusarium spp. In corn grown in Chile. 1995–1996 harvest.] Alimentos, 23, 43–58 (in Spanish).
Veldman, A., Borggreve, G.G., Mulers, E.J. & Van de Lagemaat, D. (1992) Occurrence of the mycotoxins ochratoxin A, zearalenone and deoxynivalenol in feed components. Food Addit. Contam., 9, 647–655.
Veratox test, Neogene Corporation, 1998, USA/Canada
Vesonder, R.F. & Hesseltine, C.W. (1980) Vomitoxin: Natural occurrence on cereal grains and significance as a refusal and emetic factor to swine. J. Process Biochem., 16, 12–15.
Vesonder, R.F., Ciegler, A. & Jensen, A.H. (1973) Isolation of the emetic principle from Fusarium-infected corn. Appl. Microbiol., 26, 1008–1010.
Vesonder, R.F., Ciegler, A. & Jensen, A.H. (1977) Presence of refusal factors in toxic Fusarium strains. Proc. Am. Phytopathol. Soc., 4, 126.
Vesonder, R.F., Ciegler, A., Burmeister, H.R. & Jensen, A.H. (1979) Acceptance by swine and rats of corn amended with trichothecenes. Appl. Environ. Microbiol., 38, 344–346.
Vicam (1996) HPLC Protocol Manual Vicam, Doc. GN-MC 9505-0 DONtest, Massachusetts, pp.1–8.
Vrabcheva, T., Gessler, R., Usleber, E. & Martlbauer, E. (1996) First survey on the natural occurrence of Fusarium mycotoxins in Bulgarian wheat. Mycopathologia, 136, 47–52.
Wang, D.S., Liang, Y.X., Nguyen, T.C., Le, D.D., Tanaka, T. & Ueno, Y. (1995) Natural co-occurrence of Fusarium toxins and aflatoxin B1 in corn for feed in north Vietnam. Nat. Toxins, 3, 445–449.
Wang, D.S., Liang, Y.X., Iijima, K., Sugiura, Y., Tanaka, T., Chen, G., Yu, S.Z. & Ueno, Y. (1995) Co-contamination of mycotoxins in corn harvested in Haimen, a high risk area of primary liver cancer in China. Mycotoxins, 67–70.
Warner, R.L., Brooks, K. & Pestka, J.J. (1994) In vitro effects of vomitoxin (deoxynivalenol) on T-cell interleukin production and IgA secretion. Food Chem. Toxicol., 32, 617–625.
Wehner, F.C., Marasas, W.F.O. & Thiel, P.G. (1978) Lack of mutagenicity to Salmonella typhimurium of some Fusarium mycotoxins. Appl. Environ. Microbiol., 35, 659–662.
Weingaertner, J., Krska, R., Praznik, W., Grasserbauer, M. & Lew, H. (1997) Use of Mycosep multifunctional clean-up columns for the determination of trichothecenes in wheat by electron-capture gas chromatography. Fresenius J. Anal. Chem., 357, 1206–1210.
Wetter, M.T., Trucksess, M.W., Roach, J.A. & Bean, G.A. (1999) Ocurrence and distribution of Fusarium graminearum and deoxynivalenol in sweet corn ears. Food Addit. Contam., 16, 119–124.
Whitaker, T.B., Hagler, W.M., Jr, Giesbrecht, F.G. & Johansson, A.J. (2000) Sampling, sample preparation, and analytical variability associated with testing wheat for deoxynivalenol. J. AOAC Int., 83, 1285–1292.
WHO (1985) Guidelines for the Study of Dietary Intakes of Chemical Contaminants (WHO Offset Publication No. 87), Geneva.
WHO (1990) Selected Mycotoxins: Ochratoxin, Trichothecenes, Ergot (Environmental Health Criteria 105), Geneva, pp. 90–101.
WHO (1998) GEMS/Food Regional Diets. Regional Per Capita Consumption of Raw and Semi-processed Agricultural Commodities (WHO/FSF/FOS/98.3), Geneva.
WHO (2000) Report on the Joint FAO/WHO Workshop on Methodology for Exposure Assessment of Contaminants and Toxins, 7–8 June 2000, Geneva.
Wilcke, W.F., Ng, H.F., Meronuck, R.A., Morey, R.V., Gupta, P. & Lang, J.P. (1999) Storablity of wheat infected with Fusarium head blight Trans. ASEA, 42, 733–742.
Wild, C.P. & Hall, A.J.(1996) Epidemiology of mycotoxin-related disease. In: Howard, P. & Miller, D., eds, The Mycota. VI. Human and Animal Relationships, Berlin: Springer.
Wolf-Hall, C.E., Milford, A.H. & Bullerman, L.B. (1999) Stability of deoxynivalenol in heat-treated foods. J. Food Prot., 62, 962–964.
Wong, S.S. (2000) Mechanisms for vomitoxin-induced cytokine superinduction in macrophages. Thesis, Michigan State University.
Wong, S.S., Zhou, H.R., Marin Martinez, M.L., Brooks, K. & Pestka, J.J. (1998) Modulation of IL-1beta, IL-6 and TNF-alpha secretion and mRNA expression by the trichothecene vomitoxin in the RAW 264.7 murine macrophage cell line. Food Chem. Toxicol., 36, 409–419.
Worrell, N.R., Mallett, A.K., Cook, W.M., Baldwin, N.C.P. & Shepherd, M.J. (1989) The role of gut microorganisms in the metabolism of deoxynivalenol administered to rats. Xenobiotica, 19, 25–32.
Xu, Y.C., Zhang, G.S. & Chu, F.S. (1988) Enzyme-linked immunosorbent assay for deoxynivalenol in corn and wheat. J. Assoc. Off. Anal. Chem., 71, 946–949.
Yamashita, A., Yoshizawa, T., Aiura, Y., Sanchez, P., Dizon, E., Arim, R. & Sardjono (1995) Fusarium mycotoxins (fumonisins, nivalenol and zearalenone) and aflatoxins in corn from southeast Asia. Biosci. Biotech. Biochem., 59, 1804–1807.
Yan, D., Zhou, H.R., Brooks, K.H. & Pestka, J.J. (1997) Potential role for IL-5 and IL-6 in enhanced IgA secretion by Peyer’s patch cells isolated from mice acutely exposed to vomitoxin. Toxicology, 122, 145–158.
Yan, D., Zhou, H.R., Brooks, K.H. & Pestka, J.J. (1998) Role of macrophages in elevated IgA and IL-6 production by Peyer’s patch cultures following acute oral vomitoxin exposure. Toxicol. Appl. Pharmacol., 148, 261–273.
Yang, C.H. & Luo, X.Y. (2000) Method for determination of T-2 toxin in wheat with indirect enzyme-linked immunosorbent assay (ELISA). Unpublished data via e-mail.
Yoshizawa, T. (1997) Geographic difference in trichothecene occurrence in Japanese wheat and barley. Bull. Inst. Compr. Agr. Sci. Kinki Univ., 5, 25–30.
Yoshizawa, T. (2000) Mycotoxins in Japan. Department of Bioresource Science, Faculty of Agriculture, Kagawa University, Japan. Unpublished data.
Yoshizawa, T. & Gao, H.-P. (1999) Risk assessment of mycotoxins in staple foods from the high-risk area for human esophageal cancer in China. In: Proceedings of International Symposium of Mycotoxicology ’99. Mycotoxin Contamination: Health Risk and Prevention Project, 9–10 September 1999, Tokyo: Japanese Association of Mycotoxicology, pp. 55–62.
Yoshizawa, T. & Jin, Y.-Z. (1995) Natural occurrence of acetylated derivatives of deoxynivalenol and nivalenol in wheat and barley in Japan. Food Addit. Contam., 12, 689–694.
Yoshizawa, T. & Morooka, N. (1973) Deoxynivalenol and its monoacetate: New mycotoxins from Fusarium. Agric. Biol. Chem., 37, 2933–2934.
Yoshizawa, T. & Morooka, N. (1974) Studies on the toxic substances in infected cereals; acute toxicities of new trichothecene mycotoxins: deoxynivalenol and its monoacetate. J. Food Hyg. Soc. Jpn, 15, 261–269.
Yoshizawa, T., Hiroaki, T. & Ohi, T. (1983) Structure of a novel metabolite from deoxynivalenol, a trichothecene mycotoxin, in animals. Agric. Biol. Chem., 47, 2133–2135.
Yoshizawa, T., Cote, L.-M., Swanson, S.P. & Buck W.B. (1986) Confirmation of DOM-1, a deepoxidation metabolite of deoxynivalenol, in biological fluids of lactating cows. Agric. Biol. Chem., 50, 227–229.
Young, C.J. & Games, D.E. (1993) Analysis of Fusarium mycotoxins by supercritical fluid chromatography with UV or mass spectrometric detection. J. Chromatogr. A, 653, 374–379.
Young, L.G., McGirr, L., Valli, V.E., Lumsden, J.H. & Lun, A. (1983) Vomitoxin in corn fed to young pigs. J. Anim. Sci., 57, 655–664.
Young, J.C., Subryan, L.M., Potts, D., MacLare, M.E. & Gobran, F.H. (1986) Reduction in levels of deoxynivalenol in contaminated wheat by chemical and physical treatment. J. Agric. Food Chem., 34, 461–465.
Yuwai, K.E., Rao KS, Singh K, Tanaka T & Ueno Y. (1994) Occurrence of nivalenol, deoxynivalenol, and zearalenone in imported cereals in Papua, New Guinea. Nat. Toxins, 2, 19–21.
Zabe, N., Duncan, K., Kruger, S., Cahill, L., McAlice, B. & Kohn, B. (2000) Mycotoxin detection in foods using immunoaffinity columns coupled with liquid chromatography. In: Proceedings of the X International IUPAC Symposium on Mycotoxins and Phytotoxins, 21–25 May 2000, São Paulo.
Zhang, X.H., Xie, T.X., Li, S.S., Wang, J.L., Yan, X., Wang, Z.Y., Wang, F.R. & Fu, C.G. (1998) Contamination of fungi and mycotoxins in foodstuffs in high risk area of esophageal cancer. Biomed. Environ. Sci., 11, 140–146.
Zhou, H.R., Yan, D. & Pestka, J.J. (1997) Differential cytokine mRNA expression in mice after oral exposure to the trichothecene vomitoxin (deoxynivalenol): dose response and time course. Toxicol. Appl. Pharmacol., 144, 294–305.
Zhou, H.R., Yan, D. & Pestka, J.J. (1998) Induction of cytokine gene expression in mice after repeated and subchronic oral exposure to vomitoxin (deoxynivalenol): Differential toxin-induced hyporesponsiveness and recovery. Toxicol. Appl. Pharmacol., 151, 347–358.
Results of surveys for deoxynivalenol showing concentrations and distribution of
contamination in food commodities
|
Country/ Region |
Commodity |
Year/ Season |
No. of samples |
LOQ |
n < LOQ |
Mean/Max |
|
Africa |
||||||
|
South Africa |
Yellow maize |
1993 |
236 |
150a |
|
82/1092 |
|
White maize |
1994–95 |
143 |
150a |
|
157b/2750 |
|
|
Yellow maize |
1994–95 |
148 |
150a |
|
169b/1800 |
|
|
Maize products |
1994–95 |
156 |
150a |
92 |
116/850 |
|
|
Americas |
||||||
|
Argentina |
Maize |
1987–89 |
100 |
100a |
67 |
129/1200 |
|
Wheat |
1985 |
123 |
30a |
35 |
571/1730 |
|
|
1986 |
261 |
30a |
82 |
329/2400 |
||
|
1989 |
102 |
30a |
79 |
47/400 |
||
|
1990 |
159 |
30a |
55 |
146/672 |
||
|
1991 |
189 |
30a |
142 |
55/515 |
||
|
1992 |
222 |
30a |
139 |
75/505 |
||
|
Wheat |
1993 |
40 |
100a |
8 |
846/4500 |
|
|
Wheat |
1993 |
44 |
48 |
11 |
2594/30000 |
|
|
Wheat |
1993 |
17 |
48 |
3 |
2147/8000 |
|
|
Wheat flour |
1994 |
61 |
48 |
15 |
1042/9000 |
|
|
Wheat |
1994 |
73 |
48 |
8 |
2114/30000 |
|
|
Bread |
1994 |
20 |
17 |
0 |
637/2800 |
|
|
Maize |
1994–95 |
30 |
48 |
30 |
|
|
|
Wheat flour |
1995 |
14 |
17 |
0 |
293/436 |
|
|
Maize |
1995 |
197 |
48 |
190 |
26/2250 |
|
|
Maize flour |
1995 |
7 |
48 |
7 |
|
|
|
Wheat flour |
1996 |
5 |
48 |
5 |
|
|
|
Maize |
1996 |
59 |
48 |
59 |
|
|
|
Wheat |
1996 |
10 |
48 |
10 |
|
|
|
Wheat |
1996 |
60 |
48 |
33 |
455/6400 |
|
|
Barley |
1997 |
3 |
48 |
3 |
|
|
|
Corn flakes |
1997 |
17 |
48 |
17 |
|
|
|
Maize flour |
1997 |
22 |
48 |
22 |
|
|
|
Wheat flour |
1997 |
33 |
17 |
17 |
56/193 |
|
|
Maize |
1997 |
268 |
48 |
268 |
|
|
|
Wheat |
1997 |
52 |
48 |
23 |
698/6000 |
|
|
Wheat |
1998 |
8 |
48 |
3 |
516/3600 |
|
|
Maize |
1998 |
116 |
48 |
113 |
4.6/250 |
|
|
Coffee |
1998 |
3 |
48 |
3 |
|
|
|
Oats |
1998 |
6 |
48 |
6 |
|
|
|
Rice |
1998 |
6 |
48 |
6 |
|
|
|
Rice |
1998 |
5 |
48 |
5 |
|
|
|
Soya bean |
1998 |
5 |
17 |
5 |
|
|
|
Maize |
1998 |
34 |
48 |
31 |
78.4/1000 |
|
|
Maize |
1999 |
363 |
48 |
355 |
9.4/1000 |
|
|
Wheat flour |
1999 |
3 |
48 |
0 |
905/1963 |
|
|
Rice, husked |
1999 |
43 |
48 |
43 |
|
|
|
Rice, polished |
1999 |
6 |
48 |
6 |
|
|
|
Wheat |
1999 |
6 |
48 |
6 |
|
|
|
Maize flour |
1999 |
4 |
48 |
4 |
|
|
|
Maize |
1999 |
73 |
48 |
73 |
|
|
|
Popcorn |
1999 |
42 |
48 |
42 |
|
|
|
Sorghum |
1999 |
15 |
48 |
15 |
|
|
|
Maize |
2000 |
1025 |
48 |
967 |
35.5/2700 |
|
|
Barley |
2000 |
29 |
48 |
29 |
|
|
|
Beer |
1997 |
50 |
2 |
28 |
14/221 |
|
|
Brazil |
Wheat |
1990 |
20 |
200a |
16 |
110/590 |
|
Brazil |
Wheat |
1999 |
67 |
100 |
1 |
238/15 950 |
|
Wheat |
2000 |
108 |
100 |
14 |
198/8500 |
|
|
Wheat and wheat products |
1991 |
38 |
200a |
38 |
|
|
|
Brazil, Paraná |
Maize |
1994–95 |
80 |
111 |
75 |
?/542 |
|
Brazil, Goias |
Maize |
1994–96 |
8 |
111 |
8 |
8 |
|
Canada, Ontario |
Soft winter wheat |
1979 |
4 |
4a |
0 |
60/130 |
|
Soft winter wheat |
1980 |
49 |
10a |
1 |
421/3580 |
|
|
Soft winter wheat |
1981 |
101 |
10a |
0 |
250/3240 |
|
|
Soft winter wheat |
1982 |
129 |
25a |
1 |
744/5670 |
|
|
Soft winter wheat |
1983 |
13 |
30a |
7 |
32/110 |
|
|
Soft winter wheat |
1984 |
22 |
10a |
3 |
129/830 |
|
|
Soft winter wheat |
1985 |
45 |
50–100a |
35 |
15/160 |
|
|
Canada, Ontario |
Soft winter wheat |
1986 |
25 |
100a |
13 |
274/1730 |
|
Soft winter wheat |
1987 |
24 |
100a |
14 |
313/1650 |
|
|
Soft winter wheat |
1988 |
20 |
100a |
20 |
|
|
|
Soft winter wheat |
1989 |
28 |
100a |
13 |
263/1360 |
|
|
Soft winter wheat |
1990 |
28 |
100a |
19 |
42/170 |
|
|
Soft winter wheat |
1991 |
22 |
100a |
8 |
204/1160 |
|
|
Soft winter wheat |
1992 |
17 |
100a |
8 |
127/390 |
|
|
Soft winter wheat |
1993 |
15 |
100a |
1 |
317/910 |
|
|
Soft winter wheat |
1994 |
18 |
100a |
5 |
339/1540 |
|
|
Canada, western |
Soft spring wheat |
1981 |
49 |
30a |
24 |
90/1040 |
|
Soft spring wheat |
1982 |
35 |
5a |
27 |
30/? |
|
|
Soft spring wheat |
1983 |
15 |
30a |
13 |
7.8/60 |
|
|
Soft spring wheat |
1984 |
20 |
10a |
9 |
49.5/280 |
|
|
Soft spring wheat |
1985 |
14 |
50–100a |
9 |
40/260 |
|
|
Canada, western |
Soft spring wheat |
1986 |
16 |
100a |
14 |
80/1050 |
|
Soft spring wheat |
1987 |
15 |
100a |
12 |
14/100 |
|
|
Soft spring wheat |
1988 |
12 |
100a |
12 |
|
|
|
Canada, western |
Soft spring wheat |
1989 |
29 |
100a |
19 |
52/240 |
|
Soft spring wheat |
1990 |
16 |
50a |
10 |
156/1510 |
|
|
Soft spring wheat |
1991 |
15 |
50a |
14 |
13/190 |
|
|
Soft spring wheat |
1993 |
18 |
50a |
5 |
267/1300 |
|
|
Soft spring wheat |
1994 |
4 |
20a |
4 |
|
|
|
Canada, western |
Hard wheat |
1979 |
19 |
10–40a |
17 |
4/60 |
|
Hard wheat |
1980 |
67 |
10a |
63 |
1.2/35 |
|
|
Hard wheat |
1981 |
66 |
30a |
64 |
1.8/70 |
|
|
Hard wheat |
1982 |
135 |
30a |
135 |
|
|
|
Hard wheat |
1983 |
57 |
30a |
57 |
|
|
|
Hard wheat |
1984 |
201 |
10a |
114 |
134/10500 |
|
|
Hard wheat |
1985 |
142 |
50–100a |
109 |
58/3800 |
|
|
Canada, western |
Hard wheat |
1986 |
147 |
100a |
94 |
267/7120 |
|
Hard wheat |
1987 |
121 |
100a |
100 |
80/2100 |
|
|
Hard wheat |
1988 |
82 |
100a |
82 |
|
|
|
Canada, western |
Hard wheat |
1989 |
80 |
100a |
79 |
2.4/190 |
|
Hard wheat |
1990 |
69 |
50a |
69 |
|
|
|
Hard wheat |
1991 |
97 |
50a |
78 |
92/3380 |
|
|
Hard wheat |
1992 |
70 |
50a |
53 |
75/1170 |
|
|
Hard wheat |
1993 |
91 |
50a |
70 |
136/2800 |
|
|
Hard wheat |
1994 |
43 |
20a |
35 |
108/1800 |
|
|
Hard wheat |
1995 |
6 |
20a |
4 |
127/480 |
|
|
Canada, Ontario |
Maize |
1980 |
43 |
25a |
2 |
524/2240 |
|
Maize |
1981 |
26 |
25a |
0 |
340/620 |
|
|
Maize |
1982 |
36 |
30a |
0 |
200/880 |
|
|
Maize |
1983 |
18 |
30a |
1 |
170/1190 |
|
|
Maize |
1984 |
13 |
10a |
0 |
510/1020 |
|
|
Maize |
1985 |
16 |
50–100a |
2 |
1172/2280 |
|
|
Canada, Ontario |
Maize |
1986 |
16 |
100a |
4 |
1072/3050 |
|
Maize |
1987 |
18 |
100a |
1 |
1086/4090 |
|
|
Maize |
1988 |
10 |
100a |
7 |
273/1590 |
|
|
Canada, Ontario |
Maize |
1989 |
11 |
100a |
3 |
218/650 |
|
Maize |
1990 |
15 |
50–100a |
0 |
920/2200 |
|
|
Maize |
1991 |
10 |
50–100a |
2 |
448/1500 |
|
|
Maize |
1992 |
12 |
100a |
0 |
550/1530 |
|
|
Maize |
1993 |
20 |
100a |
8 |
396/1800 |
|
|
Maize |
1994 |
11 |
100a |
3 |
567/1970 |
|
|
Maize |
1995 |
8 |
100a |
7 |
20/160 |
|
|
Canada |
Wheat foods |
1980–81 |
10 |
4a |
1 |
63/140 |
|
Wheat foods |
1982–83 |
270 |
25a |
119 |
140/4060 |
|
|
Wheat foods |
1983–84 |
155 |
10–100a |
54 |
143/1150 |
|
|
Wheat foods |
1984–85 |
167 |
10–100a |
92 |
81/1150 |
|
|
Canada |
Wheat foods |
1985–86 |
87 |
10–50a |
56 |
61/750 |
|
Wheat foods |
1986–87 |
91 |
30–280a |
60 |
126/1600 |
|
|
Wheat foods |
1987–88 |
42 |
100a |
33 |
122/1030 |
|
|
Wheat foods |
1988–89 |
55 |
100a |
50 |
53/1080 |
|
|
Wheat foods |
1989–90 |
2 |
100a |
1 |
110/220 |
|
|
Canada |
Wheat foods |
1990–91 |
14 |
100a |
11 |
66/700 |
|
Wheat foods |
1991–92 |
7 |
50–100a |
6 |
19/130 |
|
|
Wheat foods |
1992–93 |
57 |
50–100a |
36 |
192/1700 |
|
|
Wheat foods |
1993–94 |
54 |
20–100a |
36 |
57/400 |
|
|
Wheat foods |
1994–95 |
59 |
20–100a |
33 |
93/1000 |
|
|
Wheat foods |
1995–96 |
187 |
20–100a |
124 |
108/2750 |
|
|
Canada |
Beer |
1993 |
33 |
0.1a,c |
13 |
3.7/503c |
|
Chile |
Maize |
1995–96 |
68 |
10a |
68 |
|
|
Uruguay |
Wheat and by-products |
1993–94 |
40 |
40a |
15 |
345/4000 |
|
Barley and by-products |
1993–94 |
99 |
40a |
58 |
1220/4000 |
|
|
Uruguay |
Maize and by-products |
1993–94 |
10 |
40a |
8 |
158/1500 |
|
Uruguay |
Rice and by-products |
1993–94 |
3 |
40a |
2 |
100/300 |
|
Uruguay |
Wheat and by-products |
1994–95 |
168 |
40a |
81 |
297/4000 |
|
Barley and by-products |
1994–95 |
51 |
40a |
45 |
23/400 |
|
|
Maize and by-products |
1994–95 |
7 |
40a |
4 |
43/120 |
|
|
Rice and by-products |
1994–95 |
10 |
40a |
8 |
32/167 |
|
|
Wheat and by-products |
1995–96 |
15 |
40a |
6 |
164/945 |
|
|
Barley and by-products |
1995–96 |
77 |
40a |
39 |
54/287 |
|
|
Maize and by-products |
1995–96 |
6 |
40a |
3 |
33/120 |
|
|
Rice and by-products |
1995–96 |
10 |
40a |
8 |
15/96 |
|
|
Wheat and by-products |
1996–97 |
27 |
40a |
3 |
325/1668 |
|
|
Barley and by-products |
1996–97 |
53 |
40a |
16 |
152/1704 |
|
|
Rice and by-products |
1996–97 |
31 |
40a |
18 |
184/956 |
|
|
Uruguay |
Wheat and by-products |
1997–98 |
91 |
40a |
32 |
316/5536 |
|
Barley and by-products |
1997–98 |
241 |
40a |
58 |
1823/34462 |
|
|
Maize and by-products |
1997–98 |
8 |
40a |
1 |
697/4308 |
|
|
Uruguay |
Rice and by-products |
1997–98 |
26 |
40a |
21 |
29/431 |
|
Wheat and by-products |
1998–99 |
11 |
20a |
1 |
126/528 |
|
|
Barley and by-products |
1998–99 |
136 |
20a |
62 |
63/862 |
|
|
Maize and by-products |
1998–99 |
7 |
20a |
3 |
111/651 |
|
|
Rice and by-products |
1998–99 |
19 |
20a |
19 |
|
|
|
Wheat and by-products |
1999–2000 |
9 |
20a |
3 |
62/246 |
|
|
Barley and by-products |
1999–2000 |
153 |
20a |
133 |
4/98 |
|
|
Maize and by-products |
1999–2000 |
9 |
20a |
4 |
43/176 |
|
|
Rice and by-products |
1999–2000 |
14 |
20a |
13 |
6/80 |
|
|
USA |
Maize |
1989 |
8 |
1000a |
1 |
1575/3000 |
|
Wheat |
1989 |
12 |
1000a |
11 |
158/1900 |
|
|
Rice |
1989 |
4 |
1000a |
1 |
5100/9500 |
|
|
Oats |
1989 |
5 |
1000a |
3 |
760/2600 |
|
|
Wheat and oat biscuits |
1989 |
18 |
1000a |
12 |
933/5400 |
|
|
Maize chips |
1989 |
6 |
1000a |
4 |
833/3000 |
|
|
Popcorn |
1989 |
8 |
1000a |
4 |
1950/4500 |
|
|
USA |
Wheat flour muffin mix |
1989 |
17 |
1000a |
4 |
3059/5800 |
|
Maize meal |
1989 |
11 |
1000a |
4 |
3691/19000 |
|
|
Mixed-grain |
1989 |
3 |
1000a |
2 |
5333/16000 |
|
|
USA |
Wheat |
1991 |
81 |
40a |
unk |
1570b/9330 |
|
USA |
Barley |
1993 |
118 |
500 |
39 |
3000/14 000 |
|
Malting barley |
1993 |
29 |
500 |
0 |
9000/25800 |
|
|
Hard spring wheat |
1993 |
201 |
500 |
21 |
3700/18400 |
|
|
Hard winter wheat |
1993 |
194 |
500 |
100 |
800/7600 |
|
|
Mixed wheat |
1993 |
1 |
500 |
0 |
2300/2300 |
|
|
Soft winter wheat |
1993 |
59 |
500 |
9 |
1400/14600 |
|
|
Soft white wheat |
1993 |
28 |
500 |
20 |
100/700 |
|
|
USA |
White flour |
1994 |
89 |
20a |
|
500/1700 |
|
White flour |
1994 |
23 |
20a |
23 |
0 |
|
|
White flour |
1994 |
160 |
20a |
|
420/2630 |
|
|
Whole-wheat flour |
1994 |
54 |
20a |
|
530/3800 |
|
|
Whole-wheat flour |
1994 |
29 |
20a |
|
600/1400 |
|
|
Whole-wheat flour |
1994 |
7 |
20a |
|
410/680 |
|
|
USA |
Wheat brans |
1994 |
63 |
20a |
|
940/2580 |
|
Wheat brans |
1994 |
32 |
20a |
|
600/600 |
|
|
Wheat brans |
1994 |
68 |
20a |
|
460/2920 |
|
|
Wheat products |
1994 |
5 |
20a |
|
420/1200 |
|
|
Wheat products |
1994 |
18 |
20a |
|
0/0 |
|
|
Wheat products |
1994 |
14 |
20a |
|
320/1160 |
|
|
USA |
Wheat |
1996 |
14 |
500 |
1 |
5719/11 900 |
|
Europe |
||||||
|
Austria |
Maize autumn |
1996, |
85 |
81a |
4 |
694/2435 |
|
Austria |
Maize |
1996 |
51 |
100 |
2 |
662/2570 |
|
Austria |
Maize |
1996 |
46 |
50 |
5 |
575/2810 |
|
1997 |
58 |
50 |
20 |
91/580 |
||
|
1998 |
48 |
50 |
12 |
285/1360 |
||
|
Austria |
Wheat |
1998 |
15 |
50 |
7 |
52.7/145 |
|
Bulgaria |
Wheat |
1993 |
44 |
5a |
7 |
37.9/137 |
|
Bulgaria |
Wheat |
1995 |
140 |
50a |
46 |
120.6/1800 |
|
Finland |
Oats |
1987–88 |
21 |
5a |
0 |
168/861 |
|
Barley |
1987–88 |
30 |
5a |
3 |
70/202 |
|
|
Wheat |
1987–88 |
40 |
5a |
3 |
75/356 |
|
|
Rye |
1987–88 |
31 |
5a |
7 |
40/93 |
|
|
Finland |
Wheat |
1998 |
31 |
10 |
5 |
29.6/190 |
|
Rye |
1998 |
49 |
10 |
9 |
24.5/144 |
|
|
Barley |
1998 |
15 |
10 |
6 |
20.7/55.9 |
|
|
Oats |
1998 |
10 |
10 |
2 |
138.6/955 |
|
|
Germany |
Bread and related products |
Jan–Jun 1998 |
96 |
23 |
16 |
76.4/788 |
|
Noodles |
|
29 |
23 |
2 |
146.9/1670 |
|
|
Breakfast cereals |
|
32 |
23 |
14 |
42/238 |
|
|
Baby and infant foods |
|
25 |
23 |
10 |
36.6/314 |
|
|
Rice |
|
26 |
23 |
12 |
106.5/305 |
|
|
Cereal foods |
|
29 |
23 |
14 |
71.8/505 |
|
|
Germany |
Wheat |
1998 |
56 |
23 |
4 |
647/7730 |
|
Germany |
White wheat flour (ash content, 40–55 mg/kg) |
1999 |
28 |
23 |
0 |
239/965 |
|
Germany |
White wheat flour (ash content, 105 mg/kg) |
1999 |
13 |
23 |
1 |
216/756 |
|
White wheat flour (ash content, 160–170 mg/kg) |
1999 |
19 |
23 |
0 |
404/1379 |
|
|
Germany |
Bread, white |
1999 |
55 |
23 |
2 |
176/584 |
|
Bread, whole grain |
1999 |
52 |
23 |
7 |
103/690 |
|
|
Noodles, white flour |
1999 |
27 |
23 |
1 |
220/1000 |
|
|
Noodles, whole-grain flour |
1999 |
12 |
23 |
3 |
791/4840 |
|
|
Germany |
Wheat |
1987 |
84 |
1a |
3 |
1574/20 538 |
|
Germany |
Wheat |
1989 |
78 |
1–5a |
24 |
105/1187 |
|
Wheat |
1990 |
80 |
1–5a |
3 |
573/8969 |
|
|
Wheat |
1991 |
80 |
1–5a |
3 |
346/4627 |
|
|
Wheat |
1992 |
78 |
1–5a |
4 |
318/5412 |
|
|
Wheat |
1993 |
45 |
1–5a |
2 |
374/6165 |
|
|
Germany |
Oats |
1987 |
56 |
3a |
18 |
91.9/1480 |
|
Germany |
Oats |
1989 |
56 |
3a |
15 |
99.7/536 |
|
Oats |
1990 |
54 |
3a |
26 |
26.8/203 |
|
|
Oats |
1991 |
51 |
3a |
26 |
107.3/857 |
|
|
Oats |
1992 |
55 |
3a |
8 |
256.9/1224 |
|
|
Germany |
Barley |
1987 |
44 |
3a |
1 |
391/4764 |
|
Barley |
1989 |
40 |
3a |
11 |
75/483 |
|
|
Barley |
1990 |
47 |
3a |
13 |
54/300 |
|
|
Barley |
1991 |
51 |
3a |
15 |
38/530 |
|
|
Barley |
1992 |
58 |
3a |
6 |
38/486 |
|
|
Germany |
Rye, conventional |
1991 |
50 |
50a |
30 |
64/1250 |
|
Rye, organic |
1991 |
50 |
50a |
22 |
239/500 |
|
|
Wheat, contional |
1991 |
51 |
50a |
6 |
370/1200 |
|
|
Wheat, organic |
1991 |
50 |
50a |
12 |
369/1000 |
|
|
Germany |
Beer |
1993 |
67 |
50a,c |
17 |
183/569c |
|
Beer |
1993 |
123 |
50a,c |
88 |
42/478c |
|
|
Beer |
1993 |
6 |
50a,c |
6 |
|
|
|
Italy, north |
Durum wheat |
1994–95 |
64 |
500a |
50 |
204/3085 |
|
Soft wheat |
1994–95 |
77 |
500a |
71 |
59/920 |
|
|
Italy, north |
Soft wheat |
1998 |
42 |
50a |
37 |
17/330 |
|
Italy, north |
Durum wheat |
1998 |
26 |
50a |
2 |
186/1000 |
|
Barley |
1998 |
20 |
50a |
18 |
80/1540 |
|
|
Triticale |
1998 |
10 |
50a |
2 |
92/200 |
|
|
Soft wheat, organic |
1998 |
35 |
50a |
17 |
36/105 |
|
|
Spelt wheat, organic |
1998 |
20 |
50a |
2 |
172/350 |
|
|
Italy, north |
Soft wheat, organic |
1999 |
48 |
50a |
1 |
173/529 |
|
Spelt wheat, organic |
1999 |
30 |
50a |
0 |
148/452 |
|
|
Soft wheat |
1999 |
112 |
50a |
44 |
133/956 |
|
|
Durum wheat |
1999 |
111 |
50a |
22 |
202/1206 |
|
|
Netherlands |
Wheat products |
1999 |
20 |
32 |
2 |
134/250 |
|
Wheat |
1999 |
54 |
32 |
4 |
358/1900 |
|
|
Wheat flour |
1999 |
24 |
32 |
4 |
193/460 |
|
|
Maize and by-products |
1999 |
3 |
32 |
0 |
110/130 |
|
|
Malt |
1999 |
2 |
32 |
2 |
0/0 |
|
|
Various grains and by-products |
2000 |
171 |
32 |
91 |
55/570 |
|
|
Various grains (not wheat) |
2000 |
25 |
32 |
20 |
40/385 |
|
|
Norway (imported) |
Wheat |
1990 |
27 |
30a |
19 |
98/660 |
|
Norway (imported) |
Wheat |
1992 |
16 |
30a |
4 |
403/1300 |
|
Wheat |
1993 |
29 |
30a |
15 |
383/2500 |
|
|
Wheat |
1994 |
30 |
30a |
18 |
69/610 |
|
|
Wheat |
1995 |
40 |
30a |
18 |
148/650 |
|
|
Wheat |
1996 |
34 |
20a |
20 |
328/2700 |
|
|
Norway (imported) |
Wheat |
1997 |
10 |
20a |
3 |
353/1900 |
|
Wheat |
1998 |
24 |
20a |
6 |
74/233 |
|
|
Norway |
Wheat |
1990 |
138 |
30a |
28 |
101/890 |
|
Wheat |
1991 |
107 |
30a |
20 |
81/310 |
|
|
Norway |
Wheat |
1992 |
112 |
30a |
16 |
189/900 |
|
Wheat |
1993 |
102 |
30a |
37 |
89/560 |
|
|
Wheat |
1994 |
112 |
30a |
86 |
29/370 |
|
|
Wheat |
1995 |
26 |
30a |
15 |
19.5/170 |
|
|
Wheat |
1996 |
28 |
20a |
28 |
|
|
|
Wheat |
1997 |
25 |
20a |
19 |
8/73 |
|
|
Wheat |
1998 |
35 |
20a |
32 |
4/85 |
|
|
Norway (imported) |
Rye |
1990 |
18 |
30a |
12 |
15/50 |
|
Norway (imported) |
Rye |
1993 |
12 |
30a |
9 |
14/62 |
|
Rye |
1994 |
12 |
30a |
8 |
16/60 |
|
|
Rye |
1995 |
11 |
30a |
8 |
12.5/57 |
|
|
Rye |
1996 |
10 |
20a |
10 |
|
|
|
Norway |
Barley |
1990 |
10 |
20a |
2 |
30/60 |
|
Barley |
1990 |
10 |
20a |
9 |
5.5/55 |
|
|
Norway |
Oats |
1990 |
20 |
30a |
0 |
262/690 |
|
Norway |
Oats |
1993 |
3 |
30a |
0 |
470/670 |
|
Oats |
1994 |
3 |
30a |
0 |
538/1300 |
|
|
Oats |
1995 |
26 |
30a |
10 |
54/230 |
|
|
Oats |
1996 |
14 |
20a |
5 |
101/266 |
|
|
Norway |
Oats |
1997 |
14 |
20a |
0 |
58/110 |
|
Oats |
1998 |
22 |
20a |
10 |
129/850 |
|
|
Oats |
1999 |
20 |
20a |
17 |
4/28 |
|
|
Poland |
Wheat |
1993 |
78 |
10a |
39 |
10.5/102 |
|
Russian Federation |
Wheat |
1986 |
14 |
50a |
0 |
590/2510 |
|
Wheat |
1987 |
90 |
50a |
34 |
260/9090 |
|
|
Wheat |
1988 |
120 |
50a |
8 |
1130/13900 |
|
|
Russian Federation |
Wheat, freshly harvested |
1989 |
251 |
50a |
0 |
680/5800 |
|
1990 |
214 |
50a |
90 |
570/3520 |
||
|
1991 |
159 |
50a |
39 |
520/3800 |
||
|
1992 |
311 |
50a |
3 |
880/8600 |
||
|
1993 |
543 |
50a |
4 |
710/4000 |
||
|
1994 |
154 |
50a |
118 |
80/950 |
||
|
Wheat, food grain |
1989 |
57 |
50a |
42 |
230/6650 |
|
|
1990–91 |
67 |
50a |
63 |
20/740 |
||
|
1992 |
190 |
50a |
118 |
330/5630 |
||
|
1993 |
169 |
50a |
139 |
200/3950 |
||
|
1994 |
267 |
50a |
249 |
30/1130 |
||
|
Sweden |
Wheat |
1990 |
88 |
10 |
63 |
9.5/90 |
|
Oats |
1990 |
71 |
10 |
28 |
25/375 |
|
|
Barley |
1990 |
39 |
10 |
12 |
16/45 |
|
|
Rye |
1990 |
5 |
10 |
0 |
22/30 |
|
|
Wheat |
1991 |
92 |
10 |
40 |
17.7/240 |
|
|
Oats |
1991 |
38 |
10 |
28 |
6/95 |
|
|
Wheat |
1992 |
13 |
10 |
7 |
8/30 |
|
|
Oats |
1992 |
2 |
10 |
0 |
40/40 |
|
|
Wheat |
1993 |
2 |
10 |
1 |
10/20 |
|
|
Oats |
1993 |
10 |
10 |
6 |
14.4/89 |
|
|
Oats |
1994 |
34 |
10 |
2 |
136/538 |
|
|
Oats |
1996 |
80 |
10 |
9 |
47/365 |
|
|
Oats |
1997 |
84 |
10 |
5 |
86/406 |
|
|
Oats |
1998 |
33 |
10 |
18 |
14/120 |
|
|
Barley |
1998 |
10 |
10 |
8 |
31/243 |
|
|
Sweden |
Wheat |
1996–98 |
59 |
10 |
43 |
69/2153 |
|
Wheat |
1999 |
75 |
10 |
16 |
53/346 |
|
|
Oats |
1996–98 |
23 |
10 |
17 |
9.3/70 |
|
|
Oats |
1999 |
10 |
10 |
6 |
6/19 |
|
|
Rye |
1996–98 |
28 |
10 |
26 |
13/351 |
|
|
Rye |
1999 |
19 |
10 |
9 |
13/47 |
|
|
United Kingdom |
Wheat |
1998 |
53 |
20a |
2 |
175/1202 |
|
Wheat |
1999 |
201 |
20a |
3 |
86/600 |
|
|
Barley |
1999 |
106 |
20a |
31 |
38/370 |
|
|
Oats |
1999 |
13 |
20a |
3 |
39/108 |
|
|
Asia and Australasia |
||||||
|
China, Linxian |
Wheat |
1995 |
25 |
5a |
4 |
70/193 |
|
China, Shangqiu |
Wheat |
1995 |
15 |
5a |
7 |
21/125 |
|
China, Linxian |
Maize |
1995 |
34 |
5a |
9 |
294/1160 |
|
China, Shangqiu |
Maize |
1995 |
20 |
5a |
16 |
10/87 |
|
China, Linxian |
Maize |
1997 |
15 |
5a |
1 |
120/393 |
|
China, Shangqiu |
Maize |
1997 |
20 |
5a |
11 |
40/171 |
|
China, Linxian |
Wheat |
1997 |
25 |
5a |
8 |
19/138 |
|
China, Shangqiu |
Wheat |
1997 |
15 |
5a |
15 |
|
|
China, Linqu |
Maize, raw |
1996 |
12 |
500a |
5 |
817/2700 |
|
Maize meal |
1996 |
13 |
500a |
5 |
615/1600 |
|
|
Cooked |
1996 |
14 |
500a |
10 |
314/1500 |
|
|
pancake |
|
|
|
|
|
|
|
China, Anhui Province |
Wheat |
1983 |
40 |
50a |
0 |
1161/ |
|
Wheat |
1986 |
182 |
50a |
100 |
312/ |
|
|
Wheat |
1989 |
81 |
50a |
0 |
2640/ |
|
|
Wheat |
1991 |
26 |
50a |
0 |
2106/ |
|
|
China |
Wheat grain summer |
1986, |
214 |
100 |
48 |
211.3/1200 |
|
China |
Wheat grain |
No data |
99 |
100 |
92 |
697.3/20000 |
|
China |
Wheat flour |
1988, summer |
30 |
100 |
13 |
83.3/400 |
|
China |
Wheat flour |
1989, autumn |
50 |
100 |
2 |
561/1428 |
|
China |
Wheat flour |
1989, summer |
70 |
100 |
0 |
1403/3130 |
|
China |
Wheat flour |
1990, summer |
50 |
100 |
32 |
56.2/173 |
|
Wheat flour |
1991, summer |
50 |
100 |
31 |
302/1000 |
|
|
China |
Wheat grain |
1996, summer |
100 |
100 |
60 |
272.7/2322.1 |
|
China |
Maize kernel |
1988/? |
101 |
100 |
21 |
287/2500 |
|
China |
Maize kernel |
1988, autumn |
55 |
100 |
23 |
177.5/1100 |
|
China |
Maize kernel |
1989, summer |
100 |
100 |
68 |
241.3/4000 |
|
China |
Maize kernel |
1989, autumn |
140 |
100 |
111 |
35.2/800 |
|
China |
Maize kernel |
1989/? |
50 |
100 |
12 |
136/1000 |
|
China |
Maize kernel |
1990, summer |
85 |
100 |
62 |
69.2/48 |
|
China |
Maize kernel |
1990, winter |
20 |
100 |
15 |
163/1500 |
|
China |
Maize kernel |
1991, summer |
50 |
100 |
33 |
505/3200 |
|
India |
Maize |
1994–97 |
197 |
100a |
195 |
0.19/21 |
|
Indonesia |
Maize |
1995 |
16 |
10a |
14 |
3.3/32 |
|
Indonesia |
Maize |
1992–94 |
12 |
10a |
12 |
|
|
Japan |
Wheat |
1989–94 |
151 |
5a |
69 |
87/1620 |
|
Barley |
1989–94 |
94 |
5a |
23 |
205/3780 |
|
|
Japan, Hokkaido |
Wheat |
1991–92 |
79 |
5 |
28 |
393/13002 |
|
Japan |
Wheat flour |
1996–99 |
52 |
5 |
25 |
178.6/1884 |
|
Barley, pressed |
1996–99 |
20 |
5 |
12 |
37.2/223 |
|
|
Barley flour, parched |
1996–99 |
30 |
5 |
28 |
6.77/190 |
|
|
Korea, Republic of |
Barley, husked |
July 1990 |
10 |
2a |
1 |
237/677 |
|
Barley, naked |
July 1990 |
27 |
2a |
3 |
189/645 |
|
|
Korea, Republic of |
Barley |
July 1990 |
39 |
5a |
4 |
153/1051 |
|
Korea, Republic of |
Maize |
Nov 1990–91 |
46 |
5a |
16 |
202/2752 |
|
Korea, Republic of |
Barley |
July 1992 |
30 |
5a |
10 |
70.6/361 |
|
Maize |
March 1992 |
15 |
5a |
1 |
135/442 |
|
|
Korea, Republic of |
Barley |
1993 |
48 |
5a |
20 |
120/1522 |
|
Barley |
1993 |
11 |
5a |
3 |
190/955 |
|
|
Korea, Republic of |
Beer |
1995 |
42 |
0.5a,c |
34 |
0.59/5.3c |
|
New Zealand |
Maize |
1987 |
29 |
30 |
8 |
760/3500 |
|
Maize |
1988 |
34 |
30 |
5 |
446/1120 |
|
|
Maize |
1989 |
28 |
30 |
5 |
286/710 |
|
|
New Zealand |
Maize |
1992 |
178 |
10a |
0 |
920/8500 |
|
Maize |
1993 |
162 |
10a |
12 |
310/3370 |
|
|
Maize |
1994 |
276 |
10a |
31 |
350/4790 |
|
|
Papua New Guinea |
Cereals, food |
1991 |
29 |
10 |
17 |
329/2270 |
|
Philippines |
Maize |
1992–94 |
50 |
10a |
50 |
|
|
Thailand |
Maize |
1992–94 |
27 |
10a |
27 |
|
|
Viet Nam |
Maize |
1993 |
15 |
100a |
15 |
|
|
Maize powder |
1993 |
17 |
100a |
13 |
746/6510 |
|
|
Country/ Region |
Commodity |
Year/ Season |
90th %ile |
n > 100 |
n > 1000 |
References |
Sampling procedure |
|
Africa |
|||||||
|
South Africa |
Yellow maize |
1993 |
|
|
|
P,S, Rava et al. (1996); A, Scott et al. (1986), Trucksess et al. (1987), Marasas et al. (1979) |
Samples collected at harvest from silos in main production zones |
|
White maize |
1994–95 |
|
|
|
P,S, Rava (1996); A, Scott et al. (1986) |
Samples collected from mills throughout country |
|
|
Yellow maize |
1994–95 |
|
|
|
|||
|
Maize products |
1994–95 |
|
|
|
|||
|
Americas |
|||||||
|
Argentina |
Maize |
1987–89 |
|
|
2 |
P,Saubois et al. (1992); S, Junta Nacional de Granos (1984), COPANT (1998), Jewers (1987); A, Trucksess et al. (1984) |
Samples,10 kg; analytical sample, 50 g |
|
Wheat |
1985 |
|
|
|
P, Quiroga et al. (1995); S, Apro et al. (1987); A,Trucksess et al. (1984) |
See Trichothecenes Appendix 6 |
|
|
1986 |
|
|
|
||||
|
1989 |
197 |
23 |
0 |
||||
|
1990 |
400 |
89 |
0 |
||||
|
1991 |
200 |
37 |
0 |
||||
|
1992 |
258 |
72 |
0 |
||||
|
Wheat |
1993 |
2640 |
32 |
13 |
P,S, Dalcero et al. (1997); A, Trucksess et al. (1984) |
||
|
Wheat |
1993 |
8000 |
33 |
24 |
P, González et al. (1996); S, Apro et al. (1987); A,Trucksess et al. (1984) |
See Trichothecenes Appendix 6 |
|
|
Wheat |
1993 |
5200 |
14 |
13 |
S, Resnik & Pacin (2000); P, Pacin & Resnik (2000); A, Trucksess et al. (1984) |
See Trichothecenes. Appendix 6. Laboratory sample, 100 g |
|
|
Wheat flour |
1994 |
2000 |
46 |
23 |
P,S,A, Pacin et al. (1997) |
Purchased at mills (1 kg) |
|
|
Wheat |
1994 |
5720 |
65 |
38 |
P,S,A, Pacin et al. (1997); S, Apro et al. (1987) |
See Trichothecenes Appendix 6 |
|
|
Bread |
1994 |
1432 |
20 |
3 |
P,S,A, Neira et al. (1997) |
Purchased at bakeries; 20 samples of ~25 g |
|
|
Maize |
1994–95 |
|
|
|
P, González et al. (1999a); S, Apro et al. (1987); A, Solovey et al. (1999) |
See Trichothecenes |
|
|
Wheat flour |
1995 |
410 |
|
|
P,S,A, Neira et al. (1997) |
Purchased at bakeries (1 kg) |
|
|
Maize |
1995 |
|
6 |
2 |
S, Resnik & Pacin (2000); P, Pacin & Resnik (2000); A, Solovey et al. (1999) |
See Trichothecenes Appendix 6 |
|
|
Maize flour |
1995 |
|
|
|
P, Pacin & Resnik(2000); A, |
|
|
|
Wheat flour |
1996 |
|
|
|
Solovey et al. (1999) |
|
|
|
Maize |
1996 |
|
|
|
Resnik & Pacin (2000); P, Resnik et al. (2000); A, Solovey et al. (1999) |
See Trichothecenes Appendix 6 |
|
|
Wheat |
1996 |
|
|
|
Pacin & Resnik (2000); Solovey et al. (1999) |
|
|
|
Wheat |
1996 |
|
|
|
S, Resnik & Pacin (2000); P, González et al. (1999b); A, Solovey et al. (1999) |
See Trichothecenes Appendix 6 ; sample, 1 kg |
|
|
Barley |
1997 |
|
|
|
P, Pacin & Resnik (2000); A, Solovey et al. (1999) |
|
|
|
Corn flakes |
1997 |
|
|
|
P,S,A, Solovey et al. (1999) |
|
|
|
Maize flour |
1997 |
|
|
|
|||
|
Wheat flour |
1997 |
171 |
10 |
0 |
P,S, Samar et al. (2000); A, Neira et al. (1997) |
|
|
|
Maize |
1997 |
|
|
|
S, Resnik & Pacin (2000); P, Pacin & Resnik (2000); A, Solovey et al. (1999) |
See Trichothecenes |
|
|
Wheat |
1997 |
1920 |
29 |
13 |
|||
|
Wheat |
1998 |
|
5 |
1 |
|||
|
Maize |
1998 |
|
2 |
0 |
|||
|
Coffee |
1998 |
|
|
|
P,S, Pacin & Resnik (2000); A, Solovey et al. (1999) |
|
|
|
Oats |
1998 |
|
|
|
|||
|
Rice |
1998 |
|
|
|
P,S, Broggi et al. (1999a,b); A,Solovey et al. (1999) |
|
|
|
Rice |
1998 |
|
|
|
P,S, Pacin & Resnik (2000); A, Solovey et al. (1999) |
|
|
|
Soya bean |
1998 |
|
|
|
P,S, Boca et al. (2000); A, Neira et al. (1997) |
|
|
|
Maize |
1998 |
333 |
3 |
2 |
S, Resnik & Pacin (2000); P, Broggi et al. (2000); A, Solovey et al. (1999) |
See Trichothecenes Appendix 6 |
|
|
Maize |
1999 |
|
8 |
1 |
S, Resnik & Pacin (2000); P, Resnik et al. (2000); A, Solovey et al. (1999) |
See Trichothecenes Appendix 6 |
|
|
Wheat flour |
1999 |
|
3 |
1 |
P,S, Pacin & Resnik (2000); A, Solovey et al. (1999) |
|
|
|
Rice, husked |
1999 |
|
|
|
P,S, Broggi et al. (1999b); A, Solovey et al. (1999) |
|
|
|
Rice, polished |
1999 |
|
|
|
P,S, Broggi et al. (1999b); A, Solovey et al. (1999) |
|
|
|
Wheat |
1999 |
|
|
|
P, Resnik & Pacin (2000); S, Pacin & Resnik (2000); A, Solovey et al. (1999) |
See Trichothecenes Appendix 6 |
|
|
Maize flour |
1999 |
|
|
|
P,S, Broggi et al. (1999b); A, Solovey et al. (1999) |
|
|
|
Maize |
1999 |
|
|
|
P, Broggi et al. (2000); S, Resnik & Pacin (2000); A, Solovey et al. (1999) |
See Trichothecenes Appendix 6 |
|
|
Popcorn |
1999 |
|
|
|
P,S, de Souza et al. (2000); A, Solovey et al. (1999) |
Collected at harvest in zigzag from interior of block |
|
|
Sorghum |
1999 |
|
|
|
P, Pacin & Resnik(2000); S, Resnik & Pacin (2000); A, Solovey et al. (1999) |
See Trichothecenes Appendix 6 |
|
|
Maize |
2000 |
|
49 |
10 |
|||
|
Barley |
2000 |
|
|
|
P,S, Martínez et al. (2000); A, Solovey et al. (1999) |
Collected from beer industry; sample size, > 1 kg |
|
|
Beer |
1997 |
34.7 |
|
|
P,S, Moltó et al (2000); A, Scott et al. (1993) |
Collected at markets; sample size, > 2 bottles or cans |
|
|
Brazil |
Wheat |
1990 |
578 |
4 |
0 |
P,S, Furlong et al. (1995); A, Furlong & Valente Soares (1995) |
Samples from experimental plots in wheat-growing areas of São Paulo, 3–10 kg; laboratory samples,1kg |
|
Brazil |
Wheat |
1999 |
|
1 |
1 |
P,S,A, Mallman (2000) |
Samples, 200–1000 g |
|
Wheat |
2000 |
|
14 |
6 |
|||
|
Wheat and wheat products |
1991 |
|
|
|
P,S, Soares & Furlani (1996); A, Furlong & Valente Soares (1995) |
Samples (1 kg) purchased in organic food shops |
|
|
Brazil, Paraná |
Maize |
1994–95 |
|
|
|
P, Prado et al. (1997); S, Fonseca (1991); A, Trucksess et al. (1984) |
|
|
Brazil, Goias |
Maize |
1994–96 |
|
|
|
P, Prado et al. (1997); S, Fonseca (1991); A, Trucksess et al. (1984) |
|
|
Canada, Ontario |
Soft winter wheat |
1979 |
|
|
|
P,S, Scott (1997); A, Scott et al. (1981) |
Collected immediately after harvest or at mills; sample size, 2–5 kg |
|
Soft winter wheat |
1980 |
|
|
|
|||
|
Soft winter wheat |
1981 |
|
|
|
|||
|
Soft winter wheat |
1982 |
|
|
|
|||
|
Soft winter wheat |
1983 |
|
|
|
|||
|
Soft winter wheat |
1984 |
|
|
|
|||
|
Soft winter wheat |
1985 |
|
|
|
|||
|
Canada, Ontario |
Soft winter wheat |
1986 |
|
|
|
P,S, Scott (1997); A, Scott et al. (1986) |
Collected immediately after harvest or at mills; sample size, 2–5 kg |
|
Soft winter wheat |
1987 |
|
|
|
|||
|
Soft winter wheat |
1988 |
|
|
|
|||
|
Soft winter wheat |
1989 |
|
|
|
P,S, Scott (1997); A, Scott et al. (1989) |
Collected immediately after harvest or at mills; sample size, 2–5 kg |
|
|
Soft winter wheat |
1990 |
|
|
|
|||
|
Soft winter wheat |
1991 |
|
|
|
|||
|
Soft winter wheat |
1992 |
|
|
|
|||
|
Soft winter wheat |
1993 |
|
|
|
|||
|
Soft winter wheat |
1994 |
|
|
|
|||
|
Canada, western |
Soft spring wheat |
1981 |
|
|
|
P,S, Scott (1997); A, Scott et al. (1981) |
Collected immediately after harvest or at mills; sample size, 2–5 kg |
|
Soft spring wheat |
1982 |
|
|
|
|||
|
Soft spring wheat |
1983 |
|
|
|
|||
|
Soft spring wheat |
1984 |
|
|
|
|||
|
Soft spring wheat |
1985 |
|
|
|
|||
|
Canada, western |
Soft spring wheat |
1986 |
|
|
|
P,S, Scott (1997); A, Scott et al. (1986) |
Collected immediately after harvest or at mills; sample size, 2–5 kg |
|
Soft spring wheat |
1987 |
|
|
|
|||
|
Soft spring wheat |
1988 |
|
|
|
|||
|
Canada, western |
Soft spring wheat |
1989 |
|
|
|
P,S, Scott (1997); A, Scott et al. (1989) |
Collected immediately after harvest or at mills; sample size, 2–5 kg |
|
Soft spring wheat |
1990 |
|
|
|
|||
|
Soft spring wheat |
1991 |
|
|
|
|||
|
Soft spring wheat |
1993 |
|
|
|
|||
|
Soft spring wheat |
1994 |
|
|
|
|||
|
Canada, western |
Hard wheat |
1979 |
|
|
|
P,S, Scott (1997); A, Scott et al. (1981) |
Collected immediately after harvest or at mills; sample size, 2–5 kg |
|
Hard wheat |
1980 |
|
|
|
|||
|
Hard wheat |
1981 |
|
|
|
|||
|
Hard wheat |
1982 |
|
|
|
|||
|
Hard wheat |
1983 |
|
|
|
|||
|
Hard wheat |
1984 |
|
|
|
|||
|
Hard wheat |
1985 |
|
|
|
|||
|
Canada, western |
Hard wheat |
1986 |
|
|
|
P,S, Scott (1997); A, Scott et al. (1986) |
Collected immediately after harvest or at mills; sample size, 2–5 kg |
|
Hard wheat |
1987 |
|
|
|
|||
|
Hard wheat |
1988 |
|
|
|
|||
|
Canada, western |
Hard wheat |
1989 |
|
|
|
P,S, Scott (1997); A, Scott et al. (1989) |
Collected immediately after harvest or at mills; sample size, 2–5 kg |
|
Hard wheat |
1990 |
|
|
|
|||
|
Hard wheat |
1991 |
|
|
|
|||
|
Hard wheat |
1992 |
|
|
|
|||
|
Hard wheat |
1993 |
|
|
|
|||
|
Hard wheat |
1994 |
|
|
|
|||
|
Hard wheat |
1995 |
|
|
|
|||
|
Canada, Ontario |
Maize |
1980 |
|
|
|
P,S, Scott (1997); A, Scott et al. (1981) |
Collected immediately after harvest or at mills; sample size, 2–5 kg |
|
Maize |
1981 |
|
|
|
|||
|
Maize |
1982 |
|
|
|
|||
|
Maize |
1983 |
|
|
|
|||
|
Maize |
1984 |
|
|
|
|||
|
Maize |
1985 |
|
|
|
|||
|
Canada, Ontario |
Maize |
1986 |
|
|
|
P,S, Scott (1997); A, Scott et al. (1986) |
Collected immediately after harvest or at mills; sample size, 2–5 kg |
|
Maize |
1987 |
|
|
|
|||
|
Maize |
1988 |
|
|
|
|||
|
Canada, Ontario |
Maize |
1989 |
|
|
|
P,S, Scott (1997); A, Scott et al. (1989) |
Collected immediately after harvest or at mills; sample size, 2–5 kg |
|
Maize |
1990 |
|
|
|
|||
|
Maize |
1991 |
|
|
|
|||
|
Maize |
1992 |
|
|
|
|||
|
Maize |
1993 |
|
|
|
|||
|
Maize |
1994 |
|
|
|
|||
|
Maize |
1995 |
|
|
|
|||
|
Canada |
Wheat foods |
1980–81 |
|
|
|
P,S, Scott (1997); A, Scott et al. (1981) |
Collected immediately after harvest or at mills; sample size, 2–5 kg |
|
Wheat foods |
1982–83 |
|
|
|
|||
|
Wheat foods |
1983–84 |
|
|
|
|||
|
Wheat foods |
1984–85 |
|
|
|
|||
|
Canada |
Wheat foods |
1985–86 |
|
|
|
P,S, Scott (1997); A, Scott et al. (1986) |
Collected immediately after harvest or at mills; sample size, 2–5 kg |
|
Wheat foods |
1986–87 |
|
|
|
|||
|
Wheat foods |
1987–88 |
|
|
|
|||
|
Wheat foods |
1988–89 |
|
|
|
|||
|
Wheat foods |
1989–90 |
|
|
|
|||
|
Canada |
Wheat foods |
1990–91 |
|
|
|
P,S, Scott (1997); A, Scott et al. (1989) |
Collected immediately after harvest or at mills; sample size, 2–5 kg |
|
Wheat foods |
1991–92 |
|
|
|
P,S, Scott (1997); A, Scott et al. (1989) |
Collected immediately after harvest or at mills; sample size, 2–5 kg |
|
|
Wheat foods |
1992–93 |
|
|
|
|||
|
Wheat foods |
1993–94 |
|
|
|
|||
|
Wheat foods |
1994–95 |
|
|
|
|||
|
Wheat foods |
1995–96 |
|
|
|
|||
|
Canada |
Beer |
1993 |
11.4c |
|
|
P,S,A, Scott et al. (1993) |
|
|
Chile |
Maize |
1995–96 |
|
|
|
P,A, Vega et al. (1998); S, Olavarría (1992) |
See Trichothecenes Appendix 6 |
|
Uruguay |
Wheat and by-products |
1993–94 |
667 |
20 |
1 |
P, Piñeiro et al. (1994, 1996), Piñeiro & Silva (1997); Piñeiro |
|
|
Barley and by-products |
1993–94 |
1200 |
24 |
10 |
(2000); S, FAO (1994), UNEP/ FAO/WHO (1988); A, Trucksess et al. (1984), Eppley et al. (1986) |
|
|
|
Uruguay |
Maize and by-products |
1993–94 |
80 |
|
1 |
P, Piñeiro et al. (1996), Piñeiro & Silva (1997), Piñeiro (2000); S, UNEP/FAO/WHO (1988); FAO (1994); A, Trucksess et al. (1984), Eppley et al. (1986) |
|
|
Uruguay |
Rice and by-products |
1993–94 |
|
1 |
|
P, Piñeiro et al. (1994,1996), Piñeiro & Silva (1997), Piñeiro (2000); S, UNEP/FAO/WHO (1988), FAO (1994); A, Trucksess et al. (1984), Eppley et al. (1986) |
|
|
Uruguay |
Wheat and by-products |
1994–95 |
844 |
58 |
13 |
P, Piñeiro et al (1996), Piñeiro & Silva (1997), Piñeiro (2000); S, UNEP/FAO/WHO (1988), FAO (1994); A, Trucksess et al. (1984), Eppley et al. (1986) |
|
|
Barley and by-products |
1994–95 |
80 |
4 |
|
|||
|
Maize and by-products |
1994–95 |
100 |
1 |
|
|||
|
Rice and by-products |
1994–95 |
152 |
2 |
|
|||
|
Wheat and by-products |
1995–96 |
440 |
6 |
|
|||
|
Barley and by-products |
1995–96 |
160 |
18 |
|
|||
|
Maize and by-products |
1995–96 |
40 |
1 |
|
|||
|
Rice and by-products |
1995–96 |
52 |
|
|
|||
|
Wheat and by-products |
1996–97 |
834 |
17 |
2 |
|||
|
Barley and by-products |
1996–97 |
319 |
18 |
2 |
|||
|
Rice and by-products |
1996–97 |
574 |
13 |
|
|||
|
Uruguay |
Wheat and by-products |
1997–98 |
769 |
34 |
6 |
P, Piñeiro (2000); S, UNEP/FAO/ WHO (1988), FAO (1994); A, Trucksess et al. (1984), Eppley et al. (1986) |
|
|
Barley and by-products |
1997–98 |
4781 |
77 |
60 |
|||
|
Maize and by-products |
1997–98 |
862 |
3 |
1 |
|||
|
Uruguay |
Rice and by-products |
1997–98 |
48 |
2 |
|
P, Piñeiro (2000); S, UNEP/FAO/ WHO (1988), FAO (1994); A, Trucksess et al. (1984), Eppley et al. (1986) |
|
|
Wheat and by-products |
1998–99 |
225 |
4 |
|
|||
|
Barley and by-products |
1998–99 |
161 |
18 |
|
|||
|
Maize and by-products |
1998–99 |
81 |
1 |
|
|||
|
Rice and by-products |
1998–99 |
|
|
|
|||
|
Wheat and by-products |
1999–2000 |
173 |
2 |
|
|||
|
Barley and by-products |
1999–2000 |
21 |
|
|
|||
|
Maize and by-products |
1999–2000 |
84 |
1 |
|
|||
|
Rice and by-products |
1999–2000 |
|
|
|
|||
|
USA |
Maize |
1989 |
|
|
|
P,S,A, Abouzied et al. (1991) |
Grain-based food products bought from retail outlets and natural-food shops (unit packages of various sizes) |
|
Wheat |
1989 |
|
|
|
|||
|
Rice |
1989 |
|
|
|
|||
|
Oats |
1989 |
|
|
|
|||
|
Wheat and oat biscuits |
1989 |
|
|
|
|||
|
Maize chips |
1989 |
|
|
|
|||
|
Popcorn |
1989 |
|
|
|
|||
|
USA |
Wheat flour muffin mix |
1989 |
|
|
|
P,S,A, Abouzied et al. (1991) |
Grain-based food products bought from retail outlets and natural-food shops (unit packages of various sizes) |
|
Maize meal |
1989 |
|
|
|
|||
|
Mixed-grain |
1989 |
|
|
|
|||
|
USA |
Wheat |
1991 |
|
|
|
P,S,A, Fernandez et al. (1994) |
Samples collected by Federal Grain Inspection, Department of Agriculture |
|
USA |
Barley |
1993 |
|
|
|
P,S, Trucksess et al. (1995); A, Veratox |
Samples collected from 25 states by Federal Grain Inspection, Department of Agriculture. Each consisted of subsamples from various sites, which were pooled and mixed; about 100 g of each composite was sent to the Food and Drug Administration for analysis. Analytical sample, 50 g |
|
Malting barley |
1993 |
|
|
|
|||
|
Hard spring wheat |
1993 |
|
|
|
|||
|
Hard winter wheat |
1993 |
|
|
|
|||
|
Mixed wheat |
1993 |
|
|
|
|||
|
Soft winter wheat |
1993 |
|
|
|
|||
|
Soft white wheat |
1993 |
|
|
|
|||
|
USA |
White flour |
1994 |
|
36 |
3 |
P,S,A, Trucksess et al. (1996) |
|
|
White flour |
1994 |
|
0 |
0 |
|||
|
White flour |
1994 |
|
105 |
25 |
|||
|
Whole-wheat flour |
1994 |
|
24 |
12 |
|||
|
Whole-wheat flour |
1994 |
|
7 |
2 |
|||
|
Whole-wheat flour |
1994 |
|
5 |
0 |
|||
|
USA |
Wheat brans |
1994 |
|
32 |
11 |
P,S,A, Trucksess et al. (1996) |
|
|
Wheat brans |
1994 |
|
1 |
0 |
|||
|
Wheat brans |
1994 |
|
49 |
9 |
|||
|
Wheat products |
1994 |
|
3 |
0 |
|||
|
Wheat products |
1994 |
|
0 |
0 |
|||
|
Wheat products |
1994 |
|
7 |
2 |
|||
|
USA |
Wheat |
1996 |
11 800 |
12 |
10 |
P,S, Hart (1998); A, Veratox |
Samples collected at three elevators and from14 trucks containing newly harvested wheat by inserting a metal probe (2 m, 3.5 cm outside diameter) at random to remove 500–800 g; 10 probes from each were bagged separately. From five trucks chosen at random, five 50-g subsamples or whole kernels were collected from each of the 10 probes, ground in a coffee grinder and analysed. The remaining grain was milled with a Romer mill at the finest setting to produce a mixture of flour and bran, and a 5–12% continous substream was extracted from the milled stream. |
|
Europe |
|||||||
|
Austria |
Maize autumn |
1996, |
|
|
|
P,S, Ellend et al. (1997); A, Weingaertner et al. (1997), Scott et al. (1986) |
Samples > 2 kg |
|
Austria |
Maize |
1996 |
|
|
|
Lew et al. (2000a); A, ELISA |
Samples of about 60 kg collected as composites, then homogenized and quartered to 6-kg samples. Ground in a home mill (1 kg) |
|
Austria |
Maize |
1996 |
1380 |
32 |
10 |
Lew et al. (2000a); A, Lew et al. (2000b) |
Samples of about 60 kg collected as composites, then homogenized and quartered to 6-kg samples. Ground in a home mill (1 kg) |
|
|
1997 |
190 |
25 |
0 |
|||
|
|
1998 |
710 |
31 |
2 |
|||
|
Austria |
Wheat |
1998 |
123 |
4 |
0 |
Lew et al. (2000a); A, Weingärtner et al. (1997) |
Samples of about 30 kg collected as composites, then homogenized and quartered to 8-kg samples. Ground in a home mill (1 kg) |
|
Bulgaria |
Wheat |
1993 |
91.5 |
3 |
0 |
P,S, Atanassov et al. (1995); A, Luo et al. (1990) |
|
|
Bulgaria |
Wheat |
1995 |
|
|
|
P,S,A, Vrabcheva et al. (1996), Ridascreen™ |
Median |
|
Finland |
Oats |
1987–88 |
|
|
|
P,S,A, Hietaniemi & Kumpulainen (1991) |
2–3-kg samples collected from Finnish State Granaries and private farmers |
|
Barley |
1987–88 |
|
|
|
|||
|
Wheat |
1987–88 |
|
|
|
|||
|
Rye |
1987–88 |
|
|
|
|||
|
Finland |
Wheat |
1998 |
57 |
2 |
0 |
P,S,A, Eskola et al. (2000a,b) |
See Trichothecenes Appendix 6 |
|
Rye |
1998 |
52 |
2 |
0 |
|||
|
Barley |
1998 |
40 |
0 |
0 |
|||
|
Oats |
1998 |
955 |
1 |
0 |
|||
|
Germany |
Bread and related products |
Jan–Jun 1998 |
|
|
|
P,S, Schollenberger et al. (1999); A, Schollenberger et al. (1998) |
Samples dried at 40 ºC and ground in a home mill(1.5 mm); 25 g taken for analysis |
|
Noodles |
|
|
|
|
|||
|
Breakfast cereals |
|
|
|
|
|||
|
Baby and infant foods |
|
|
|
|
|||
|
Rice |
|
|
|
|
|||
|
Cereal foods |
|
|
|
|
|||
|
Germany |
Wheat |
1998 |
805 |
43 |
4 |
P,S, Schollenberger et al. (2000a); A, Schollenberger et al. (1998) |
Collected at random from storage; subsamples100 g milled (1 mm);10 g taken for analysis |
|
Germany |
White wheat flour (ash content, 40–55 mg/kg) |
1999 |
|
|
|
P,S, Schollenberger et al. (2000b); A, Schollenberger et al. (1998) |
5-kg samples collected at random from stores, mixed, and 10 g taken for analysis |
|
Germany |
White wheat flour (ash content, 105 mg/kg) |
1999 |
|
|
|
P,S, Schollenberger et al. (2000b); A, Schollenberger et al. (1998) |
5-kg samples collected at random from stores, mixed, and 10 g taken for analysis |
|
White wheat flour (ash content, 160–170 mg/kg) |
1999 |
|
|
|
|||
|
Germany |
Bread, white |
1999 |
|
|
|
P,S, Schollenberger et al. (2000c); A, Schollenberger et al. (1998) |
Samples > 100 g dried at 40 ºC and ground in a home mill (1.5 mm); 10 g taken for analysis |
|
Bread, whole grain |
1999 |
||||||
|
Noodles, white flour |
1999 |
||||||
|
Noodles, whole-grain flour |
1999 |
||||||
|
Germany |
Wheat |
1987 |
|
49 |
21 |
P,S, Müller & Schwadorf (1993); A, Schwadorf & Müller (1991) |
Samples collected ran domly 1–4 weeks after harvest from farms by Governmental Advisory Board |
|
Germany |
Wheat |
1989 |
|
24 |
8 |
P,S, Müller et al. (1997a); A, Schwadorf & Müller (1991) |
Samples of 0.7–1 kg collected randomly 1–4 weeks after harvest from farms by Governmental Advisory Board |
|
Wheat |
1990 |
|
59 |
13 |
|||
|
Wheat |
1991 |
|
37 |
7 |
|||
|
Wheat |
1992 |
|
43 |
2 |
|||
|
Wheat |
1993 |
|
22 |
3 |
|||
|
Germany |
Oats |
1987 |
|
|
|
P,S, Müller et al. (1998); A, Schwadorf & Müller (1991) |
Samples of 0.7–1 kg collected randomly 1–4 weeks after harvest from farms by Governmental Advisory Board |
|
Germany |
Oats |
1989 |
|
|
|
P,S, Müller et al. (1998); A, Schwadorf & Müller (1991) |
Samples of 0.7–1 kg collected randomly 1–4 weeks after harvest from farms by Governmental Advisory Board |
|
|
Oats |
1990 |
|
|
|
|
|
|
Oats |
1991 |
|
|
|
|||
|
Oats |
1992 |
|
|
|
|||
|
Germany |
Barley |
1987 |
|
18 |
4 |
P,S, Muller et al. (1997b); A, Schwadorf & Müller (1991) |
Samples of 0.7–1 kg collected randomly 1–4 weeks after harvest from farms by Governmental Advisory Board |
|
Barley |
1989 |
|
16 |
0 |
|||
|
Barley |
1990 |
|
9 |
0 |
|||
|
Barley |
1991 |
|
4 |
0 |
|||
|
Barley |
1992 |
|
3 |
0 |
|||
|
Germany |
Rye, conventional |
1991 |
|
|
|
P,S,A, Marx et al. (1995) |
|
|
Rye, organic |
1991 |
|
|
|
|||
|
Wheat, contional |
1991 |
|
|
|
|||
|
Wheat, organic |
1991 |
|
|
|
|||
|
Germany |
Beer |
1993 |
|
|
|
P,S,A, Niessen et al. (1993) |
|
|
Beer |
1993 |
|
|
|
|||
|
Beer |
1993 |
|
|
|
|||
|
Italy, north |
Durum wheat |
1994–95 |
800 |
|
3 |
P,S, Lops et al. (1998); A, Romer Labs Inc. (1995), Vicam (1996) |
Various hybrids and varieties, 200-g laboratory samples |
|
Soft wheat |
1994–95 |
0 |
|
0 |
|||
|
Italy, north |
Soft wheat |
1998 |
72.5 |
2 |
0 |
P,S, Pascale et al. (2000a); A,Vicam (1996) |
Various hybrids and varieties, 1-kg batch; combined sample, 3 kg; analytical sample, 25 g |
|
Italy, north |
Durum wheat |
1998 |
463 |
19 |
1 |
P,S, Pascale et al. (2000a); A,Vicam (1996) |
Various hybrids and varieties, 1-kg batch; combined sample, 3 kg; analytical sample, 25 g |
|
Barley |
1998 |
|
1 |
1 |
|||
|
Triticale |
1998 |
197 |
5 |
0 |
|||
|
Soft wheat, organic |
1998 |
89 |
2 |
0 |
|||
|
Spelt wheat, organic |
1998 |
317 |
14 |
0 |
|||
|
Italy, north |
Soft wheat, organic |
1999 |
282 |
36 |
0 |
P,S, Pascale et al. (2000b); A, Vicam (1996) |
Various hybrids and varieties, 200-g laboratory |
|
Spelt wheat, organic |
1999 |
230 |
25 |
0 |
|||
|
Soft wheat |
1999 |
390 |
37 |
0 |
|||
|
Durum wheat |
1999 |
446 |
78 |
1 |
|||
|
Netherlands |
Wheat products |
1999 |
220 |
15 |
0 |
P,S,A, Spanjer (2000) |
See Trichothecenes Appendix 6 |
|
Wheat |
1999 |
640 |
49 |
3 |
|||
|
Wheat flour |
1999 |
330 |
20 |
0 |
|||
|
Maize and by-products |
1999 |
|
2 |
0 |
|||
|
Malt |
1999 |
|
0 |
0 |
|||
|
Various grains and by-products |
2000 |
128 |
32 |
0 |
|||
|
Various grains (not wheat) |
2000 |
186 |
5 |
0 |
|||
|
Norway (imported) |
Wheat |
1990 |
570 |
4 |
0 |
P,S, Langseth & Elen (1997); A, Langseth & Elen (1996) |
See Trichothecenes Appendix 6 |
|
Norway (imported) |
Wheat |
1992 |
950 |
10 |
2 |
P,S, Langseth & Elen (1997); A, Langseth & Clasen (1992) |
See Trichothecenes Appendix 6 |
|
Wheat |
1993 |
936 |
14 |
3 |
|||
|
Wheat |
1994 |
177 |
5 |
0 |
|||
|
Wheat |
1995 |
527 |
3 |
0 |
|||
|
Wheat |
1996 |
625 |
6 |
1 |
|||
|
Norway (imported) |
Wheat |
1997 |
784 |
4 |
1 |
S, Langseth (2000); P and A, Langseth (2000), Langseth et al. (2000) |
See Trichothecenes Appendix 6 |
|
Wheat |
1998 |
204 |
5 |
0 |
|||
|
Norway |
Wheat |
1990 |
215 |
50 |
0 |
P,S, Langseth & Elen (1997); A, Langseth & Elen (1996) |
See Trichothecenes Appendix 6 |
|
Wheat |
1991 |
182 |
31 |
0 |
|||
|
Norway |
Wheat |
1992 |
449 |
71 |
0 |
P,S, Langseth & Elen (1997); A, Langseth & Clasen (1992) |
See Trichothecenes Appendix 6 |
|
Wheat |
1993 |
198 |
36 |
0 |
|||
|
Wheat |
1994 |
93 |
11 |
0 |
|||
|
Wheat |
1995 |
41 |
1 |
0 |
|||
|
Wheat |
1996 |
|
|
|
|||
|
Wheat |
1997 |
28 |
0 |
0 |
|||
|
Wheat |
1998 |
0 |
0 |
0 |
|||
|
Norway (imported) |
Rye |
1990 |
46.5 |
0 |
0 |
P,S, Langseth & Elen (1997); A, Langseth & Elen (1996) |
See Trichothecenes Appendix 6 |
|
Norway (imported) |
Rye |
1993 |
51 |
0 |
0 |
P,S, Langseth & Elen (1997); A, Langseth & Clasen (1992) |
See Trichothecenes Appendix 6 |
|
Rye |
1994 |
53 |
0 |
0 |
|||
|
Rye |
1995 |
50 |
0 |
0 |
|||
|
Rye |
1996 |
|
|
|
|||
|
Norway |
Barley |
1990 |
51 |
|
|
P,S, Langseth & Elen (1997); A, Langseth & Elen (1996) |
See Trichothecenes Appendix 6 |
|
Barley |
1990 |
|
|
|
|||
|
Norway |
Oats |
1990 |
590 |
18 |
0 |
P,S,Langseth & Elen (1997); A,Langseth & Elen (1996) |
See Trichothecenes Appendix 6 |
|
Norway |
Oats |
1993 |
|
|
|
P,S, Langseth & Elen |
See Trichothecenes |
|
Oats |
1994 |
|
|
|
(1997); A, Langseth & Clasen (1992) |
Appendix 6 |
|
|
Oats |
1995 |
135 |
6 |
0 |
|||
|
Oats |
1996 |
244 |
7 |
0 |
|||
|
Norway |
Oats |
1997 |
101 |
2 |
0 |
S, Langseth (2000); P,A, Langseth (2000), Langseth et al. (2000) |
See Trichothecenes Appendix 6 |
|
Oats |
1998 |
309 |
8 |
0 |
|||
|
Oats |
1999 |
23 |
0 |
0 |
|||
|
Poland |
Wheat |
1993 |
|
1 |
0 |
P,S,A, Golinski et al. (1996) |
|
|
Russian Federation |
Wheat |
1986 |
2310 |
|
6 |
P,S,A,Tutelyan et al. (1990) |
Samples obtained from 40 grain stores in north Caucasus; subsample size, 1 kg; analytical sample, 25 g |
|
Wheat |
1987 |
1460 |
|
14 |
|||
|
Wheat |
1988 |
3800 |
|
62 |
|||
|
Russian Federation |
Wheat, freshly harvested |
1989 |
1200 |
|
|
P,S, Tutelyan (1998); A, Tutelyan et al. (1990) |
Representative 2-kg samples obtained from grain stores in 10 regions |
|
1990 |
660 |
|
|
||||
|
1991 |
650 |
|
|
||||
|
1992 |
1600 |
|
|
||||
|
1993 |
1200 |
|
|
||||
|
1994 |
180 |
|
|
||||
|
Wheat, food grain |
1989 |
440 |
|
|
|||
|
1990–91 |
0 |
|
|
||||
|
1992 |
1060 |
|
|
||||
|
1993 |
630 |
|
|
||||
|
1994 |
0 |
|
|
||||
|
Sweden |
Wheat |
1990 |
35.5 |
0 |
0 |
P,S, Pettersson (2000); A, Pettersson (1993) |
Samples of about 1 kg collected from trials and plots were dried and milled; subsamples of 20 g analysed |
|
Oats |
1990 |
65 |
3 |
0 |
|||
|
Barley |
1990 |
40 |
0 |
0 |
|||
|
Rye |
1990 |
|
0 |
0 |
|||
|
Wheat |
1991 |
43.5 |
2 |
0 |
|||
|
Oats |
1991 |
16.5 |
0 |
0 |
|||
|
Wheat |
1992 |
|
0 |
0 |
|||
|
Oats |
1992 |
|
0 |
0 |
|||
|
Wheat |
1993 |
|
0 |
0 |
|||
|
Oats |
1993 |
|
0 |
0 |
|||
|
Oats |
1994 |
269 |
18 |
0 |
|||
|
Oats |
1996 |
146 |
10 |
0 |
|||
|
Oats |
1997 |
195 |
30 |
0 |
|||
|
Oats |
1998 |
45.8 |
1 |
0 |
|||
|
Barley |
1998 |
|
1 |
0 |
|||
|
Sweden |
Wheat |
1996–98 |
173 |
7 |
1 |
P,S, Thuvander et al. (2000a,b); A, Möller & Gustavsson (1992) |
Samples of about 1 kg collected as composites at inflow of cereals to mill, during storage in mill, or in production flow. Analytical sample, 50 g |
|
Wheat |
1999 |
120 |
15 |
0 |
|||
|
Oats |
1996–98 |
42 |
0 |
0 |
|||
|
Oats |
1999 |
18.9 |
0 |
0 |
|||
|
Rye |
1996–98 |
|
0 |
0 |
|||
|
Rye |
1999 |
41 |
0 |
0 |
|||
|
United Kingdom |
Wheat |
1998 |
432 |
27 |
1 |
P,S,A, Home Grown Cereals Authority (1999) |
|
|
Wheat |
1999 |
|
52 |
0 |
|||
|
Barley |
1999 |
|
3 |
0 |
|||
|
Oats |
1999 |
|
1 |
0 |
|||
|
Asia and Australasia |
|||||||
|
China, Linxian |
Wheat |
1995 |
|
5 |
0 |
P,S, Gao & Yoshizawa (1997); A, Luo et al. (1990) |
|
|
China, Shangqiu |
Wheat |
1995 |
|
1 |
0 |
P,S, Gao & Yoshizawa (1997); A, Luo et al. (1990) |
|
|
China, Linxian |
Maize |
1995 |
|
17 |
2 |
P,S, Yoshizawa & Gao (1999); A, Luo et al. (1990) |
|
|
China, Shangqiu |
Maize |
1995 |
|
0 |
0 |
P,S, Yoshizawa & Gao (1999); A, Luo et al. (1990) |
|
|
China, Linxian |
Maize |
1997 |
|
7 |
0 |
P,S, Yoshizawa & Gao (1999); A, Luo et al. (1990) |
|
|
China, Shangqiu |
Maize |
1997 |
|
4 |
0 |
P,S, Yoshizawa & Gao (1999); A, Luo et al. (1990) |
|
|
China, Linxian |
Wheat |
1997 |
|
1 |
0 |
P,S, Yoshizawa & Gao (1999); A, Luo et al. (1990) |
|
|
China, Shangqiu |
Wheat |
1997 |
|
0 |
0 |
P,S, Yoshizawa & Gao (1999); A, Luo et al. (1990) |
|
|
China, Linqu |
Maize, raw |
1996 |
2370 |
|
5 |
P,S,A, Groves et al. (1999) |
Three households selected randomly from among those known to prepare sour pancakes in seven randomly selected villages; 5 specimens representing successive stages of processing collected in each household |
|
Maize meal |
1996 |
1560 |
|
6 |
|||
|
Cooked pancake |
1996 |
1300 |
|
3 |
|||
|
China, Anhui Province |
Wheat |
1983 |
|
|
9 |
P,S, Lu et al. (1994); |
National standard methods A,FAO/WHO (2000) for food chemistry; 15 subsamples of 100 g |
|
Wheat |
1986 |
|
|
13 |
|||
|
Wheat |
1989 |
|
|
65 |
|||
|
Wheat |
1991 |
|
|
15 |
|||
|
China |
Wheat grain summer |
1986, |
428.6 |
|
|
P, Cao et al. (1994); S, China(undated), FAO/WHO (2000) |
National standard methods for food chemistry; 15 subsamples of 100 g |
|
China |
Wheat grain |
No data |
1600 |
|
|
P,S, Guo et al. (1995); A, FAO/WHO (2000) |
National standard methods for food chemistry; 15 subsamples of 100 g |
|
China |
Wheat flour |
1988, summer |
200 |
|
|
Lu et al. (1992); S,China (undated); A, FAO/WHO (2000) |
National standard methods for food chemistry; 15 subsamples of 100 g |
|
China |
Wheat flour |
1989, autumn |
1250 |
|
|
P, Cao et al. (1994); S, China (undated); A, FAO/WHO (2000) |
National standard methods for food chemistry; 15 subsamples of 100 g |
|
China |
Wheat flour |
1989, summer |
2500 |
|
|
P, Lu et al. (1992); S,China (undated); A, FAO/WHO (2000) |
National standard methods for food chemistry; 15 subsamples of 100 g |
|
China |
Wheat flour |
1990, summer |
173 |
|
|
P, Luo & Li (1991); S,China (undated); A, FAO/WHO |
National standard methods for food chemistry; 15 |
|
Wheat flour |
1991, summer |
800 |
|
|
(2000) |
subsamples of 100 g |
|
|
China |
Wheat grain |
1996, summer |
917.9 |
|
|
P, Li (1997); S, China (undated); A, FAO/WHO (2000) |
National standard methods for food chemistry; 15 subsamples of 100 g |
|
China |
Maize kernel |
1988/? |
625 |
|
|
P, Cao et al. (1994), Guo et al. (1995); S, China (undated); A, FAO/WHO (2000) |
National standard methods for food chemistry; 15 subsamples of 100 g |
|
China |
Maize kernel |
1988, autumn |
432 |
|
|
P, Liu et al. (1992); S, GB5009; A, FAO/WHO (2000) |
National standard methods for food chemistry; 15 subsamples of 100 g |
|
China |
Maize kernel |
1989, summer |
800 |
|
|
P, Guo et al. (1995); S, GB5009; A, FAO/WHO (2000) |
National standard methods for food chemistry; 15 subsamples of 100 g |
|
China |
Maize kernel |
1989, autumn |
130 |
|
|
P, Cao et al. (1994), Liu et al. (1992), Lu et al. (1992); S, GB5009; A, FAO/WHO (2000) |
National standard methods for food chemistry; 15 subsamples of 100 g |
|
China |
Maize kernel |
1989/? |
200 |
|
|
P, Guo et al. (1995); S, GB5009; A,FAO/WHO (2000) |
National standard methods for food chemistry; 15 subsamples of 100 g |
|
China |
Maize kernel |
1990, summer |
240 |
|
|
P, Lu et al. (1992); S,GB5009; A, FAO/WHO (2000) |
National standard methods for food chemistry; 15 subsamples of 100 g |
|
China |
Maize kernel |
1990, winter |
765 |
|
|
P, Luo et al. (1991); S, GB5009; A, FAO/WHO (2000) |
National standard methods for food chemistry; 15 subsamples of 100 g |
|
China |
Maize kernel |
1991, summer |
1600 |
|
|
P, Luo et al. (1991); S, GB5009; A, FAO/WHO (2000) |
National standard methods for food chemistry; 15 subsamples of 100 g |
|
India |
Maize |
1994–97 |
|
|
|
P,S, Janardhana et al. (1999); A, Trucksess et al. (1984) |
Samples representing different cultivars collected from farmers, production plots, and regulating markets in14 districts |
|
Indonesia |
Maize |
1995 |
|
|
|
P,S,A, Ali et al. (1998) |
Samples collected from three locations 60 km apart; ground samples, 200 g; analytical samples, 20 g |
|
Indonesia |
Maize |
1992–94 |
|
|
|
P,S, Yamashita et al. (1995), A, Luo et al. (1990) |
Samples for animal and human consumption collected at random from stores of wholesalers and retailers, university farms, and local farmers |
|
Japan |
Wheat |
1989–94 |
198 |
|
|
P,S, Yoshizawa (1997), Yoshizawa & Jin (1995); A, Luo et al. (1990) |
|
|
Barley |
1989–94 |
280 |
|
|
|||
|
Japan, Hokkaido |
Wheat |
1991–92 |
554 |
31 |
5 |
P, Yoshizawa (2000); S and A, Luo et al. (1990) |
|
|
Japan |
Wheat flour |
1996–99 |
639 |
15 |
2 |
P, Yoshizawa (2000); S and A, Luo et al. (1990) |
|
|
Barley, pressed |
1996–99 |
159 |
3 |
0 |
|||
|
Barley flour, parched |
1996–99 |
0 |
1 |
0 |
|||
|
Korea, Republic of |
Barley, husked |
July 1990 |
667 |
5 |
0 |
P,S,A, Park et al. (1992) |
Samples collected from farms in four provinces |
|
Barley, naked |
July 1990 |
501 |
18 |
0 |
P,S,A, Park et al. (1992) |
|
|
|
Korea, Republic of |
Barley |
July 1990 |
152.56 |
|
|
P,S,A, Kim et al. (1993) |
Samples collected from farmers' stocks in four provinces |
|
Korea, Republic of |
Maize |
Nov 1990–91 |
202.17 |
|
|
P,S,A, Kim et al. (1993) |
Samples collected from six counties in one province |
|
Korea, Republic of |
Barley |
July 1992 |
|
|
|
P,S,A, Ryu et al. (1996) |
Samples collected from six provinces |
|
Maize |
March 1992 |
|
|
|
|||
|
Korea, Republic of |
Barley |
1993 |
|
|
|
P,S, Lee et al. (1995); |
100-g samples collected |
|
Barley |
1993 |
|
|
|
A, Kim et al. (1993) |
from five provinces |
|
|
Korea, Republic of |
Beer |
1995 |
2.7 |
|
|
P,S, Shim et al. (1997); A, Scott et al. (1993) |
|
|
New Zealand |
Maize |
1987 |
|
13 |
|
P,S, Lauren et al. (1991); A, Lauren & Agnew (1991) |
|
|
Maize |
1988 |
|
16 |
|
|||
|
Maize |
1989 |
|
16 |
|
|||
|
New Zealand |
Maize |
1992 |
2265 |
145 |
45 |
P,S, Lauren et al. (1996); A, Lauren & Agnew (1991) |
|
|
Maize |
1993 |
800 |
90 |
11 |
|||
|
Maize |
1994 |
730 |
162 |
16 |
|||
|
Papua New Guinea |
Cereals, food |
1991 |
1720 |
7 |
4 |
P,S, Yuwai et al. (1994); A, Tanaka et al. (1985) |
|
|
Philippines |
Maize |
1992–94 |
|
|
|
P,S, Yamashita et al. (1995), A, Luo et al. (1990) |
Samples for animal and human consumption collected at random from stores of wholesalers and retailers, university farms, and local farmers |
|
Thailand |
Maize |
1992–94 |
|
|
|
P,S, Yamashita et al. (1995), A, Luo et al. (1990) |
Samples for animal and human consumption collected at random from stores of wholesalers and retailers, university farms, and local farmers |
|
Viet Nam |
Maize |
1993 |
|
|
|
P,S, Wang et al. (1995); A, Tanaka et al. (1985) |
|
|
Maize powder |
1993 |
|
4 |
4 |
|||
LOQ, limit of quantification
Mean, true mean for n analytical values; the true mean is the sum Xi/n, where Xi is the value of each analytical result
References: P, parent reference; S, sampling method; A, analytical method
a Detection limit
b Mean of positives samples
c ng/ml
    See Also:
       Toxicological Abbreviations
       DEOXYNIVALENOL (JECFA Evaluation)