
INTERNATIONAL PROGRAMME ON CHEMICAL SAFETY
ENVIRONMENTAL HEALTH CRITERIA 200
COPPER
This report contains the collective views of an international group
of experts and does not necessarily represent the decisions or the
stated policy of the United Nations Environment Programme, the
International Labour Organisation, or the World Health
Organization.
First draft prepared by Dr C. Dameron and colleagues at the
National Research Centre for Environmental Toxicology, Australia,
and by Mr P.D. Howe, Institute of Terrestrial Ecology, Monks Wood,
United Kingdom
Published under the joint sponsorship of the United Nations
Environment Programme, the International Labour Organisation, and
the World Health Organization, and produced within the framework of
the Inter-Organization Programme for the Sound Management of
Chemicals.
World Health Organization
Geneva, 1998
The International Programme on Chemical Safety (IPCS),
established in 1980, is a joint venture of the United Nations
Environment Programme (UNEP), the International Labour Organisation
(ILO), and the World Health Organization (WHO). The overall
objectives of the IPCS are to establish the scientific basis for
assessment of the risk to human health and the environment from
exposure to chemicals, through international peer review processes,
as a prerequisite for the promotion of chemical safety, and to
provide technical assistance in strengthening national capacities
for the sound management of chemicals.
The Inter-Organization Programme for the Sound Management of
Chemicals (IOMC) was established in 1995 by UNEP, ILO, the Food and
Agriculture Organization of the United Nations, WHO, the United
Nations Industrial Development Organization, the United Nations
Institute for Training and Research, and the Organisation for
Economic Co-operation and Development (Participating
Organizations), following recommendations made by the 1992 UN
Conference on Environment and Development to strengthen cooperation
and increase coordination in the field of chemical safety. The
purpose of the IOMC is to promote coordination of the policies and
activities pursued by the Participating Organizations, jointly or
separately, to achieve the sound management of chemicals in
relation to human health and the environment.
WHO Library Cataloguing in Publication Data
Copper.
(Environmental health criteria ; 200)
1.Copper - adverse effects. 2.Copper - toxicity
3.Environmental exposure 4.Occupational exposure
I.International Programme on Chemical Safety II.Series
ISBN 92 4 157200 0 (NLM Classification: QV 65)
ISSN 0250-863X
The World Health Organization welcomes requests for permission
to reproduce or translate its publications, in part or in full.
Applications and enquiries should be addressed to the Office of
Publications, World Health Organization, Geneva, Switzerland, which
will be glad to provide the latest information on any changes made
to the text, plans for new editions, and reprints and translations
already available.
(c) World Health Organization 1998
Publications of the World Health Organization enjoy copyright
protection in accordance with the provisions of Protocol 2 of the
Universal Copyright Convention. All rights reserved.
The designations employed and the presentation of the material
in this publication do not imply the expression of any opinion
whatsoever on the part of the Secretariat of the World Health
Organization concerning the legal status of any country, territory,
city, or area or of its authorities, or concerning the delimitation
of its frontiers or boundaries.
The mention of specific companies or of certain manufacturers'
products does not imply that they are endorsed or recommended by
the World Health Organization in preference to others of a similar
nature that are not mentioned. Errors and omissions excepted, the
names of proprietary products are distinguished by initial capital
letters.
CONTENTS
ENVIRONMENTAL HEALTH CRITERIA FOR COPPER
1. SUMMARY AND CONCLUSIONS
1.1. Identity, physical and chemical properties
1.2. Analytical methods
1.3. Sources of human and environmental exposure
1.4. Environmental transport, distribution and transformation
1.5. Environmental levels and human exposure
1.6. Kinetics and metabolism in laboratory animals and humans
1.7. Effects on laboratory animals and in vitro test systems
1.8. Effects on humans
1.9. Effects on other organisms in the laboratory and field
1.10. Conclusions
1.10.1. Human health
1.10.2. Environmental effects
2. IDENTITY, PHYSICAL AND CHEMICAL PROPERTIES AND ANALYTICAL
METHODS
2.1. Identity
2.2. Physical and chemical properties
2.3. Analytical methods
2.3.1. Sampling and sample preparation
2.3.1.1 Sampling
2.3.1.2 Separation and concentration
2.3.1.3 Sample preparation
2.3.1.4 "Clean" techniques for measurement
of ultratrace copper levels
2.3.2. Detection and measurement
2.3.2.1 Gravimetric and colorimetric methods
2.3.2.2 Atomic absorption, emission and mass
spectrometry methods
2.3.2.3 Specialized methodologies
2.4. Speciation
2.4.1. Speciation in water and sediments
2.4.1.1 Detection and quantification
2.4.2. Speciation in biological matrices
3. SOURCES OF HUMAN AND ENVIRONMENTAL EXPOSURE
3.1. Natural sources
3.2. Anthropogenic sources
3.2.1. Production levels and processes
3.3. Copper use
4. ENVIRONMENTAL TRANSPORT AND DISTRIBUTION
4.1. Transport and distribution between media
4.1.1. Air
4.1.2. Water and sediment
4.1.3. Soil
4.1.4. Sewage sludge inputs to land
4.1.5. Biodegradation and abiotic degradation
4.2. Bioaccumulation
4.2.1. Microorganisms
4.2.2. Aquatic plants
4.2.3. Aquatic invertebrates
4.2.4. Fish
4.2.5. Terrestrial plants
4.2.6. Terrestrial invertebrates
4.2.7. Terrestrial mammals
5. ENVIRONMENTAL LEVELS AND HUMAN EXPOSURE
5.1. Environmental levels
5.1.1. Air
5.1.2. Water and sediment
5.1.3. Soil
5.1.4. Biota
5.1.4.1 Aquatic
5.1.4.2 Terrestrial
5.2. General population exposure
5.2.1. Air
5.2.2. Food and beverages
5.2.3. Drinking-water
5.2.3.1 Organoleptic characteristics
5.2.3.2 Copper concentrations in
drinking-water
5.2.4. Miscellaneous exposures
5.3. Occupational exposures
5.4. Total human intake of copper from all environmental
pathways
6. KINETICS AND METABOLISM IN LABORATORY ANIMALS AND HUMANS
6.1. Essentiality
6.2. Homoeostasis
6.2.1. Cellular basis of homoeostasis
6.2.2. Absorption in animals and humans
6.2.3. Transport, distribution and storage
6.2.4. Excretion
6.3. Methods of studying homoeostasis
6.3.1. Analytical methods
6.3.2. Intake
6.3.3. Diet
6.3.4. Balance studies
6.4. Biochemical basis of copper toxicity
6.5. Interactions with other dietary components
6.5.1. Protein and amino acids
6.5.2. Phytate and fibre
6.5.3. Ascorbic acid
6.5.4. Zinc
6.5.5. Iron
6.5.6. Carbohydrates
6.5.7. Infant diets
6.5.8. Other interactions (molybdenum, manganese,
selenium)
7. EFFECTS ON LABORATORY MAMMALS AND IN VITRO TEST SYSTEMS
7.1. Single exposure
7.1.1. Oral
7.1.2. Dermal
7.1.3. Inhalation
7.2. Short-term exposure
7.2.1. Oral
7.2.2. Inhalation
7.2.2.1 Copper(II) sulfate
7.2.2.2 Copper chloride
7.3. Repeated exposure: subchronic toxicity
7.3.1. Oral
7.3.1.1 Copper(II) sulfate
7.3.1.2 Copper chloride
7.4. Long-term exposure chronic toxicity or carcinogenicity
7.5. Reproductive and developmental toxicity
7.6. Mutagenicity and related end-points
7.6.1. Copper sulfate
7.6.1.1 In vitro
7.6.1.2 In vivo
7.6.2. Other copper compounds
7.6.2.1 In vitro
7.7. Other studies
7.7.1. Neurotoxicity
7.7.1.1 Copper sulfate
7.7.1.2 Copper chloride
7.7.2. Immunotoxicity
7.7.2.1 Copper(II) sulfate
7.8. Biochemical mechanisms of toxicity
8. EFFECTS ON HUMANS
8.1. General population: copper deficiency and toxicity
8.2. Copper deficiency
8.2.1. Clinical manifestations of copper deficiency
8.2.2. Biological indicators of copper deficiency:
balance studies
8.3. Toxicity of copper in humans
8.3.1. Single exposure
8.3.2. Repeated oral exposures
8.3.2.1 Gastrointestinal and hepatic effects
8.3.2.2 Reproduction and development
8.3.2.3 Cancer
8.3.3. Dermal exposure
8.4. Disorders of copper homoeostasis: populations at risk
8.4.1. Menkes disease
8.4.2. Wilson disease
8.4.3. Hereditary aceruloplasminaemia
8.4.4. Indian childhood cirrhosis
8.4.5. Idiopathic copper toxicosis, or non-Indian
childhood cirrhosis
8.4.6. Chronic liver diseases
8.4.7. Copper in infancy
8.4.8. Malabsorption syndromes
8.4.9. Parenteral nutrition
8.4.10. Haemodialysis patients
8.4.11. Cardiovascular diseases
8.5. Occupational exposure
9. EFFECTS ON OTHER ORGANISMS IN THE LABORATORY AND FIELD
9.1. Bioavailability
9.1.1. Bioavailability in water
9.1.1.1 Predicting effects of copper on fish
gill function
9.1.2. Bioavailability of metals in sediments
9.2. Essentiality
9.2.1. Animals
9.2.2. Plants
9.2.2.1 Aquatic plants
9.2.2.2 Terrestrial plants
9.3. Toxic effects: laboratory experiments
9.3.1. Microorganisms
9.3.1.1 Water
9.3.1.2 Soil
9.3.2. Aquatic organisms
9.3.2.1 Plants
9.3.2.2 Invertebrates
9.3.2.3 Vertebrates
9.3.2.4 Model ecosystems and community
effects
9.3.3. Terrestrial organisms
9.3.3.1 Plants
9.3.3.2 Invertebrates
9.3.3.3 Vertebrates
9.4. Field observations
9.4.1. Microorganisms
9.4.2. Aquatic organisms
9.4.3. Terrestrial organisms
9.4.3.1 Tolerance
9.4.3.2 Copper fungicides and fertilizers
10. EVALUATION OF HUMAN HEALTH RISKS AND EFFECTS ON THE ENVIRONMENT
10.1. Concepts and principles to assess risk of adverse effects
of essential elements such as copper
10.1.1. Human health risks
10.1.2. Homoeostatic model
10.2. Evaluation of risks to human health
10.2.1. Exposure of general population
10.2.2. Occupational exposures
10.3. Essentiality versus toxicity in humans
10.3.1. Risk of copper deficiency
10.3.2. Risk from excess copper intake
10.3.2.1 General population
10.3.2.2 Occupational risks
10.4. Evaluation of effects on the environment
10.4.1. Concept of environmental risk assessment
10.4.2. Components of risk assessment process
for copper
10.5. Environmental risk assessment for copper
10.5.1. Aquatic biota
10.5.1.1 Overview of exposure data
10.5.1.2 Overview of toxicity data
10.5.2. Terrestrial biota
10.5.2.1 Overview of exposure data
10.5.2.2 Plant foliar levels
10.5.2.3 Assessment of toxicity of copper in
soil
11. CONCLUSIONS AND RECOMMENDATIONS FOR PROTECTION OF HUMAN HEALTH
AND THE ENVIRONMENT
11.1. Human health
11.2. Environmental protection
12. FURTHER RESEARCH
12.1. Health protection
12.2. Environmental protection
13. PREVIOUS EVALUATIONS BY INTERNATIONAL BODIES
REFERENCES
RESUME ET CONCLUSIONS
RESUMEN Y CONCLUCIONES
NOTE TO READERS OF THE CRITERIA MONOGRAPHS
Every effort has been made to present information in the criteria
monographs as accurately as possible without unduly delaying their
publication. In the interest of all users of the Environmental Health
Criteria monographs, readers are requested to communicate any errors
that may have occurred to the Director of the International Programme
on Chemical Safety, World Health Organization, Geneva, Switzerland, in
order that they may be included in corrigenda.
* * *
A detailed data profile and a legal file can be obtained from the
International Register of Potentially Toxic Chemicals, Case postale
356, 1219 Châtelaine, Geneva, Switzerland (telephone no. + 41
22 - 9799111, fax no. + 41 22 - 7973460, E-mail irptc@unep.ch).
* * *
This publication was made possible by grant number
5 U01 ES02617-15 from the National Institute of Environmental Health
Sciences, National Institutes of Health, USA, and by financial support
from the European Commission.
Environmental Health Criteria
PREAMBLE
Objectives
In 1973 the WHO Environmental Health Criteria Programme was
initiated with the following objectives:
(i) to assess information on the relationship between exposure to
environmental pollutants and human health, and to provide
guidelines for setting exposure limits;
(ii) to identify new or potential pollutants;
(iii) to identify gaps in knowledge concerning the health effects of
pollutants;
(iv) to promote the harmonization of toxicological and epidemio
logical methods in order to have internationally comparable
results.
The first Environmental Health Criteria (EHC) monograph, on
mercury, was published in 1976 and since that time an ever-increasing
number of assessments of chemicals and of physical effects have been
produced. In addition, many EHC monographs have been devoted to
evaluating toxicological methodology, e.g., for genetic, neurotoxic,
teratogenic and nephrotoxic effects. Other publications have been
concerned with epidemiological guidelines, evaluation of short-term
tests for carcinogens, biomarkers, effects on the elderly and so
forth.
Since its inauguration the EHC Programme has widened its scope,
and the importance of environmental effects, in addition to health
effects, has been increasingly emphasized in the total evaluation of
chemicals.
The original impetus for the Programme came from World Health
Assembly resolutions and the recommendations of the 1972 UN Conference
on the Human Environment. Subsequently the work became an integral
part of the International Programme on Chemical Safety (IPCS), a
cooperative programme of UNEP, ILO and WHO. In this manner, with the
strong support of the new partners, the importance of occupational
health and environmental effects was fully recognized. The EHC
monographs have become widely established, used and recognized
throughout the world.
The recommendations of the 1992 UN Conference on Environment and
Development and the subsequent establishment of the Intergovernmental
Forum on Chemical Safety with the priorities for action in the six
programme areas of Chapter 19, Agenda 21, all lend further weight to
the need for EHC assessments of the risks of chemicals.
Scope
The criteria monographs are intended to provide critical reviews
on the effect on human health and the environment of chemicals and of
combinations of chemicals and physical and biological agents. As
such, they include and review studies that are of direct relevance for
the evaluation. However, they do not describe every study carried
out. Worldwide data are used and are quoted from original studies,
not from abstracts or reviews. Both published and unpublished reports
are considered and it is incumbent on the authors to assess all the
articles cited in the references. Preference is always given to
published data. Unpublished data are only used when relevant
published data are absent or when they are pivotal to the risk
assessment. A detailed policy statement is available that describes
the procedures used for unpublished proprietary data so that this
information can be used in the evaluation without compromising its
confidential nature (WHO (1990) Revised Guidelines for the Preparation
of Environmental Health Criteria Monographs. PCS/90.69, Geneva, World
Health Organization).
In the evaluation of human health risks, sound human data,
whenever available, are preferred to animal data. Animal and in
vitro studies provide support and are used mainly to supply evidence
missing from human studies. It is mandatory that research on human
subjects is conducted in full accord with ethical principles,
including the provisions of the Helsinki Declaration.
The EHC monographs are intended to assist national and
international authorities in making risk assessments and subsequent
risk management decisions. They represent a thorough evaluation of
risks and are not, in any sense, recommendations for regulation or
standard setting. These latter are the exclusive purview of national
and regional governments.
Content
The layout of EHC monographs for chemicals is outlined below.
* Summary -- a review of the salient facts and the risk evaluation
of the chemical
* Identity -- physical and chemical properties, analytical methods
* Sources of exposure
* Environmental transport, distribution and transformation
* Environmental levels and human exposure
* Kinetics and metabolism in laboratory animals and humans
* Effects on laboratory mammals and in vitro test systems
* Effects on humans
* Effects on other organisms in the laboratory and field
* Evaluation of human health risks and effects on the environment
* Conclusions and recommendations for protection of human health
and the environment
* Further research
* Previous evaluations by international bodies, e.g., IARC, JECFA,
JMPR
Selection of chemicals
Since the inception of the EHC Programme, the IPCS has organized
meetings of scientists to establish lists of priority chemicals for
subsequent evaluation. Such meetings have been held in: Ispra, Italy,
1980; Oxford, United Kingdom, 1984; Berlin, Germany, 1987; and North
Carolina, USA, 1995. The selection of chemicals has been based on the
following criteria: the existence of scientific evidence that the
substance presents a hazard to human health and/or the environment;
the possible use, persistence, accumulation or degradation of the
substance shows that there may be significant human or environmental
exposure; the size and nature of populations at risk (both human and
other species) and risks for environment; international concern, i.e.
the substance is of major interest to several countries; adequate data
on the hazards are available.
If an EHC monograph is proposed for a chemical not on the
priority list, the IPCS Secretariat consults with the Cooperating
Organizations and all the Participating Institutions before embarking
on the preparation of the monograph.
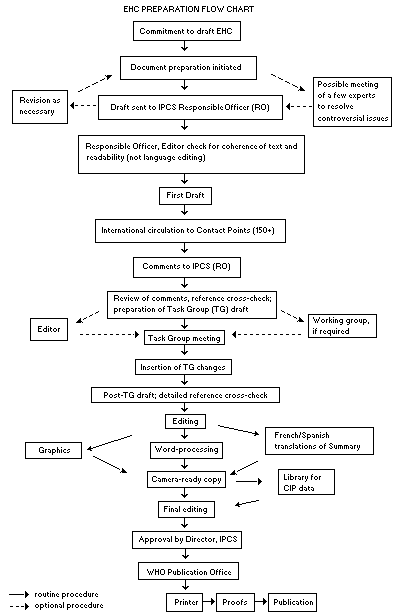
Procedures
The order of procedures that result in the publication of an EHC
monograph is shown in the flow chart. A designated staff member of
IPCS, responsible for the scientific quality of the document, serves
as Responsible Officer (RO). The IPCS Editor is responsible for
layout and language. The first draft, prepared by consultants or,
more usually, staff from an IPCS Participating Institution, is based
initially on data provided from the International Register of
Potentially Toxic Chemicals, and reference data bases such as Medline
and Toxline.
The draft document, when received by the RO, may require an
initial review by a small panel of experts to determine its scientific
quality and objectivity. Once the RO finds the document acceptable as
a first draft, it is distributed, in its unedited form, to well over
150 EHC contact points throughout the world who are asked to comment
on its completeness and accuracy and, where necessary, provide
additional material. The contact points, usually designated by
governments, may be Participating Institutions, IPCS Focal Points, or
individual scientists known for their particular expertise. Generally
some four months are allowed before the comments are considered by the
RO and author(s). A second draft incorporating comments received and
approved by the Director, IPCS, is then distributed to Task Group
members, who carry out the peer review, at least six weeks before
their meeting.
The Task Group members serve as individual scientists, not as
representatives of any organization, government or industry. Their
function is to evaluate the accuracy, significance and relevance of
the information in the document and to assess the health and
environmental risks from exposure to the chemical. A summary and
recommendations for further research and improved safety aspects are
also required. The composition of the Task Group is dictated by the
range of expertise required for the subject of the meeting and by the
need for a balanced geographical distribution.
The three cooperating organizations of the IPCS recognize the
important role played by nongovernmental organizations.
Representatives from relevant national and international associations
may be invited to join the Task Group as observers. While observers
may provide a valuable contribution to the process, they can only
speak at the invitation of the Chairperson. Observers do not
participate in the final evaluation of the chemical; this is the sole
responsibility of the Task Group members. When the Task Group
considers it to be appropriate, it may meet in camera.
All individuals who as authors, consultants or advisers
participate in the preparation of the EHC monograph must, in addition
to serving in their personal capacity as scientists, inform the RO if
at any time a conflict of interest, whether actual or potential, could
be perceived in their work. They are required to sign a conflict of
interest statement. Such a procedure ensures the transparency and
probity of the process.
When the Task Group has completed its review and the RO is
satisfied as to the scientific correctness and completeness of the
document, it then goes for language editing, reference checking, and
preparation of camera-ready copy. After approval by the Director,
IPCS, the monograph is submitted to the WHO Office of Publications for
printing. At this time a copy of the final draft is sent to the
Chairperson and Rapporteur of the Task Group to check for any errors.
It is accepted that the following criteria should initiate the
updating of an EHC monograph: new data are available that would
substantially change the evaluation; there is public concern for
health or environmental effects of the agent because of greater
exposure; an appreciable time period has elapsed since the last
evaluation.
All Participating Institutions are informed, through the EHC
progress report, of the authors and institutions proposed for the
drafting of the documents. A comprehensive file of all comments
received on drafts of each EHC monograph is maintained and is
available on request. The Chairpersons of Task Groups are briefed
before each meeting on their role and responsibility in ensuring that
these rules are followed.
 WHO TASK GROUP ON ENVIRONMENTAL HEALTH CRITERIA FOR COPPER
Members
Professor D. Culver, retired from Department of Medicine, University
of Califomia, Califorma, USA
Professor H. Dieter, Institute for Water, Soil and Air Hygiene,
Federal Enviromnent Agency, Berlin, Germany
Dr R. Erickson, US Environniental Protection Agency, Duluth,
Minnesota, USA
Dr G.S. Fell, Department of Pathological Biochemistry, University
of Glasgow, Glasgow Royal Infirmary, Glasgow, Scotland
Dr J. Fitzgerald, Environmental Health Branch, Public and
Envircumental Health Service, South Australian Health Commission,
Rundle Mall, Adelaide, South Australia, Australia
Dr T.M. Florence, Centre for Environmental Health Sciences, Oyster
Bay, New South Wales, Australia
Professor J.L. Gollan, Brigham and Women's Hospital, Harvard Medical
School, Gastroenterology Division, Boston, Massachusetts, USA
Dr R.A. Goyer, University of Western Ontario, Chapel Hill, North
Carolina, USA ( Chairman)
Professor T.C. Hutchinson, Trent University, Environmental and
Resource Studies Program, Peterborough, Ontario, Canada
Ms M.E. Meek, Health Protection Branch, Environmental Health
Directorate, Health Canada, Ottawa, Ontario, Canada
Professor MR. Moore, National Research Centre for Environmental
Toxicology, The University of Queensland, Coopers Plains,
Queensland, Australia ( Co-Vice-Chairman)
Professer A. Oskarsson, Department of Food Hygiene, Faculty of
Veterinary Medicine, Swedish University of Agricultural Sciences,
Uppsala, Sweden
Dr S. Sethi, Department of Pathology, Lady Hardinge Medical College
and S.M.T. Sucheta Kripalani Hospital, New Delhi, India
Dr K.H. Summer, National Research Centre for Environment and
Health, Institute of Toxicology, Neuherberg, Germany
Dr J.H.M. Terninink, Department of Toxicology, Wageningen Agricultural
University, Wageningen, The Netherlands ( Co-Vice-Chairman)
Dr R. Uauy, University of Chile, Santiago, Chile
Dr J.M. Weeks, Institute of Terrestrial Ecology, Monks Wood,
Abbots Ripton, Huntingdon, Cambridgeshire, United Kingdom
Observers
Dr W.J. Adams, Kennecott Utah Copper, Magna, Utah, USA (Representing
ICA)
Dr K. Bentley, Department of Health and Family Services, Environmental
Health Policy, Canberra, Australia
Dr K.J. Buckett, Environmental Health Service, Health Department
of Western Australia, Perth, Western Australia, Australia
Professor J.C. Castilla, Ecology Department, Faculty of Biological
Sciences, Pontificia Universidad Catolica de Chile, Santiago, Chile
(Representing the Chilean Govemment)
Dr C. Fortin, Commercial Chemicals Evaluation Branch, Environment
Canada, Ottawa, Ontario, Canada
Dr R. Gaunt, RTZ Ltd, London, United Kingdom (Representing the
European Centre for Ecotoxicology and Toxicology of Chemicals)
Mr M. Thierry Gerschel, Trefîmetaux, Courbevoie, France (Eurometaux)
Dr P. Imray, Environmental Health Branch, Queensland Health,
Brisbane, Queensland, Australia
Mr C.M. Lee, International Copper Association, New York, USA
Dr E.V. Ohanian, Health and Ecological Criteria Division, Office of
Water, US Environinental Protection Agency, Washington, DC, USA
Dr J.-P. Robin, Noranda Metallurgy lue., Occupational Health & Safety,
McGill College, Montreal, Quebec, Canada (Representing ICME)
Secretariat
Dr G.C. Becking, International Programme on Chemical Safety
Inter-regional Research Unit, World Health Organization, Research
Triangle Park, North Carolina, USA ( Secretary)
Mr P. Callan, Departrnent of Health and Family Services, Environmental
Health Policy, Canberra, Australia) ( Co-rapporteur)
Dr C. Dameron, National Research Centre for Environmental Toxicology,
The University of Queensland, Coopers Plains, Queensland, Australia
Mr P.D. Howe, Institute of Terrestrial Ecology, Monks Wood, Abbots
Ripton, Huntingdon, Cambridgeshire, United Kingdom ( Co-rapporteur)
Dr L. Tomaska, Australian and New Zealand Food Authority, Canberra,
Australia ( Co-rapporteur)
WHO TASK GROUP ON ENVIRONMENTAL HEALTH CRITERIA FOR COPPER
A WHO Task Group on Enviromnental Health Criteria for Copper met
in Brisbane, Australia, from 24 to 28 June 1996. The meeting was
sponsored by a consortium of Australian Commonwealth and State
Govemments through a national steering committee chaired by Dr K.
Bentley, Director, Health and Envirorimentai Policy, Deparünent of
Health and Family Services, Canberra. ne meeting was co-hosted and
organized by the Department of Health and Family Services,
Commonwealth of Australia, the Queensland Depariments of Health,
Environment and Heritage, and the National Research Centre for
Environmental Toxicology. Participants were welcorned by Dr G.R.
Neville, Principal Medical Adviser, Queensland Health on behalf of the
host organizations. In opening the meeting, Dr G.C. Becking, on behalf
of Dr M. Mercier, Director of the IPCS and the three cooperating
organizations (UNEP/ILO/WHO), thanked the Australian Commonwealth and
State Govemments for their longstanding generous support in providing
funding for this Task Group as well as several previous IPCS Task
Groups and consultations over the last four years. lie thanked the
Staff of Queensland Health and the National Research Centre for
Environmental Toxicology for their excellent work in organizing the
Task Group for Copper. The Task Group reviewed and revised the draft
criteria monograph, and made an evaluation of the risks to human
heaith and the enviromnent from exposure to copper.
The first draft of this monograph was prepared by Dr C, Dameron
and colleagues at the National Research Centre for Environmental
Toxicology, Australia, and by Mr P.D. Howe, Institute of Terrestrial
Ecology, Monks Wood, United Kingdom. The Task Group draft,
incorperating the comments received fiom the IPCS Contact Points for
Enviromnental Health Criteria monographs, was prepared by Mr P.D. Howe
and the Secretariat.
Dr G.C. Becking (IPCS Central Unit, Interregional Research Unit)
and Ms K. Lyle (Sheffield, England) were responsible for the overall
scientific content and technical editing, respectively, of this
moriograph.
The efforts of all who helped in the preparation and
finalization of this publication are gratefully acknowledged.
ABBREVIATIONS
AAS atomic absorption spectroscopy
ALAD aminolaevulinic acid dehydratase
ALAT alanine aminotransferase
AROI acceptable range of oral intake
ASAT aspartate arninotransferase
ASV anodic stripping voltammetry
AVS acid volatile suffides
CEC cation exchange capacity
CNS central nervous system
CSV cathodic stripping voltarrimetry
CTMAX critical thermal maxima
DT-OCEE deficiency toxicity optimum concentration for essential
elements
EDTA ethylene diamine tetraacetic acid
EPA Enviromnental Protection Agency (USA)
ER endoplasmic reticulum
FI-AAS flow-injection atornic absorption spectroscopy
GF-AAS graphite fumace atomic absorption spectroscopy
GLC gas liquid chromatography
GLC-MS gas liquid chromatography-mass spectrorrietry
HDL high density lipoprotein
HPLC high performance liquid chromatography
IC ion chrornatography
ICC Indian childhood cirrhosis
ICP-AES inductively coupled plasma-atornic emission spectroscopy
ICP-ES inductively coupled plasrna-emission Spectroscopy
ICP-MS inductively coupled plasma-mass spectrometry
ICT idiopathic copper toxicosis
LBW low birth weight
LDL low density lipoprotein
LEC Long-Evans Cinnamon (rat)
LOEC lowest-observed-effect concentration
MATC maximum acceptable toxicant concentration
MRE metal responsive element
NMR nuelcar magnetic resonance
NOAEL no-observed-adverse-effect level
NOEC no-observed-effect concentration
NOEL no-observed-effect level
NTA nitrilotriacetic acid
OCEE optimal concentration of essential elements
PIXE proton-induced X-ray fluorescence - PTDI
provisional tolerable daily intake
RER rough endoplasmic reticulum
SAAM standard algal assay medium
SER smooth endopiasmic reticulurn
SOD superoxide dismutase
TIMS thermal ionization mass spectrometry
UV ultraviolet
XRF X-ray fluorescence
1. SUMMARY AND CONCLUSIONS
1.1 Identity, physical and chemical properties
Copper is a reddish-brown, ductile and malleable metal. It
belongs to group IB of the Periodic Table. In compounds found in the
environment it usually has a valence of 2 but can exist in the
metallic, +1 and +3 valence states. Copper is found naturally in a
wide variety of mineral salts and organic compounds, and in the
metallic form. The metal is sparingly soluble in water, salt or
mildly acidic solutions, but can be dissolved in nitric and sulfuric
acids as well as basic solutions of ammonium hydroxide or carbonate.
Copper possesses high electrical and thermal conductivity and
resists corrosion.
1.2 Analytical methods
The wide range of copper species, inorganic and organic, has led
to the development of an array of sampling techniques, preparation and
analytical methods to quantify the element in environmental and
biological samples. Contamination of the samples with copper from
air, dusts, vessels or reagents during sampling and preparation is a
major source of analytical errors, and "clean" techniques are
essential.
Colorimetric and gravimetric methods for the measurement of
copper are simple to use and are inexpensive; however, their
usefulness is limited to situations where extreme sensitivity is not
essential. For measurement of low concentrations of copper in various
matrices, atomic absorption spectrophotometric (AAS) methods are the
most widely used. A dramatic increase in sensitivity is obtained by
the utilization of graphite furnace atomic absorption
spectrophotometry (GF-AAS) rather than flame AAS. Depending upon
sample pretreatment, separation and concentration procedures,
detection limits of about 1 µg/litre in water by GF-AAS and 20
µg/litre by AAS have been reported and levels of 0.05-0.2 µg/g of
tissue have been detected by GF-AAS. Greater sensitivities can be
achieved through the use of emission techniques such as high
temperature inductively coupled argon plasma techniques followed by
atomic emission spectroscopy (ICP-AES) or a mass spectrometer
(ICP-MS). Other more sensitive and specialized methodologies are
available such as X-ray fluorescence, ion-selective electrodes and
potentiometric methods, and anodic stripping and cathodic stripping
voltametry.
1.3 Sources of human and environmental exposure
Natural sources of copper exposure include windblown dust,
volcanoes, decaying vegetation, forest fires and sea spray.
Anthropogenic emissions include smelters, iron foundries, power
stations and combustion sources such as municipal incinerators. The
major release of copper to land is from tailings and overburdens from
copper mines and sewage sludge. Agricultural use of copper products
accounts for 2% of copper released to soil.
Copper ores are mined, smelted and refined to produce many
industrial and commercial products. Copper is widely used in cooking
utensils and water distribution systems, as well as fertilizers,
bactericides, fungicides, algicides and antifouling paints. It is
also used in animal feed additives and growth promoters, as well as
for disease control in livestock and poultry. Copper is used in
industry as an activator in froth flotation of sulfide ores,
production of wood preservatives, electroplating, azo-dye manufacture,
as a mordant for textile dyes, in petroleum refining and the
manufacture of copper compounds.
1.4 Environmental transport, distribution and transformation
Copper is released to the atmosphere in association with
particulate matter. It is removed by gravitational settling, dry
deposition, washout by rain and rainout. Removal rate and distance
travelled from the source depend on source characteristics, particle
size and wind velocity.
Copper is released to water as a result of natural weathering of
soil and discharges from industries and sewage treatment plants.
Copper compounds may also be intentionally applied to water to kill
algae. Several processes influence the fate of copper in the aqueous
environment. These include complex formation, sorption to hydrous
metal oxides, clays and organic materials, and bioaccumulation.
Information on the physicochemical forms of copper (speciation) is
more informative than total copper concentrations. Much of the copper
discharged to water is in particulate form and tends to settle out,
precipitate out or be adsorbed by organic matter, hydrous iron,
manganese oxides and clay in the sediment or water column. In the
aquatic environment the concentration of copper and its
bioavailability depend on factors such as water hardness and
alkalinity, ionic strength, pH and redox potential, complexing
ligands, suspended particulate matter and carbon, and the interaction
between sediments and water.
The largest release of copper is to land; the major sources of
release are mining operations, agriculture, solid waste and sludge
from treatment works. Most copper deposited in soil is strongly
adsorbed and remains in the upper few centimetres of soil. Copper
adsorbs to organic matter, carbonate minerals, clay minerals, hydrous
iron and manganese oxides. The greatest amount of leaching occurs from
sandy acidic soils. In the terrestrial environment a number of
important factors influence the fate of copper in soil. These include
the nature of the soil itself, pH, presence of oxides, redox
potential, charged surfaces, organic matter and cation exchange.
Bioaccumulation of copper from the environment occurs if the
copper is biologically available. Accumulation factors vary greatly
between different organisms, but tend to be higher at lower exposure
concentrations. Accumulation may lead to exceptionally high body
burdens in certain animals (such as bivalves) and terrestrial plants
(such as those growing on contaminated soils). However, many
organisms are capable of regulating their body copper concentration.
1.5 Environmental levels and human exposure
The concentration of copper in air depends on the proximity of
the site to major sources such as smelters, power plants and
incinerators. Copper is widely distributed in water because it is a
naturally occurring element. However, care must be taken when
interpreting copper concentrations in the aquatic environment. In
aquatic systems the environmental levels of copper are usually
measured as either total or dissolved concentrations, with the latter
being more representative of the bioavailability of the metal.
Average background concentrations of copper in air in rural areas
range from 5 to 50 ng/m3. Copper levels in seawater of 0.15 µg/litre
and in fresh water of 1-20 µg/litre are found in uncontaminated areas.
Sediment is an important sink and reservoir for copper. Background
levels of copper in natural freshwater sediments range from 16 to 5000
mg/kg (dry weight). Copper levels in marine sediments range from 2 to
740 mg/kg (dry weight). In anoxic sediments copper is bound strongly
by sulfide and therefore not bioavailable. Median copper
concentrations in uncontaminated soil were reported to be 30 mg/kg
(range 2-250 mg/kg). Copper is accumulated by plants, invertebrates
and fish. Higher concentrations of copper have been reported in
organisms from copper-contaminated sites than in those from
non-contaminated sites.
For healthy, non-occupationally-exposed humans the major route of
exposure to copper is oral. The mean daily dietary intake of copper
in adults ranges between 0.9 and 2.2 mg. A majority of studies have
found intakes to be at the lower end of that range. The variation
reflects different dietary habits as well as different agricultural
and food processing practices used worldwide. In some cases,
drinking-water may make a substantial additional contribution to the
total daily intake of copper, particularly in households where
corrosive waters have stood in copper pipes. In homes without copper
piping or with noncorrosive water, copper intake from drinking-water
seldom exceeds 0.1 mg/day, although intakes greater than a few mg per
day can result from corrosive water distributed through copper pipes.
In general, total daily oral intakes of copper (food plus
drinking-water) are between 1 and 2 mg/day, although they may
occasionally exceed 5 mg/day. All other intakes of copper (inhalation
and dermal) are insignificant in comparison to the oral route.
Inhalation adds 0.3-2.0 µm/day from dusts and smoke. Women using
copper IUDs are exposed to only 80 µg or less of copper per day from
this source.
1.6 Kinetics and metabolism in laboratory animals and humans
The homoeostasis of copper involves the dual essentiality and
toxicity of the element. Its essentiality arises from its specific
incorporation into a large number of proteins for catalytic and
structural purposes. The cellular pathways of uptake, incorporation
into protein and export of copper are conserved in mammals and
modulated by the metal itself.
Copper is mainly absorbed through the gastrointestinal tract.
From 20 to 60% of the dietary copper is absorbed, with the rest being
excreted through the faeces. Once the metal passes through the
basolateral membrane it is transported to the liver bound to serum
albumin. The liver is the critical organ for copper homoeostasis.
The copper is partitioned for excretion through the bile or
incorporation into intra- and extracellular proteins. The primary
route of excretion is through the bile. The transport of copper to
the peripheral tissues is accomplished through the plasma attached to
serum albumin, ceruloplasmin or low-molecular-weight complexes.
The methods used to study copper homoeostasis in mammals include
dietary analyses and balance studies. Isotope and standardized
biochemical analyses of these processes are essential to understand
copper deficiency and excess.
The biochemical toxicity of copper, when it exceeds homoeostatic
control, is derived from its effects on the structure and function of
biomolecules such as DNA, membranes and proteins directly or through
oxygen-radical mechanisms.
1.7 Effects on laboratory animals and in vitro test systems
The toxicity of a single oral dose of copper varies widely
between species (LD50 range 15-1664 mg Cu/kg body weight). The more
soluble salts (copper(II) sulfate, copper(II) chloride) are generally
more toxic than the less soluble salts (copper(II) hydroxide,
copper(II) oxide). Death is preceded by gastric haemorrhage,
tachycardia, hypotension, haemolytic crisis, convulsions and
paralysis. LD50 values for dermal exposure were reported at > 1124
and > 2058 mg Cu/kg body weight in rats and rabbits respectively.
The inhalation LC50 (exposure duration unspecified) was > 1303 mg
Cu/kg body weight in rabbits, and respiratory function was impaired in
guinea-pigs exposed to 1.3 mg Cu/m3 for 1 h.
Rats given up to 305 mg Cu/kg per day orally in the diet as
copper(II) sulfate for 15 days showed alterations in blood
biochemistry and haematology (particularly anaemia) and adverse
effects on the liver, kidney and lungs. Effects were qualitatively
similar with other copper compounds and in other species. The
no-observed-effect level (NOEL) in this study was 23 mg Cu/kg body
weight per day. However, sheep were particularly sensitive and
repeated doses of 1.5-7.5 mg Cu/kg body weight per day as copper(II)
sulfate or copper(II) acetate resulted in progressive liver damage,
haemolytic crisis and ultimately death.
Long-term exposure in rats and mice showed no overt signs of
toxicity other than a dose-related reduction in growth after ingestion
of 138 mg Cu/kg body weight per day (rats) and 1000 mg Cu/kg body
weight per day (mice). The no-observed-adverse-effect level (NOAEL)
was 17 mg Cu/kg body weight per day in rats, and 44 and 126 mg Cu/kg
body weight per day in male and female mice, respectively. The effects
included inflammation of the liver and degeneration of kidney tubule
epithelium.
Studies of reproductive and developmental toxicity were limited.
Some testicular degeneration and reduced neonatal body and organ
weights were seen in rats at dose levels in excess of 30 mg Cu/kg body
weight per day over extended time periods, and fetotoxic effects and
malformations were seen at high dose levels (> 80 mg Cu/kg body
weight per day).
Copper(II) sulfate was not mutagenic in bacterial assays.
However, a dose-related increase in unscheduled DNA synthesis was seen
in rat hepatocytes. In the mouse micronucleus assay, one study showed
a significant increase in chromosome breaks at the highest intravenous
dose (1.7 mg Cu/kg body weight) but no effect was seen in another
study at intravenous doses up to 5.1 mg Cu/kg body weight.
Studies of neurotoxicity have not shown effects on behaviour but
neurochemical changes have been reported after oral administration of
20-40 mg Cu/kg body weight per day. A limited number of
immunotoxicity studies showed humoral and cell-mediated immune
function impairment in mice after oral intakes from drinking-water of
about 10 mg Cu/kg body weight per day.
1.8 Effects on humans
Copper is an essential element and adverse health effects are
related to deficiency as well as excess. Copper deficiency is
associated with anaemia, neutropenia and bone abnormalities but
clinically evident deficiency is relatively infrequent in humans.
Balance data may be used to anticipate clinical effects, whereas serum
copper and ceruloplasmin levels are useful measures of moderate to
severe deficiency but less sensitive measures of marginal deficiency.
Except for occasional acute incidents of copper poisoning, few
effects are noted in normal populations. Effects of single exposure
following suicidal or accidental oral exposure have been reported as
metallic taste, epigastric pain, headache, nausea, dizziness, vomiting
and diarrhoea, tachycardia, respiratory difficulty, haemolytic
anaemia, haematuria, massive gastrointestinal bleeding, liver and
kidney failure, and death. Gastrointestinal effects have also
resulted from single and repeated ingestion of drinking-water
containing high copper concentrations, and liver failure has been
reported following chronic ingestion of copper. Dermal exposure has
not been associated with systemic toxicity but copper may induce
allergic responses in sensitive individuals. Metal fume fever from
inhalation of high concentrations in the air in the occupational
setting has been reported and, although other respiratory effects have
been attributed to exposure to mixtures containing copper (e.g.
Bordeaux mix, mining and smelting), the role of copper has not been
demonstrated. Workers apparently exposed to high air levels resulting
in an estimated intake of 200 mg Cu/day developed signs suggesting
copper toxicity (e.g. elevated serum copper levels, hepatomegaly).
Available data on reproductive toxicity and carcinogenicity are
inadequate for risk assessment.
A number of groups are described where apparent disorders in
copper homoeostasis result in greater sensitivity to copper deficit or
excess than the general population. Some disorders have a
well-defined genetic basis. These include Menkes disease, a generally
fatal manifestation of copper deficiency; Wilson disease
(hepatolenticular degeneration), a condition leading to progressive
accumulation of copper; and hereditary aceruloplasminaemia, with
clinical symptoms of iron overload. Indian childhood cirrhosis (ICC)
and idiopathic copper toxicosis (ICT) are conditions related to excess
copper which may be associated with genetically based copper
sensitivity, although this has not been demonstrated unequivocally.
These are fatal liver conditions in early childhood where copper
accumulates in the liver. Incidences of the diseases were related to
high copper intake, at least in some cases.
Other groups potentially sensitive to copper excess are
haemodialysis patients and subjects with chronic liver disease.
Groups at risk of copper deficiency include infants (particularly low
birth weight/preterm babies, children recovering from malnutrition,
and babies fed exclusively with cow's milk), people with malabsorption
syndromes (e.g. coeliac disease, sprue, cystic fibrosis), and patients
on total parenteral nutrition. Copper deficiency has been implicated
in the pathogenesis of cardiovascular disease.
1.9 Effects on other organisms in the laboratory and field
The adverse effects of copper must be balanced against its
essentiality. Copper is an essential element for all biota, and care
must be taken to ensure the copper nutritional needs of organisms are
met. At least 12 major proteins require copper as an integral part of
their structure. It is essential for the utilization of iron in the
formation of haemoglobin, and most crustaceans and molluscs possess
the copper-containing haemocyanin as their main oxygen-carrying blood
protein. In plants copper is a component of several enzymes involved
in carbohydrate, nitrogen and cell wall metabolism.
A critical factor in assessing the hazard of copper is its
bioavailability. Adsorption of copper to particles and complexation
by organic matter can greatly limit the degree to which copper will be
accumulated and elicit effects. Other cations and pH can also
significantly affect bioavailability.
Copper has been shown to exert adverse reproductive, biochemical,
physiological and behavioural effects on a variety of aquatic
organisms. Copper concentrations as low as 1-2 µg/litre have been
shown to have adverse effects on aquatic organisms; however, large
variations due to species sensitivity and bioavailability must be
considered in the interpretation and application of this information.
In natural phytoplankton communities chlorophyll a and nitrogen
fixation were significantly reduced at copper concentrations of
> 20 µg/litre and carbon fixation was significantly reduced at
> 10 µg/litre. EC50s (72 h) for algae, based on growth
inhibition, range from 47 to 120 µg Cu/litre.
For freshwater invertebrates, 48-h L(E)C50s range from 5 µg
Cu/litre for a daphnid species to 5300 µg Cu/litre for an ostracod.
For marine invertebrates 96-h LC50s range from 29 µg Cu/litre for the
bay scallop to 9400 µg Cu/litre for the fiddler crab. The acute
toxicity of copper to freshwater and marine fish is highly variable.
For freshwater fish 96-h LC50s range from 3 µg Cu/litre (Arctic
grayling) to 7340 µg Cu/litre (bluegill). For marine fish 96-h LC50s
range from 60 µg Cu/litre for chinook salmon to 1400 µg Cu/litre for
grey mullet.
Although plants require copper as a trace element, at high soil
levels copper can be extremely toxic. Generally visible symptoms of
metal toxicity are small chlorotic leaves and early leaf fall. Growth
is stunted and initiation of roots and development of root laterals
are poor. Reduced root development may result in a lowered water and
nutrient uptake which leads to disturbances in the metabolism and
growth retardation. At the cellular level, copper inhibits a large
number of enzymes and interferes with several aspects of plant
biochemistry (including photosynthesis, pigment synthesis and membrane
integrity) and physiology (including interference with fatty acids,
protein metabolism and inhibition of respiration and nitrogen fixation
processes).
Toxic effects have been observed in laboratory studies of
earthworms exposed to copper in soil; cocoon production is the most
sensitive parameter measured, with significant adverse effects at
50-60 mg Cu/kg.
Adverse field effects on soil microorganisms have been correlated
with enhanced copper concentrations in areas where copper-containing
fertilizers have been applied and in areas near to copper-zinc
smelters. In citrus-growing areas, to which copper-containing
fungicides have been applied, leaf chlorosis has been found to be
significantly correlated with soil copper levels.
Tolerance to copper has been demonstrated in the environment for
phytoplankton, aquatic and terrestrial invertebrates, fish and
terrestrial plants. Tolerance mechanisms which have been proposed in
plants include binding of metal to cell wall material, presence of
metal-tolerant enzymes, complex formation with organic acids with
subsequent removal to the vacuole, and binding to specialized
thiol-rich proteins or phytochelatins.
1.10 Conclusions
1.10.1 Human health
The lower limit of the acceptable range of oral intake (AROI) is
20 µg Cu/kg body weight per day. This figure is arrived at from the
adult basal requirement with an allowance for variations in copper
absorption, retention and storage (WHO, 1996). In infancy, this
figure is 50 µg Cu/kg body weight per day.
The upper limit of the AROI in adults is uncertain but it is most
likely in the range of several but not many mg per day in adults
(several meaning more than 2-3 mg/day). This evaluation is based
solely on studies of gastrointestinal effects of copper-contaminated
drinking-water. A more specific value for the upper AROI could not be
confirmed for any segment of the general population. We have limited
information on the level of ingestion of copper from food that would
provoke adverse health effects.
The available data on toxicity in animals were considered
unhelpful in establishing the upper limit of the AROI, owing to
uncertainty about an appropriate model for humans. Moreover,
traditional methodology for safety assessment, based on application of
uncertainty factors to data in animals, does not adequately address
the special attributes of essential elements such as copper.
From available data on human exposures worldwide, but
particularly in Europe and the Americas, there is greater risk of
health effects from deficiency of copper intake than from excess
copper intake.
1.10.2 Environmental effects
Protection of aquatic life in waters with high bioavailability
will require limiting total dissolved copper to some concentration
less than 10 µg/litre; however, the appropriate concentration limit
will depend on the biota and exposure conditions at sites of concern
and should be set based on further evaluation of all relevant data.
At many sites, physicochemical factors limiting bioavailability
will warrant higher copper limits. Regulatory criteria should take
into account the speciation of copper if dischargers can demonstrate
that the bioavailability of copper in the receiving water can be
measured reliably.
When sampling and analysing environmental media for copper, it is
essential that "clean" techniques be employed.
Because copper is an essential element, procedures to prevent
toxic levels of copper should not incorporate safety factors that
result in recommended concentrations being below natural levels.
2. IDENTITY, PHYSICAL AND CHEMICAL PROPERTIES AND ANALYTICAL METHODS
2.1 Identity
Copper, the 29th element and the first in group IB of the
Periodic Table, displays four oxidation states: metallic copper Cu0,
cuprous ion Cu+, cupric Cu2+ and trivalent copper ion Cu3+.
Copper also forms organometallic compounds. The natural isotopic
abundance is 69.17% 63Cu and 30.83% 65Cu, giving the element an
average relative atomic mass of 63.546 (Lide & Frederikse, 1993b).
The limited range of stable isotopes and their common distribution has
inhibited isotopic distribution studies. Useful radioactive copper
isotopes are 64Cu (12.701 h half-life) and 67Cu (61.92 h half-life);
they decay with the production of ß-particles and gamma-rays (Lide &
Frederikse, 1993b) and are produced in synchrotrons for physical and
biological studies.
Copper is found in a wide variety of mineral salts and organic
compounds, and can also be found naturally in the elemental or
metallic form. The metal is a dull lustrous reddish-brown in colour,
malleable, a good thermal conductor and an excellent electrical
conductor. The metallic form is very stable to dry air at low
temperatures but undergoes a slow reaction in moist air to produce a
hydroxycarbonate or hydroxysulfate that forms a greenish-grey
amorphous film over the surface which protects the underlying metal
from further attack. The metal is sparingly soluble in water, in salt
solutions and in mildly acidic solutions, but can be dissolved in
nitric acid and sulfuric acid as well as in basic solutions of
ammonium hydroxide, ammonium carbonate and cyanide in the presence of
oxygen (Cotton & Wilkinson, 1989).
The electronic configuration of the metallic (Cu0) form is
1s22s22p63s23p63d104p1. The common solution oxidation states
are the cuprous (Cu(I) 3d10) or the cupric (Cu(II) 3d9) forms. The
chemistry of the element, especially in biological systems, is
profoundly affected by the electronic/oxidation state. The facile
exchange between oxidation states endows the element with redox
properties which may be of an essential or deleterious nature in
biological systems.
The most important oxidation state in natural, aqueous
environments is copper(II). Any copper(I) present is quickly oxidized
by any oxidizing reagent present, or in a disproportionation reaction,
unless it is stabilized by complex formation. The copper(II) ion
binds preferentially via oxygen to inorganic ligands such as H2O, OH-,
CO32-, SO42-, etc. and to organic ligands via phenolic and
carboxylic groups (Cotton & Wilkinson, 1989). Thus, almost all of the
copper in natural samples is complexed with organic compounds
(Neubecker & Allen, 1983; Nor, 1987; Allen & Hansen, 1996).
Many cupric compounds and complexes are soluble in water and have
a characteristic aqua-blue-green colour. The trivalent form of copper
is found in only a few compounds and is a strong oxidizing agent
(Cotton & Wilkinson, 1989). In environmental and mineral environments
the divalent oxidation state readily adsorbs to a variety of hydrated
metal oxides including those of iron, aluminium and manganese (Grant
et al., 1990).
Identification, quantification and speciation of copper is
described in sections 2.3 and 2.4 and the influences on the speciation
in water and soil are described in section 2.4.1.
2.2 Physical and chemical properties
The physical and chemical properties of copper and some of its
salts are summarized in Table 1.
2.3 Analytical methods
The wide range of copper species, inorganic and organic, has lead
to the development of an array of sampling techniques and preparative
and analytical methods to quantify the element in environmental and
biological samples. The following sections offer a brief overview of
these methodologies.
2.3.1 Sampling and sample preparation
Sampling and the subsequent work-up is highly dependent on the
type of sample being analysed and the level of detail needed to
evaluate it. Most of the techniques described below suffer at some
level from the effects of the surrounding milieu or matrix.
Qualitative analysis to determine the presence of copper in a sample,
for instance, may or may not require consideration of the matrix,
whereas quantitation of metals usually does. Quantitation of the
various forms of copper requires a detailed evaluation of the matrix
and the techniques being used.
2.3.1.1 Sampling
Owing to the abundance of copper in the environment, the
collection of samples for copper analysis requires precautions to
avoid accidental contamination. Most plastics and glassware are
relatively free of copper contamination but care should be taken to
avoid heavily pigmented plastics that could contain copper or other
metals that might compromise the analysis. Interference by
contaminating metals is more likely to be a problem in colorimetric
analyses. Vessels to be used in the collection of samples for copper
analysis should be cleaned of dust and debris and washed with a dilute
metal-free mineral acid such as 0.1 mol/litre hydrochloric or nitric
acid, rinsed copiously with clean distilled water and dried in a
dust-free area. Copper is frequently and naturally found in
industrial and household dusts (Kim & Fergusson, 1993) so care should
be taken that the samples are not contaminated. Removal of copper
from washing and rinsing water, and even distilled water, can be
compromised by the use of copper plumbing and brass fixtures. Removal
of metals and other ions can be accomplished through the use of
ion-exchange resins.
Table 1. Physical and chemical properties of copper and some of its saltsa
Copper Copper(II) Cuprous(I) Copper(II) Copper(II) Oxine-copperb
sulfate oxide hydroxide chloride
CAS registry number 7440-50-8 7758-98-7 1317-39-1 20427-59-2 7447-39-4 10280-28-6
Molecular formula Cu CuSO4 Cu2O Cu(OH)2 CuCl2 C18H12CuN2O2
Relative molecular mass 63.55 159.6 141.3 97.56 134.45 351.9
Boiling point (°C) 2567 decomposes to decomposes at decomposes at
CuO at 650 °C 140 °C 993 °C
Melting point (°C) 1083.4 slightly decomposes 1235 decomposes 620 decomposes
at > 200°C at 270°C
Vapour pressure (kPa) 1.33 at
1870 °C
Water solubility insoluble 143 g/litre practically 2.9 mg/litre 706 g/litre insoluble
at 0°C insoluble at 25 °C
a Lide & Frederikse (1993)
b Copper 8-hydroxyquinolinate.
2.3.1.2 Separation and concentration
It is not generally necessary that the metal itself be isolated
before analysis, but frequently the metal or at least the inorganic
portion of the sample must be concentrated. The requirement for
concentration of the sample depends on the sensitivity of analytical
method to be employed.
Particulates (dust, smoke, spray) are sampled from air on filters
before analysis. Aqueous samples may need to be dried or concentrated
using an ion-exchange procedure (Vermeiren et al., 1990; Chakrabarti
et al., 1994).
Total copper (in water) includes all forms of copper
irrespective of form, whether dissolved or bound. Suspended copper
refers to copper attached to suspended particles in water large enough
to be filtered by a 0.45 µm membrane filter. Dissolved copper is
defined operationally as all forms of copper which pass through a 0.45
µm membrane filter (ATSDR, 1990). Separation of dissolved and
suspended forms of copper requires filtering. Special measures must
be taken to avoid sample contamination when filtering. First, the
membrane filter and filter holder must be acid cleaned. The filter
must be discarded and the filter holder should be acid rinsed between
samples and subsequently rinsed with metal-free water. Second, glass
fibre filters must not be used. Third, the filter holder and membrane
filter must be conditioned with the sample, i.e. an initial portion of
the sample filtered and discarded. Lastly, if positive pressure
filtration is used, the gas must be passed through a 0.2 µm in-line
filter.
2.3.1.3 Sample preparation
Direct analysis of metals with little modification or preparation
of the sample is desirable but frequently not achievable. Direct
analysis of copper is appropriate when relatively concentrated samples
are analysed (0.1-2 mg/litre or higher), provided they are very low in
interfering inorganics and especially organic materials. More dilute
samples can be concentrated as described above. Concentrated samples
can be diluted with appropriate diluents, usually distilled water or
dilute copper-free mineral acid solutions. Care should be taken to
keep the pH near or below neutral to avoid the formation of insoluble
copper hydroxides.
Sample preparation for the most widely utilized analytical
techniques, or where the removal of the organic matrix is required, is
generally achievable by means of a preceding open vessel oxidative
degradation step involving nitric acid or acid mixtures such as aqua
regia or sulfuric acid/hydrogen peroxide. (Perchloric acid is less
frequently used because of its explosive nature.) A procedure using a
mixture of nitric, perchloric and hydrofluoric acids was reported to
give good recoveries of metals including cadmium, chromium, copper,
manganese, nickel, lead and zinc in estuarine sediments (Bello et al.,
1994). Recently, oxidative UV photolysis (Kolb et al., 1992) and
microwave-assisted acid digestion in a closed vessel have become more
popular in sample preparation for various sample matrices prior to
elemental analyses. Microwave-assisted digestion has been employed as
a sample preparation procedure prior to the measurement of copper
level in human bone (Baranowska et al., 1995), in duck eggs (Jeng &
Yang, 1995), in sediments by anodic stripping voltametry (Olsen et
al., 1994), in marine biological tissues such as mollusc, fish and
crustacean by AAS (Baldwin et al., 1994), in steels and copper alloys
by ICP-AES (Borszeki et al., 1994), and in plant materials (Matejovic
& Durackova, 1994). The microwave digestion procedure is fast
becoming the method of choice because sample preparation is rapid and
the values of blanks are significantly lower than in the traditional
wet and dry mineralization methods (Matejovic & Durackova, 1994). A
fast and quantitative on-line microwave digestion/extraction of copper
from different solid matrices, such as vegetables, powdery dietary
products and sewage sludge, was developed using a flow
injection-atomic absorption system (FI-AAS) (Delaguardia et al.,
1993). A similar FI-AAS method for the determination of copper in
whole blood was also reported by Burguera et al. (1993).
2.3.1.4 "Clean" techniques for measurement of ultratrace copper levels
Information provided by Shiller & Boyle (1987), Windom et al.
(1991) and Hurley et al. (1996) has raised questions concerning the
quality of data collected and reported for trace metals analysis over
the past several decades. The concern is that insufficient care in
sampling, sample preparation and analysis have resulted in samples
being contaminated and the values reported in the sub-mg/litre range
have questionable accuracy. It has been shown that many published
literature values for surface waters are biased on the high side owing
to contamination and/or matrix interferences. Matrix interferences
commonly encountered in copper analyses are chemical, spectral,
ionization and high dissolved solids. Copper determination by ICP
emission spectroscopy (ICP-ES) can suffer from interference by iron,
thallium and vanadium (US EPA, 1986). Copper determination by ICP-MS
emission spectroscopy is susceptible to interference from chlorides,
although procedures have been developed to overcome this interference
in blood serum samples, for example (Lyon & Fell, 1990). Both ICP-ES
and ICP-MS are excellent techniques for measuring copper if care is
taken to eliminate interferences. "Clean" techniques (Prothro, 1993;
US EPA, 1995) address the problem associated with making accurate and
precise trace determinations of metals particularly when attempting to
lower detection limits and report microgram/litre and
sub-microgram/litre concentrations. "Clean" techniques require
special attention to be paid in seven areas:
1. use of "clean" techniques during collecting, handling, storing,
preparing and analysing samples to avoid contamination
2. use of analytical methods that have sufficiently low detection
limits
3. avoidance of interference in the quantification step
4. use of blanks to assess contamination
5. use of matrix spikes and certified reference materials (CRMs) to
assess interference and contamination
6. use of replicates to assess precision
7. use of certified standards.
To achieve accurate and precise measurement of any particular
sample, it is recommended that both the detection limit and the blank
value should be less than one-tenth the sample concentration. This is
a stringent requirement, but one that is especially important in
measuring metals at concentrations near the method detection limit and
at environmentally relevant concentrations. The methods employed to
attain these goals seek to increase sensitivity, decrease
contamination and decrease interference. The specific recommendations
used to achieve these goals and address the seven items above are
provided in Prothro (1993).
2.3.2 Detection and measurement
2.3.2.1 Gravimetric and colorimetric methods
Gravimetric and colorimetric methods were the earliest procedures
used for the measurement of copper. Gravimetric methods are
non-specific and may precipitate other cations including zinc,
cadmium, cobalt and nickel. Useful spectrophotometric reagents for
copper include cuprizone (biscyclohexanoneoxalydihydrazone) (Peterson
& Bollier, 1955), bathrocuproinedisulfonic acid
(2,9-dimethyl-4,7-diphenyl-1,10-phenanthrolinedisulfonic acid) (Zak,
1958), bathocuproine (dimethyl-4,7-diphenyl-1,10-phenanthroline)
(Wharton & Rader, 1970) and more recently 1-(2-pyridylazo)-2-naphthol
(Malvankar & Shinde, 1991), BPKQH (benzyl 2-pyridyl ketone
2-quinolylhydrazone (Garcia-Sanchez et al., 1990) and
2,2'-bichinchioninic acid (Brenner & Harris, 1995). The bathocuproine
method can achieve a limit of detection of 2 µg Cu/litre in water
samples.
Although colorimetric methods can suffer from lack of
specificity, they are nevertheless useful, especially in laboratories
where more sophisticated instrumentation is not available. Beyond a
spectrophotometer and an analytical balance, no specialized equipment
is required. In addition, the methods are, in general, simple,
inexpensive, easily taught and rapidly carried out. Because of these
advantages they should be considered in situations where extreme
sensitivity is not essential.
2.3.2.2 Atomic absorption, emission and mass spectrometry methods
Atomic absorption spectrophotometric (AAS) methods are the most
widely used for the determination of copper in various matrices. A
dramatic increase in sensitivity over that obtained by flame AAS is
obtained with GF-AAS. Increasingly more common is the use of emission
methods in which the sample is introduced into a high temperature
inductively coupled argon plasma (ICP) where the element is rapidly
vaporized and ionized. The element is detected and quantified by
atomic emission spectroscopy (ICP-AES).
A further increase in sensitivity is obtained through the
coupling of the ICP to a mass spectrometer (ICP-MS). The attraction
of the ICP methods is the ability to do multielemental analysis
(Vollkopf & Barnes, 1995) which is the obvious advantage over other
spectroscopic techniques. The ICP-MS technique has the additional
advantage that isotopic information can be obtained, which is
especially useful if stable isotopes of copper are used for
bioavailability and other studies (Lyon et al., 1988, 1995, 1996). An
isotope dilution ICP-MS method (Beary et al., 1994) reported precision
of less than 0.15% for copper and cadmium in zinc ore and for copper
and molybdenum in domestic sludge; others (Lu et al., 1993) reported a
more conservative precision of less than 1% and a detection limit of
58 ng/litre for copper in a number of biological and environmental
reference materials. The International Standards Organization have
published procedures using AAS for the analysis of copper in water
between 0.05 and 200 µg/litre (ISO, 1986). Detection limits are
summarized in Table 2.
2.3.2.3 Specialized methodologies
Many X-ray fluorescence (XRF) methods, which are nondestructive
techniques, have been published for the determination of trace
elements including copper. XRF has for a long time been used as a
rapid and convenient method for trace element determination although
its sensitivity is somewhat lower than anodic stripping voltametry
(ASV) (Viksna et al., 1995). The technique can be used for a variety
of sample types, such as human serum (Viksna et al., 1995),
electrolyte purification solutions (Davidson et al., 1994), human
kidney tumours (Hamilton et al., 1972) and contaminated soils (Wilson
et al., 1995). Field instruments are available for scans of
contaminated sites to estimate the metal in the surface layer of the
soil. A proton-induced X-ray fluorescence technique (PIXE) was also
reported for the measurement of trace elements in amniotic fluid
(Napolitano et al., 1994).
Ion-selective electrode and potentiometric methods have been used
for copper speciation in soil (Town & Powell, 1993), and in seawater
(Román & Rivera, 1992; Soares et al., 1994). Voltammetric methods
have comparable sensitivity to conventional AAS, but also offer
speciation capability (Scarano et al., 1990; Chakrabarti et al., 1994;
Cheng et al., 1994). Voltammetric/potentiometric analyses offer
sensitivity in the parts per billion (µg/kg) range for copper and some
other metals. Potentiometric analysis relies on the elements
electrochemical properties. An attraction of potentiometric methods
is their ability to help in the speciation of copper and limited
multielement detection. ASV has been used to analyse copper in foods
(Holak, 1983). Cathodic stripping voltametry (CSV) is an extremely
sensitive method for copper in both seawater and fresh water, with a
limit of detection of 0.005 µg/litre (Donat et al., 1994).
Some analytical methods for the detection of copper in different
media are summarized in Table 2.
Table 2. Analytical methods for the detection of copper
Medium Sample Methoda Detection Reference
preparation limit
Air filter collection on ICP-AES 1 µg ATSDR
0.8 µm membrane; (1990)
acid digestion
filter collection on AAS 0.05 µg ATSDR
0.8 µm membrane; (1990)
acid digestion
Fresh acidify with 1:1 AAS 20 µg/litre US EPA
water HNO3 to a pH < 2 (1986)
sample solutions GF-AAS 1 µg/litre US EPA
should contain 0.5% (1986)
HNO3
filter and acidity ICP 2-10 µg/litre US EPA
sample (1986)
filter and acidity ICP-AES 6 µg/litre ATSDR
sample (1990)
acid digestion with ICP-MS 0.01 µg/litre US EPA
HNO3, reflux and (1994)
dilute with type 1
water
Sediment acid digestion AAS 1.0 µg/g US EPA
acid digestion GF-AAS 0.05-0.20 µg/g (1986)
acid digestion ICP 0.20-0.50 µg/g US EPA
acid digestion ICP-MS 0.025-0.005 µg/g (1986)
Tissue acid digestion AAS 0.5-1.0 µg/g US EPA
acid digestion GF-AAS 0.05-0.20 µg/g (1986)
acid digestion GF-AAS 0.25 µg/g Lowe et
wet weight al. (1985)
acid digestion ICP 0.04-0.1 µg/g US EPA
acid digestion ICP-MS 0.025-0.05 µg/g (1986)
acid digestion ICP-AES 0.2 µg/g tissue NIOSH
1 µg/100 ml blood (1987)
Food closed system ASV 0.32 µg/g Holak
digestion (1983)
a See list of abbreviations on p. xxii.
2.4 Speciation
Developing an objective assessment of the hazard that copper
poses to humans and the environment depends on an intimate
understanding of its bioavailability. Bioavailability, defined as the
extent to which the metal is taken up by an organism upon exposure,
depends on the species of the metal or metallo complex and/or how
easily it can be transformed to a more or less bioavailable species.
2.4.1 Speciation in water and sediments
In natural waters, only very small percentages of copper are
present as the "free" aquo ion (Cu2+); rather, most copper is
adsorbed to suspended particles or complexed with various ligands
(Florence & Batley, 1980). Inorganic ligands of greatest importance
are hydroxide, carbonate and, in saline waters, chloride (Bodek et
al., 1988). Binding of copper to fulvic and humic acids and to other
organic compounds can be very strong, so that a large proportion of
dissolved copper is often organically complexed (Neubecker et al.,
1983; Coale & Bruland, 1988; Allen & Hansen, 1996). In air, copper is
present in particulate form. In sediments and soils, most copper is
also on or in particles, either as a constituent of mineral phases or
adsorbed to oxide surfaces or organic matter; formation of copper
sulfide can be particularly important in anoxic sediments (DiToro et
al., 1990). Copper speciation in interstitial water can be affected
by high concentrations of inorganic and organic ligands.
Speciation, the identification and quantitation of a metal in its
various oxidation states, inorganic forms and organometallic
complexes, is afforded through a wide variety of techniques (ICME,
1995).
2.4.1.1 Detection and quantification
a) Electrochemical methods
Electrochemical techniques, especially ASV, have been widely used
to measure the "electrochemically labile" fraction of copper in water
samples, with the assumption that the electrochemically labile
fraction is an approximation of the bioavailable fraction of copper
(Neubecker & Allen, 1983; Bruland et al., 1985; Buckley & van den
Berg, 1986; Morrison & Florence, 1989; Florence et al., 1992; Donat et
al., 1994). It has been shown that if the ASV measurement is carried
out in a manner such that the copper complexing agents in the water
sample affect only the efficiency of electrochemical deposition, but
not the stripping process, then ASV-labile copper correlates very well
with bioavailable copper as measured by algal assay (Florence et al.,
1992). Simple ASV analysis of a water sample at the natural pH where
complexing agents affect both the deposition and stripping processes
tends to underestimate the bioavailable fraction of copper (Zhang &
Florence, 1987; Morrison & Florence, 1989).
Electrochemical titrations using ASV can provide information on
the "complexing capacity" of a water sample, as well as quantitative
data on the conditional formation constants of copper with the ligands
present in the sample. Complexing capacity is defined as the total
concentration of ligands, both organic and inorganic, in a water
sample that will bind copper in nonlabile complexes (Donat et al.,
1994).
b) Equilibration methods
Together with electrochemical methods, equilibration techniques
are among the most popular and successful methods used for speciation
studies. The equilibration methods mostly use ion-exchange resins or
weak inorganic exchangers and complexing ligand. The equilibrium
constant of both the resin and the complex has to be satisfied
simultaneously. The distribution ratio for a fixed resin
concentration is measured in the presence of a competing ligand with
known metal equilibria, which determines the partition coefficient for
the resin. Stability constants and ligand concentrations of unknown
solutions can then be measured (Neubecker & Allen, 1983).
The total concentration of most biologically important trace
metals including copper in seawater is in the range 10-10-10-8
mol/litre and hence the concentration of any individual metal organic
complex must be considerably lower. Characterization and
identification of individual compounds at these concentrations in
seawater by chemical techniques is very difficult, if not impossible.
The methodology usually involves first extracting and concentrating
the compounds from sample matrices on to a resin, followed by
fractionation according to different chemical and physical properties.
Since the compounds may not be volatile, the most useful technique is
high performance liquid chromatography (HPLC); alternatively, the
compounds can be made volatile by some derivatization steps then
determined by gas liquid chromatography (GLC), or gas liquid
chromatography-mass spectrophotometry (GLC-MS). Thompson & Houk
(1986) reported an HPLC-ICP-MS method of multielemental analysis and
speciation with a limit of detection of 4 ng of copper. Recently, the
sensitivity for copper was increased by using an ion
chromatography-ICP-MS (IC-ICP-MS) technique (McLaren et al., 1993).
The aluminium hydroxide-cation exchange mini-column technique (Zhang &
Florence, 1987) provides a rapid and simple method for determining
bioavailable copper in both seawater and fresh water samples.
2.4.2 Speciation in biological matrices
The speciation of copper in tissue and blood samples has been
studied (Florence & Batley, 1980; Brouwer et al., 1989; Florence et
al., 1992). In particular, techniques have been developed for the
separation and determination of caeruloplasmin in blood plasma (Lyon &
Fell, 1990) and for metallothioneins in tissue samples (Florence et
al., 1992).
3. SOURCES OF HUMAN AND ENVIRONMENTAL EXPOSURE
3.1 Natural sources
Metal oxides, silicates and other materials are the building
blocks of rocks forming the earth's crust and it is the weathering of
these rocks that creates soils and sediment. Copper oxide, copper
sulfide and other ores are among these components. Copper, along with
other metals, is distributed through the environment by precipitation
and resulting riverine flows which transport the particles. Depending
on the flow dynamics, these particles settle out and form sedimentary
deposits. Volcanic activity injects dust and particles into the
atmosphere; they then settle out on soil and water surfaces. Wind is
a significant factor in moving metal-laden soil particles around the
land surface of the earth, which they can also reach from atmospheric
sources by both wet (rain washout) and dry deposition. An important
source of copper in aquatic sediments is from dead organisms which
settle out and contribute both copper and organic material. This can
be a significant source in the oceans, for example.
Copper has a natural abundance of approximately 60 mg/kg in the
earth's crust and 2.5 × 10⁻⁴ mg/litre in the sea (Lide & Frederikse,
1993). It occurs naturally in many minerals such as cuprite (Cu2O),
malachite (Cu2CO3.Cu(OH)2), azurite (2CuCO3.Cu(OH)2),
chalcopyrite (CuFeS2), chalcocite (Cu2S), and bornite (Cu5FeS4).
Copper is also found naturally in its metal form (Tuddenham & Dougall,
1978). The copper content of ore deposits ranges from 0.5 to 5% by
weight, whereas igneous rock contains 0.010% (Duby, 1980) and
crystalline rock 0.0055% by weight. The most important sources of
copper are chalcocite, chalcopyrite and malachite (Weant, 1985).
Figures from Cannon et al. (1978) indicate a range of 4-200 mg
Cu/kg and a range of mean concentrations of 2-90 mg Cu/kg in igneous
and sedimentary rocks. Nriagu (1989) estimated mean worldwide
emissions of copper from natural sources as follows: windblown dusts,
0.9-15 × 103 tonnes; forest fires, 0.1-7.5 × 10³ tonnes; volcanic
particles, 0.9-18 × 103 tonnes; biogenic processes, 0.1-6.4 × 10³
tonnes; sea salt spray, 0.2-6.9 × 10³ tonnes.
Average background concentrations of copper in air in rural areas
range from 5 to 50 ng/m3. Copper levels in seawater of 0.15 µg/litre
and in freshwater of 1.0-20 µg/litre are found in uncontaminated areas
(Nriagu, 1979b). Background levels of copper in uncontaminated
sediments range from 800 to 5000 mg/kg (dry weight) (Forstner &
Wittmann, 1979). Copper levels in marine sediments range from 2 to
740 mg/kg (dry weight). Median copper concentrations in uncontaminated
soil were reported to average 30 mg Cu/kg with a range of 2-250 mg/kg
(Bowen, 1985). Detailed information on concentrations in the
environment is presented in section 5.1. Copper is found as a natural
component of foods eaten by humans and animals.
3.2 Anthropogenic sources
Anthropogenic sources of copper include emissions from mines,
smelters and foundries producing or utilizing copper, zinc, silver,
gold and lead. Environmental copper can also arise from the burning
of coal for power generation and from municipal waste incinerators. A
major release of copper to land comes from mine tailings and
overburden from mining operations. Other anthropogenic sources of
copper include its use as an antifouling agent in paints, agriculture
(fertilizers, algicides, feed supplements) and animal and human
excreta (animal manure and human sewage sludge). Copper is also
intentionally released into some water bodies to control the growth of
algae (Slooff et al., 1989; ATSDR, 1990).
Although it was estimated that 66% of copper emissions to the
environment in 1983 were from anthropogenic sources (Nriagu, 1989),
there is evidence that industrial emissions are decreasing owing to
stringent controls developed in facilities manufacturing and using
copper (Dann, 1994).
3.2.1 Production levels and processes
The mining and refining of copper takes place on all six
continents. Mines in Chile, USA and Canada account for over 50% of
the annual worldwide production of 11 × 106 tonnes of refined copper
metal (ICSG, 1996). Other major areas for copper mining include
Russia, Australia, Zambia, Indonesia, Peru, China and Poland. It is
estimated that about 40% of the copper used worldwide (approximately
15 × 106 tonnes) comes from recycled metal (ATSDR, 1990). Release of
airborne copper from smelters is currently one of the major sources of
copper to the environment.
The majority of copper metal is produced by smelting of the
copper sulfide ore followed by electrolytic refining (ATSDR, 1990).
Some 106 tonnes were produced in Chile and North America using
solvent extraction technology. The process involves extraction of
copper from acidic leach solutions using organic reagents followed by
electrolytic extraction. The principal sources of copper for this
process are conventional mining of oxide ores in open pits, leaching
of mine dump low-grade ore, and mill tailings and mine water run-off.
Extraction of mine tailings and dumps in this way reduces the
environmental impact of mine wastes by reducing the copper
concentrations in these sources.
3.3 Copper use
The world uses approximately 15 × 106 tonnes of copper a year.
Of this about one-third is derived from recycled metal, and the rest
is supplied from the mining of ore bodies and refining of the
extracted copper.
The unique combination of properties of copper, including
durability, ductility, malleability and electrical and thermal
conductivity, determine its uses in a vast range of applications. A
summary of these uses in the USA, Western Europe and Japan is given in
Table 3, compiled from Marco (1989).
Worldwide, the largest use of copper is in electrical wire and
cable and other electronic applications, which can account for as much
as 65% (9.75 × 10⁶ tonnes) of total annual copper consumption.
Rolled copper is also extensively used in architectural applications
for roofing, rainwater goods and cladding, while rolled copper and
brass are also used for vehicle radiators. Overall, the major
industrialized countries consume over 1.5 × 10⁶ tonnes of rolled
product per year. Approxi mately 15% (2.25 × 10⁶ tonnes) of copper
is used annually in building and construction, including plumbing,
architectural applications such as roofing, guttering and flashing,
and in fixtures and fittings. The remaining 20% (3 × 10⁶ tonnes)
goes to transport equipment, air-conditioning and refrigeration as
well as general and light engineering uses such as machine parts, and
process equipment, coinage, ordnance and consumer goods, such as
domestic appliances as well as production of bronze and brass alloys.
Extruded brass is a raw material for the forging and machining
sectors, and is turned into a wide range of components such as taps,
valves and water fittings, and instrument and machine parts. Over 1.7
× 106 tonnes of extruded copper alloy products are consumed by the
major industrialized countries annually.
Tubes in copper and copper alloys are widely and increasingly
used for domestic plumbing and heating systems, air conditioning,
refrigeration and industrial applications. Over 1.5 × 10⁶ tonnes of
tubes are consumed annually by the major industrialized countries.
A small percentage of copper production goes into the manufacture
of copper compounds, particularly copper sulfate which is used
primarily for industrial and agricultural purposes. In industry,
copper sulfate is used as an activator in the froth flotation of
sulfide ores, production of chromated copper arsenate wood
preservatives, electroplating, azo-dye manufacture, as a mordant for
textile dyes, in petroleum refining and in the manufacture of other
inorganic and organometallic compounds (ATSDR, 1990). Other copper
compounds find uses as pigments, paints, dyes, glasses, catalysts and
fungicides. Copper is finding increasing use as the active ingredient
in antifouling paints. In this context it is also used in paints for
operating theatres and other hospital facilities to reduce inadvertent
contamination of surfaces and transmission of disease-causing
organisms.
Table 3. Copper consumption in 1988a (in thousands of tonnes)
Use Building and Electrical/ Industrial
construction electronics
Copper wire 0 4293 0
Copper rod 5 164 34
Copper sheet and strip 240 140 225
Copper tube 551 0 424
Alloy wire 7 9 65
Alloy rod 338 114 462
Alloy sheet and strip 66 123 443
Alloy tube 14 8 110
Castings 142 58 292
Totals 1363 4909 2055
a Based on figures from the USA, western Europe and Japan (about 75%
of world consumption of 11 090 000 tonnes) (Marco, 1989)
In agriculture, copper compounds, especially copper sulfate, are
used as fungicides, pesticides, algicides, nutritional supplements in
animal feeds, and fertilizers. Copper fungicides are used to treat
foliage, seeds, wood, fabric and leather as a protectant against
blights, downy mildews and rusts (ATSDR, 1990). One of the principle
mixtures used to treat foliage for mildew and fungal infections is the
Bordeaux mixture used to spray vines which typically contains 0.05-2%
copper neutralized with soda lime (Pimentel & Marques, 1969). Copper
sulfate is used throughout the world to kill and inhibit the growth of
algae in municipal reservoirs, irrigation equipment and piping,
swimming pools and industrial cooling systems. It is also used in
animal feed additives and growth promoters, as well as for disease
control in livestock and poultry (Grant et al., 1990).
Copper enjoys limited use in human and veterinary medicine,
having been largely replaced by other compounds and treatments.
Copper is, however, a major constituent of many of the metallic
amalgams (e.g. mercury amalgams) used in dentistry. It is also used
to prepare intrauterine devices (IUDs).
4. ENVIRONMENTAL TRANSPORT AND DISTRIBUTION
4.1 Transport and distribution between media
The information reviewed in this section describes the environ
mental fate of copper. The factors affecting the distribution of
copper in air, water, sediment and soil are first described. This is
followed by a review of the factors influencing the bioaccumulation of
copper. This review is not intended to be exhaustive but rather to
present selected representative papers.
4.1.1 Air
Copper is released to the atmosphere in the form of particulate
matter or adsorbed to particulate matter. It is removed by
gravitational settling (bulk deposition), dry deposition (inertial
impaction characterized by a deposition velocity), washout by rain
(attachment to droplets within clouds), and rainout (scrubbing action
below clouds) (Schroeder et al., 1987). Removal rate and distance
travelled from the source depend on source characteristics, particle
size and wind velocity. Gravitational settling governs the removal of
large particles (> 5 µm), whereas smaller particles are removed by
other forms of dry and wet deposition. The relative importance of wet
as compared to dry deposition generally increases with decreasing
particle size (ATSDR, 1990).
Chakrabarti et al. (1993) analysed samples of rainwater (pH 5.3)
and snow (pH 4.7) in Canada; the total copper concentrations were 30.3
µg/litre in the rainwater and 24.6 µg/litre in the snow. In the
rainwater sample 98.3% of the copper was in the soluble phase (< 0.45
µm) and 1.7% in the particulate phase (> 0.45 µm) whereas in the snow
sample 80.5% was found in the particulate phase and 4.8% in the
soluble phase. Another snow sample (pH 3.9) was analysed and revealed
a copper concentration of 5.7 µg/litre with 4.7 µg/litre in the
soluble phase and 1.08 µg/litre in the particulate phase. Kinetic
results suggested that the copper in the snow sample was probably
bound to different sites having different bonding energies in
polyfunctional complexing agents. Four different copper species
having different dissociation rate constants were observed
(3.1 × 10⁻², 1.6 × 10⁻³, 6.2 × 10⁻⁵ and 8.8 × 10⁻⁶/s). Cheng et al.
(1994) found that the distribution of copper species in rainwater
collected in Ottawa, Canada, was very similar to that in the
previously reported snow sample. The rainwater sample contained 7.10
µg Cu/litre of which 2.03 µg/litre was in the particulate phase and
5.07 µg/litre in the soluble phase (< 0.45 µm). The scavenging ratio
of the copper concentration in precipitation (mg/litre) to air
concentrations (µg/m3) for large particles displays a seasonal
variation reflecting the more effective scavenging of snow compared
with rain (Chan et al., 1986).
There is large temporal and spatial variability in copper
deposition. Schroeder et al. (1987) reviewed deposition rates and
washout ratios for copper. Copper deposition rates in urban areas
were estimated to be 0.119 and 0.164 kg Cu/ha per year for dry and wet
deposition, respectively. Bulk deposition was reported to range from
0.002 to 3.01 kg Cu/ha per year. In rural areas bulk deposition was
reported to range from 0.018 to 0.5 kg Cu/ha per year and wet
deposition was 0.033 kg Cu/ha per year. The washout ratio is
114 000-612 000 (µg Cu/m3 rain)/(µg Cu/m3 air) [(140-751 µg Cu/kg
rain)/(µg Cu/kg air)].
Ottley & Harrison (1993) calculated the dry deposition flux of
copper to the North Sea to be 350 tonnes Cu/year. Migon et al. (1991)
studied the input of copper through rainfall and dry deposition to the
Ligurian Sea (Mediterranean) over a period of two years. The total
flux was calculated to be 1.85 kg Cu/km2 per year. A mean yearly
atmospheric input for copper was calculated at 98 tonnes. Fergusson &
Stewart (1992) estimated deposition flux for copper in the insoluble
component of bulk deposition derived from Christchurch city, New
Zealand. Copper fluxes followed approximately exponential decay
curves away from the city. Deposition rates varied from 0.83 µg
Cu/m2 per day (a remote site) to 21 µg Cu/m2 per day (an inner city
site). In the city and nearby rural areas soil is not a major source
of atmospheric copper, whereas at remote sites atmospheric copper is
mostly soil-derived.
The atmospheric wet deposition of copper at Chesapeake Bay, USA,
was examined during 1990 and 1991. The monthly integrated atmospheric
fluxes exhibited a high degree of spatial and temporal variability.
The arithmetically averaged annual wet flux was 260 µg Cu/m2
(Scudlark et al., 1994), and this was derived predominantly from
anthropogenic sources. Wu et al. (1994) calculated the dry deposition
flux for Chesapeake Bay to be 290-810 µm Cu/m2 per year. Dry
deposition fluxes for Lake Michigan were estimated at 690 and 800 µm
Cu/m2 per year.
Migon (1993) compared riverine and atmospheric inputs of copper
with the Ligurian Sea (Mediterranean). Atmospheric inputs were found
to be higher, with a ratio of 16.3 to 32.6.
Chan et al. (1986) reported that in southern Ontario, Canada
during 1982, the mean concentration of copper in precipitation was
1.57 µg Cu/litre of which 1.36 mg Cu/m2 was from wet deposition. The
mean concentrations of copper in precipitation were 1.36 and 1.58 µg
Cu/litre for central and northern Ontario, respectively. In both
areas the annual wet deposition averaged 1.13 mg Cu/m2.
Remoudaki et al. (1991) calculated the seasonal copper
atmospheric deposition to the western Mediterranean. Atmospheric
deposition of copper during the wet season ranged from 0.0004 to
0.0005 µg Cu/cm2 per day and during the dry season 0.0007 to 0.0014
µg Cu/cm2 per day.
Gorzelska (1989) analysed snowpack samples from 18 sites in the
vicinity of Inuvik, Canada during 1985 and 1986. Copper
concentrations ranged from 0.1 µg Cu/kg 20 km north of the town to
0.54 µg Cu/kg near a power plant. In all the samples the trace metals
were enriched with respect to crustal material. Mass balance
calculations have shown that most of the copper emitted by the local
sources is transported outside the immediate vicinity of the town.
4.1.2 Water and sediment
Several processes influence the fate of copper in aquatic
systems. These include complexation to inorganic and organic ligands,
sorption to metal oxides, clays, and particulate organic material,
bioaccumulation and exchange between sediment and water (Stiff, 1971;
Callahan et al., 1979).
Much of the copper discharged to water is in particulate form and
tends to settle out, precipitate out or be adsorbed by organic matter,
hydrous iron, manganese oxides and clay in the sediment or water
column. Equilibrium is normally reached within 24 h. Copper
discharged into a river leading into Chesapeake Bay contained 53 µg
Cu/litre, of which 36 µg/litre was in the form of settleable solids
(Helz et al., 1975). The concentration of copper 2-3 km downstream
from the outfall had fallen to 7 µg/litre. Copper in particulate form
includes precipitates, insoluble organic complexes and copper adsorbed
to clay and other mineral solids (Stiff, 1971).
Owing to unacceptable past practices, Macquarie Harbour on the
west coast of Tasmania, Australia contains dissolved copper levels as
high as 560 µg/litre as a result of riverine transport in dissolved
and particulate forms from the Mount Lyell copper mine (Carbon, 1996).
Some 97 × 106 tonnes of mine tailings and 1.4 × 10⁶ tonnes of slag
were deposited into the Queen and King river system over a 78-year
period before closure of the mine.
The copper(I) ion is unstable in aqueous solution, tending to
disproportionate to copper(II) and copper metal unless a stabilizing
ligand is present (Callahan et al., 1979). The only cuprous compounds
stable in water are insoluble ones such as the sulfide, cyanide and
fluoride. In its copper(II) state, copper forms coordination
compounds or complexes with both inorganic and organic ligands.
Ammonia and chloride ions are examples of species that form stable
ligands with copper. Copper also forms stable complexes with organic
ligands such as humic acids. In seawater, organic matter is generally
the most important complexing agent. Samples collected from the
surface waters (< 200 m) of the northeast Pacific revealed that over
99.7% of the total dissolved copper was associated with organically
complexed forms. At depths of 1000 m approximately 50-70% of the
copper was in the organically complexed form. Copper complexation
gave rise to very low cupric ion activities in surface waters, around
1 pg Cu2+/litre. The authors reported that two classes of
copper-binding ligands were identified: an extremely strong ligand at
low concentrations dominated in surface waters and a weaker class of
ligand at higher concentrations was found throughout the water column
(Coale & Bruland, 1988).
Tan et al. (1988) collected freshwater river samples from the
Linggi river basin, Malaysia. Samples were separated into colloidal
fractions and soluble fractions. Soluble fractions were classified
according to the lability of the copper forms in the water.
Categories range from very labile (e.g. free metal ion) to nonlabile
(e.g. colloidally bound metal). In this study 18-70% of the dissolved
copper was moderately labile and 13-30% was slowly labile.
Copper in the fresh and estuarine waters of the Cochin estuary,
India, was found to be extensively associated with organic colloidal
matter. The relationship between exchangeable and total particulate
copper did not show a significant correlation during the study,
emphasizing the role of lattice-incorporated copper as distinct from
particulate scavenged/adsorbed exchangeable copper (Shibu et al.,
1990).
A detailed study of the Tamar estuary, United Kingdom, revealed a
decrease in the alpha-coefficient for complexation of Cu2+ by natural
organic ligands (log alpha CuL) from 10.8 to 8.3 with increasing
salinity, demonstrating that major cations compete with copper for the
complexing sites. The free Cu2+ concentrations were very low (16.2
< pCu(II) < 18.2) throughout the estuary even though the total
dissolved copper concentrations were high (up to 300 nmol/litre),
probably because of complexation to dissolved organic complex (Van den
Berg et al., 1990).
Giesy et al. (1986) isolated dissolved organic carbon from nine
surface waters in the southeastern USA and found that the binding of
copper by humate occurs with different strengths at a number of sites,
the binding strength at the sites varying by two orders of magnitude,
dependent on the ratio of copper to total organic ligand.
Organic compounds form complexes with 94-98% of dissolved copper
in the surface waters of the North Sea. In all samples strong
copper-chelating compounds were found at concentrations of 4-10 µg
Cu/litre (60-150 nmol/litre). The major inorganic complexes in the
seawater samples were CuCO30 (60%), CuOH+ (16%) and Cu(OH)20
(16%) (Van den Berg, 1984).
Mackey & Higgins (1988) found that the strong copper-complexing
capacity of seawater can vary by more than three orders of magnitude.
Copper-complexing capacity was related to the phytoplankton biomass.
High values were associated with high phytoplankton mass, whereas when
the biomass was low the copper-complexing capacity was also low. The
authors found that in nutrient-limiting, oligotrophic waters of low
average productivity the copper-complexing capacity was variable.
Midorikawa et al. (1992) identified three classes of natural
organic ligands in coastal seawater classified by differences in their
complexing abilities for copper.
Gardner & Ravenscroft (1991) studied the behaviour of copper
complexation in rivers and estuaries of northeast England. They found
that copper speciation in rivers and estuaries is dominated by organic
complexation. The authors found a mixture of ligands of different
affinities for copper in natural waters. The complexation of copper
discharged to rivers and estuaries occurred very rapidly. Complexation
capacities were consistently in the range 10-25 µg Cu/litre (150-400
nmol/litre). The copper-complexing capacity of Linggi river water
(Malaysia) was in the range 26-74 µg Cu/litre (410-1160 nmol/litre)
(Tan et al., 1988).
Sharma & Millero (1988) measured the oxidation of copper(I) in
air-saturated solutions of seawater as a function of pH (5.3-8.6),
temperature (5-45 °C) and salinity (5-44%). The rate of reaction
increased with pH and temperature, and decreased with salinity (ionic
strength). The results indicate that the rates are controlled by the
concentration of Mg2+, Ca2+, Cl- and HCO3- through complex
formation and ligand exchange.
Bradley & Cox (1988) found that 80% of the measurable copper in
standard river sediment SRM 1645 was in the organic fraction. In
Yamuna river sediments, India, copper is mainly associated with the
organic matter owing to its high complexing tendency for organic
matter. A high percentage of copper is also found in the residual
fraction, and much lower concentrations are associated with the
carbonate and iron-manganese oxide phases (Gadh et al., 1993).
Calmano et al. (1993) studied the mobilization of copper from
contaminated sediments. The dominant mobilizing factor was pH with
mobilization increasing with increasing acidity. At pH values
of < 4.5 there was a strong influence of pH on mobilization. At
identical pH values the mobilized portions of copper from the oxic
sediment are tenfold higher than those from anoxic sediment.
Samanidou & Fytianos (1990) estimated a mobilization of 10-15% of
copper due to NTA and EDTA in two rivers in northern Greece, with no
consideration of the biodegradation of metal complexes. Samanidou et
al. (1991) estimated that humic substances (~2-3 mg/litre) were able
to cause the long-term release of 70-80% of copper in the same rivers.
In experimental studies copper was remobilized by synthetic complexing
agents more readily than other metals tested (cadmium, lead, manganese
and chromium).
4.1.3 Soil
In the terrestrial environment, a number of important factors
influence the fate of copper in the soil. These include the nature of
the soil itself, its pH, the type and distribution of organic matter,
the soil redox potential, the presence of oxides, the base status of
the soil and its cation exchange capacity (CEC), the rate of litter
decomposition and the proportions of clay to silt to sand particles.
The residence time of copper in the soil is also a function of overall
climate and of the vegetation present at a site.
Most copper deposited on soil from the atmosphere, from
agricultural applications and from sewage sludge amendments is
strongly adsorbed to the upper few centimetres of the soil. It is
especially bound to the organic matter, as well as being adsorbed by
carbonate minerals and hydrous iron and manganese oxides. Copper
binds more strongly than most other metals and is less influenced by
pH as a result. The greatest amount of leaching of copper occurs from
sandy soils, compared with clays and peats, whereas acidic conditions
favour copper leaching to the groundwater from the soil.
Lehmann & Harter (1984) studied the kinetics of copper desorption
from the A horizon of Paxton soil (surface soil), USA, following
addition of copper at rates ranging from 100 to 500 mg/kg. When 500
mg Cu/kg is added to this soil, about 94% is adsorbed within 15 min.
The copper appears to be preferentially adsorbed to high energy sites.
It appears that this soil is capable of retaining about 100 mg Cu/kg
on high-energy bonding sites. If the copper is present in excess of
the high energy sites, the surplus fills low-energy sites. This more
loosely bonded fraction continues to react for several hours. After 1
day this latter process reaches equilibrium, although the soil
continues to adsorb copper very slowly from solution for up to 4 days.
Assaad & Nielsen (1984) studied the adsorption of copper in three
Danish soil types (two orthic luvisols and a eutric fluvisol). The
Langmuir adsorption equation was found to be the best to describe
copper adsorption in these soils. Copper adsorption increased with
increasing soil pH (pH 4.91-8.48) and decreased with increasing
temperature (5-25 °C).
Petruzzelli et al. (1988) found that fly ash (10%) and humic acid
(1%) increased the adsorption of copper (up to 100 µg/ml) in histosol.
The addition of sewage sludge to a sandy loam soil increased the
sorption of copper solutions of differing concentrations (0.1-1.5 µmol
Cu/cm3). The authors suggested that new adsorbing sites become
available on the solid phase of the soil following "low metal" sludge
addition (Petruzzelli et al., 1994).
King (1988) incubated 13 soil types (10 mineral and 3 organic)
collected from the southeastern USA with 70 mg Cu/kg for 6 days. The
amount of copper adsorbed ranged from 36% to 100%. Removal of copper
from solution was much higher in surface soils than in subsurface
sandy soils. Nonexchangeable copper was relatively high (up to 100%)
in all but some of the acid subsoils. In the B and C horizons 96% of
the variation in sorbed copper was explained by pH, whereas copper in
the A horizon (surface soil) was unaffected by pH. The soil/water
partition coefficient for copper was > 64 for mineral soils and 403
for organic soils.
Elliott et al. (1986) studied pH-dependent adsorption of copper,
cadmium, zinc and lead on to four soils with differing chemical
properties. Copper and lead were more strongly retained under acidic
conditions (pH 5.0) than cadmium and zinc. Adsorption increased with
pH (pH 3-5). The removal of organic matter from the soils
substantially reduced the adsorption of copper.
Sanders & McGrath (1988) studied the extent of copper complex
formation by soluble organic matter extracted from an organic soil, a
clay and two sandy loams. Copper was extensively complexed in these
solutions. The percentage of copper existing as Cu2+ fell as the pH
increased, and also fell as the total copper concentration decreased.
Weight for weight, organic matter from the sandy loams was most
effective at forming complexes with copper within the experimental pH
range (pH 4-7) followed by the organic soil and then the clay.
Allard et al. (1991) studied the distribution of copper within an
illitic clay formation beneath an old (approx. 150 years) deposit of
sulfidic mine tailings. The adsorption in the lower pH range had
little impact on the mobility of copper: at pH levels in excess of 5,
copper is immobilized. The results suggest that transport of copper
originating from the tailings is diffusion controlled.
Tyler & McBride (1982) studied the relative mobility of copper
added to several mineral and organic soils and the simultaneous
desorption and leaching of metals determined by eluting soil columns
with 0.01 mol/litre calcium chloride. Copper was eluted much more
slowly and in much smaller quantities than zinc, cadmium or nickel.
Berggren (1992) studied the factors affecting the mobilization of
copper in spruce, beech and birch forest soil profiles (podzols and
cambisols) at two sites in Sweden. At a depth of 15 cm almost all of
the copper was found to be organically bound. The results also
indicate that organically-complexed copper constituted the predominant
copper form in soil solutions at 50 cm despite the relatively low
dissolved organic carbon (3-14 mg/litre) and the highly
aluminium-saturated organic compounds.
Strain et al. (1984) studied the leaching of copper by simulated
"acid" rain (pH 2.8-4.2) applied in rainwater to soil from Swedish
spruce forest polluted by a brass mill. Leaching of copper increased
considerably when water at pH < 3.4 was applied to the soil.
Campanella et al. (1989) found that UV (mercury lamp) irradiation
of urban sludge resulted in an increased mobility of copper eluted
with sulfuric acid; this was attributed to degradation of organic
matter through radical reactions which provoked the formation of
smaller molecules acting as more soluble metal carriers.
Wong et al. (1993) found that a copper(II)-accumulating bacterial
strain (Pseudomonas putida II-11) isolated from electroplating
effluent removed a significantly high amount of copper(II) from growth
medium and buffer. The adsorption was pH dependent with a maximum at
pH 8.0.
Groudev & Groudeva (1993) studied the microflora of four
industrial copper dump leaching operations. It was found that copper
solubilization depended mainly on the amount and activity of the
mesophyllic acidophilic chemolithotrophic bacteria which occurred in
the ore dumps.
4.1.4 Sewage sludge inputs to land
Land treatment is increasingly being utilized as a method of
waste disposal for sewage effluent and sludge. The intent is to
combine the benefits of fertilizer effects and organic additions to
soils, with safe land disposal of the large quantities of domestic
sewage being generated (Brown et al., 1983; Juste & Mench, 1992; Henry
& Harrison, 1992). Sewage effluent and sludges vary greatly in their
content of metals and especially when domestic sewage is not separated
from industrial sources the metal levels can be high (e.g. for
chromium, copper, zinc, nickel, cadmium) and can pose potential
hazards as a result of metal accumulation if applied to land at high
rates over the long term. There are a number of sources of copper in
sewage effluent and sludge including human excreta, from the corrosion
of copper pipes in domestic water supplies and from direct additions
from industrial processes. In view of the recent interest in the
sustainability of agricultural land focus has been on the potential of
land treatment to cause elevated and toxic levels in the soils.
Present national and regional guidelines are aimed at protecting such
amended land into the future (Table 4).
Copper concentrations in sewage sludge vary greatly. For example,
Hedberg et al. (1996) quote copper concentrations from 0 to 16 000
mg/kg per day sludge for Finland, with a median value of 214 mg Cu/kg.
In nine different sewage districts in Norway the levels in sludge
varied from 100 to 500 mg Cu/kg d.s. For this Norwegian data set,
there was a relationship between the copper content in the sewage
sludge and the pH of the drinking-water. The average copper content
in the sludge was 140 mg Cu/kg d.s. for those drinking-water plants
with pH adjustments (pH increased to 8-8.5) while the average copper
content in the sewage sludge which had received water without pH
adjustments was 320 mg Cu/kg d.s. Attempts to reduce the corrosivity
of piped water supplies can lead to changes in the copper (and iron)
in sewage sludge.
Copper, like other metals applied to land by sludge or effluent
amendments, is rather strongly adsorbed in the upper surfaces,
especially by organic matter, for prolonged periods. It is already
organically bound and, upon release by respiratory breakdown, is then
re-absorbed. Juste & Mench (1992) examined the long-term effects of
sewage sludge applications (10 years or more in duration) on metal
distribution in the soil profile as well as crop responses and metal
uptake from field trials in the EC and the USA. In almost all cases,
sludge-borne metals appeared to remain in the zone of sludge
incorporation to soils (0-15 cm). Mass balances on metal recoveries
from soil additions ranged from 30% to 90%. Lateral soil movement was
the main explanation of the progressive disappearance of metal from
Table 4. Directives for maximum allowed metal concentrations in sewage sludge
used as a soil improvement agent in agriculture (From: Hedberg et al., 1996)
Country/ Maximum allowed metal concentration (mg/kg dry weight)
area
Copper Zinc Lead Cadmium
EUa 1000-1750 2500-4000 750-1200 20-40
Denmark 1000 4000 120 0.8
Germany 800 2500 900 10
Finland 600 1500 100 1.5
France 1000 3000 800 20
Netherlands 75 300 100 1.25
Norwaya 1000-1500 1500-3000 100-300 4-10
Sweden 600 800 100 2
USA (EPA) 1500-4300 2800 300-840 89
a The higher level is valid for application on greenlands
experimental plots. Copper was a good deal less bioavailable to crops
from sludge amendments than cadmium, nickel and zinc, but somewhat
more mobile and bioavailable than lead.
In forest soils the retentivity of copper in the profile may be
even greater from sludge amendments than in agriculture systems. For
example, Zabowski & Zasoski (1987) equilibrated three soil horizons
(A, B2 and C) of an acidic forest soil with copper solutions in the
presence and absence of municipal sewage sludge leachate. Copper
binding to the soils in each of the three horizons was greater than
that of cadmium or zinc. Sludge leachate reduced copper adsorption in
all three horizons.
In the great majority of sludge metal studies done to date,
although copper is a constituent of the sludge, it is very rarely the
element which imposes the limits for addition of sludges or sewage
effluent to land.
4.1.5 Biodegradation and abiotic degradation
Copper is transformed in the environment to forms that are either
more or less bioavailable, depending upon the physical and chemical
conditions present in the environment of interest. For information on
the speciation of copper, see section 2.4.
4.2 Bioaccumulation
Bioaccumulation is defined as the net uptake of copper by
microorganisms, plants or animals from their surrounding environment
(water, sediment, soil and diet). The species of copper present in
environmental media and its associated bioavailability, together with
differences in plant and animal uptake and excretion rates, determine
the extent of bioaccumulation. For aquatic organisms bioconcentration
refers specifically to water.
4.2.1 Microorganisms
Sahoo et al. (1992) found that a bacterial (Bacillus circulans)
biomass of 1.48-1.52 g/litre (dry weight) removed 80% of copper in a
495 mg Cu/litre solution. A reduction of the pH was detrimental to
the accumulating capacity of the bacteria.
Bengtsson et al. (1983) grew the hyphomycete (fungus)
Verticillium bulbillosum in agar containing 15, 45 or 150 mg
Cu/litre for one week. Mean copper concentrations in the mycelium
were, respectively, 1296, 2608 and 3245 mg/kg for the three exposure
concentrations.
4.2.2 Aquatic plants
Bioaccumulation factors have been calculated for over 20 species
of marine macroalgae showing maximum values up to 27 000, depending on
the exposure concentration (Bryan & Hummerstone, 1973; Phillips,
1977; Malea et al., 1994; Correa et al., 1996).
Hall et al. (1979) found that a nontolerant strain of the brown
alga Ectocarpus siliculosus exposed to various copper concentrations
(up to 250 µg/litre) displayed higher accumulation values than did a
tolerant strain. At 72 h incubation, the tolerant strain accumulated
mean copper values of 20 mg/kg (wet weight) with no added copper and
234 µg/kg at 250 µg Cu/litre in the medium (Hall, 1981). The same
strain incubated for 14 days displayed accumulation values of 13 mg/kg
with no added copper and 1075 mg/kg at 250 µg Cu/litre in the medium.
Reed & Moffat (1983) exposed the green alga Enteromorpha compressa
to copper concentrations of up to 610 µg/litre (9.6 µmol/litre) for 6
days. Copper accumulation was linearly dependent on the exposure
concentration and the pattern was similar in both the tolerant and
non-tolerant strains. Mean maximum concentrations in the algae were
22.2 mg Cu/kg (0.35 µmol/g) (fresh weight) for the nontolerant strain
and 25.4 mg Cu/kg (0.4 µmol/g) for the tolerant strain. Equilibrium
was not reached within the experimental time period.
Mersch et al. (1993) maintained the aquatic moss
Rhynchostegium riparoides in water containing copper levels ranging
from 4.5 to 50 µg/litre for 27 days. Accumulation was rapid and
reached a plateau after 18 days. At the end of the 14-day depuration
phase the moss had lost 50% of the accumulated copper. Claveri et al.
(1994) studied the uptake of copper (5-342 µg/litre) by
R. riparoides for periods of up to 168 h. The accumulation of
copper occurred predominantly during the initial 96 h and had reached
equilibrium within 168 h. Copper concentrations in the mosses ranged
from 30 to 2500 mg/kg (dry weight). During the 10 day depuration
period there was a rapid decrease in copper levels during the first 72
h after which copper concentrations in the mosses approached
equilibrium values ranging from 32 to 700 mg/kg (dry weight).
Sinha & Chandra (1990) studied the accumulation of copper
(0.05-5.0 mg/litre) by the aquatic plant Bacopa monnieri for 168
days. Accumulation was directly related to the exposure
concentration. Copper concentrations in shoots ranged from 20 to 721
mg/kg (dry weight) and in roots from 195 to 3821 mg/kg.
The uptake of copper by duckweed (Lemna minor) and water velvet
(Azolla pinnata) was investigated by Jain et al. (1989). Plants
were grown in copper solutions of 1, 2, 4 or 8 mg/litre under static
renewal conditions for 14 days. Copper concentrations in the plants
ranged from 979 to 6714 mg/kg (dry weight) for duckweed, and from 1159
to 7725 mg/kg for water velvet. Uptake rate was highest at the lower
exposure concentrations; concentration factors ranged from 51 to 60
for duckweed, and from 58 to 66 for water velvet. Dirilgen & Inel
(1994) grew duckweed (Lemna minor) in Jacob nutrient medium at
copper concentrations ranging from 0.23 to 2.03 mg/litre for 7 days.
Bioconcentration factors, based on copper content of plants on a dry
weight basis, were 1447, 444 and 314 at copper concentrations of 0.23,
1.03 and 2.03 mg/litre, respectively.
Kay et al. (1984) exposed water hyacinths
(Eichhornia crassipes) to copper (0.5-5.0 mg/litre) for 6 weeks. At
the highest copper concentration levels in leaves, stems roots and
dead tissue were 321, 710, 8160 and 5151 mg/kg (dry weight)
respectively; bioconcentration factors ranged from 64 to 1632. Nor &
Cheng (1986) grew water hyacinths in 2 mg/litre copper solutions.
Fulvic acid (10-50 mg/litre) did not affect the uptake of copper by
Eichornia; however, humic acid (20 and 50 mg/litre) strongly
inhibited copper uptake. In the absence of ligands Eichornia
accumulated 204 and 2451 mg/kg (dry weight) from copper solutions of 1
and 10 mg/litre, respectively.
4.2.3 Aquatic invertebrates
Hansen et al. (1995) exposed the marine demosponge
Halichondria panicea to dissolved copper concentrations ranging from
0.45 (control) to 1000 µg/litre for 14 days. The sponge accumulated
copper in direct proportion to the concentration of the dissolved
metal in the surrounding medium. Final body copper concentrations
were 236 and 818 mg/kg (dry weight) at exposure concentrations of 300
and 1000 µg dissolved Cu/litre, respectively. There was no
significant loss of copper during an 8 day depuration period. The
authors proposed this species as a suitable biomonitoring organism.
Elliott et al. (1985) found that the marine mussel
Mytilus edulis exposed either continually, or in a 2 day cycle, to
copper (10 µg/litre) exhibited a linear accumulation over a 40 day
period. Mussels exposed under cycled conditions showed a lower rate
of accumulation. Copper accumulation was not in direct proportion to
the time exposed to the elevated concentration. The presence of
cadmium reduced the accumulation factor by 50%.
Holwerda (1991) exposed freshwater clams (Anodonta cygnea) to
copper (47 µg/litre) for 6.5 weeks. An accumulation factor of 55 was
calculated for the exposure period. Crecelius et al. (1982) exposed
clams (Macoma inquinata) and shrimps (Pandalus danae) to copper
concentrations ranging from 5 to 30 µg/litre for one month. Body
burdens ranged from 25 to 97 mg Cu/kg (dry weight) for clams and from
146 to 322 mg Cu/kg for shrimps. Ageing of the solutions prior to
exposure reduced the bioavailability of copper. In a static system
with added sediment more than 50% of the added Cu2+ became bound to
the organic fraction of the sediment and was unavailable to
suspension-feeding clams (Protothaca staminea); however,
deposit-feeding clams (Macoma inquinata) placed in the sediment
doubled their copper body burden within 2 months.
Biological half-lives for depuration of copper from "green"
oysters (Crassostrea gigas) and mussels (Mytilus smarangdium) from
a copper-contaminated area, and "normal" oysters were 11.6, 6.4 and
25.1 days, respectively (Han et al., 1993).
Rainbow & White (1989) exposed decapods (Palaemon elegans),
amphipods (Echinogammarus pirloti) and barnacles
(Elminius modestus) to copper at concentrations ranging from 31.62
to 3162 µg/litre for 28 days. Whole-body copper levels (129.3 mg/kg)
are regulated in the decapods at exposures up to and including 100
µg/litre and at higher exposures there is net accumulation. In
amphipods and barnacles there was net accumulation of copper at all
exposures with no apparent regulation of copper levels.
Weeks & Rainbow (1991) exposed the talitrid amphipods
Orchestia gammarellus and O. mediterranea to copper concentrations
ranging from 31.6 to 3162 µg/litre for 21 days. Mean rates of copper
accumulation (measured as net accumulation of total copper) ranged
from 0.9 to 77.0 µg/g per day for O. gammarellus in a dose-related
manner; rates of accumulation in O. mediterranea ranged from 1.19 to
28.1 µg/g per day showing an increase with copper exposure at
concentrations < 100 µg/litre. Weeks & Rainbow (1993) fed the
talitrid amphipods O. gammarellus and O. mediterranea on discs of
algae treated with copper (16.3-2070 mg/kg) for 21 days.
O. gammarellus accumulated whole-body copper concentrations
ranging from 104 to 163 mg/kg; haemolymph concentrations ranged from
525 to 677 mg/kg (dry weight). Rates of accumulation ranged from 0.52
to 4.71 µg/g per day, increasing with increasing copper exposure. The
rates of accumulation for O. mediterranea remained fairly constant
at all exposure concentrations (0.28-0.37 µg/g per day) except the
highest (1.61 µg/g per day). It was concluded that for
O. gammarellus accumulation of copper from food was a more important
route than accumulation of copper from solution. O. mediterranea
was unable to satisfy its copper requirements from a food source but
was able to do so from solution.
Weeks et al. (1993) exposed shore crabs (Carcinus maenus) to
750 µg Cu/litre for up to 7 days at various salinities. Copper
accumulated in the gills and midgut gland but not in muscle. The
accumulation of copper in gill tissue was positively correlated with
salinity.
Ozoh (1994) exposed ragworms (Hediste diversicolor) to a copper
concentration of 200 µg/litre for up to 15 days. At 12 °C, low
salinity (7.5%) increased the availability of copper to the worms and
more copper was accumulated, copper concentrations ranging from 83.27
to 183.12 mg/kg (dry weight). Increasing salinities of 15.25 and
30.5% reduced the accumulation of copper. At 17 and 22 °C more copper
was accumulated than at 12 °C, with copper concentrations ranging from
58.7 to 784 mg/kg. The addition of sediment to the test system
reduced the accumulation of copper by the worms (Ozoh, 1992b).
Zia & Alikhan (1989) found that crayfish (Cambarus bartoni)
accumulated copper concentrations ranging from 130 to 296 mg/kg after
exposure to copper concentrations ranging from 125 to 500 µg/litre for
4 weeks. Copper was predominantly accumulated in the gills and
hepatopancreas.
Winner (1984) exposed Daphnia magna to copper (30 µg/litre) for
7 days; during this period daphnids accumulated whole-body copper
residues of 70.7 mg/kg (dry weight). The addition of 0.75 mg humic
acid/litre had no significant effect on the accumulation of copper.
Giesy et al. (1983) found that the presence of organic matter
decreased the accumulation of copper by the softwater cladoceran
Simocephalus serrulatus. When bioconcentration factors (BCF) were
calculated using Cu2+ the BCFs were similar for the different water
types tested, while when based on total copper concentrations they
varied greatly owing to varying amounts of organic matter. The
authors concluded that most of the copper accumulated by this species
was Cu2+ or the labile aquatic forms and that a decrease in Cu2+ due
to binding of copper by organic matter reduced accumulation.
Vogt & Quinitio (1994) exposed juvenile giant tiger prawns
(Penaeus monodon) to 1 mg Cu/litre for 10 days. Copper deposition
was investigated by histochemistry and electron microscopy. Copper
granules were accumulated in large quantities in the hepatopancreas
tubules, the amount and size of the granules increasing along the
tubules in relation to the cells' age. The granules were released by
discharge of senescent hepatopancreas cells and were added to the
faeces.
Timmermans & Walker (1989) exposed fourth instar larvae of the
midge Chironomus riparius to copper (50 or 100 µg/litre). Larvae
accumulated copper with increasing levels of exposure, but very small
amounts were recovered in pupae or imagines. Average body burdens were
approximately 425 and 750 ng copper, respectively, for the two
exposures.
Dodge & Theis (1979) reported that copper (85 or 325 µg/litre)
was accumulated from solutions by midge larvae (Chironomus tentans)
in which the dominant aqueous forms were free Cu2+ ion and a copper
hydroxy complex reaching concentrations in excess of 200 mg/kg (dry
weight). No significant uptake was observed when copper-glycine and
copper-NTA complexes were dominant.
4.2.4 Fish
Peres & Pihan (1991b) exposed carp (Cyprinus carpio) for up to
3 weeks to copper concentrations of 20, 40 and 120 µg/litre at water
hardnesses of 50, 100 and 300 mg CaCO3/litre, respectively. Accumu
lation in gills after 3 weeks was 53, 58 and 78 mg/kg dry weight for
the three exposure conditions, compared to 13 mg/kg initially.
Daramola & Oladimeji (1989) exposed the freshwater fish
Clarius anguillaris and Oreochromis niloticus to copper for 8
weeks. For C. anguillaris, whole body accumulation was 15.7, 21.8
and 31.2 µg Cu/g dry weight for exposure concentrations of 27, 55 and
110 µg Cu/litre, compared to 6.9 µg Cu/g in control fish. For
O. niloticus, accumulation was 34.7, 36.1 and 81.0 at exposures of
0.05, 0.10 and 0.20 µg Cu/litre, respectively, compared to 17.6 µg
Cu/g in controls.
Playle et al. (1992) studied the accumulation of copper (16
µg/litre) on the gill of fathead minnow (Pimephales promelas)
exposed for 2-3 h. The addition of Ca2+ (2100 or 4200 µeq/litre)
reduced gill copper accumulation during exposures at pH 4.8 but not at
pH 6.3. EDTA eliminated copper deposition at both pH levels when
equimolar with copper, but reduced copper deposition by 50% when half
equimolar at pH 4.8. The authors concluded that copper accumulation
on the fish gills was reduced by Ca2+ and H+ competition at the
gill surface, and by EDTA complexation of copper in the ambient water.
Buckley et al. (1982) exposed coho salmon
(Oncorhynchus kisutch) to copper at concentrations of 70 and 140
µg/litre for 15 weeks. Copper accumulation in liver was greatly
elevated, averaging approximately 180 and 320 µg Cu/g dry weight
versus 60 µg Cu/g in control fish in the latter half of the
experiment. Gill concentrations were also significantly elevated,
averaging 5.6 µg Cu/g and 9.5 µg Cu/g compared to 3.2 µg Cu/g in
controls. Copper concentrations in plasma were not significantly
elevated by copper exposure except during the first day, while
concentrations in kidney were only slightly elevated (6.6, 7.2 and 9.4
µg Cu/g dry weight for controls, low and high exposures,
respectively).
Lanno et al. (1985) fed rainbow trout (Oncorhynchus mykiss)
diets containing various levels of copper. For an 8 week exposure,
copper concentrations in liver ranged from 127 µg/g dry weight for a
diet containing 8.5 mg/kg dry weight to 3200 µg Cu/g for a diet of
3100 mg Cu/kg. For a 24 week exposure, accumulation in liver ranged
from 295 µg Cu/g for a diet of 8.5 µg Cu/g to 1640 µg Cu/g for a diet
of 660 µg Cu/g, while concentrations in kidney ranged only from 8.5 to
21.8 µg Cu/g.
Mount et al. (1994) fed rainbow trout (Oncorhynchus mykiss) on
a brine shrimp (Artemia sp.) diet containing 9.4, 440, 830 or 1000
mg Cu/kg (dry weight) for up to 60 days. After 35 days whole-body
copper concentrations were 5.9, 36, 43.5 and 57.5 mg Cu/kg (dry
weight) for the control and three doses, respectively, but after 60
days copper levels had fallen to 3.6, 19.6, 22.4 and 27.7 mg Cu/kg.
In a second experiment fish were fed diets containing copper
concentrations ranging from 7.8 to 320 mg Cu/kg. Whole-body copper
concentrations ranged from 2.7 to 35.8 mg Cu/kg after 35 days, and
from 2.3 to 8.8 mg Cu/kg after 60 days.
4.2.5 Terrestrial plants
Terrestrial plants respond in a number of ways to copper in the
soils on which they grow. Rooted species are subject to exposures
which vary seasonally and over the plants' lifetime. Perennial and
especially long-lived species may experience wide changes in exposure
over time. Species differ both in their requirements and in their
tolerances for copper. Indeed, some terrestrial species are well
known and used in mineral prospecting as copper indicators. These
include both mosses and higher plants. Others are hyperaccumulators
(Brooks, 1977; Baker & Brooks, 1989; Brooks et al., 1992). Among the
metal accumulators, a number of species from widely different plant
families can accumulate from 2000 to 14 000 µg Cu/g (dry weight) in
foliage, compared with 20-40 µg Cu/g (dry weight) in other species
(Baker & Brooks, 1989).
In Austria, the average copper level in soils was 17 µg/g and
that in vegetation 12 µg/g; for Belgium it averaged 17 µg/g for soil
and 17 µg/g for vegetation; in Finland, 4.3 µg/g for soil and 6.1 µg/g
for vegetation; and for Germany 22 µg/g for soil and 24.5 µg/g for
vegetation (Angelone & Bini, 1992).
In studies of copper tolerant and sensitive strains (varieties)
of the forage grass (Festuca rubra) Wong et al. (1994) showed that
copper concentrations in hydroponic solution of 50 µg/g allowed growth
of a tolerant variety whereas even 5 µg Cu/g inhibited a sensitive
strain. Root copper concentrations reached 750 µg/g in the tolerant
strain exposed to 1 µg Cu/g, whereas in the sensitive strain they were
about 390 µg/g at the same exposure. In contrast, in the shoots of
these same plants exposed to 1 µg Cu/g the tolerant plants contained
18 µg Cu/g and the sensitive plants 10 µg Cu/g. Higher root than shoot
concentrations of copper are normal in terrestrial plants.
In contrast to the situation for aquatic biota, copper levels in
soils can vary over a wide range of concentrations and plant genetic
tolerances allow an equally wide range of responses to these copper
exposures. Copper levels in foliage can be below the soil
concentrations over which they grow or can be very much higher in
accumulator species.
4.2.6 Terrestrial invertebrates
Moser & Wieser (1979) fed snails (Helix pomatia) on a diet
containing 230 or 1390 mg Cu/kg for 3 weeks. Animals exposed during
the summer accumulated copper concentrations ranging from 76 mg/kg
(dry weight) (buccal mass and oesophagus) to 238 mg Cu/kg (intestine).
Copper contents of midgut gland and foot were 44.7 and 56.0 µg/kg (dry
weight) respectively. In snails exposed during the winter months much
higher concentrations were accumulated, ranging from 106 mg Cu/kg in
the buccal mass and oesophagus to 1621 mg Cu/kg in the intestine. In
short-term (2-10 days) feeding experiments with lettuce containing
1390 mg Cu/kg, about 97% of the metal ingested remained in the snail.
Berger & Dallinger (1989) fed terrestrial snails (Arianta arbustorum)
on copper-enriched agar at concentrations of 209 mg Cu/kg or 723 mg
Cu/kg (dry weight). The highest concentrations of copper following
exposure to the lower concentration for 21 days were in the midgut
(492 mg Cu/kg). The copper concentration of the faeces increased
continuously during the experiment but the highest value recorded at
69.5 mg Cu/kg was only one-third of the concentration in the food.
In a 14-day copper balance study utilizing the higher dose
(723 mg/kg) the mean rate of copper uptake was 6 µg/day. The main
site of copper storage seemed to be the foot/mantle tissues where 49%
of the ingested copper was found. The efficiency of copper
assimilation always exceeded 95%. Dallinger & Wieser (1984)
maintained snails (Helix pomatia) on a diet of lettuce enriched with
533.8 mg Cu/kg for 32 days. Copper contents of foot (0.579 g dry
weight), midgut gland (0.326 g dry weight) and posterior gland (0.057
g dry weight) were 90.1, 42.7 and 15.0 µg after 32 days; copper
contents in foot and midgut gland had fallen to 39.6 and 23.1 µg after
38-48 days on a "clean" diet. Copper was distributed more evenly in
the organs of the snail than the other metals investigated (lead, zinc
and cadmium); the midgut gland did not play such a dominant role in
the storage of copper.
Dallinger & Wieser (1977) exposed three species of isopods to
copper concentrations of 340 and 5200 mg/kg (dry weight) in food
(birch litter) for 14 days. When feeding on natural litter with a low
concentration (20 mg Cu/kg) all three species lost more copper through
their faeces than they ingested. When fed artificially enriched
litter the efficiency of assimilation increased, so that at the
highest concentration tested between 80% and 99% of the ingested
copper was assimilated. Isopods are capable of digesting even tightly
bound copper during one passage of food through the gut. However,
they are unable to resorb more copper than they lose unless the food
is enriched with soluble copper or the rate of food passage through
the gut is slowed down.
4.2.7 Terrestrial mammals
Dodds-Smith et al. (1992a) maintained shrews (Sorex araneus) on
a diet containing copper at an intake of 2.13 mg/day for 12 weeks.
Mean whole-body copper concentrations were 23.6 mg/kg (dry weight) in
males and 64.8 mg/kg in females; mean total body burden was 64.7 µg Cu
in males and 150.1 µg Cu in females. Mean copper concentrations were
31.0 and 23.4 mg/kg in kidneys of males and females, and 192.5 and
820.5 mg/kg in livers of males and females, respectively (Dodds-Smith
et al., 1992b).
5. ENVIRONMENTAL LEVELS AND HUMAN EXPOSURE
5.1 Environmental levels
There is a very large amount of information on the levels of
total copper in the various environmental compartments but little
information on speciation. Therefore, an attempt has been made to
summarize those values related to temporal or geographical trends,
polluted sites and known sources of copper.
The largest release of copper is to land; the major sources of
release are mining operations, agriculture, solid waste, and sludge
from sewage treatment works. Mining and milling contribute most of
the solid wastes. Copper is released to water as a result of
natural weathering of soil, discharges from industries and sewage
treatment plants, and from antifouling paints. Copper compounds may
also be intentionally applied to water to kill algae. Copper is
emitted to the air naturally from windblown dust and volcanoes;
however, anthropogenic sources contribute more to modern atmospheric
levels from activities such as primary copper smelters, ore processing
facilities and incineration (ATSDR, 1990).
5.1.1 Air
Hong et al. (1996) measured copper concentrations in Greenland
ice samples. The results revealed that anthropogenic sources of
atmospheric copper first occurred in the Bronze Age, and that peaks of
pollution occurred 2000 years ago due to the Romans and 900 years ago
due to the Sung dynasty in China, before rapidly rising over the last
century with some evidence of decline in recent years.
The concentrations of copper in air depend on the proximity of
the site to major sources such as smelters, power plants, and
incinerators. Average concentrations are in the range 5-50 ng Cu/m3
in rural areas and 30-200 ng Cu/m3 in urban locations (Nriagu,
1979b). Evans et al. (1984) reported on the US EPA's national
surveillance network for the years 1977, 1978 and 1979. Copper levels
in air were 133, 138 and 96 ng/m3, respectively, for urban samples
and 120, 179 and 76 ng/m3 for non-urban samples. In the study 10 769
urban and 1402 non-urban air samples collected for 24 h were analysed.
The maximum urban and non-urban copper concentrations were 4625 and
4003 ng/m3, respectively.
Atmospheric copper concentrations at the South Pole were found to
range from 25 to 64 pg/m3 with a mean value of 36 pg/m3 (Zoller et
al., 1974). Copper concentrations in Atlantic aerosols were collected
during 1980-1982. Mean concentrations ranged from 1.0 to 4.5 ng/m3
for the North Atlantic and from 0.29 to 0.31 ng/m3 for the South
Atlantic. In remote areas of the Atlantic, where the influence of
continental sources is less, oceanic copper can make up over half of
the total copper in the aerosol (Chester & Murphy, 1986).
Sweet et al. (1993) analysed airborne particulate matter in
southeast Chicago and East St Louis, USA. Copper concentrations
ranged from < 0.1 to 1610 ng/m3 in fine particles (< 1-2.5 µm), and
from < 0.1 to 224 ng/m3 in coarse particles (2.5-10 µm). Concen
trations were found to be higher in samples from St Louis; these
higher levels of copper in both fine and coarse fractions occurred in
winds from the direction of several nonferrous metal smelters.
Anderson et al. (1988) analysed atmospheric aerosols collected in
Chandler, Arizona, USA in 1982. Several major copper smelters are
located approximately 120 km southeast of the sampling point. The
most abundant copper-bearing particle (particles containing > 0.5%
copper), representing 74% of the total, was associated with sulfur,
16% was associated with silicon and 4% was associated with chloride.
Germani et al. (1981) reported that mean copper levels in particulate
matter were found to be 2800 and 6800 ng Cu/m3 in the plumes of two
copper smelters in Arizona, USA. Mean concentrations ranging from
2000 to 9500 ng Cu/m3 were reported for the first 8 km of plumes from
five copper smelters (Small et al., 1981). Atmospheric particulate
aerosol samples were collected at sites along the normal plume pathway
at distances ranging from 2.5 to 8.0 km from a copper smelter (western
Poland). Copper concentrations were inversely correlated to distance
with levels of 165, 89 and 51 ng Cu/m3 (2.6, 1.4 and 0.8 nmol/m3) at
distances of 2.5, 5.0 and 8.0 km, respectively (Zwozdziak et al.,
1985).
Romo-Kröger & Llona (1993) analysed aerosols in the Chilean
central Los Andes mountain range at varying distances from a copper
mine. Copper concentrations in fine (< 0.4 µm) particles ranged from
414 ng/m3 (5 km from the mine) to 22 ng/m3 at > 25 km from the
mine. A similar correlation between distance from the mine and copper
levels was found for coarse (> 8.0 µm) samples although levels were
lower, ranging from 40 to 101 ng Cu/m3. Romo-Kröger et al. (1994)
found that copper levels were related to mining operations. Sampling
at 13 km from the mine revealed copper concentrations of 66 and 131
ng/m3 for fine (< 2.5 µm) and coarse (2.5-15 µm) particles,
respectively, during mining operations. Sampling during strike
periods gave levels of 22 and 50 ng Cu/m3, respectively.
Johnson et al. (1987) reported elevated levels of copper in fog
water 3 km downwind of a refuse incinerator in Switzerland. Highest
copper concentrations were associated with lower pHs. The maximum
concentration was 673 µg Cu/litre (10.6 µmol/litre) at pH 1.94, with
levels > 127 µg Cu/litre being associated with pH values < 3.6.
The annual average concentrations of copper in aerosols < 10 µm
in the Netherlands varied between 11 and 25 ng/m3. None of the eight
sites was directly affected by industrial sources (Slooff et al.,
1989).
5.1.2 Water and sediment
Copper is widely distributed in water because it is a naturally
occurring element. Nriagu (1979b) reported average copper levels in
seawater ranging from 0.15 µg/litre in open ocean to 1.0 µg/litre in
polluted near-shore waters; levels in fresh water were 1.0-20
µg/litre. Other reports indicate that copper concentrations in
seawater are highly variable, ranging from 0.005 µg/litre in the Black
Sea (Haraldsson & Westerlund, 1988) to 40 µg/litre in estuaries in
southwest Spain (Cabrera et al., 1987). Additional variation in
copper concentrations is related to depth and the area in the ocean
examined. Surface concentration in the North Pacific Ocean drops from
0.1 µg Cu/litre (1.2 nmol/kg) in the California Current to 0.03-0.04
µg Cu/litre (0.4-0.5 nmol/kg) in the central oceanic region, and
increases to 0.24 µg Cu/litre (3 nmol/kg) in deep waters (Boyle et
al., 1977; Bruland, 1980). In the North Atlantic Ocean surface waters
display values of copper from 0.07 µg/litre (1.1 nmol/kg) to 0.11
µg/litre (1.7 nmol/kg), whereas concentration of the metal increases
to 0.13-0.26 µg/litre (2-4 nmol/kg) in deep waters (Moore, 1978).
Similarly, in the Ligurian Sea, Italy, Fabiano et al. (1988) reported
3.57-16.6 µg dissolved Cu/litre in the surface layer (0-50 m) and
0.7-2 µg/litre in deeper waters (200-2000 m). Bryan & Langston (1992)
reported dissolved copper concentrations of up to 600 µg/litre for
Restronguet creek, a branch of the Fal estuary, United Kingdom, which
receives acidic drainage from past and present mining activity.
Bubb & Lester (1994) found mean copper concentrations in total
and soluble (filter size 0.2 µm) river water for the river Stour,
United Kingdom, to be 5.8 (3.0-19.5) and 2.2 (1.0-5.5) µg/litre,
respectively. Background levels were 1.0 µg Cu/litre derived from an
upper catchment control site. Fourfold increases in copper
concentrations were apparent downstream of a sewage treatment works.
Dissolved copper was monitored for 11 months in four recreational
marinas, a large harbour, two major river systems and a heavily used
shipping canal in Chesapeake Bay, USA. Mean copper concentrations
were 9.1, 13.2, 17.8 and 18.2 µg/litre for the four marinas, 7.9
µg/litre for the harbour, 6.4 and 11.9 µg/litre for the two river
systems and 9.6 µg/litre for the shipping canal. Copper concentrations
ranged from < 10-80 µg/litre for the marinas to 10-14 µg/litre for
the harbour and 10-20 µg/litre for the river systems and the shipping
canal. The authors concluded that the likely source of the highest
copper concentrations was from antifouling paints used on boats in the
marinas (Hall et al., 1988). An evaluation of dissolved copper
concentrations at three sampling stations in 1989 showed that mean
concentrations from biweekly sampling for four months were 2.7, 7.8
and 10 µg Cu/litre. Copper concentrations decreased with distance from
marinas, and at all three stations were significantly lower in 1989
than in 1988 (Hall et al., 1992).
Parrish & Uchrin (1990) sampled Lakes Bay, near Atlantic City,
USA during the summer of 1986. Dry weather concentrations of copper
were found to be typical of those found in natural waters, but higher
levels were recorded during storm events. Significant amounts of
copper were found to originate from a major stormwater sewer which
discharges into the bay. Total copper in runoff from a car park near
Portland, Oregon, USA varied among different storm events over a wide
range of concentrations (< 2-33 µg/litre). Copper levels in a
detention pond ranged from 5 to 12 µg/litre. Copper was found to be
deposited in pond sediments in a small highly concentrated plume (up
to 130 mg/kg) extending from the runoff inlet pipe (Mesuere & Fish,
1989).
Hurley et al. (1996) measured the concentration of copper and
several other metals in 11 tributaries (rivers) feeding Lake Michigan,
USA using low-level techniques. They reported dissolved and total
copper concentrations ranging from 0.2 to 2.0 and 0.4 to 5.5 µg/litre,
respectively.
Shiller & Boyle (1987) measured dissolved concentrations of
copper in the lower Mississippi river, USA seven times. The
Mississippi was chosen because it is the most heavily industrialized
of the 10 largest rivers in the world. The authors concluded that the
levels of copper and several other metals do not appear to be
significantly higher than in several other less industrialized and
disturbed rivers. Dissolved copper concentrations ranged from 1.16 to
1.96 µg/litre. Samples from the Yangtze, Amazon and Orinoco rivers
were analysed for comparison. Dissolved concentrations of 1.24, 1.52
and 1.20 µg/litre were determined, similar to levels in the
Mississippi river.
Ouseph (1992) reported that dissolved and particulate copper
concentrations in the unpolluted zone of the river Periyar, India,
were 0.8-10.0 µg/litre and 48-140 mg/kg, respectively, in 1985-1986.
The Cochin estuary is subjected to various types of effluents from the
Eloor and Chitrapuzha industrial belts. Levels in the estuary ranged
from 2.2 to 22.2 µg/litre for dissolved copper and from 44 to 298
mg/kg for particulate copper. Copper concentrations showed high
seasonal variations, with the lowest levels being detected during the
monsoon season.
Filipek et al. (1987) found that dissolved copper concentrations
reflected the acidity of waters affected by acid mine drainage of West
Squaw Creek, California, USA. At pH > 5, copper concentrations were
generally below the detection limit (< 0.01 mg/litre). Dissolved
copper concentrations ranged from 0.12 to 13.5 µg/litre at pH 3-4, and
at pH 2.4 a concentration of 190 µg/litre was found. Håkansson et al.
(1989) found that the transfer of copper from the aqueous to the solid
particulate phase is significant at pH 3-3.5 and increases with pH.
Copper concentrations in suspended solids were 2.7, 2.0 and 0.5 mg/kg
at pH levels of 4.5, 5.4 and 6.5, respectively, in a drainage stream
for a mine waste deposit. Camusso et al. (1989) monitored seasonal
variations in copper in suspended particulate matter in the north
basin of the acidic (pH 4.4) Lake Orta, Italy, between 1985 and 1987.
Copper in the lake occurred mainly in the dissolved form (94%) and
levels are still high (32-34 µg/litre) because of past industrial
activity.
Sediment is an important sink and reservoir for copper.
Background levels of copper in natural river sediments range from 16
to 5000 mg/kg (dry weight) (Förstner & Wittmann, 1981). Copper levels
in marine sediments range from 2 to 740 mg/kg (dry weight) (Nriagu,
1979b). Bryan & Langston (1992) reported that sediment copper levels
in United Kingdom estuaries range from 10 to > 2000 mg/kg (dry
weight), the highest values being for Restronguet creek which receives
acidic drainage from mining activity. In the creek, adsorption of
most of the dissolved copper by flocculated oxides of iron and
associated humic substances during estuarine mixing leads to very high
sediment concentrations.
Bubb et al. (1991) found that copper loadings for fluvial
sediments from the river Yare, United Kingdom, ranged from 5 to 375
mg/kg. Levels displayed the profile of a pollution plume originating
from a point source. A peak located at 1-2 km from a sewage treatment
works outlet was recorded. Bubb & Lester (1994) found copper
concentrations at 24.2 and 39.0 mg/kg above and below a sewage
treatment works, respectively. Background levels from a control site
were 6.17 mg Cu/kg.
Palanques & Díaz (1994) found that the surface sediments of the
continental shelf off Barcelona, Spain, are greatly influenced by
anthropogenic contamination of heavy metals discharged by the littoral
sewers and the Besos river. Copper concentrations ranged from 300 to
400 mg/kg at the mouth of the Besos river and declined at increasing
distances from the shoreline.
A large gold and copper mining project began in 1984 on the Ok
Tedi river, a tributary of the Fly river, Papua New Guinea. Baker et
al. (1990) analysed suspended sediment samples from the Torres Strait
near the mouth of the Fly river system in 1989. Mean copper
concentrations ranged from 1.4 to 13.3 µg/kg. The highest levels of
copper were found at stations closest to the Fly river. Sediments of
the Ok Tedi river are enriched with copper. Approximately 60% of the
input has a particle size of < 100 µm and is transported as a
suspended load throughout the entire length of the river (> 1000 km).
Copper concentrations in the fraction < 2 µm reaches levels of 6000
mg/kg (Salomons & Eagle, 1990). Mean copper concentrations in the
surficial sediments of the Fly river delta and the Torres Strait were
28 and 8.2 mg/kg, respectively (Baker & Harris, 1991).
Copper contamination of sediment samples in northern Sweden was
correlated with distance from the Ronnskar smelter. Concentrations
ranged from 1556 mg Cu/kg at a distance of 3 km to 37 mg Cu/kg at 80
km (Johnson et al., 1992). Ünlü & Gümgüm (1993) analysed sediment
samples from the Tigris river, Turkey, in the vicinity of the Ergani
copper plant. Copper concentrations were 641 mg/kg 5 km upstream of
the plant, 3433 mg/kg at the outflow and around 900 mg/kg downstream.
5.1.3 Soil
Median total copper concentrations in uncontaminated soil were
reported to be 30 mg/kg (range 2-250 mg/kg) (Bowen, 1985). Shacklette
& Boerngen (1984) analysed soil samples from various locations in the
USA, finding that copper concentrations ranged from < 1 to 700 mg/kg
with an average of 25 mg/kg. Kabata-Pendias & Pendias (1984) reviewed
the worldwide literature on copper in uncontaminated surface soils and
report mean concentrations ranging from 6 to 80 mg Cu/kg (dry weight).
Much higher levels were associated with mining activity,
metal-processing industries and fertilizer and fungicide application.
Copper can accumulate in soils from the long-term application of
fertilizers or fungicides. Reuther & Smith (1952) analysed soils from
mature Florida citrus groves and found that copper oxide levels in the
topsoil increased with grove age. Copper oxide levels of 247 and 93
mg/kg (dry weight) were measured at depths of 0-8 cm and 8-15 cm,
respectively. At depths of > 15 cm copper oxide levels of æ 18 mg/kg
were measured. Copper oxide levels in adjacent untreated soil ranged
from 1 to 2 mg/kg. Christie & Beattie (1989) reported an accumulation
of copper in soil from the application of pig slurry (50-200 m3/ha
per year). EDTA-extractable copper concentrations of up to 85.2 mg/kg
were recorded; levels in control soils ranged from 4.4 to 5.4 mg/kg.
Paoletti et al. (1988) found that in Italy vineyard soil to which
copper-containing fungicide had been applied contained mean copper
concentrations of 89.8 mg/kg (dry weight). Soils from other locations
contained mean levels ranging from 44.0 to 52.1 mg/kg. Holmgren et
al. (1993) analysed surface soil samples from agricultural regions
throughout the USA. Copper concentrations ranged from 0.3 to 495
mg/kg (dry weight). Copper levels were higher in the organic soil
areas of Florida, Oregon and the Great Lakes, reflecting the use of
copper fertilizers and fungicides.
Fjeldstad et al. (1988) found that levels of copper in surface
peat showed a negative correlation with distance from a nickel
smelting factory in Kristiansand, Norway. Dumontet et al. (1990)
monitored copper in acidic peat located along two transects from a
smelter plant in the Noranda region of Quebec, Canada and found that
copper concentrations in surface samples (0-15 cm) ranged from 5525
mg/kg at a distance of 1 km to 28 mg/kg at 42.5 km. The majority of
the deposited copper remained in the upper 15 cm of the soil profile.
Soil samples taken in the vicinity of a copper smelter at Legnica in
southern Poland contained copper levels of 7400 mg/kg (Helios Rybicka
et al., 1994). Wu & Bradshaw (1972) reported that soil copper levels
in the vicinity of a metal refinery (southwest Lancashire, United
Kingdom) established in 1900 contained total copper concentrations
ranging from 1930 to 4830 mg/kg. Hunter et al. (1987a) reported mean
surface soil copper concentrations of 15.1, 543 and 11 000 mg/kg at a
control site, 1 km from a copper refinery (Merseyside, United Kingdom)
and at the refinery, respectively. Beyer et al. (1985) monitored
soils 10 km upwind and 2 km downwind of zinc smelters in eastern
Pennsylvania, USA. Copper concentrations ranged from 12 to 34 mg/kg
and from 9.9 to 440 mg/kg (dry weight) for the two sites,
respectively. Almost all of the copper contamination was held at the
surface of the mineral soil.
5.1.4 Biota
5.1.4.1 Aquatic
The levels of copper in marine algae vary from 0.64 µg/g in
Laminaria religiosa from Japan (Suzuki et al., 1987) to 407 µg/g in
Jania rubens from Antikyra Gulf, Greece (Malea et al., 1994). An
important source of variation in the copper content in algae is the
part of the plant analysed, generally being higher in older parts than
in fast growing, younger apices.
Freshwater mussels (Unio pictorum) in the area of a sailing
boat harbour (Lake Balaton, Hungary) contained significantly higher
levels of copper than those from open water areas. Mean gill and
adductor muscle copper concentrations were, respectively, 203 and 221
mg/kg (dry weight) in the harbour and < 20 mg/kg in open water
(V-Balogh, 1988). Batley et al. (1992) analysed Sydney rock oysters
(Saccostrea commercialis) from the Georges river, New South Wales,
Australia. Mean copper concentrations ranged from 12 to 95 mg/kg (wet
weight) in 1988 and from 19 to 89 mg/kg in 1991, and the authors state
that overall copper concentrations in oysters have fallen since the
banning of tributyltin. Claisse & Alzieu (1993) found an increase in
copper concentrations in oysters collected between 1979 and 1991 in
the bay of Arcachon, France. Annual mean copper concentrations have
increased from 48.3-81.1 mg/kg (dry weight) in 1979 to 74.6-135 mg/kg
in 1991. Data collected from 1977 to 1990 by the California mussel
watch programme were analysed for long-term trends in copper. Copper
showed a steady increase over time at 5 of the 20 sampling stations.
The authors suggest that the increases in copper may be related to
increased vessel traffic and the increased use of copolymer copper
antifouling paints (Stephenson & Leonard, 1994).
Rainbow et al. (1989) monitored the copper concentrations in
several species of talitrid amphipod at several sites in the United
Kingdom. Orchestia gammarellus was found to be the most suitable
biomonitor of copper in British coastal waters. Weeks (1992a) found
the talitrid amphipod Platorchetsia platensis to be a good indicator
species in Danish waters. Samples with significantly higher copper
burdens, for example, 110 mg Cu/kg (dry weight) compared to 32 mg
Cu/kg, were associated with local sources of metal enrichment, due to
anthropogenic inputs (antifouling paint leachates) or geological
conditions. Negligible quantities of copper were found in cast exuvia
of talitrid amphipods during the moult cycle (Weeks et al., 1992b).
Moore et al. (1991) found the beach-hopper (Orchestia gammarellus)
to be a very convenient and sensitive biomonitoring species for copper
levels along the North Sea coasts. Typical background concentrations
were approximately 70 mg Cu/kg (dry weight); samples with higher
concentrations (up to 218 mg Cu/kg) were associated with local sources
of contamination such as antifouling paints or the metal-rich
mineralogy.
Alikhan et al. (1990) measured the concentration of copper in
crayfish (Cambarus bartoni) trapped from increasing distances, up to
150 km from a nickel-copper smelter (Canada). Their results indicate
that the concentrations in the crayfish decreased with increasing
distance from the source; the highest concentration (1986 µg Cu/g) was
measured in the hepatopancreas.
Schmitt & Brumbaugh (1990) analysed freshwater fish from
throughout the USA in 1984-1985. A mean copper concentration of 0.65
mg/kg (wet weight) and a maximum copper level of 23.1 mg/kg were
recorded. No significant change in the mean concentration of copper
was found when compared with monitoring results from 1976.
Lee & Stuebing (1990) analysed liver tissue from river toads
(Bufo juxtasper) near a copper mine in east Malaysia. Mean copper
concentrations in toads downstream of the mine and from a control area
were 438 mg/kg (dry weight) and 46 mg/kg, respectively. Copper levels
of 117 and 273 mg/kg were recorded in toads collected from areas known
to be rich in minerals.
5.1.4.2 Terrestrial
Stewart et al. (1991) sampled tree ring wood from kahikatea trees
in urban Christchurch and the west coast of South Island, New Zealand.
For the urban ring wood cores copper levels showed an elevation over
baseline levels with an approximately threefold increase beginning
around 1940. This was probably due to increased industrial emissions.
Kalac et al. (1996) measured the concentrations of copper in
edible mushrooms in the vicinity of mercury and copper smelters in
eastern Slovakia. Copper concentrations up to 236 mg/kg and 231 mg/kg
(dry weight) were measured in Lepiota procera and Lepisia nuda,
respectively.
The metalliferous hillocks of the Shaba Province in southwest
Zaire have soil copper concentrations of up to 30 g/kg (Malaisse et
al., 1979). The region supports an extremely unusual endemic flora,
composed mainly of herbs and grasses, that can tolerate concentrations
of copper in excess of 1% in the soil. Terrestrial higher plants
which accumulate copper concentrations in excess of 1000 mg/kg (0.1%)
(dry matter) are known as "hyperaccumulators" (Brooks et al., 1977).
Brooks et al. (1980) reported hyperaccumulation of copper in 24 taxa
from the Shaban region. The most unusual of these is
Aeollanthus biformifolium which can contain as much as 13.7 g/kg
(1.37%) (dry weight) in the whole plant (Malaisse et al., 1978).
The first workers to present data indicating hyperaccumulation of
copper were Duvigneau & Denaeyer-De Smet (1963) who reported values of
1200, 1660 and 1960 mg Cu/kg (dry weight) for
Ascolepis metallorum, Silene cobalticola and
Haumaniastrum robertii, respectively.
The labiate (mint family) Becium homblei occurs on copper
deposits in Zaire, Zimbabwe and Zambia. Reilly (1967) and Reilly &
Reilly (1973) described B. homblei as a cuprophile, tolerant
to > 70 g Cu/kg (dry weight) in soil, and accumulating up to 17% of
copper in the leaves, organically bound to the cell walls. They also
noted that some other species of Becium in the same area had no
special ability to accumulate copper.
Hunter et al. (1987a) reported annual mean copper concentrations
in the dominant plant species growing near a metal refinery in the
United Kingdom (Agrostis stolonifera, Festuca rubra,
Equisetum arvense and Tussilago farfara). Mean copper
concentrations ranged from 7.6 to 18.6, 22.8 to 25.8 and 73.3 to 260
mg/kg (dry weight) at a control site, 1 km from a metal refinery and
at the refinery respectively. Vegetation levels of copper showed
marked seasonal variations at contaminated sites with peak values
during the winter months. The increased levels were due to a
combination of root absorption and accumulation of particles on
external leaf surfaces. Copper concentrations in grasshoppers
(Chorthippus brunneus) ranged from 37.5 mg/kg (dry weight) at a
control site to 380 mg/kg at the refinery (Hunter et al., 1987c).
Hunter et al. (1987b) analysed invertebrates from both contaminated
and semi-contaminated grasslands in the vicinity of a major copper
refinery. All species showed significant elevations of total body
copper concentrations relative to controls. Highest concentrations
were found in isopoda species. Detritivorous soil macrofauna showed
accumulation of copper (2-4 times) with respect to concentrations in
refinery site organic surface soil and plant litter. Herbivorous
invertebrates also showed body : diet concentration factors of 2-4
times for copper.
Ferns growing in the vicinity of ore smelters at Sudbury,
Ontario, Canada, contained copper concentrations ranging from 27.2 to
73.0 µg/g (dry weight). Plants collected from control sites contained
concentrations ranging from 7.4 to 11.5 mg Cu/kg (Burns & Parker,
1988). Analysis of lowbush blueberry (Vaccinium angustifolium) at
sampling sites ranging from 6.5 to 74 km from Sudbury smelting
operations revealed a significant relationship between copper
concentrations and distance from the smelter (Bagatto et al., 1993).
Alikhan (1993) analysed terrestrial isopods (Porcellio spinicornis)
2 km downwind of a primary smelting works (nickel) in Ontario, Canada.
Mean copper concentrations in the isopods were 1137 mg/kg (dry weight)
for the contaminated site and 685 mg/kg for a control site. Leaf
litter contained approximately 12 times more copper at the
contaminated site than at the control site.
Morgan & Morgan (1988) analysed earthworms (Lumbricus rubellus
and Dendrodrilus rubidus) from both contaminated (the vicinity of
disused nonferrous metalliferous mines) and noncontaminated sites in
Wales. There were significant positive correlations between total
copper concentrations in the earthworms and in the soil. Copper
concentrations in earthworms ranged from 8 and 9 mg/kg (dry weight) at
uncontaminated sites to 104 and 34 mg/kg at contaminated sites for the
two species.
Ash & Lee (1980) analysed earthworms from roadside verges in the
United Kingdom and found a relationship between traffic density and
copper burden. Mean copper concentrations ranged from 3.9 to 8.9
mg/kg (dry weight) for heavy traffic, 2.3 to 6.6 mg/kg for
intermediate traffic and 0.2 to 0.83 mg/kg for low levels of traffic.
However, for the more contaminated sites other industrial sources of
copper could not be ruled out.
Wieser et al. (1976) found two species of isopods
(Tracheoniscus rathkei and Oniscus asellus) to be good indicator
species for copper. Total copper concentrations in isopods ranged
from 74 mg/kg (dry weight) for a spruce forest to 538 mg/kg for an
overgrown slag heap of an old copper mine in the Tirol region of
Austria. Hopkin et al. (1993) proposed the isopod Porcellio scaber
as an ideal candidate for biomonitoring the bioavailability of metals
to soil and leaf litter invertebrates. The authors provide a table of
concentration ranges for this species related to degrees of
contamination. For example, isopod copper concentrations of < 250
mg/kg (dry weight) would be classified as uncontaminated with medium
contamination at 400-600 mg/kg and high contamination at 600-1000
mg/kg. Hopkin et al. (1986) analysed hepatopancreas and whole body of
woodlice (Porcellio scaber) collected from 89 sites in southwest
England. The main source of copper pollution was centred on
Avonmouth, the site of a primary zinc, lead and cadmium smelting
works. The correlation coefficients between the concentrations of
copper in woodlice and soil, and between woodlice and leaf litter,
were positive and statistically significant.
Rose & Parker (1983) reported concentrations of copper in tissues
of ruffed grouse from a site near a copper-nickel smelter and a
control, uncontaminated site near Sudbury, Ontario, Canada. Mean
copper concentrations in kidney, liver and breast muscle ranged from
11.7 to 24.6, 12.6 to 16.3 and 1.5 to 2.3 mg/kg (dry weight),
respectively. Their results indicate no difference between the two
sites.
Hunter & Johnson (1982) analysed small mammals in the vicinity of
a copper refinery in the United Kingdom. Liver concentrations were
significantly elevated at the refinery in wood mouse
(Apodemus sylvaticus) (23.7 mg Cu/kg dry weight) and common shrew
(Sorex araneus) (56.1 mg Cu/kg) but not in short-tailed vole
(Microtus agrestis) (13.5 mg Cu/kg). However, even these
significant accumulations were rather limited bearing in mind the soil
copper levels of 2000-3000 mg/kg (dry weight) at the refinery site.
At reference sites copper concentrations in whole-body samples of
small mammals ranged from 8 to 13 mg/kg (dry weight) (Smith &
Rongstad, 1982; Beyer et al., 1985).
5.2 General population exposure
5.2.1 Air
Pulmonary exposure occurs through the inhalation of dusts, fumes,
smoke and sprays that contain copper.
Exposure to copper by inhalation is determined by air
concentrations, particulate size and the respiratory rate.
Concentrations of copper determined in over 3800 samples of ambient
air at up to 29 sites in Canada over the period 1984-1993 averaged
0.014 µg/m3. The maximum value was 0.418 µg Cu/m3, detected in 66%
of samples (Dann, 1994). In the USA, air levels of copper vary
between 96 and 138 ng/m3 in urban samples and 76 and 176 ng/m3 in
non-urban settings (see section 5.1.1), though levels as high as 4629
ng/m3 have also been recorded.
Based on data collected in the province of Ontario, Canada,
copper levels in ambient air have decreased over 70% in the last 10
years, though some of this decrease is likely attributable to
variations in sampling and analytical methods (OMME, 1992).
Estimated mean intake, based on these data (22 m3 air/day)
(ICRP, 1974) and the mean Canadian values, are less than 0.28 µg/day.
5.2.2 Food and beverages
The actual concentration of copper in food and beverages from
various countries varies widely depending upon the food product, the
growing conditions (soil, use of fertilizers high in copper, water,
use of copper fungicides) and the type of processing used; in
particular, pH levels and the use of copper vessels (Tanner et al.,
1979; Muller et al., 1996).
In some countries, it has been customary to prepare milk by
boiling it in copper vessels. Levels of copper in such milk have been
reported as up to about 60 mg/litre (Muller et al., 1996). Studies
have shown that copper binds predominantly to casein, which is the
main constituent of milk protein. In acidic pH (as in gastric juice)
casein liberates most of this bound copper as a copper ion, making it
available for rapid absorption (O'Neill & Tanner, 1989). Calculations
reveal that whereas total breast feeding would supply up to 0.9 µmol
Cu/kg per day (60 µg/kg per day), feeding similar amounts of brassy
milk would supply up to 14.6 µmol Cu/kg per day (930 µg/kg per day) or
10-20 times the physiological intake per kg body weight per day.
Traditional "tinning" of copper and brass vessels protects from such
contamination by copper, yet it is a procedure often neglected because
of cost and effort.
Copper is widely distributed in foods, with organ meats (e.g.
liver) and seafood having the highest concentrations (10-100 mg/kg)
and dairy products having relatively low levels (Table 5). High
levels of copper have also been identified in wheat bran, beans and
seeds, based on a recent, detailed investigation (Jorhem & Sundstrom,
1993). Baseline values have been reported as 0.2-0.3 µg Cu/litre for
mother's milk and 0.7-1.1 µg Cu/kg for infant formula (Richmond et
al., 1993). Chocolate may contain more than 5 mg Cu/kg. Values
quoted for tea and coffee are highly variable but may exceed 10 mg
Cu/kg (dry weight) (Slooff et al., 1989; ATSDR, 1990). In general
most other foods contain much less than 10 mg Cu/kg.
Copper levels in common foodstuffs and beverages have been
determined in many countries, including the USA (Pennington et al.,
1986), Australia (NFA, 1992) and the Netherlands (Slooff et al.,
1989). Copper levels in representative foodstuffs in these three
countries are given in Table 5. From these market basket surveys,
average daily intakes have been calculated (Pennington et al., 1986,
1989; Slooff et al., 1989; NFA, 1992), or actual dietary surveys have
been conducted to determine the daily intake from food and beverages
(Pettersson & Sandström, 1995).
Representative mean total daily intakes of copper from foods and
beverages in several countries are given in Table 6. As shown, the
total daily intake of copper in adults varies between 0.9 and 2.2 mg.
Intake in children has been estimated to be 0.6-0.8 mg/day (0.07-0.1
mg/kg body weight per day).
In relation to the intake of copper in food, the WHO (1996) noted
the insufficiency of global data and concluded that:
"The scarcity of adequately planned studies is again evident,
with insufficient data from Africa, the Eastern Mediterranean and
South-East Asia. The apparently higher proportion of European
studies suggesting undesirably low population mean intakes of
copper needs to be investigated more closely to determine whether
it is a truly characteristic feature of diets of the eastern
German communities from which these particular samples were
drawn. Before it is concluded that intakes of copper are likely
to be reasonably adequate in the Americas, the western Pacific
fringe and the remainder of Europe, it must be strongly
emphasized that none of the surveys covered were representative
of those socially and nutritionally disadvantaged communities in
which food preferences lead to the consumption of diets providing
as little copper as those reported to induce clinical signs of
deficiency elsewhere" (WHO, 1996).
A summary of preliminary data from a global literature survey of
dietary intakes by IAEA has been published (WHO, 1996). When all the
IAEA data are considered, approximately 10% of reported mean intakes
are below the proposed minimum basal mean value for copper in adult
males (1.2 mg/day) and approximately 25% are below the corresponding
minimum normative mean population intake (1.4 mg/day). Intakes five
times higher than the basal minimum mean are observed in some
population groups, but these are still well below the upper limit of
the safe range of mean population intake (12 mg Cu/day for men) and
there is no evidence from the IAEA database that the copper intake
from diets for young children is sufficiently high to cause concern in
the communities studied.
5.2.3 Drinking-water
5.2.3.1 Organoleptic characteristics
The taste of copper in drinking-water has been described as
metallic, bitter and persistent. Taste thresholds have been reported
between 0.8 and 5 mg Cu/litre, depending on the purity of the water
(Cohen et al., 1960; Béguin-Bruhin et al., 1983). Concentrations of
copper greater than 5 mg/litre may render water unpalatable although
individuals can adapt to such levels (Scheinberg & Sternlieb, 1994).
Aesthetic considerations relating to copper levels in drinking-water
include blue or green staining of plumbing fixtures, hair and laundry.
5.2.3.2 Copper concentrations in drinking-water
Levels of copper in surface waters used for the production of
drinking-water are presented in section 5.1.2. Copper is also
introduced into drinking-water during distribution, owing to leaching
from plumbing fixtures and copper piping. Leaching is dependent upon
a number of factors, including pH, temperature, hardness, carbon
dioxide content of the water, the length of time in contact with the
pipe or fixture and the age of the piping (Schock & Neff, 1988; Alam &
Sadiq, 1989). Some of these factors cannot easily be controlled; in
particular, hard waters with high buffering capacity cannot have the
pH raised sufficiently to moderate copper solvency (Dieter et al.,
1991). It is thus insufficient to ascribe all problems of copper
solvency to soft, acidic waters with low buffering capacity and
nonadjusted pH.
In distributed water from 70 municipalities across Canada, median
concentrations of copper ranged from < 0.02 mg/litre to 0.75
mg/litre. In about 20% of the distributed water supplies, the level of
copper was significantly higher than the corresponding treated water
samples. Furthermore, the increase was higher in those areas where the
water was soft and corrosive (Meranger et al., 1979).
Table 5. Levels of copper in foodstuffs (mg/kg wet weight)a
Food stuff Mean Minimum Maximum n
Meat
beef 0.8, 1.1 0.74 1.6 39
pork 0.9, 1.4 0.44 7.22 150
lamb 1.6 1.1 1.9 24
Liver
beef 39 8.8 87 7
pork 9.0 0.9 29 126
lamb 97 28 195 32
Kidney
beef 3.7 2.8 4.2 6
pork 6.1 2.9 15 75
Fruit
apples 0.25 0.21 0.31 6
pears 0.81 0.48 2.7 24
bananas 0.95, 0.96 0.70 1.2 12
Vegetables
potatoes 0.72, 0.96 0.26 2.2 40
carrots 0.40, 0.61 0.26 0.95 30
lettuce 0.47, 0.72 0.20 1.4 40
tomatoes 0.36, 0.55 0.29 1.1 26
Fish
cod 0.19 0.12 0.28 5
tuna 0.64 0.48 0.80 9
Wheat
flour 1.5 0.95 2.9 56
bread (white) 1.5 0.89 2.2 32
Milk
cow 0.06 trace 0.14 31
human 0.54 0.22 0.90 28
Cocoa powder 36.4 33.0 410 9
a Adapted from Jorhem & Sundstrom (1993) for Sweden
and NFA (1993) for Australia
Table 6. Estimated average dietary intake of copper in various countries
Country Method of Intake of copper Reference
samplinga (mg/day)
Australia MB (adult male) 1.9 NFA (1992)
MB (adult female) 2.2
MB (2 years) 0.8
Denmark DD 1.2 Bro et al.
(1990)
Finland TDb 2.00 Kumpulainen
et al. (1987)
Germany DD 0.95 Anke (1991)
The Netherlandsc MB 1.5 Slooff et al.
(1989)
Norway DD 1.0 Pettersson &
Sandström
(1995)
Sweden MB 1.20 Becker &
Kumpulainen
(1991)
United Kingdom TD (adult male) 1.63 Gregory et al.
TD (adult female) 1.23 (1990)
TD (1.5-4.5 years) 0.5 Gregory et al.
(1995)
USAc MB (6-11 months) 0.47 Pennington
MB (2 years) 0.58 et al. (1986)
MB (adult male) 1.24
MB (adult female) 0.94
a MB = market basket survey; TD = total diet study;
DD = duplicate diet study
b Total diet from food record
c In calculations of dietary intake of copper the USA
and the Netherlands consider water as part of the diet
In the USA, 85% of fully flushed tap water samples had copper
levels below 0.06 mg/litre and 98% were below 0.46 mg/litre. Less than
1% exceeded 1 mg Cu/litre and the maximum level measured was 2.37 mg
Cu/litre (US EPA, 1991).
The difference between samples of running water and those where
water was standing for some time is evident from studies in several
countries. Murphy (1993) measured copper levels in drinking-water
fountains in 50 schools in New Jersey, USA. Median levels in
first-draw water (0.26 mg Cu/litre) decreased significantly after 10
min of flushing (0.068 mg Cu/litre), but increased by lunchtime to
0.12 mg Cu/litre after normal use of fountains. In Canada, copper
levels in running water from private wells were extremely low, but 53%
of the samples from standing water exceeded 1 mg Cu/litre (Maessen et
al., 1985). In a study in one US city (Seattle), mean copper levels
in running and standing water were reported as 0.16 and 0.45 mg/litre,
respectively, with 24% of standing water samples exceeding 1.0
mg/litre (Dangel, 1975). In the Netherlands, values between 0.2 and
3.8 mg Cu/litre were reported in water standing 16 h. This compares
to the level of 3.0 mg/litre in water standing 16 h, which is the
maximum permissible level for copper in drinking-water in the
Netherlands (Slooff et al., 1989). These same authors report average
copper levels between 0.04 and 0.69 mg/litre in other municipalities.
Pettersson & Sandström (1995) reported that in a study of 400
children aged 9-21 months the daily intake of copper from
drinking-water ranged between 0.01 and 3.2 mg, with a mean of 0.3 mg.
The study was conducted in two cities where it was suspected that
levels of copper in drinking-water were high. In these cities, the
mean copper levels in standing water were 0.7 mg/litre with a 90th
percentile of 2.1; in water for consumption, the mean was 0.6 mg/litre
with a 90th percentile of 1.6 mg/litre.
From the data available, and assuming a daily intake of
drinking-water of 1.4 litres (IPCS, 1994), daily intakes of copper
from drinking-water by adults will vary between less than 0.01 mg to
over a few mg per day, with highest intake in areas with corrosive
water using copper piping.
5.2.4 Miscellaneous exposures
In addition to airborne copper and copper in foods and beverages,
the general population may be exposed to this metal from a variety of
other sources. It is extremely difficult to quantify such exposures
and in most cases they make only a minor contribution to the daily
intake of copper by the general population when compared to the major
source of copper which is food and drinking-water (1-3 mg Cu/day).
Intake of dietary supplements containing copper will also contribute
to total exposure.
In a study of the metal content of tobacco, the copper content in
cigarette tobacco was found to vary between 9 and 66 µg Cu/g with a
mean value of 15.6 µg Cu/g (Mussalo-Rauhamaa et al., 1986).
Approximately 0.2% of this copper was detected in mainstream smoke
(about 0.05 µg Cu/cigarette). This would result in a daily exposure
of about 1 µg Cu from 20 cigarettes (Mussalo-Rauhamaa et al., 1986).
Dermal exposure to copper can result from the use of consumer
products containing copper pigments, through the use of copper as an
algicide in swimming pools and the use of copper jewellery. No
quantitative exposure levels could be found.
Excluding the use of copper IUDs, the use of copper in medical
applications has been replaced with other treatment regimens.
However, in rare cases, notably the treatment of burns with copper
sulfate, increased copper absorption has occurred with resulting
toxicities observed (Eldad et al., 1995). The use of copper IUDs may
result in exposure to as much as 80 µg Cu per day (Kjaer et al., 1993)
with decreasing levels after the first few weeks after insertion.
Copper is a component of many amalgams used in dentistry,
including mercury amalgams. The loss of copper from these sources has
been reported as minimal (Johansson & Moberg, 1991; Lussi et al.,
1992).
5.3 Occupational exposures
There is a wide range of industrial activities in which workers
can be exposed to copper and copper compounds. Copper exposures in
occupational settings are to particulates to which the metal or metal
compound is adsorbed or to metal fumes (aerosols).
In the mining industry, workers (miners and millers) are exposed
to dusts both from rocks and from the ore itself, containing 0.05-5%
of copper (Weant, 1985). Multiple exposures occur, as the ore may
contain high levels of nickel, arsenic and silica (McLaughlin et al.,
1992). Exposure to copper fumes and to a lesser extent dusts is a
feature of smelting operations but can occur through brassing,
welding, cutting or polishing of copper and brass and in joinery shops
where preserved woods are used. Other occupations in which exposures
to copper and compounds occur are agriculture (fungicides), wood
working, textiles, munitions and pyrotechnics, electrical, paint,
paper and tyre manufacturing (Fisher, 1992).
Very little published data could be found on copper
concentrations in air within occupational settings. Although dust and
fume levels may be measured regularly, they are normally reported in
terms of concentrations of other elements of greater toxicological
significance (e.g. arsenic, lead, acid mist). The bias towards
reporting these contaminants explains the difficulty of relating any
health effects noted in these environments to copper. Most countries
have set exposure standards for copper containing dust in the range
0.5-1 mg Cu/m3 and for copper fumes between 0.1 and 0.2 mg Cu/m3
(ILO, 1991).
Some sense of the relationship between air copper and serum
copper levels can be obtained from a study of copper milling and
sanding operations in which exposures were reported as 0.01 and 0.68
mg Cu/m3, respectively: plasma copper levels in these workers ranged
from 660 to 1260 µg Cu/litre, all below the upper level reported for
adults of 1300 µg Cu/litre (NIOSH, 1981a). In another study (NIOSH,
1981b), personal sampling of smelter workers in the blast and
converter furnaces and in the sampling area had a mean copper fume
concentration of 0.39 Cu/m3 with a range from 0.12 to 0.99 mg Cu/m3,
while personal samples for workers exposed to copper dust during the
cleaning of waste heat boilers and mertz furnace tear-down had average
exposures ranging from 1.2 to 17.6 mg Cu/m3. Serum copper values in
these workers were unrelated to occupational exposure levels.
Particle size distribution for the dust exposures were not given,
which may partly explain the lack of a relationship. Exposures during
welding of brassware ranged from 0.027 to 0.89 µg Cu/m3 with a mean
of 0.36 µg Cu/m3 (Rastogi et al., 1992).
5.4 Total human intake of copper from all environmental pathways
For healthy, non-occupationally-exposed humans the major route of
exposure to copper is oral. As shown in Table 6, the total daily
intake of copper in adults ranges between 0.9 and 2.2 mg. A majority
of studies have found intakes to be at the lower end of that range.
The variation reflects different dietary habits as well as different
agricultural and food processing practices used worldwide. In some
cases, drinking-water may make a substantial additional contribution
to the total daily intake of copper, particularly in households where
corrosive waters have stood in copper pipes. In areas without copper
piping copper intake from drinking-water will seldom exceed 0.1
mg/day, although intakes greater than a few mg per day can result from
corrosive water distributed through copper pipes. In general, total
daily oral intakes of copper will be between 1 and 2 mg/day, although
they may occasionally exceed 5 mg/day.
All other intakes of copper (inhalation and dermal) are
insignificant in comparison to the oral route. Inhalation adds
0.3-2.0 µg/day from dusts and smoke. Even women using copper IUDs
will be exposed to only 80 µg or less of copper per day in addition to
their oral intake of between 1 and 3 mg.
6. KINETICS AND METABOLISM IN LABORATORY ANIMALS AND HUMANS
Copper is an essential trace element involved in a variety of
critical metabolic processes. However, as with other essential trace
elements such as iron and zinc, excessive exposure may be toxic. All
mammals have metabolic mechanisms that maintain homoeostasis (a
balance between metabolic requirements and prevention against toxic
accumulation). Special populations with genetic defects or
abnormalities in the metabolism of copper may be sensitive to levels
of exposure that are nontoxic to persons without these defects. This
chapter provides an overview of the metabolic mechanisms that provide
copper homoeostasis in mammalian systems.
An organism, or cells within an organism, will seek to maintain
copper levels within a range that avoids both deficiency and excess.
The mechanisms for absorption and storage of copper are relatively
little studied but include biological chelators, specific receptors,
sequestering peptides and proteins and uptake pumps. Likewise, the
defence mechanisms to prevent or limit copper toxicity include
extracellular chelators, sequestering peptides and proteins, export
pumps and disposal of the metal into vesicles. Many of the peptides
and proteins that are involved in these events have been characterized
and their metabolic roles investigated. The regulation of copper
metabolism is not fully understood, although a great deal is being
learned from simple model systems.
Critical to the metabolism of copper is the chemical behaviour of
the element and its complexes because this behaviour controls its
interaction with other elements in processes such as absorption,
transport, distribution and toxicity. The general metabolism of
copper is described in the following sections. The bulk of the
studies related here are derived from animal and other model systems.
Where appropriate, sections will highlight human studies.
6.1 Essentiality
The essentiality of copper was not recognized until 1928 when
Hart et al. (1928) showed copper to be essential for erythropoiesis in
rats fed a milk-based diet. He was able to correct the anaemia by the
addition to the diet of ash from animal or vegetable sources. He went
on to demonstrate that the hydrogen sulfide precipitate from the ash,
containing copper sulfide, was responsible for the recovery. Similar
findings in humans established the basis for essentiality (Mills,
1930; Josephs, 1931).
Copper is also essential for the utilization of iron in the
formation of haemoglobin (Friberg et al., 1979) and in the maturation
of neutrophils (Percival, 1995).
The essentiality of copper arises from its specific incorporation
into a large number of enzymatic and structural proteins. The role of
copper in oxidation/reduction enzyme activities is a consequence of
its ability to function as an electron transfer intermediate. Thus
copper is present in enzymes involved in cellular respiration, free
radical defence, neurotransmitter function, connective tissue
biosynthesis and cellular iron metabolism. In some of them, copper is
required as a cofactor, e.g. superoxidase dismutase 1 (SOD1),
cytochrome oxidase and ceruloplasmin. Moreover, the oxidase
activities of ceruloplasmin and SOD1 have been shown to specifically
require copper. In other cases, copper appears to be involved as an
allosteric component of enzymes, conferring an appropriate structure
for their catalytic activity. No other element can substitute into
these proteins to provide the redox properties that copper provides.
These enzymes serve critical functions in their respective organisms
(Hartmann & Evenson, 1992; Linder & Hazegh-Azam, 1996). An
illustrative selected list of the enzymes that rely on the redox
properties of copper for catalysis is shown in Table 7.
Copper plays an important role in the activation and repression
of gene transcription. Studies of copper-regulated transcription in
yeast have advanced the identification of the mechanisms of action of
copper-regulated transcription factors in eukaryotes. ACE1 (Dameron
et al., 1991) and AMT (Zhou & Theil, 1991) are homologous copper-DNA
binding proteins that regulate the synthesis of the metallothionein
message through specific fungal promoter elements in, respectively,
Saccharomyces cerevisiae and C. glabrata. The S. cerevisiae SOD
is also regulated by ACE1 (Gralla et al., 1991; Carry et al., 1991).
Metal responsive elements (MREs), 13-15 base pair repeats, have been
found in the metallothionein promoters of all higher eukaryotes, but
the metal-regulated transcription factors have not been characterized.
Mac1 has been found to regulate the transcription of FRE1 (encoding a
plama membrane protein associated with both Cu(II) and Fe(III)
reduction) and CTT1 (encoding the cytosolic catalase) (Jungmann et
al., 1993).
Despite the obvious differences in physical form, at a
metabolic/biochemical level animals have very similar molecular
requirements for copper. The deficiencies, therefore, are very
similar to those described for copper deficiencies in humans. The
copper-dependent enzyme lysyl oxidase, for instance, has been
associated with connective tissue disorders involving cardiovascular
lesions, bone formation and eggshell development. Cardiovascular
lesions associated with copper deficiencies have been found in mice
(Rowe et al., 1977), rats (Petering et al., 1986), rabbits (Hunt &
Carlton, 1965; Hunt et al., 1970), pigs (Ganezer et al., 1976;
Schoenemann et al., 1990), and cattle (Mills et al., 1976). In
chickens and mice the lesions have been linked to decreases in lysyl
oxidase (Rowe et al., 1977). Similarly rats (Alfaro & Heaton, 1973),
cattle (Mills et al., 1976) and chicks (Rucker et al., 1969) manifest
bone formation defects in copper deficiencies. Copper-deficient hens
lay eggs with weak or no shells as a result of the failure of lysyl
oxidase in the oviduct (Harris et al., 1980). Animals also show
evidence of hair discolouration and brittleness and flaccid skin, as
seen in humans (Blakley & Hamilton, 1985).
Table 7. Copper metalloenzymes and proteinsa
Enzyme Function
Amino acid oxidase amino acid metabolism
Ascorbate oxidase terminal oxidase in plants
Azurin electron transfer
Benzylamine oxidase oxidation of amines
Ceramide galactosyl transferase myelin synthesis
Ceruloplasmin copper transport, oxidation
Cytochrome c oxidase terminal oxidase in animals
Diamine oxidase amine metabolism
Dopamine-ß-hydroxylase norepinephrine (noradrenalin) synthesis
Galactose oxidase carbohydrate metabolism
Haemerythrin oxygen transport
Haemocyanin oxygen transport
Indole 2,3-dioxygenase amine metabolism
Laccase terminal oxidase, plants
Lysyl oxidase collagen, elastin cross-linking
Plastocyanin electron transfer in plants
Polyphenyl oxidase quinone biosynthesis
Prostaglandin reductase prostaglandin biosynthesis
Rusticyanin electron transfer in fungi
Stellacyanin electron transfer in fungi
Superoxide dismutase superoxide radical destruction, dismutation
Tyrosinase amino acid metabolism, pigment formation
Uricase nucleic acid metabolism
Spermine oxidase amine metabolism
Tryptophan 2,3-dioxygenase amino acid metabolism
Monoamine oxidasea neurotransmitter synthesis
a Linder & Hazegh-Azam (1996)
6.2 Homoeostasis
6.2.1 Cellular basis of homoeostasis
An interpretation of the intracellular homoeostasis of copper in
an human hepatocyte (the pathway and regulation of the importation,
utilization, detoxification and export of copper) is illustrated in
Fig. 1. Copper itself has a major role in the regulation of the
mechanisms that control its cellular homoeostasis.
Copper as Cu(II) entering into hepatocytes is initially reduced
and complexed by glutathione, prior to binding and induction of
metallothionein (Freedman, 1989). Alternatively, copper entering the
cell may be exported by a copper ATPase translocase.
Metallothionein, the main intracellular copper-binding protein,
is a protein with 62 amino acids and two domains, rich in cysteine
(30%), which can bind up to 12 Cu(I) atoms. The metallothioneins are
involved in the detoxification and possibly storage of excess copper
(Bremner, 1987). All metallothioneins are transcriptionally regulated
by metals, except two newly isolated metallothioneins that may have
specialized functions (Hammer, 1986; Palmiter, 1993; Palmiter et al.,
1993). A wide variety of metals have been shown to induce the
synthesis of metallothioneins. The mammalian transcription factor is
a complex of proteins activated by a wide range of metals (Palmiter,
1993). When copper binds to the transcription factor complex, its
affinity for metal regulatory elements in the promoter of the
metallothionein gene is enhanced. The resulting increased level of
metallothionein sequesters the excess copper, preventing toxicity.
Copper ions are exported from liver cells by a P-type copper ATP
translocase (Cox, 1995). The copper translocases in liver are located
in the Golgi, endoplasmic reticulum and plasma membrane and are
responsible for copper transport. A mutation of this gene is
responsible for Wilson disease. Copper is poorly incorporated into
ceruloplasmin when the translocase is defective (Cox, 1995). Metal
ions are also sequestered into lysosomes, especially in conditions of
copper overload (Mohan et al., 1995).
6.2.2 Absorption in animals and humans
Foods rather than water contribute virtually all of the copper
consumed, and the copper content of different foods varies
considerably. Absorption of copper occurs primarily through the
gastrointestinal tract although small amounts can be incorporated
through inhalation and skin contact. The intestinal absorption
process is affected by numerous physiological and dietary factors as
described in section 6.4.
Radioisotope studies in experimental animals suggest that copper
is absorbed from the stomach to some extent, but that the major site
of absorption is the duodenum (Van Campen & Mitchell, 1965). The pH
of the stomach is such that many weak copper complexes will
dissociate. Enzymatic degradation of proteins and dietary fibres
should also make the metal more available. It also appears likely
that low molecular weight substances (e.g. amino acids) in
WHO TASK GROUP ON ENVIRONMENTAL HEALTH CRITERIA FOR COPPER
Members
Professor D. Culver, retired from Department of Medicine, University
of Califomia, Califorma, USA
Professor H. Dieter, Institute for Water, Soil and Air Hygiene,
Federal Enviromnent Agency, Berlin, Germany
Dr R. Erickson, US Environniental Protection Agency, Duluth,
Minnesota, USA
Dr G.S. Fell, Department of Pathological Biochemistry, University
of Glasgow, Glasgow Royal Infirmary, Glasgow, Scotland
Dr J. Fitzgerald, Environmental Health Branch, Public and
Envircumental Health Service, South Australian Health Commission,
Rundle Mall, Adelaide, South Australia, Australia
Dr T.M. Florence, Centre for Environmental Health Sciences, Oyster
Bay, New South Wales, Australia
Professor J.L. Gollan, Brigham and Women's Hospital, Harvard Medical
School, Gastroenterology Division, Boston, Massachusetts, USA
Dr R.A. Goyer, University of Western Ontario, Chapel Hill, North
Carolina, USA ( Chairman)
Professor T.C. Hutchinson, Trent University, Environmental and
Resource Studies Program, Peterborough, Ontario, Canada
Ms M.E. Meek, Health Protection Branch, Environmental Health
Directorate, Health Canada, Ottawa, Ontario, Canada
Professor MR. Moore, National Research Centre for Environmental
Toxicology, The University of Queensland, Coopers Plains,
Queensland, Australia ( Co-Vice-Chairman)
Professer A. Oskarsson, Department of Food Hygiene, Faculty of
Veterinary Medicine, Swedish University of Agricultural Sciences,
Uppsala, Sweden
Dr S. Sethi, Department of Pathology, Lady Hardinge Medical College
and S.M.T. Sucheta Kripalani Hospital, New Delhi, India
Dr K.H. Summer, National Research Centre for Environment and
Health, Institute of Toxicology, Neuherberg, Germany
Dr J.H.M. Terninink, Department of Toxicology, Wageningen Agricultural
University, Wageningen, The Netherlands ( Co-Vice-Chairman)
Dr R. Uauy, University of Chile, Santiago, Chile
Dr J.M. Weeks, Institute of Terrestrial Ecology, Monks Wood,
Abbots Ripton, Huntingdon, Cambridgeshire, United Kingdom
Observers
Dr W.J. Adams, Kennecott Utah Copper, Magna, Utah, USA (Representing
ICA)
Dr K. Bentley, Department of Health and Family Services, Environmental
Health Policy, Canberra, Australia
Dr K.J. Buckett, Environmental Health Service, Health Department
of Western Australia, Perth, Western Australia, Australia
Professor J.C. Castilla, Ecology Department, Faculty of Biological
Sciences, Pontificia Universidad Catolica de Chile, Santiago, Chile
(Representing the Chilean Govemment)
Dr C. Fortin, Commercial Chemicals Evaluation Branch, Environment
Canada, Ottawa, Ontario, Canada
Dr R. Gaunt, RTZ Ltd, London, United Kingdom (Representing the
European Centre for Ecotoxicology and Toxicology of Chemicals)
Mr M. Thierry Gerschel, Trefîmetaux, Courbevoie, France (Eurometaux)
Dr P. Imray, Environmental Health Branch, Queensland Health,
Brisbane, Queensland, Australia
Mr C.M. Lee, International Copper Association, New York, USA
Dr E.V. Ohanian, Health and Ecological Criteria Division, Office of
Water, US Environinental Protection Agency, Washington, DC, USA
Dr J.-P. Robin, Noranda Metallurgy lue., Occupational Health & Safety,
McGill College, Montreal, Quebec, Canada (Representing ICME)
Secretariat
Dr G.C. Becking, International Programme on Chemical Safety
Inter-regional Research Unit, World Health Organization, Research
Triangle Park, North Carolina, USA ( Secretary)
Mr P. Callan, Departrnent of Health and Family Services, Environmental
Health Policy, Canberra, Australia) ( Co-rapporteur)
Dr C. Dameron, National Research Centre for Environmental Toxicology,
The University of Queensland, Coopers Plains, Queensland, Australia
Mr P.D. Howe, Institute of Terrestrial Ecology, Monks Wood, Abbots
Ripton, Huntingdon, Cambridgeshire, United Kingdom ( Co-rapporteur)
Dr L. Tomaska, Australian and New Zealand Food Authority, Canberra,
Australia ( Co-rapporteur)
WHO TASK GROUP ON ENVIRONMENTAL HEALTH CRITERIA FOR COPPER
A WHO Task Group on Enviromnental Health Criteria for Copper met
in Brisbane, Australia, from 24 to 28 June 1996. The meeting was
sponsored by a consortium of Australian Commonwealth and State
Govemments through a national steering committee chaired by Dr K.
Bentley, Director, Health and Envirorimentai Policy, Deparünent of
Health and Family Services, Canberra. ne meeting was co-hosted and
organized by the Department of Health and Family Services,
Commonwealth of Australia, the Queensland Depariments of Health,
Environment and Heritage, and the National Research Centre for
Environmental Toxicology. Participants were welcorned by Dr G.R.
Neville, Principal Medical Adviser, Queensland Health on behalf of the
host organizations. In opening the meeting, Dr G.C. Becking, on behalf
of Dr M. Mercier, Director of the IPCS and the three cooperating
organizations (UNEP/ILO/WHO), thanked the Australian Commonwealth and
State Govemments for their longstanding generous support in providing
funding for this Task Group as well as several previous IPCS Task
Groups and consultations over the last four years. lie thanked the
Staff of Queensland Health and the National Research Centre for
Environmental Toxicology for their excellent work in organizing the
Task Group for Copper. The Task Group reviewed and revised the draft
criteria monograph, and made an evaluation of the risks to human
heaith and the enviromnent from exposure to copper.
The first draft of this monograph was prepared by Dr C, Dameron
and colleagues at the National Research Centre for Environmental
Toxicology, Australia, and by Mr P.D. Howe, Institute of Terrestrial
Ecology, Monks Wood, United Kingdom. The Task Group draft,
incorperating the comments received fiom the IPCS Contact Points for
Enviromnental Health Criteria monographs, was prepared by Mr P.D. Howe
and the Secretariat.
Dr G.C. Becking (IPCS Central Unit, Interregional Research Unit)
and Ms K. Lyle (Sheffield, England) were responsible for the overall
scientific content and technical editing, respectively, of this
moriograph.
The efforts of all who helped in the preparation and
finalization of this publication are gratefully acknowledged.
ABBREVIATIONS
AAS atomic absorption spectroscopy
ALAD aminolaevulinic acid dehydratase
ALAT alanine aminotransferase
AROI acceptable range of oral intake
ASAT aspartate arninotransferase
ASV anodic stripping voltammetry
AVS acid volatile suffides
CEC cation exchange capacity
CNS central nervous system
CSV cathodic stripping voltarrimetry
CTMAX critical thermal maxima
DT-OCEE deficiency toxicity optimum concentration for essential
elements
EDTA ethylene diamine tetraacetic acid
EPA Enviromnental Protection Agency (USA)
ER endoplasmic reticulum
FI-AAS flow-injection atornic absorption spectroscopy
GF-AAS graphite fumace atomic absorption spectroscopy
GLC gas liquid chromatography
GLC-MS gas liquid chromatography-mass spectrorrietry
HDL high density lipoprotein
HPLC high performance liquid chromatography
IC ion chrornatography
ICC Indian childhood cirrhosis
ICP-AES inductively coupled plasma-atornic emission spectroscopy
ICP-ES inductively coupled plasrna-emission Spectroscopy
ICP-MS inductively coupled plasma-mass spectrometry
ICT idiopathic copper toxicosis
LBW low birth weight
LDL low density lipoprotein
LEC Long-Evans Cinnamon (rat)
LOEC lowest-observed-effect concentration
MATC maximum acceptable toxicant concentration
MRE metal responsive element
NMR nuelcar magnetic resonance
NOAEL no-observed-adverse-effect level
NOEC no-observed-effect concentration
NOEL no-observed-effect level
NTA nitrilotriacetic acid
OCEE optimal concentration of essential elements
PIXE proton-induced X-ray fluorescence - PTDI
provisional tolerable daily intake
RER rough endoplasmic reticulum
SAAM standard algal assay medium
SER smooth endopiasmic reticulurn
SOD superoxide dismutase
TIMS thermal ionization mass spectrometry
UV ultraviolet
XRF X-ray fluorescence
1. SUMMARY AND CONCLUSIONS
1.1 Identity, physical and chemical properties
Copper is a reddish-brown, ductile and malleable metal. It
belongs to group IB of the Periodic Table. In compounds found in the
environment it usually has a valence of 2 but can exist in the
metallic, +1 and +3 valence states. Copper is found naturally in a
wide variety of mineral salts and organic compounds, and in the
metallic form. The metal is sparingly soluble in water, salt or
mildly acidic solutions, but can be dissolved in nitric and sulfuric
acids as well as basic solutions of ammonium hydroxide or carbonate.
Copper possesses high electrical and thermal conductivity and
resists corrosion.
1.2 Analytical methods
The wide range of copper species, inorganic and organic, has led
to the development of an array of sampling techniques, preparation and
analytical methods to quantify the element in environmental and
biological samples. Contamination of the samples with copper from
air, dusts, vessels or reagents during sampling and preparation is a
major source of analytical errors, and "clean" techniques are
essential.
Colorimetric and gravimetric methods for the measurement of
copper are simple to use and are inexpensive; however, their
usefulness is limited to situations where extreme sensitivity is not
essential. For measurement of low concentrations of copper in various
matrices, atomic absorption spectrophotometric (AAS) methods are the
most widely used. A dramatic increase in sensitivity is obtained by
the utilization of graphite furnace atomic absorption
spectrophotometry (GF-AAS) rather than flame AAS. Depending upon
sample pretreatment, separation and concentration procedures,
detection limits of about 1 µg/litre in water by GF-AAS and 20
µg/litre by AAS have been reported and levels of 0.05-0.2 µg/g of
tissue have been detected by GF-AAS. Greater sensitivities can be
achieved through the use of emission techniques such as high
temperature inductively coupled argon plasma techniques followed by
atomic emission spectroscopy (ICP-AES) or a mass spectrometer
(ICP-MS). Other more sensitive and specialized methodologies are
available such as X-ray fluorescence, ion-selective electrodes and
potentiometric methods, and anodic stripping and cathodic stripping
voltametry.
1.3 Sources of human and environmental exposure
Natural sources of copper exposure include windblown dust,
volcanoes, decaying vegetation, forest fires and sea spray.
Anthropogenic emissions include smelters, iron foundries, power
stations and combustion sources such as municipal incinerators. The
major release of copper to land is from tailings and overburdens from
copper mines and sewage sludge. Agricultural use of copper products
accounts for 2% of copper released to soil.
Copper ores are mined, smelted and refined to produce many
industrial and commercial products. Copper is widely used in cooking
utensils and water distribution systems, as well as fertilizers,
bactericides, fungicides, algicides and antifouling paints. It is
also used in animal feed additives and growth promoters, as well as
for disease control in livestock and poultry. Copper is used in
industry as an activator in froth flotation of sulfide ores,
production of wood preservatives, electroplating, azo-dye manufacture,
as a mordant for textile dyes, in petroleum refining and the
manufacture of copper compounds.
1.4 Environmental transport, distribution and transformation
Copper is released to the atmosphere in association with
particulate matter. It is removed by gravitational settling, dry
deposition, washout by rain and rainout. Removal rate and distance
travelled from the source depend on source characteristics, particle
size and wind velocity.
Copper is released to water as a result of natural weathering of
soil and discharges from industries and sewage treatment plants.
Copper compounds may also be intentionally applied to water to kill
algae. Several processes influence the fate of copper in the aqueous
environment. These include complex formation, sorption to hydrous
metal oxides, clays and organic materials, and bioaccumulation.
Information on the physicochemical forms of copper (speciation) is
more informative than total copper concentrations. Much of the copper
discharged to water is in particulate form and tends to settle out,
precipitate out or be adsorbed by organic matter, hydrous iron,
manganese oxides and clay in the sediment or water column. In the
aquatic environment the concentration of copper and its
bioavailability depend on factors such as water hardness and
alkalinity, ionic strength, pH and redox potential, complexing
ligands, suspended particulate matter and carbon, and the interaction
between sediments and water.
The largest release of copper is to land; the major sources of
release are mining operations, agriculture, solid waste and sludge
from treatment works. Most copper deposited in soil is strongly
adsorbed and remains in the upper few centimetres of soil. Copper
adsorbs to organic matter, carbonate minerals, clay minerals, hydrous
iron and manganese oxides. The greatest amount of leaching occurs from
sandy acidic soils. In the terrestrial environment a number of
important factors influence the fate of copper in soil. These include
the nature of the soil itself, pH, presence of oxides, redox
potential, charged surfaces, organic matter and cation exchange.
Bioaccumulation of copper from the environment occurs if the
copper is biologically available. Accumulation factors vary greatly
between different organisms, but tend to be higher at lower exposure
concentrations. Accumulation may lead to exceptionally high body
burdens in certain animals (such as bivalves) and terrestrial plants
(such as those growing on contaminated soils). However, many
organisms are capable of regulating their body copper concentration.
1.5 Environmental levels and human exposure
The concentration of copper in air depends on the proximity of
the site to major sources such as smelters, power plants and
incinerators. Copper is widely distributed in water because it is a
naturally occurring element. However, care must be taken when
interpreting copper concentrations in the aquatic environment. In
aquatic systems the environmental levels of copper are usually
measured as either total or dissolved concentrations, with the latter
being more representative of the bioavailability of the metal.
Average background concentrations of copper in air in rural areas
range from 5 to 50 ng/m3. Copper levels in seawater of 0.15 µg/litre
and in fresh water of 1-20 µg/litre are found in uncontaminated areas.
Sediment is an important sink and reservoir for copper. Background
levels of copper in natural freshwater sediments range from 16 to 5000
mg/kg (dry weight). Copper levels in marine sediments range from 2 to
740 mg/kg (dry weight). In anoxic sediments copper is bound strongly
by sulfide and therefore not bioavailable. Median copper
concentrations in uncontaminated soil were reported to be 30 mg/kg
(range 2-250 mg/kg). Copper is accumulated by plants, invertebrates
and fish. Higher concentrations of copper have been reported in
organisms from copper-contaminated sites than in those from
non-contaminated sites.
For healthy, non-occupationally-exposed humans the major route of
exposure to copper is oral. The mean daily dietary intake of copper
in adults ranges between 0.9 and 2.2 mg. A majority of studies have
found intakes to be at the lower end of that range. The variation
reflects different dietary habits as well as different agricultural
and food processing practices used worldwide. In some cases,
drinking-water may make a substantial additional contribution to the
total daily intake of copper, particularly in households where
corrosive waters have stood in copper pipes. In homes without copper
piping or with noncorrosive water, copper intake from drinking-water
seldom exceeds 0.1 mg/day, although intakes greater than a few mg per
day can result from corrosive water distributed through copper pipes.
In general, total daily oral intakes of copper (food plus
drinking-water) are between 1 and 2 mg/day, although they may
occasionally exceed 5 mg/day. All other intakes of copper (inhalation
and dermal) are insignificant in comparison to the oral route.
Inhalation adds 0.3-2.0 µm/day from dusts and smoke. Women using
copper IUDs are exposed to only 80 µg or less of copper per day from
this source.
1.6 Kinetics and metabolism in laboratory animals and humans
The homoeostasis of copper involves the dual essentiality and
toxicity of the element. Its essentiality arises from its specific
incorporation into a large number of proteins for catalytic and
structural purposes. The cellular pathways of uptake, incorporation
into protein and export of copper are conserved in mammals and
modulated by the metal itself.
Copper is mainly absorbed through the gastrointestinal tract.
From 20 to 60% of the dietary copper is absorbed, with the rest being
excreted through the faeces. Once the metal passes through the
basolateral membrane it is transported to the liver bound to serum
albumin. The liver is the critical organ for copper homoeostasis.
The copper is partitioned for excretion through the bile or
incorporation into intra- and extracellular proteins. The primary
route of excretion is through the bile. The transport of copper to
the peripheral tissues is accomplished through the plasma attached to
serum albumin, ceruloplasmin or low-molecular-weight complexes.
The methods used to study copper homoeostasis in mammals include
dietary analyses and balance studies. Isotope and standardized
biochemical analyses of these processes are essential to understand
copper deficiency and excess.
The biochemical toxicity of copper, when it exceeds homoeostatic
control, is derived from its effects on the structure and function of
biomolecules such as DNA, membranes and proteins directly or through
oxygen-radical mechanisms.
1.7 Effects on laboratory animals and in vitro test systems
The toxicity of a single oral dose of copper varies widely
between species (LD50 range 15-1664 mg Cu/kg body weight). The more
soluble salts (copper(II) sulfate, copper(II) chloride) are generally
more toxic than the less soluble salts (copper(II) hydroxide,
copper(II) oxide). Death is preceded by gastric haemorrhage,
tachycardia, hypotension, haemolytic crisis, convulsions and
paralysis. LD50 values for dermal exposure were reported at > 1124
and > 2058 mg Cu/kg body weight in rats and rabbits respectively.
The inhalation LC50 (exposure duration unspecified) was > 1303 mg
Cu/kg body weight in rabbits, and respiratory function was impaired in
guinea-pigs exposed to 1.3 mg Cu/m3 for 1 h.
Rats given up to 305 mg Cu/kg per day orally in the diet as
copper(II) sulfate for 15 days showed alterations in blood
biochemistry and haematology (particularly anaemia) and adverse
effects on the liver, kidney and lungs. Effects were qualitatively
similar with other copper compounds and in other species. The
no-observed-effect level (NOEL) in this study was 23 mg Cu/kg body
weight per day. However, sheep were particularly sensitive and
repeated doses of 1.5-7.5 mg Cu/kg body weight per day as copper(II)
sulfate or copper(II) acetate resulted in progressive liver damage,
haemolytic crisis and ultimately death.
Long-term exposure in rats and mice showed no overt signs of
toxicity other than a dose-related reduction in growth after ingestion
of 138 mg Cu/kg body weight per day (rats) and 1000 mg Cu/kg body
weight per day (mice). The no-observed-adverse-effect level (NOAEL)
was 17 mg Cu/kg body weight per day in rats, and 44 and 126 mg Cu/kg
body weight per day in male and female mice, respectively. The effects
included inflammation of the liver and degeneration of kidney tubule
epithelium.
Studies of reproductive and developmental toxicity were limited.
Some testicular degeneration and reduced neonatal body and organ
weights were seen in rats at dose levels in excess of 30 mg Cu/kg body
weight per day over extended time periods, and fetotoxic effects and
malformations were seen at high dose levels (> 80 mg Cu/kg body
weight per day).
Copper(II) sulfate was not mutagenic in bacterial assays.
However, a dose-related increase in unscheduled DNA synthesis was seen
in rat hepatocytes. In the mouse micronucleus assay, one study showed
a significant increase in chromosome breaks at the highest intravenous
dose (1.7 mg Cu/kg body weight) but no effect was seen in another
study at intravenous doses up to 5.1 mg Cu/kg body weight.
Studies of neurotoxicity have not shown effects on behaviour but
neurochemical changes have been reported after oral administration of
20-40 mg Cu/kg body weight per day. A limited number of
immunotoxicity studies showed humoral and cell-mediated immune
function impairment in mice after oral intakes from drinking-water of
about 10 mg Cu/kg body weight per day.
1.8 Effects on humans
Copper is an essential element and adverse health effects are
related to deficiency as well as excess. Copper deficiency is
associated with anaemia, neutropenia and bone abnormalities but
clinically evident deficiency is relatively infrequent in humans.
Balance data may be used to anticipate clinical effects, whereas serum
copper and ceruloplasmin levels are useful measures of moderate to
severe deficiency but less sensitive measures of marginal deficiency.
Except for occasional acute incidents of copper poisoning, few
effects are noted in normal populations. Effects of single exposure
following suicidal or accidental oral exposure have been reported as
metallic taste, epigastric pain, headache, nausea, dizziness, vomiting
and diarrhoea, tachycardia, respiratory difficulty, haemolytic
anaemia, haematuria, massive gastrointestinal bleeding, liver and
kidney failure, and death. Gastrointestinal effects have also
resulted from single and repeated ingestion of drinking-water
containing high copper concentrations, and liver failure has been
reported following chronic ingestion of copper. Dermal exposure has
not been associated with systemic toxicity but copper may induce
allergic responses in sensitive individuals. Metal fume fever from
inhalation of high concentrations in the air in the occupational
setting has been reported and, although other respiratory effects have
been attributed to exposure to mixtures containing copper (e.g.
Bordeaux mix, mining and smelting), the role of copper has not been
demonstrated. Workers apparently exposed to high air levels resulting
in an estimated intake of 200 mg Cu/day developed signs suggesting
copper toxicity (e.g. elevated serum copper levels, hepatomegaly).
Available data on reproductive toxicity and carcinogenicity are
inadequate for risk assessment.
A number of groups are described where apparent disorders in
copper homoeostasis result in greater sensitivity to copper deficit or
excess than the general population. Some disorders have a
well-defined genetic basis. These include Menkes disease, a generally
fatal manifestation of copper deficiency; Wilson disease
(hepatolenticular degeneration), a condition leading to progressive
accumulation of copper; and hereditary aceruloplasminaemia, with
clinical symptoms of iron overload. Indian childhood cirrhosis (ICC)
and idiopathic copper toxicosis (ICT) are conditions related to excess
copper which may be associated with genetically based copper
sensitivity, although this has not been demonstrated unequivocally.
These are fatal liver conditions in early childhood where copper
accumulates in the liver. Incidences of the diseases were related to
high copper intake, at least in some cases.
Other groups potentially sensitive to copper excess are
haemodialysis patients and subjects with chronic liver disease.
Groups at risk of copper deficiency include infants (particularly low
birth weight/preterm babies, children recovering from malnutrition,
and babies fed exclusively with cow's milk), people with malabsorption
syndromes (e.g. coeliac disease, sprue, cystic fibrosis), and patients
on total parenteral nutrition. Copper deficiency has been implicated
in the pathogenesis of cardiovascular disease.
1.9 Effects on other organisms in the laboratory and field
The adverse effects of copper must be balanced against its
essentiality. Copper is an essential element for all biota, and care
must be taken to ensure the copper nutritional needs of organisms are
met. At least 12 major proteins require copper as an integral part of
their structure. It is essential for the utilization of iron in the
formation of haemoglobin, and most crustaceans and molluscs possess
the copper-containing haemocyanin as their main oxygen-carrying blood
protein. In plants copper is a component of several enzymes involved
in carbohydrate, nitrogen and cell wall metabolism.
A critical factor in assessing the hazard of copper is its
bioavailability. Adsorption of copper to particles and complexation
by organic matter can greatly limit the degree to which copper will be
accumulated and elicit effects. Other cations and pH can also
significantly affect bioavailability.
Copper has been shown to exert adverse reproductive, biochemical,
physiological and behavioural effects on a variety of aquatic
organisms. Copper concentrations as low as 1-2 µg/litre have been
shown to have adverse effects on aquatic organisms; however, large
variations due to species sensitivity and bioavailability must be
considered in the interpretation and application of this information.
In natural phytoplankton communities chlorophyll a and nitrogen
fixation were significantly reduced at copper concentrations of
> 20 µg/litre and carbon fixation was significantly reduced at
> 10 µg/litre. EC50s (72 h) for algae, based on growth
inhibition, range from 47 to 120 µg Cu/litre.
For freshwater invertebrates, 48-h L(E)C50s range from 5 µg
Cu/litre for a daphnid species to 5300 µg Cu/litre for an ostracod.
For marine invertebrates 96-h LC50s range from 29 µg Cu/litre for the
bay scallop to 9400 µg Cu/litre for the fiddler crab. The acute
toxicity of copper to freshwater and marine fish is highly variable.
For freshwater fish 96-h LC50s range from 3 µg Cu/litre (Arctic
grayling) to 7340 µg Cu/litre (bluegill). For marine fish 96-h LC50s
range from 60 µg Cu/litre for chinook salmon to 1400 µg Cu/litre for
grey mullet.
Although plants require copper as a trace element, at high soil
levels copper can be extremely toxic. Generally visible symptoms of
metal toxicity are small chlorotic leaves and early leaf fall. Growth
is stunted and initiation of roots and development of root laterals
are poor. Reduced root development may result in a lowered water and
nutrient uptake which leads to disturbances in the metabolism and
growth retardation. At the cellular level, copper inhibits a large
number of enzymes and interferes with several aspects of plant
biochemistry (including photosynthesis, pigment synthesis and membrane
integrity) and physiology (including interference with fatty acids,
protein metabolism and inhibition of respiration and nitrogen fixation
processes).
Toxic effects have been observed in laboratory studies of
earthworms exposed to copper in soil; cocoon production is the most
sensitive parameter measured, with significant adverse effects at
50-60 mg Cu/kg.
Adverse field effects on soil microorganisms have been correlated
with enhanced copper concentrations in areas where copper-containing
fertilizers have been applied and in areas near to copper-zinc
smelters. In citrus-growing areas, to which copper-containing
fungicides have been applied, leaf chlorosis has been found to be
significantly correlated with soil copper levels.
Tolerance to copper has been demonstrated in the environment for
phytoplankton, aquatic and terrestrial invertebrates, fish and
terrestrial plants. Tolerance mechanisms which have been proposed in
plants include binding of metal to cell wall material, presence of
metal-tolerant enzymes, complex formation with organic acids with
subsequent removal to the vacuole, and binding to specialized
thiol-rich proteins or phytochelatins.
1.10 Conclusions
1.10.1 Human health
The lower limit of the acceptable range of oral intake (AROI) is
20 µg Cu/kg body weight per day. This figure is arrived at from the
adult basal requirement with an allowance for variations in copper
absorption, retention and storage (WHO, 1996). In infancy, this
figure is 50 µg Cu/kg body weight per day.
The upper limit of the AROI in adults is uncertain but it is most
likely in the range of several but not many mg per day in adults
(several meaning more than 2-3 mg/day). This evaluation is based
solely on studies of gastrointestinal effects of copper-contaminated
drinking-water. A more specific value for the upper AROI could not be
confirmed for any segment of the general population. We have limited
information on the level of ingestion of copper from food that would
provoke adverse health effects.
The available data on toxicity in animals were considered
unhelpful in establishing the upper limit of the AROI, owing to
uncertainty about an appropriate model for humans. Moreover,
traditional methodology for safety assessment, based on application of
uncertainty factors to data in animals, does not adequately address
the special attributes of essential elements such as copper.
From available data on human exposures worldwide, but
particularly in Europe and the Americas, there is greater risk of
health effects from deficiency of copper intake than from excess
copper intake.
1.10.2 Environmental effects
Protection of aquatic life in waters with high bioavailability
will require limiting total dissolved copper to some concentration
less than 10 µg/litre; however, the appropriate concentration limit
will depend on the biota and exposure conditions at sites of concern
and should be set based on further evaluation of all relevant data.
At many sites, physicochemical factors limiting bioavailability
will warrant higher copper limits. Regulatory criteria should take
into account the speciation of copper if dischargers can demonstrate
that the bioavailability of copper in the receiving water can be
measured reliably.
When sampling and analysing environmental media for copper, it is
essential that "clean" techniques be employed.
Because copper is an essential element, procedures to prevent
toxic levels of copper should not incorporate safety factors that
result in recommended concentrations being below natural levels.
2. IDENTITY, PHYSICAL AND CHEMICAL PROPERTIES AND ANALYTICAL METHODS
2.1 Identity
Copper, the 29th element and the first in group IB of the
Periodic Table, displays four oxidation states: metallic copper Cu0,
cuprous ion Cu+, cupric Cu2+ and trivalent copper ion Cu3+.
Copper also forms organometallic compounds. The natural isotopic
abundance is 69.17% 63Cu and 30.83% 65Cu, giving the element an
average relative atomic mass of 63.546 (Lide & Frederikse, 1993b).
The limited range of stable isotopes and their common distribution has
inhibited isotopic distribution studies. Useful radioactive copper
isotopes are 64Cu (12.701 h half-life) and 67Cu (61.92 h half-life);
they decay with the production of ß-particles and gamma-rays (Lide &
Frederikse, 1993b) and are produced in synchrotrons for physical and
biological studies.
Copper is found in a wide variety of mineral salts and organic
compounds, and can also be found naturally in the elemental or
metallic form. The metal is a dull lustrous reddish-brown in colour,
malleable, a good thermal conductor and an excellent electrical
conductor. The metallic form is very stable to dry air at low
temperatures but undergoes a slow reaction in moist air to produce a
hydroxycarbonate or hydroxysulfate that forms a greenish-grey
amorphous film over the surface which protects the underlying metal
from further attack. The metal is sparingly soluble in water, in salt
solutions and in mildly acidic solutions, but can be dissolved in
nitric acid and sulfuric acid as well as in basic solutions of
ammonium hydroxide, ammonium carbonate and cyanide in the presence of
oxygen (Cotton & Wilkinson, 1989).
The electronic configuration of the metallic (Cu0) form is
1s22s22p63s23p63d104p1. The common solution oxidation states
are the cuprous (Cu(I) 3d10) or the cupric (Cu(II) 3d9) forms. The
chemistry of the element, especially in biological systems, is
profoundly affected by the electronic/oxidation state. The facile
exchange between oxidation states endows the element with redox
properties which may be of an essential or deleterious nature in
biological systems.
The most important oxidation state in natural, aqueous
environments is copper(II). Any copper(I) present is quickly oxidized
by any oxidizing reagent present, or in a disproportionation reaction,
unless it is stabilized by complex formation. The copper(II) ion
binds preferentially via oxygen to inorganic ligands such as H2O, OH-,
CO32-, SO42-, etc. and to organic ligands via phenolic and
carboxylic groups (Cotton & Wilkinson, 1989). Thus, almost all of the
copper in natural samples is complexed with organic compounds
(Neubecker & Allen, 1983; Nor, 1987; Allen & Hansen, 1996).
Many cupric compounds and complexes are soluble in water and have
a characteristic aqua-blue-green colour. The trivalent form of copper
is found in only a few compounds and is a strong oxidizing agent
(Cotton & Wilkinson, 1989). In environmental and mineral environments
the divalent oxidation state readily adsorbs to a variety of hydrated
metal oxides including those of iron, aluminium and manganese (Grant
et al., 1990).
Identification, quantification and speciation of copper is
described in sections 2.3 and 2.4 and the influences on the speciation
in water and soil are described in section 2.4.1.
2.2 Physical and chemical properties
The physical and chemical properties of copper and some of its
salts are summarized in Table 1.
2.3 Analytical methods
The wide range of copper species, inorganic and organic, has lead
to the development of an array of sampling techniques and preparative
and analytical methods to quantify the element in environmental and
biological samples. The following sections offer a brief overview of
these methodologies.
2.3.1 Sampling and sample preparation
Sampling and the subsequent work-up is highly dependent on the
type of sample being analysed and the level of detail needed to
evaluate it. Most of the techniques described below suffer at some
level from the effects of the surrounding milieu or matrix.
Qualitative analysis to determine the presence of copper in a sample,
for instance, may or may not require consideration of the matrix,
whereas quantitation of metals usually does. Quantitation of the
various forms of copper requires a detailed evaluation of the matrix
and the techniques being used.
2.3.1.1 Sampling
Owing to the abundance of copper in the environment, the
collection of samples for copper analysis requires precautions to
avoid accidental contamination. Most plastics and glassware are
relatively free of copper contamination but care should be taken to
avoid heavily pigmented plastics that could contain copper or other
metals that might compromise the analysis. Interference by
contaminating metals is more likely to be a problem in colorimetric
analyses. Vessels to be used in the collection of samples for copper
analysis should be cleaned of dust and debris and washed with a dilute
metal-free mineral acid such as 0.1 mol/litre hydrochloric or nitric
acid, rinsed copiously with clean distilled water and dried in a
dust-free area. Copper is frequently and naturally found in
industrial and household dusts (Kim & Fergusson, 1993) so care should
be taken that the samples are not contaminated. Removal of copper
from washing and rinsing water, and even distilled water, can be
compromised by the use of copper plumbing and brass fixtures. Removal
of metals and other ions can be accomplished through the use of
ion-exchange resins.
Table 1. Physical and chemical properties of copper and some of its saltsa
Copper Copper(II) Cuprous(I) Copper(II) Copper(II) Oxine-copperb
sulfate oxide hydroxide chloride
CAS registry number 7440-50-8 7758-98-7 1317-39-1 20427-59-2 7447-39-4 10280-28-6
Molecular formula Cu CuSO4 Cu2O Cu(OH)2 CuCl2 C18H12CuN2O2
Relative molecular mass 63.55 159.6 141.3 97.56 134.45 351.9
Boiling point (°C) 2567 decomposes to decomposes at decomposes at
CuO at 650 °C 140 °C 993 °C
Melting point (°C) 1083.4 slightly decomposes 1235 decomposes 620 decomposes
at > 200°C at 270°C
Vapour pressure (kPa) 1.33 at
1870 °C
Water solubility insoluble 143 g/litre practically 2.9 mg/litre 706 g/litre insoluble
at 0°C insoluble at 25 °C
a Lide & Frederikse (1993)
b Copper 8-hydroxyquinolinate.
2.3.1.2 Separation and concentration
It is not generally necessary that the metal itself be isolated
before analysis, but frequently the metal or at least the inorganic
portion of the sample must be concentrated. The requirement for
concentration of the sample depends on the sensitivity of analytical
method to be employed.
Particulates (dust, smoke, spray) are sampled from air on filters
before analysis. Aqueous samples may need to be dried or concentrated
using an ion-exchange procedure (Vermeiren et al., 1990; Chakrabarti
et al., 1994).
Total copper (in water) includes all forms of copper
irrespective of form, whether dissolved or bound. Suspended copper
refers to copper attached to suspended particles in water large enough
to be filtered by a 0.45 µm membrane filter. Dissolved copper is
defined operationally as all forms of copper which pass through a 0.45
µm membrane filter (ATSDR, 1990). Separation of dissolved and
suspended forms of copper requires filtering. Special measures must
be taken to avoid sample contamination when filtering. First, the
membrane filter and filter holder must be acid cleaned. The filter
must be discarded and the filter holder should be acid rinsed between
samples and subsequently rinsed with metal-free water. Second, glass
fibre filters must not be used. Third, the filter holder and membrane
filter must be conditioned with the sample, i.e. an initial portion of
the sample filtered and discarded. Lastly, if positive pressure
filtration is used, the gas must be passed through a 0.2 µm in-line
filter.
2.3.1.3 Sample preparation
Direct analysis of metals with little modification or preparation
of the sample is desirable but frequently not achievable. Direct
analysis of copper is appropriate when relatively concentrated samples
are analysed (0.1-2 mg/litre or higher), provided they are very low in
interfering inorganics and especially organic materials. More dilute
samples can be concentrated as described above. Concentrated samples
can be diluted with appropriate diluents, usually distilled water or
dilute copper-free mineral acid solutions. Care should be taken to
keep the pH near or below neutral to avoid the formation of insoluble
copper hydroxides.
Sample preparation for the most widely utilized analytical
techniques, or where the removal of the organic matrix is required, is
generally achievable by means of a preceding open vessel oxidative
degradation step involving nitric acid or acid mixtures such as aqua
regia or sulfuric acid/hydrogen peroxide. (Perchloric acid is less
frequently used because of its explosive nature.) A procedure using a
mixture of nitric, perchloric and hydrofluoric acids was reported to
give good recoveries of metals including cadmium, chromium, copper,
manganese, nickel, lead and zinc in estuarine sediments (Bello et al.,
1994). Recently, oxidative UV photolysis (Kolb et al., 1992) and
microwave-assisted acid digestion in a closed vessel have become more
popular in sample preparation for various sample matrices prior to
elemental analyses. Microwave-assisted digestion has been employed as
a sample preparation procedure prior to the measurement of copper
level in human bone (Baranowska et al., 1995), in duck eggs (Jeng &
Yang, 1995), in sediments by anodic stripping voltametry (Olsen et
al., 1994), in marine biological tissues such as mollusc, fish and
crustacean by AAS (Baldwin et al., 1994), in steels and copper alloys
by ICP-AES (Borszeki et al., 1994), and in plant materials (Matejovic
& Durackova, 1994). The microwave digestion procedure is fast
becoming the method of choice because sample preparation is rapid and
the values of blanks are significantly lower than in the traditional
wet and dry mineralization methods (Matejovic & Durackova, 1994). A
fast and quantitative on-line microwave digestion/extraction of copper
from different solid matrices, such as vegetables, powdery dietary
products and sewage sludge, was developed using a flow
injection-atomic absorption system (FI-AAS) (Delaguardia et al.,
1993). A similar FI-AAS method for the determination of copper in
whole blood was also reported by Burguera et al. (1993).
2.3.1.4 "Clean" techniques for measurement of ultratrace copper levels
Information provided by Shiller & Boyle (1987), Windom et al.
(1991) and Hurley et al. (1996) has raised questions concerning the
quality of data collected and reported for trace metals analysis over
the past several decades. The concern is that insufficient care in
sampling, sample preparation and analysis have resulted in samples
being contaminated and the values reported in the sub-mg/litre range
have questionable accuracy. It has been shown that many published
literature values for surface waters are biased on the high side owing
to contamination and/or matrix interferences. Matrix interferences
commonly encountered in copper analyses are chemical, spectral,
ionization and high dissolved solids. Copper determination by ICP
emission spectroscopy (ICP-ES) can suffer from interference by iron,
thallium and vanadium (US EPA, 1986). Copper determination by ICP-MS
emission spectroscopy is susceptible to interference from chlorides,
although procedures have been developed to overcome this interference
in blood serum samples, for example (Lyon & Fell, 1990). Both ICP-ES
and ICP-MS are excellent techniques for measuring copper if care is
taken to eliminate interferences. "Clean" techniques (Prothro, 1993;
US EPA, 1995) address the problem associated with making accurate and
precise trace determinations of metals particularly when attempting to
lower detection limits and report microgram/litre and
sub-microgram/litre concentrations. "Clean" techniques require
special attention to be paid in seven areas:
1. use of "clean" techniques during collecting, handling, storing,
preparing and analysing samples to avoid contamination
2. use of analytical methods that have sufficiently low detection
limits
3. avoidance of interference in the quantification step
4. use of blanks to assess contamination
5. use of matrix spikes and certified reference materials (CRMs) to
assess interference and contamination
6. use of replicates to assess precision
7. use of certified standards.
To achieve accurate and precise measurement of any particular
sample, it is recommended that both the detection limit and the blank
value should be less than one-tenth the sample concentration. This is
a stringent requirement, but one that is especially important in
measuring metals at concentrations near the method detection limit and
at environmentally relevant concentrations. The methods employed to
attain these goals seek to increase sensitivity, decrease
contamination and decrease interference. The specific recommendations
used to achieve these goals and address the seven items above are
provided in Prothro (1993).
2.3.2 Detection and measurement
2.3.2.1 Gravimetric and colorimetric methods
Gravimetric and colorimetric methods were the earliest procedures
used for the measurement of copper. Gravimetric methods are
non-specific and may precipitate other cations including zinc,
cadmium, cobalt and nickel. Useful spectrophotometric reagents for
copper include cuprizone (biscyclohexanoneoxalydihydrazone) (Peterson
& Bollier, 1955), bathrocuproinedisulfonic acid
(2,9-dimethyl-4,7-diphenyl-1,10-phenanthrolinedisulfonic acid) (Zak,
1958), bathocuproine (dimethyl-4,7-diphenyl-1,10-phenanthroline)
(Wharton & Rader, 1970) and more recently 1-(2-pyridylazo)-2-naphthol
(Malvankar & Shinde, 1991), BPKQH (benzyl 2-pyridyl ketone
2-quinolylhydrazone (Garcia-Sanchez et al., 1990) and
2,2'-bichinchioninic acid (Brenner & Harris, 1995). The bathocuproine
method can achieve a limit of detection of 2 µg Cu/litre in water
samples.
Although colorimetric methods can suffer from lack of
specificity, they are nevertheless useful, especially in laboratories
where more sophisticated instrumentation is not available. Beyond a
spectrophotometer and an analytical balance, no specialized equipment
is required. In addition, the methods are, in general, simple,
inexpensive, easily taught and rapidly carried out. Because of these
advantages they should be considered in situations where extreme
sensitivity is not essential.
2.3.2.2 Atomic absorption, emission and mass spectrometry methods
Atomic absorption spectrophotometric (AAS) methods are the most
widely used for the determination of copper in various matrices. A
dramatic increase in sensitivity over that obtained by flame AAS is
obtained with GF-AAS. Increasingly more common is the use of emission
methods in which the sample is introduced into a high temperature
inductively coupled argon plasma (ICP) where the element is rapidly
vaporized and ionized. The element is detected and quantified by
atomic emission spectroscopy (ICP-AES).
A further increase in sensitivity is obtained through the
coupling of the ICP to a mass spectrometer (ICP-MS). The attraction
of the ICP methods is the ability to do multielemental analysis
(Vollkopf & Barnes, 1995) which is the obvious advantage over other
spectroscopic techniques. The ICP-MS technique has the additional
advantage that isotopic information can be obtained, which is
especially useful if stable isotopes of copper are used for
bioavailability and other studies (Lyon et al., 1988, 1995, 1996). An
isotope dilution ICP-MS method (Beary et al., 1994) reported precision
of less than 0.15% for copper and cadmium in zinc ore and for copper
and molybdenum in domestic sludge; others (Lu et al., 1993) reported a
more conservative precision of less than 1% and a detection limit of
58 ng/litre for copper in a number of biological and environmental
reference materials. The International Standards Organization have
published procedures using AAS for the analysis of copper in water
between 0.05 and 200 µg/litre (ISO, 1986). Detection limits are
summarized in Table 2.
2.3.2.3 Specialized methodologies
Many X-ray fluorescence (XRF) methods, which are nondestructive
techniques, have been published for the determination of trace
elements including copper. XRF has for a long time been used as a
rapid and convenient method for trace element determination although
its sensitivity is somewhat lower than anodic stripping voltametry
(ASV) (Viksna et al., 1995). The technique can be used for a variety
of sample types, such as human serum (Viksna et al., 1995),
electrolyte purification solutions (Davidson et al., 1994), human
kidney tumours (Hamilton et al., 1972) and contaminated soils (Wilson
et al., 1995). Field instruments are available for scans of
contaminated sites to estimate the metal in the surface layer of the
soil. A proton-induced X-ray fluorescence technique (PIXE) was also
reported for the measurement of trace elements in amniotic fluid
(Napolitano et al., 1994).
Ion-selective electrode and potentiometric methods have been used
for copper speciation in soil (Town & Powell, 1993), and in seawater
(Román & Rivera, 1992; Soares et al., 1994). Voltammetric methods
have comparable sensitivity to conventional AAS, but also offer
speciation capability (Scarano et al., 1990; Chakrabarti et al., 1994;
Cheng et al., 1994). Voltammetric/potentiometric analyses offer
sensitivity in the parts per billion (µg/kg) range for copper and some
other metals. Potentiometric analysis relies on the elements
electrochemical properties. An attraction of potentiometric methods
is their ability to help in the speciation of copper and limited
multielement detection. ASV has been used to analyse copper in foods
(Holak, 1983). Cathodic stripping voltametry (CSV) is an extremely
sensitive method for copper in both seawater and fresh water, with a
limit of detection of 0.005 µg/litre (Donat et al., 1994).
Some analytical methods for the detection of copper in different
media are summarized in Table 2.
Table 2. Analytical methods for the detection of copper
Medium Sample Methoda Detection Reference
preparation limit
Air filter collection on ICP-AES 1 µg ATSDR
0.8 µm membrane; (1990)
acid digestion
filter collection on AAS 0.05 µg ATSDR
0.8 µm membrane; (1990)
acid digestion
Fresh acidify with 1:1 AAS 20 µg/litre US EPA
water HNO3 to a pH < 2 (1986)
sample solutions GF-AAS 1 µg/litre US EPA
should contain 0.5% (1986)
HNO3
filter and acidity ICP 2-10 µg/litre US EPA
sample (1986)
filter and acidity ICP-AES 6 µg/litre ATSDR
sample (1990)
acid digestion with ICP-MS 0.01 µg/litre US EPA
HNO3, reflux and (1994)
dilute with type 1
water
Sediment acid digestion AAS 1.0 µg/g US EPA
acid digestion GF-AAS 0.05-0.20 µg/g (1986)
acid digestion ICP 0.20-0.50 µg/g US EPA
acid digestion ICP-MS 0.025-0.005 µg/g (1986)
Tissue acid digestion AAS 0.5-1.0 µg/g US EPA
acid digestion GF-AAS 0.05-0.20 µg/g (1986)
acid digestion GF-AAS 0.25 µg/g Lowe et
wet weight al. (1985)
acid digestion ICP 0.04-0.1 µg/g US EPA
acid digestion ICP-MS 0.025-0.05 µg/g (1986)
acid digestion ICP-AES 0.2 µg/g tissue NIOSH
1 µg/100 ml blood (1987)
Food closed system ASV 0.32 µg/g Holak
digestion (1983)
a See list of abbreviations on p. xxii.
2.4 Speciation
Developing an objective assessment of the hazard that copper
poses to humans and the environment depends on an intimate
understanding of its bioavailability. Bioavailability, defined as the
extent to which the metal is taken up by an organism upon exposure,
depends on the species of the metal or metallo complex and/or how
easily it can be transformed to a more or less bioavailable species.
2.4.1 Speciation in water and sediments
In natural waters, only very small percentages of copper are
present as the "free" aquo ion (Cu2+); rather, most copper is
adsorbed to suspended particles or complexed with various ligands
(Florence & Batley, 1980). Inorganic ligands of greatest importance
are hydroxide, carbonate and, in saline waters, chloride (Bodek et
al., 1988). Binding of copper to fulvic and humic acids and to other
organic compounds can be very strong, so that a large proportion of
dissolved copper is often organically complexed (Neubecker et al.,
1983; Coale & Bruland, 1988; Allen & Hansen, 1996). In air, copper is
present in particulate form. In sediments and soils, most copper is
also on or in particles, either as a constituent of mineral phases or
adsorbed to oxide surfaces or organic matter; formation of copper
sulfide can be particularly important in anoxic sediments (DiToro et
al., 1990). Copper speciation in interstitial water can be affected
by high concentrations of inorganic and organic ligands.
Speciation, the identification and quantitation of a metal in its
various oxidation states, inorganic forms and organometallic
complexes, is afforded through a wide variety of techniques (ICME,
1995).
2.4.1.1 Detection and quantification
a) Electrochemical methods
Electrochemical techniques, especially ASV, have been widely used
to measure the "electrochemically labile" fraction of copper in water
samples, with the assumption that the electrochemically labile
fraction is an approximation of the bioavailable fraction of copper
(Neubecker & Allen, 1983; Bruland et al., 1985; Buckley & van den
Berg, 1986; Morrison & Florence, 1989; Florence et al., 1992; Donat et
al., 1994). It has been shown that if the ASV measurement is carried
out in a manner such that the copper complexing agents in the water
sample affect only the efficiency of electrochemical deposition, but
not the stripping process, then ASV-labile copper correlates very well
with bioavailable copper as measured by algal assay (Florence et al.,
1992). Simple ASV analysis of a water sample at the natural pH where
complexing agents affect both the deposition and stripping processes
tends to underestimate the bioavailable fraction of copper (Zhang &
Florence, 1987; Morrison & Florence, 1989).
Electrochemical titrations using ASV can provide information on
the "complexing capacity" of a water sample, as well as quantitative
data on the conditional formation constants of copper with the ligands
present in the sample. Complexing capacity is defined as the total
concentration of ligands, both organic and inorganic, in a water
sample that will bind copper in nonlabile complexes (Donat et al.,
1994).
b) Equilibration methods
Together with electrochemical methods, equilibration techniques
are among the most popular and successful methods used for speciation
studies. The equilibration methods mostly use ion-exchange resins or
weak inorganic exchangers and complexing ligand. The equilibrium
constant of both the resin and the complex has to be satisfied
simultaneously. The distribution ratio for a fixed resin
concentration is measured in the presence of a competing ligand with
known metal equilibria, which determines the partition coefficient for
the resin. Stability constants and ligand concentrations of unknown
solutions can then be measured (Neubecker & Allen, 1983).
The total concentration of most biologically important trace
metals including copper in seawater is in the range 10-10-10-8
mol/litre and hence the concentration of any individual metal organic
complex must be considerably lower. Characterization and
identification of individual compounds at these concentrations in
seawater by chemical techniques is very difficult, if not impossible.
The methodology usually involves first extracting and concentrating
the compounds from sample matrices on to a resin, followed by
fractionation according to different chemical and physical properties.
Since the compounds may not be volatile, the most useful technique is
high performance liquid chromatography (HPLC); alternatively, the
compounds can be made volatile by some derivatization steps then
determined by gas liquid chromatography (GLC), or gas liquid
chromatography-mass spectrophotometry (GLC-MS). Thompson & Houk
(1986) reported an HPLC-ICP-MS method of multielemental analysis and
speciation with a limit of detection of 4 ng of copper. Recently, the
sensitivity for copper was increased by using an ion
chromatography-ICP-MS (IC-ICP-MS) technique (McLaren et al., 1993).
The aluminium hydroxide-cation exchange mini-column technique (Zhang &
Florence, 1987) provides a rapid and simple method for determining
bioavailable copper in both seawater and fresh water samples.
2.4.2 Speciation in biological matrices
The speciation of copper in tissue and blood samples has been
studied (Florence & Batley, 1980; Brouwer et al., 1989; Florence et
al., 1992). In particular, techniques have been developed for the
separation and determination of caeruloplasmin in blood plasma (Lyon &
Fell, 1990) and for metallothioneins in tissue samples (Florence et
al., 1992).
3. SOURCES OF HUMAN AND ENVIRONMENTAL EXPOSURE
3.1 Natural sources
Metal oxides, silicates and other materials are the building
blocks of rocks forming the earth's crust and it is the weathering of
these rocks that creates soils and sediment. Copper oxide, copper
sulfide and other ores are among these components. Copper, along with
other metals, is distributed through the environment by precipitation
and resulting riverine flows which transport the particles. Depending
on the flow dynamics, these particles settle out and form sedimentary
deposits. Volcanic activity injects dust and particles into the
atmosphere; they then settle out on soil and water surfaces. Wind is
a significant factor in moving metal-laden soil particles around the
land surface of the earth, which they can also reach from atmospheric
sources by both wet (rain washout) and dry deposition. An important
source of copper in aquatic sediments is from dead organisms which
settle out and contribute both copper and organic material. This can
be a significant source in the oceans, for example.
Copper has a natural abundance of approximately 60 mg/kg in the
earth's crust and 2.5 × 10⁻⁴ mg/litre in the sea (Lide & Frederikse,
1993). It occurs naturally in many minerals such as cuprite (Cu2O),
malachite (Cu2CO3.Cu(OH)2), azurite (2CuCO3.Cu(OH)2),
chalcopyrite (CuFeS2), chalcocite (Cu2S), and bornite (Cu5FeS4).
Copper is also found naturally in its metal form (Tuddenham & Dougall,
1978). The copper content of ore deposits ranges from 0.5 to 5% by
weight, whereas igneous rock contains 0.010% (Duby, 1980) and
crystalline rock 0.0055% by weight. The most important sources of
copper are chalcocite, chalcopyrite and malachite (Weant, 1985).
Figures from Cannon et al. (1978) indicate a range of 4-200 mg
Cu/kg and a range of mean concentrations of 2-90 mg Cu/kg in igneous
and sedimentary rocks. Nriagu (1989) estimated mean worldwide
emissions of copper from natural sources as follows: windblown dusts,
0.9-15 × 103 tonnes; forest fires, 0.1-7.5 × 10³ tonnes; volcanic
particles, 0.9-18 × 103 tonnes; biogenic processes, 0.1-6.4 × 10³
tonnes; sea salt spray, 0.2-6.9 × 10³ tonnes.
Average background concentrations of copper in air in rural areas
range from 5 to 50 ng/m3. Copper levels in seawater of 0.15 µg/litre
and in freshwater of 1.0-20 µg/litre are found in uncontaminated areas
(Nriagu, 1979b). Background levels of copper in uncontaminated
sediments range from 800 to 5000 mg/kg (dry weight) (Forstner &
Wittmann, 1979). Copper levels in marine sediments range from 2 to
740 mg/kg (dry weight). Median copper concentrations in uncontaminated
soil were reported to average 30 mg Cu/kg with a range of 2-250 mg/kg
(Bowen, 1985). Detailed information on concentrations in the
environment is presented in section 5.1. Copper is found as a natural
component of foods eaten by humans and animals.
3.2 Anthropogenic sources
Anthropogenic sources of copper include emissions from mines,
smelters and foundries producing or utilizing copper, zinc, silver,
gold and lead. Environmental copper can also arise from the burning
of coal for power generation and from municipal waste incinerators. A
major release of copper to land comes from mine tailings and
overburden from mining operations. Other anthropogenic sources of
copper include its use as an antifouling agent in paints, agriculture
(fertilizers, algicides, feed supplements) and animal and human
excreta (animal manure and human sewage sludge). Copper is also
intentionally released into some water bodies to control the growth of
algae (Slooff et al., 1989; ATSDR, 1990).
Although it was estimated that 66% of copper emissions to the
environment in 1983 were from anthropogenic sources (Nriagu, 1989),
there is evidence that industrial emissions are decreasing owing to
stringent controls developed in facilities manufacturing and using
copper (Dann, 1994).
3.2.1 Production levels and processes
The mining and refining of copper takes place on all six
continents. Mines in Chile, USA and Canada account for over 50% of
the annual worldwide production of 11 × 106 tonnes of refined copper
metal (ICSG, 1996). Other major areas for copper mining include
Russia, Australia, Zambia, Indonesia, Peru, China and Poland. It is
estimated that about 40% of the copper used worldwide (approximately
15 × 106 tonnes) comes from recycled metal (ATSDR, 1990). Release of
airborne copper from smelters is currently one of the major sources of
copper to the environment.
The majority of copper metal is produced by smelting of the
copper sulfide ore followed by electrolytic refining (ATSDR, 1990).
Some 106 tonnes were produced in Chile and North America using
solvent extraction technology. The process involves extraction of
copper from acidic leach solutions using organic reagents followed by
electrolytic extraction. The principal sources of copper for this
process are conventional mining of oxide ores in open pits, leaching
of mine dump low-grade ore, and mill tailings and mine water run-off.
Extraction of mine tailings and dumps in this way reduces the
environmental impact of mine wastes by reducing the copper
concentrations in these sources.
3.3 Copper use
The world uses approximately 15 × 106 tonnes of copper a year.
Of this about one-third is derived from recycled metal, and the rest
is supplied from the mining of ore bodies and refining of the
extracted copper.
The unique combination of properties of copper, including
durability, ductility, malleability and electrical and thermal
conductivity, determine its uses in a vast range of applications. A
summary of these uses in the USA, Western Europe and Japan is given in
Table 3, compiled from Marco (1989).
Worldwide, the largest use of copper is in electrical wire and
cable and other electronic applications, which can account for as much
as 65% (9.75 × 10⁶ tonnes) of total annual copper consumption.
Rolled copper is also extensively used in architectural applications
for roofing, rainwater goods and cladding, while rolled copper and
brass are also used for vehicle radiators. Overall, the major
industrialized countries consume over 1.5 × 10⁶ tonnes of rolled
product per year. Approxi mately 15% (2.25 × 10⁶ tonnes) of copper
is used annually in building and construction, including plumbing,
architectural applications such as roofing, guttering and flashing,
and in fixtures and fittings. The remaining 20% (3 × 10⁶ tonnes)
goes to transport equipment, air-conditioning and refrigeration as
well as general and light engineering uses such as machine parts, and
process equipment, coinage, ordnance and consumer goods, such as
domestic appliances as well as production of bronze and brass alloys.
Extruded brass is a raw material for the forging and machining
sectors, and is turned into a wide range of components such as taps,
valves and water fittings, and instrument and machine parts. Over 1.7
× 106 tonnes of extruded copper alloy products are consumed by the
major industrialized countries annually.
Tubes in copper and copper alloys are widely and increasingly
used for domestic plumbing and heating systems, air conditioning,
refrigeration and industrial applications. Over 1.5 × 10⁶ tonnes of
tubes are consumed annually by the major industrialized countries.
A small percentage of copper production goes into the manufacture
of copper compounds, particularly copper sulfate which is used
primarily for industrial and agricultural purposes. In industry,
copper sulfate is used as an activator in the froth flotation of
sulfide ores, production of chromated copper arsenate wood
preservatives, electroplating, azo-dye manufacture, as a mordant for
textile dyes, in petroleum refining and in the manufacture of other
inorganic and organometallic compounds (ATSDR, 1990). Other copper
compounds find uses as pigments, paints, dyes, glasses, catalysts and
fungicides. Copper is finding increasing use as the active ingredient
in antifouling paints. In this context it is also used in paints for
operating theatres and other hospital facilities to reduce inadvertent
contamination of surfaces and transmission of disease-causing
organisms.
Table 3. Copper consumption in 1988a (in thousands of tonnes)
Use Building and Electrical/ Industrial
construction electronics
Copper wire 0 4293 0
Copper rod 5 164 34
Copper sheet and strip 240 140 225
Copper tube 551 0 424
Alloy wire 7 9 65
Alloy rod 338 114 462
Alloy sheet and strip 66 123 443
Alloy tube 14 8 110
Castings 142 58 292
Totals 1363 4909 2055
a Based on figures from the USA, western Europe and Japan (about 75%
of world consumption of 11 090 000 tonnes) (Marco, 1989)
In agriculture, copper compounds, especially copper sulfate, are
used as fungicides, pesticides, algicides, nutritional supplements in
animal feeds, and fertilizers. Copper fungicides are used to treat
foliage, seeds, wood, fabric and leather as a protectant against
blights, downy mildews and rusts (ATSDR, 1990). One of the principle
mixtures used to treat foliage for mildew and fungal infections is the
Bordeaux mixture used to spray vines which typically contains 0.05-2%
copper neutralized with soda lime (Pimentel & Marques, 1969). Copper
sulfate is used throughout the world to kill and inhibit the growth of
algae in municipal reservoirs, irrigation equipment and piping,
swimming pools and industrial cooling systems. It is also used in
animal feed additives and growth promoters, as well as for disease
control in livestock and poultry (Grant et al., 1990).
Copper enjoys limited use in human and veterinary medicine,
having been largely replaced by other compounds and treatments.
Copper is, however, a major constituent of many of the metallic
amalgams (e.g. mercury amalgams) used in dentistry. It is also used
to prepare intrauterine devices (IUDs).
4. ENVIRONMENTAL TRANSPORT AND DISTRIBUTION
4.1 Transport and distribution between media
The information reviewed in this section describes the environ
mental fate of copper. The factors affecting the distribution of
copper in air, water, sediment and soil are first described. This is
followed by a review of the factors influencing the bioaccumulation of
copper. This review is not intended to be exhaustive but rather to
present selected representative papers.
4.1.1 Air
Copper is released to the atmosphere in the form of particulate
matter or adsorbed to particulate matter. It is removed by
gravitational settling (bulk deposition), dry deposition (inertial
impaction characterized by a deposition velocity), washout by rain
(attachment to droplets within clouds), and rainout (scrubbing action
below clouds) (Schroeder et al., 1987). Removal rate and distance
travelled from the source depend on source characteristics, particle
size and wind velocity. Gravitational settling governs the removal of
large particles (> 5 µm), whereas smaller particles are removed by
other forms of dry and wet deposition. The relative importance of wet
as compared to dry deposition generally increases with decreasing
particle size (ATSDR, 1990).
Chakrabarti et al. (1993) analysed samples of rainwater (pH 5.3)
and snow (pH 4.7) in Canada; the total copper concentrations were 30.3
µg/litre in the rainwater and 24.6 µg/litre in the snow. In the
rainwater sample 98.3% of the copper was in the soluble phase (< 0.45
µm) and 1.7% in the particulate phase (> 0.45 µm) whereas in the snow
sample 80.5% was found in the particulate phase and 4.8% in the
soluble phase. Another snow sample (pH 3.9) was analysed and revealed
a copper concentration of 5.7 µg/litre with 4.7 µg/litre in the
soluble phase and 1.08 µg/litre in the particulate phase. Kinetic
results suggested that the copper in the snow sample was probably
bound to different sites having different bonding energies in
polyfunctional complexing agents. Four different copper species
having different dissociation rate constants were observed
(3.1 × 10⁻², 1.6 × 10⁻³, 6.2 × 10⁻⁵ and 8.8 × 10⁻⁶/s). Cheng et al.
(1994) found that the distribution of copper species in rainwater
collected in Ottawa, Canada, was very similar to that in the
previously reported snow sample. The rainwater sample contained 7.10
µg Cu/litre of which 2.03 µg/litre was in the particulate phase and
5.07 µg/litre in the soluble phase (< 0.45 µm). The scavenging ratio
of the copper concentration in precipitation (mg/litre) to air
concentrations (µg/m3) for large particles displays a seasonal
variation reflecting the more effective scavenging of snow compared
with rain (Chan et al., 1986).
There is large temporal and spatial variability in copper
deposition. Schroeder et al. (1987) reviewed deposition rates and
washout ratios for copper. Copper deposition rates in urban areas
were estimated to be 0.119 and 0.164 kg Cu/ha per year for dry and wet
deposition, respectively. Bulk deposition was reported to range from
0.002 to 3.01 kg Cu/ha per year. In rural areas bulk deposition was
reported to range from 0.018 to 0.5 kg Cu/ha per year and wet
deposition was 0.033 kg Cu/ha per year. The washout ratio is
114 000-612 000 (µg Cu/m3 rain)/(µg Cu/m3 air) [(140-751 µg Cu/kg
rain)/(µg Cu/kg air)].
Ottley & Harrison (1993) calculated the dry deposition flux of
copper to the North Sea to be 350 tonnes Cu/year. Migon et al. (1991)
studied the input of copper through rainfall and dry deposition to the
Ligurian Sea (Mediterranean) over a period of two years. The total
flux was calculated to be 1.85 kg Cu/km2 per year. A mean yearly
atmospheric input for copper was calculated at 98 tonnes. Fergusson &
Stewart (1992) estimated deposition flux for copper in the insoluble
component of bulk deposition derived from Christchurch city, New
Zealand. Copper fluxes followed approximately exponential decay
curves away from the city. Deposition rates varied from 0.83 µg
Cu/m2 per day (a remote site) to 21 µg Cu/m2 per day (an inner city
site). In the city and nearby rural areas soil is not a major source
of atmospheric copper, whereas at remote sites atmospheric copper is
mostly soil-derived.
The atmospheric wet deposition of copper at Chesapeake Bay, USA,
was examined during 1990 and 1991. The monthly integrated atmospheric
fluxes exhibited a high degree of spatial and temporal variability.
The arithmetically averaged annual wet flux was 260 µg Cu/m2
(Scudlark et al., 1994), and this was derived predominantly from
anthropogenic sources. Wu et al. (1994) calculated the dry deposition
flux for Chesapeake Bay to be 290-810 µm Cu/m2 per year. Dry
deposition fluxes for Lake Michigan were estimated at 690 and 800 µm
Cu/m2 per year.
Migon (1993) compared riverine and atmospheric inputs of copper
with the Ligurian Sea (Mediterranean). Atmospheric inputs were found
to be higher, with a ratio of 16.3 to 32.6.
Chan et al. (1986) reported that in southern Ontario, Canada
during 1982, the mean concentration of copper in precipitation was
1.57 µg Cu/litre of which 1.36 mg Cu/m2 was from wet deposition. The
mean concentrations of copper in precipitation were 1.36 and 1.58 µg
Cu/litre for central and northern Ontario, respectively. In both
areas the annual wet deposition averaged 1.13 mg Cu/m2.
Remoudaki et al. (1991) calculated the seasonal copper
atmospheric deposition to the western Mediterranean. Atmospheric
deposition of copper during the wet season ranged from 0.0004 to
0.0005 µg Cu/cm2 per day and during the dry season 0.0007 to 0.0014
µg Cu/cm2 per day.
Gorzelska (1989) analysed snowpack samples from 18 sites in the
vicinity of Inuvik, Canada during 1985 and 1986. Copper
concentrations ranged from 0.1 µg Cu/kg 20 km north of the town to
0.54 µg Cu/kg near a power plant. In all the samples the trace metals
were enriched with respect to crustal material. Mass balance
calculations have shown that most of the copper emitted by the local
sources is transported outside the immediate vicinity of the town.
4.1.2 Water and sediment
Several processes influence the fate of copper in aquatic
systems. These include complexation to inorganic and organic ligands,
sorption to metal oxides, clays, and particulate organic material,
bioaccumulation and exchange between sediment and water (Stiff, 1971;
Callahan et al., 1979).
Much of the copper discharged to water is in particulate form and
tends to settle out, precipitate out or be adsorbed by organic matter,
hydrous iron, manganese oxides and clay in the sediment or water
column. Equilibrium is normally reached within 24 h. Copper
discharged into a river leading into Chesapeake Bay contained 53 µg
Cu/litre, of which 36 µg/litre was in the form of settleable solids
(Helz et al., 1975). The concentration of copper 2-3 km downstream
from the outfall had fallen to 7 µg/litre. Copper in particulate form
includes precipitates, insoluble organic complexes and copper adsorbed
to clay and other mineral solids (Stiff, 1971).
Owing to unacceptable past practices, Macquarie Harbour on the
west coast of Tasmania, Australia contains dissolved copper levels as
high as 560 µg/litre as a result of riverine transport in dissolved
and particulate forms from the Mount Lyell copper mine (Carbon, 1996).
Some 97 × 106 tonnes of mine tailings and 1.4 × 10⁶ tonnes of slag
were deposited into the Queen and King river system over a 78-year
period before closure of the mine.
The copper(I) ion is unstable in aqueous solution, tending to
disproportionate to copper(II) and copper metal unless a stabilizing
ligand is present (Callahan et al., 1979). The only cuprous compounds
stable in water are insoluble ones such as the sulfide, cyanide and
fluoride. In its copper(II) state, copper forms coordination
compounds or complexes with both inorganic and organic ligands.
Ammonia and chloride ions are examples of species that form stable
ligands with copper. Copper also forms stable complexes with organic
ligands such as humic acids. In seawater, organic matter is generally
the most important complexing agent. Samples collected from the
surface waters (< 200 m) of the northeast Pacific revealed that over
99.7% of the total dissolved copper was associated with organically
complexed forms. At depths of 1000 m approximately 50-70% of the
copper was in the organically complexed form. Copper complexation
gave rise to very low cupric ion activities in surface waters, around
1 pg Cu2+/litre. The authors reported that two classes of
copper-binding ligands were identified: an extremely strong ligand at
low concentrations dominated in surface waters and a weaker class of
ligand at higher concentrations was found throughout the water column
(Coale & Bruland, 1988).
Tan et al. (1988) collected freshwater river samples from the
Linggi river basin, Malaysia. Samples were separated into colloidal
fractions and soluble fractions. Soluble fractions were classified
according to the lability of the copper forms in the water.
Categories range from very labile (e.g. free metal ion) to nonlabile
(e.g. colloidally bound metal). In this study 18-70% of the dissolved
copper was moderately labile and 13-30% was slowly labile.
Copper in the fresh and estuarine waters of the Cochin estuary,
India, was found to be extensively associated with organic colloidal
matter. The relationship between exchangeable and total particulate
copper did not show a significant correlation during the study,
emphasizing the role of lattice-incorporated copper as distinct from
particulate scavenged/adsorbed exchangeable copper (Shibu et al.,
1990).
A detailed study of the Tamar estuary, United Kingdom, revealed a
decrease in the alpha-coefficient for complexation of Cu2+ by natural
organic ligands (log alpha CuL) from 10.8 to 8.3 with increasing
salinity, demonstrating that major cations compete with copper for the
complexing sites. The free Cu2+ concentrations were very low (16.2
< pCu(II) < 18.2) throughout the estuary even though the total
dissolved copper concentrations were high (up to 300 nmol/litre),
probably because of complexation to dissolved organic complex (Van den
Berg et al., 1990).
Giesy et al. (1986) isolated dissolved organic carbon from nine
surface waters in the southeastern USA and found that the binding of
copper by humate occurs with different strengths at a number of sites,
the binding strength at the sites varying by two orders of magnitude,
dependent on the ratio of copper to total organic ligand.
Organic compounds form complexes with 94-98% of dissolved copper
in the surface waters of the North Sea. In all samples strong
copper-chelating compounds were found at concentrations of 4-10 µg
Cu/litre (60-150 nmol/litre). The major inorganic complexes in the
seawater samples were CuCO30 (60%), CuOH+ (16%) and Cu(OH)20
(16%) (Van den Berg, 1984).
Mackey & Higgins (1988) found that the strong copper-complexing
capacity of seawater can vary by more than three orders of magnitude.
Copper-complexing capacity was related to the phytoplankton biomass.
High values were associated with high phytoplankton mass, whereas when
the biomass was low the copper-complexing capacity was also low. The
authors found that in nutrient-limiting, oligotrophic waters of low
average productivity the copper-complexing capacity was variable.
Midorikawa et al. (1992) identified three classes of natural
organic ligands in coastal seawater classified by differences in their
complexing abilities for copper.
Gardner & Ravenscroft (1991) studied the behaviour of copper
complexation in rivers and estuaries of northeast England. They found
that copper speciation in rivers and estuaries is dominated by organic
complexation. The authors found a mixture of ligands of different
affinities for copper in natural waters. The complexation of copper
discharged to rivers and estuaries occurred very rapidly. Complexation
capacities were consistently in the range 10-25 µg Cu/litre (150-400
nmol/litre). The copper-complexing capacity of Linggi river water
(Malaysia) was in the range 26-74 µg Cu/litre (410-1160 nmol/litre)
(Tan et al., 1988).
Sharma & Millero (1988) measured the oxidation of copper(I) in
air-saturated solutions of seawater as a function of pH (5.3-8.6),
temperature (5-45 °C) and salinity (5-44%). The rate of reaction
increased with pH and temperature, and decreased with salinity (ionic
strength). The results indicate that the rates are controlled by the
concentration of Mg2+, Ca2+, Cl- and HCO3- through complex
formation and ligand exchange.
Bradley & Cox (1988) found that 80% of the measurable copper in
standard river sediment SRM 1645 was in the organic fraction. In
Yamuna river sediments, India, copper is mainly associated with the
organic matter owing to its high complexing tendency for organic
matter. A high percentage of copper is also found in the residual
fraction, and much lower concentrations are associated with the
carbonate and iron-manganese oxide phases (Gadh et al., 1993).
Calmano et al. (1993) studied the mobilization of copper from
contaminated sediments. The dominant mobilizing factor was pH with
mobilization increasing with increasing acidity. At pH values
of < 4.5 there was a strong influence of pH on mobilization. At
identical pH values the mobilized portions of copper from the oxic
sediment are tenfold higher than those from anoxic sediment.
Samanidou & Fytianos (1990) estimated a mobilization of 10-15% of
copper due to NTA and EDTA in two rivers in northern Greece, with no
consideration of the biodegradation of metal complexes. Samanidou et
al. (1991) estimated that humic substances (~2-3 mg/litre) were able
to cause the long-term release of 70-80% of copper in the same rivers.
In experimental studies copper was remobilized by synthetic complexing
agents more readily than other metals tested (cadmium, lead, manganese
and chromium).
4.1.3 Soil
In the terrestrial environment, a number of important factors
influence the fate of copper in the soil. These include the nature of
the soil itself, its pH, the type and distribution of organic matter,
the soil redox potential, the presence of oxides, the base status of
the soil and its cation exchange capacity (CEC), the rate of litter
decomposition and the proportions of clay to silt to sand particles.
The residence time of copper in the soil is also a function of overall
climate and of the vegetation present at a site.
Most copper deposited on soil from the atmosphere, from
agricultural applications and from sewage sludge amendments is
strongly adsorbed to the upper few centimetres of the soil. It is
especially bound to the organic matter, as well as being adsorbed by
carbonate minerals and hydrous iron and manganese oxides. Copper
binds more strongly than most other metals and is less influenced by
pH as a result. The greatest amount of leaching of copper occurs from
sandy soils, compared with clays and peats, whereas acidic conditions
favour copper leaching to the groundwater from the soil.
Lehmann & Harter (1984) studied the kinetics of copper desorption
from the A horizon of Paxton soil (surface soil), USA, following
addition of copper at rates ranging from 100 to 500 mg/kg. When 500
mg Cu/kg is added to this soil, about 94% is adsorbed within 15 min.
The copper appears to be preferentially adsorbed to high energy sites.
It appears that this soil is capable of retaining about 100 mg Cu/kg
on high-energy bonding sites. If the copper is present in excess of
the high energy sites, the surplus fills low-energy sites. This more
loosely bonded fraction continues to react for several hours. After 1
day this latter process reaches equilibrium, although the soil
continues to adsorb copper very slowly from solution for up to 4 days.
Assaad & Nielsen (1984) studied the adsorption of copper in three
Danish soil types (two orthic luvisols and a eutric fluvisol). The
Langmuir adsorption equation was found to be the best to describe
copper adsorption in these soils. Copper adsorption increased with
increasing soil pH (pH 4.91-8.48) and decreased with increasing
temperature (5-25 °C).
Petruzzelli et al. (1988) found that fly ash (10%) and humic acid
(1%) increased the adsorption of copper (up to 100 µg/ml) in histosol.
The addition of sewage sludge to a sandy loam soil increased the
sorption of copper solutions of differing concentrations (0.1-1.5 µmol
Cu/cm3). The authors suggested that new adsorbing sites become
available on the solid phase of the soil following "low metal" sludge
addition (Petruzzelli et al., 1994).
King (1988) incubated 13 soil types (10 mineral and 3 organic)
collected from the southeastern USA with 70 mg Cu/kg for 6 days. The
amount of copper adsorbed ranged from 36% to 100%. Removal of copper
from solution was much higher in surface soils than in subsurface
sandy soils. Nonexchangeable copper was relatively high (up to 100%)
in all but some of the acid subsoils. In the B and C horizons 96% of
the variation in sorbed copper was explained by pH, whereas copper in
the A horizon (surface soil) was unaffected by pH. The soil/water
partition coefficient for copper was > 64 for mineral soils and 403
for organic soils.
Elliott et al. (1986) studied pH-dependent adsorption of copper,
cadmium, zinc and lead on to four soils with differing chemical
properties. Copper and lead were more strongly retained under acidic
conditions (pH 5.0) than cadmium and zinc. Adsorption increased with
pH (pH 3-5). The removal of organic matter from the soils
substantially reduced the adsorption of copper.
Sanders & McGrath (1988) studied the extent of copper complex
formation by soluble organic matter extracted from an organic soil, a
clay and two sandy loams. Copper was extensively complexed in these
solutions. The percentage of copper existing as Cu2+ fell as the pH
increased, and also fell as the total copper concentration decreased.
Weight for weight, organic matter from the sandy loams was most
effective at forming complexes with copper within the experimental pH
range (pH 4-7) followed by the organic soil and then the clay.
Allard et al. (1991) studied the distribution of copper within an
illitic clay formation beneath an old (approx. 150 years) deposit of
sulfidic mine tailings. The adsorption in the lower pH range had
little impact on the mobility of copper: at pH levels in excess of 5,
copper is immobilized. The results suggest that transport of copper
originating from the tailings is diffusion controlled.
Tyler & McBride (1982) studied the relative mobility of copper
added to several mineral and organic soils and the simultaneous
desorption and leaching of metals determined by eluting soil columns
with 0.01 mol/litre calcium chloride. Copper was eluted much more
slowly and in much smaller quantities than zinc, cadmium or nickel.
Berggren (1992) studied the factors affecting the mobilization of
copper in spruce, beech and birch forest soil profiles (podzols and
cambisols) at two sites in Sweden. At a depth of 15 cm almost all of
the copper was found to be organically bound. The results also
indicate that organically-complexed copper constituted the predominant
copper form in soil solutions at 50 cm despite the relatively low
dissolved organic carbon (3-14 mg/litre) and the highly
aluminium-saturated organic compounds.
Strain et al. (1984) studied the leaching of copper by simulated
"acid" rain (pH 2.8-4.2) applied in rainwater to soil from Swedish
spruce forest polluted by a brass mill. Leaching of copper increased
considerably when water at pH < 3.4 was applied to the soil.
Campanella et al. (1989) found that UV (mercury lamp) irradiation
of urban sludge resulted in an increased mobility of copper eluted
with sulfuric acid; this was attributed to degradation of organic
matter through radical reactions which provoked the formation of
smaller molecules acting as more soluble metal carriers.
Wong et al. (1993) found that a copper(II)-accumulating bacterial
strain (Pseudomonas putida II-11) isolated from electroplating
effluent removed a significantly high amount of copper(II) from growth
medium and buffer. The adsorption was pH dependent with a maximum at
pH 8.0.
Groudev & Groudeva (1993) studied the microflora of four
industrial copper dump leaching operations. It was found that copper
solubilization depended mainly on the amount and activity of the
mesophyllic acidophilic chemolithotrophic bacteria which occurred in
the ore dumps.
4.1.4 Sewage sludge inputs to land
Land treatment is increasingly being utilized as a method of
waste disposal for sewage effluent and sludge. The intent is to
combine the benefits of fertilizer effects and organic additions to
soils, with safe land disposal of the large quantities of domestic
sewage being generated (Brown et al., 1983; Juste & Mench, 1992; Henry
& Harrison, 1992). Sewage effluent and sludges vary greatly in their
content of metals and especially when domestic sewage is not separated
from industrial sources the metal levels can be high (e.g. for
chromium, copper, zinc, nickel, cadmium) and can pose potential
hazards as a result of metal accumulation if applied to land at high
rates over the long term. There are a number of sources of copper in
sewage effluent and sludge including human excreta, from the corrosion
of copper pipes in domestic water supplies and from direct additions
from industrial processes. In view of the recent interest in the
sustainability of agricultural land focus has been on the potential of
land treatment to cause elevated and toxic levels in the soils.
Present national and regional guidelines are aimed at protecting such
amended land into the future (Table 4).
Copper concentrations in sewage sludge vary greatly. For example,
Hedberg et al. (1996) quote copper concentrations from 0 to 16 000
mg/kg per day sludge for Finland, with a median value of 214 mg Cu/kg.
In nine different sewage districts in Norway the levels in sludge
varied from 100 to 500 mg Cu/kg d.s. For this Norwegian data set,
there was a relationship between the copper content in the sewage
sludge and the pH of the drinking-water. The average copper content
in the sludge was 140 mg Cu/kg d.s. for those drinking-water plants
with pH adjustments (pH increased to 8-8.5) while the average copper
content in the sewage sludge which had received water without pH
adjustments was 320 mg Cu/kg d.s. Attempts to reduce the corrosivity
of piped water supplies can lead to changes in the copper (and iron)
in sewage sludge.
Copper, like other metals applied to land by sludge or effluent
amendments, is rather strongly adsorbed in the upper surfaces,
especially by organic matter, for prolonged periods. It is already
organically bound and, upon release by respiratory breakdown, is then
re-absorbed. Juste & Mench (1992) examined the long-term effects of
sewage sludge applications (10 years or more in duration) on metal
distribution in the soil profile as well as crop responses and metal
uptake from field trials in the EC and the USA. In almost all cases,
sludge-borne metals appeared to remain in the zone of sludge
incorporation to soils (0-15 cm). Mass balances on metal recoveries
from soil additions ranged from 30% to 90%. Lateral soil movement was
the main explanation of the progressive disappearance of metal from
Table 4. Directives for maximum allowed metal concentrations in sewage sludge
used as a soil improvement agent in agriculture (From: Hedberg et al., 1996)
Country/ Maximum allowed metal concentration (mg/kg dry weight)
area
Copper Zinc Lead Cadmium
EUa 1000-1750 2500-4000 750-1200 20-40
Denmark 1000 4000 120 0.8
Germany 800 2500 900 10
Finland 600 1500 100 1.5
France 1000 3000 800 20
Netherlands 75 300 100 1.25
Norwaya 1000-1500 1500-3000 100-300 4-10
Sweden 600 800 100 2
USA (EPA) 1500-4300 2800 300-840 89
a The higher level is valid for application on greenlands
experimental plots. Copper was a good deal less bioavailable to crops
from sludge amendments than cadmium, nickel and zinc, but somewhat
more mobile and bioavailable than lead.
In forest soils the retentivity of copper in the profile may be
even greater from sludge amendments than in agriculture systems. For
example, Zabowski & Zasoski (1987) equilibrated three soil horizons
(A, B2 and C) of an acidic forest soil with copper solutions in the
presence and absence of municipal sewage sludge leachate. Copper
binding to the soils in each of the three horizons was greater than
that of cadmium or zinc. Sludge leachate reduced copper adsorption in
all three horizons.
In the great majority of sludge metal studies done to date,
although copper is a constituent of the sludge, it is very rarely the
element which imposes the limits for addition of sludges or sewage
effluent to land.
4.1.5 Biodegradation and abiotic degradation
Copper is transformed in the environment to forms that are either
more or less bioavailable, depending upon the physical and chemical
conditions present in the environment of interest. For information on
the speciation of copper, see section 2.4.
4.2 Bioaccumulation
Bioaccumulation is defined as the net uptake of copper by
microorganisms, plants or animals from their surrounding environment
(water, sediment, soil and diet). The species of copper present in
environmental media and its associated bioavailability, together with
differences in plant and animal uptake and excretion rates, determine
the extent of bioaccumulation. For aquatic organisms bioconcentration
refers specifically to water.
4.2.1 Microorganisms
Sahoo et al. (1992) found that a bacterial (Bacillus circulans)
biomass of 1.48-1.52 g/litre (dry weight) removed 80% of copper in a
495 mg Cu/litre solution. A reduction of the pH was detrimental to
the accumulating capacity of the bacteria.
Bengtsson et al. (1983) grew the hyphomycete (fungus)
Verticillium bulbillosum in agar containing 15, 45 or 150 mg
Cu/litre for one week. Mean copper concentrations in the mycelium
were, respectively, 1296, 2608 and 3245 mg/kg for the three exposure
concentrations.
4.2.2 Aquatic plants
Bioaccumulation factors have been calculated for over 20 species
of marine macroalgae showing maximum values up to 27 000, depending on
the exposure concentration (Bryan & Hummerstone, 1973; Phillips,
1977; Malea et al., 1994; Correa et al., 1996).
Hall et al. (1979) found that a nontolerant strain of the brown
alga Ectocarpus siliculosus exposed to various copper concentrations
(up to 250 µg/litre) displayed higher accumulation values than did a
tolerant strain. At 72 h incubation, the tolerant strain accumulated
mean copper values of 20 mg/kg (wet weight) with no added copper and
234 µg/kg at 250 µg Cu/litre in the medium (Hall, 1981). The same
strain incubated for 14 days displayed accumulation values of 13 mg/kg
with no added copper and 1075 mg/kg at 250 µg Cu/litre in the medium.
Reed & Moffat (1983) exposed the green alga Enteromorpha compressa
to copper concentrations of up to 610 µg/litre (9.6 µmol/litre) for 6
days. Copper accumulation was linearly dependent on the exposure
concentration and the pattern was similar in both the tolerant and
non-tolerant strains. Mean maximum concentrations in the algae were
22.2 mg Cu/kg (0.35 µmol/g) (fresh weight) for the nontolerant strain
and 25.4 mg Cu/kg (0.4 µmol/g) for the tolerant strain. Equilibrium
was not reached within the experimental time period.
Mersch et al. (1993) maintained the aquatic moss
Rhynchostegium riparoides in water containing copper levels ranging
from 4.5 to 50 µg/litre for 27 days. Accumulation was rapid and
reached a plateau after 18 days. At the end of the 14-day depuration
phase the moss had lost 50% of the accumulated copper. Claveri et al.
(1994) studied the uptake of copper (5-342 µg/litre) by
R. riparoides for periods of up to 168 h. The accumulation of
copper occurred predominantly during the initial 96 h and had reached
equilibrium within 168 h. Copper concentrations in the mosses ranged
from 30 to 2500 mg/kg (dry weight). During the 10 day depuration
period there was a rapid decrease in copper levels during the first 72
h after which copper concentrations in the mosses approached
equilibrium values ranging from 32 to 700 mg/kg (dry weight).
Sinha & Chandra (1990) studied the accumulation of copper
(0.05-5.0 mg/litre) by the aquatic plant Bacopa monnieri for 168
days. Accumulation was directly related to the exposure
concentration. Copper concentrations in shoots ranged from 20 to 721
mg/kg (dry weight) and in roots from 195 to 3821 mg/kg.
The uptake of copper by duckweed (Lemna minor) and water velvet
(Azolla pinnata) was investigated by Jain et al. (1989). Plants
were grown in copper solutions of 1, 2, 4 or 8 mg/litre under static
renewal conditions for 14 days. Copper concentrations in the plants
ranged from 979 to 6714 mg/kg (dry weight) for duckweed, and from 1159
to 7725 mg/kg for water velvet. Uptake rate was highest at the lower
exposure concentrations; concentration factors ranged from 51 to 60
for duckweed, and from 58 to 66 for water velvet. Dirilgen & Inel
(1994) grew duckweed (Lemna minor) in Jacob nutrient medium at
copper concentrations ranging from 0.23 to 2.03 mg/litre for 7 days.
Bioconcentration factors, based on copper content of plants on a dry
weight basis, were 1447, 444 and 314 at copper concentrations of 0.23,
1.03 and 2.03 mg/litre, respectively.
Kay et al. (1984) exposed water hyacinths
(Eichhornia crassipes) to copper (0.5-5.0 mg/litre) for 6 weeks. At
the highest copper concentration levels in leaves, stems roots and
dead tissue were 321, 710, 8160 and 5151 mg/kg (dry weight)
respectively; bioconcentration factors ranged from 64 to 1632. Nor &
Cheng (1986) grew water hyacinths in 2 mg/litre copper solutions.
Fulvic acid (10-50 mg/litre) did not affect the uptake of copper by
Eichornia; however, humic acid (20 and 50 mg/litre) strongly
inhibited copper uptake. In the absence of ligands Eichornia
accumulated 204 and 2451 mg/kg (dry weight) from copper solutions of 1
and 10 mg/litre, respectively.
4.2.3 Aquatic invertebrates
Hansen et al. (1995) exposed the marine demosponge
Halichondria panicea to dissolved copper concentrations ranging from
0.45 (control) to 1000 µg/litre for 14 days. The sponge accumulated
copper in direct proportion to the concentration of the dissolved
metal in the surrounding medium. Final body copper concentrations
were 236 and 818 mg/kg (dry weight) at exposure concentrations of 300
and 1000 µg dissolved Cu/litre, respectively. There was no
significant loss of copper during an 8 day depuration period. The
authors proposed this species as a suitable biomonitoring organism.
Elliott et al. (1985) found that the marine mussel
Mytilus edulis exposed either continually, or in a 2 day cycle, to
copper (10 µg/litre) exhibited a linear accumulation over a 40 day
period. Mussels exposed under cycled conditions showed a lower rate
of accumulation. Copper accumulation was not in direct proportion to
the time exposed to the elevated concentration. The presence of
cadmium reduced the accumulation factor by 50%.
Holwerda (1991) exposed freshwater clams (Anodonta cygnea) to
copper (47 µg/litre) for 6.5 weeks. An accumulation factor of 55 was
calculated for the exposure period. Crecelius et al. (1982) exposed
clams (Macoma inquinata) and shrimps (Pandalus danae) to copper
concentrations ranging from 5 to 30 µg/litre for one month. Body
burdens ranged from 25 to 97 mg Cu/kg (dry weight) for clams and from
146 to 322 mg Cu/kg for shrimps. Ageing of the solutions prior to
exposure reduced the bioavailability of copper. In a static system
with added sediment more than 50% of the added Cu2+ became bound to
the organic fraction of the sediment and was unavailable to
suspension-feeding clams (Protothaca staminea); however,
deposit-feeding clams (Macoma inquinata) placed in the sediment
doubled their copper body burden within 2 months.
Biological half-lives for depuration of copper from "green"
oysters (Crassostrea gigas) and mussels (Mytilus smarangdium) from
a copper-contaminated area, and "normal" oysters were 11.6, 6.4 and
25.1 days, respectively (Han et al., 1993).
Rainbow & White (1989) exposed decapods (Palaemon elegans),
amphipods (Echinogammarus pirloti) and barnacles
(Elminius modestus) to copper at concentrations ranging from 31.62
to 3162 µg/litre for 28 days. Whole-body copper levels (129.3 mg/kg)
are regulated in the decapods at exposures up to and including 100
µg/litre and at higher exposures there is net accumulation. In
amphipods and barnacles there was net accumulation of copper at all
exposures with no apparent regulation of copper levels.
Weeks & Rainbow (1991) exposed the talitrid amphipods
Orchestia gammarellus and O. mediterranea to copper concentrations
ranging from 31.6 to 3162 µg/litre for 21 days. Mean rates of copper
accumulation (measured as net accumulation of total copper) ranged
from 0.9 to 77.0 µg/g per day for O. gammarellus in a dose-related
manner; rates of accumulation in O. mediterranea ranged from 1.19 to
28.1 µg/g per day showing an increase with copper exposure at
concentrations < 100 µg/litre. Weeks & Rainbow (1993) fed the
talitrid amphipods O. gammarellus and O. mediterranea on discs of
algae treated with copper (16.3-2070 mg/kg) for 21 days.
O. gammarellus accumulated whole-body copper concentrations
ranging from 104 to 163 mg/kg; haemolymph concentrations ranged from
525 to 677 mg/kg (dry weight). Rates of accumulation ranged from 0.52
to 4.71 µg/g per day, increasing with increasing copper exposure. The
rates of accumulation for O. mediterranea remained fairly constant
at all exposure concentrations (0.28-0.37 µg/g per day) except the
highest (1.61 µg/g per day). It was concluded that for
O. gammarellus accumulation of copper from food was a more important
route than accumulation of copper from solution. O. mediterranea
was unable to satisfy its copper requirements from a food source but
was able to do so from solution.
Weeks et al. (1993) exposed shore crabs (Carcinus maenus) to
750 µg Cu/litre for up to 7 days at various salinities. Copper
accumulated in the gills and midgut gland but not in muscle. The
accumulation of copper in gill tissue was positively correlated with
salinity.
Ozoh (1994) exposed ragworms (Hediste diversicolor) to a copper
concentration of 200 µg/litre for up to 15 days. At 12 °C, low
salinity (7.5%) increased the availability of copper to the worms and
more copper was accumulated, copper concentrations ranging from 83.27
to 183.12 mg/kg (dry weight). Increasing salinities of 15.25 and
30.5% reduced the accumulation of copper. At 17 and 22 °C more copper
was accumulated than at 12 °C, with copper concentrations ranging from
58.7 to 784 mg/kg. The addition of sediment to the test system
reduced the accumulation of copper by the worms (Ozoh, 1992b).
Zia & Alikhan (1989) found that crayfish (Cambarus bartoni)
accumulated copper concentrations ranging from 130 to 296 mg/kg after
exposure to copper concentrations ranging from 125 to 500 µg/litre for
4 weeks. Copper was predominantly accumulated in the gills and
hepatopancreas.
Winner (1984) exposed Daphnia magna to copper (30 µg/litre) for
7 days; during this period daphnids accumulated whole-body copper
residues of 70.7 mg/kg (dry weight). The addition of 0.75 mg humic
acid/litre had no significant effect on the accumulation of copper.
Giesy et al. (1983) found that the presence of organic matter
decreased the accumulation of copper by the softwater cladoceran
Simocephalus serrulatus. When bioconcentration factors (BCF) were
calculated using Cu2+ the BCFs were similar for the different water
types tested, while when based on total copper concentrations they
varied greatly owing to varying amounts of organic matter. The
authors concluded that most of the copper accumulated by this species
was Cu2+ or the labile aquatic forms and that a decrease in Cu2+ due
to binding of copper by organic matter reduced accumulation.
Vogt & Quinitio (1994) exposed juvenile giant tiger prawns
(Penaeus monodon) to 1 mg Cu/litre for 10 days. Copper deposition
was investigated by histochemistry and electron microscopy. Copper
granules were accumulated in large quantities in the hepatopancreas
tubules, the amount and size of the granules increasing along the
tubules in relation to the cells' age. The granules were released by
discharge of senescent hepatopancreas cells and were added to the
faeces.
Timmermans & Walker (1989) exposed fourth instar larvae of the
midge Chironomus riparius to copper (50 or 100 µg/litre). Larvae
accumulated copper with increasing levels of exposure, but very small
amounts were recovered in pupae or imagines. Average body burdens were
approximately 425 and 750 ng copper, respectively, for the two
exposures.
Dodge & Theis (1979) reported that copper (85 or 325 µg/litre)
was accumulated from solutions by midge larvae (Chironomus tentans)
in which the dominant aqueous forms were free Cu2+ ion and a copper
hydroxy complex reaching concentrations in excess of 200 mg/kg (dry
weight). No significant uptake was observed when copper-glycine and
copper-NTA complexes were dominant.
4.2.4 Fish
Peres & Pihan (1991b) exposed carp (Cyprinus carpio) for up to
3 weeks to copper concentrations of 20, 40 and 120 µg/litre at water
hardnesses of 50, 100 and 300 mg CaCO3/litre, respectively. Accumu
lation in gills after 3 weeks was 53, 58 and 78 mg/kg dry weight for
the three exposure conditions, compared to 13 mg/kg initially.
Daramola & Oladimeji (1989) exposed the freshwater fish
Clarius anguillaris and Oreochromis niloticus to copper for 8
weeks. For C. anguillaris, whole body accumulation was 15.7, 21.8
and 31.2 µg Cu/g dry weight for exposure concentrations of 27, 55 and
110 µg Cu/litre, compared to 6.9 µg Cu/g in control fish. For
O. niloticus, accumulation was 34.7, 36.1 and 81.0 at exposures of
0.05, 0.10 and 0.20 µg Cu/litre, respectively, compared to 17.6 µg
Cu/g in controls.
Playle et al. (1992) studied the accumulation of copper (16
µg/litre) on the gill of fathead minnow (Pimephales promelas)
exposed for 2-3 h. The addition of Ca2+ (2100 or 4200 µeq/litre)
reduced gill copper accumulation during exposures at pH 4.8 but not at
pH 6.3. EDTA eliminated copper deposition at both pH levels when
equimolar with copper, but reduced copper deposition by 50% when half
equimolar at pH 4.8. The authors concluded that copper accumulation
on the fish gills was reduced by Ca2+ and H+ competition at the
gill surface, and by EDTA complexation of copper in the ambient water.
Buckley et al. (1982) exposed coho salmon
(Oncorhynchus kisutch) to copper at concentrations of 70 and 140
µg/litre for 15 weeks. Copper accumulation in liver was greatly
elevated, averaging approximately 180 and 320 µg Cu/g dry weight
versus 60 µg Cu/g in control fish in the latter half of the
experiment. Gill concentrations were also significantly elevated,
averaging 5.6 µg Cu/g and 9.5 µg Cu/g compared to 3.2 µg Cu/g in
controls. Copper concentrations in plasma were not significantly
elevated by copper exposure except during the first day, while
concentrations in kidney were only slightly elevated (6.6, 7.2 and 9.4
µg Cu/g dry weight for controls, low and high exposures,
respectively).
Lanno et al. (1985) fed rainbow trout (Oncorhynchus mykiss)
diets containing various levels of copper. For an 8 week exposure,
copper concentrations in liver ranged from 127 µg/g dry weight for a
diet containing 8.5 mg/kg dry weight to 3200 µg Cu/g for a diet of
3100 mg Cu/kg. For a 24 week exposure, accumulation in liver ranged
from 295 µg Cu/g for a diet of 8.5 µg Cu/g to 1640 µg Cu/g for a diet
of 660 µg Cu/g, while concentrations in kidney ranged only from 8.5 to
21.8 µg Cu/g.
Mount et al. (1994) fed rainbow trout (Oncorhynchus mykiss) on
a brine shrimp (Artemia sp.) diet containing 9.4, 440, 830 or 1000
mg Cu/kg (dry weight) for up to 60 days. After 35 days whole-body
copper concentrations were 5.9, 36, 43.5 and 57.5 mg Cu/kg (dry
weight) for the control and three doses, respectively, but after 60
days copper levels had fallen to 3.6, 19.6, 22.4 and 27.7 mg Cu/kg.
In a second experiment fish were fed diets containing copper
concentrations ranging from 7.8 to 320 mg Cu/kg. Whole-body copper
concentrations ranged from 2.7 to 35.8 mg Cu/kg after 35 days, and
from 2.3 to 8.8 mg Cu/kg after 60 days.
4.2.5 Terrestrial plants
Terrestrial plants respond in a number of ways to copper in the
soils on which they grow. Rooted species are subject to exposures
which vary seasonally and over the plants' lifetime. Perennial and
especially long-lived species may experience wide changes in exposure
over time. Species differ both in their requirements and in their
tolerances for copper. Indeed, some terrestrial species are well
known and used in mineral prospecting as copper indicators. These
include both mosses and higher plants. Others are hyperaccumulators
(Brooks, 1977; Baker & Brooks, 1989; Brooks et al., 1992). Among the
metal accumulators, a number of species from widely different plant
families can accumulate from 2000 to 14 000 µg Cu/g (dry weight) in
foliage, compared with 20-40 µg Cu/g (dry weight) in other species
(Baker & Brooks, 1989).
In Austria, the average copper level in soils was 17 µg/g and
that in vegetation 12 µg/g; for Belgium it averaged 17 µg/g for soil
and 17 µg/g for vegetation; in Finland, 4.3 µg/g for soil and 6.1 µg/g
for vegetation; and for Germany 22 µg/g for soil and 24.5 µg/g for
vegetation (Angelone & Bini, 1992).
In studies of copper tolerant and sensitive strains (varieties)
of the forage grass (Festuca rubra) Wong et al. (1994) showed that
copper concentrations in hydroponic solution of 50 µg/g allowed growth
of a tolerant variety whereas even 5 µg Cu/g inhibited a sensitive
strain. Root copper concentrations reached 750 µg/g in the tolerant
strain exposed to 1 µg Cu/g, whereas in the sensitive strain they were
about 390 µg/g at the same exposure. In contrast, in the shoots of
these same plants exposed to 1 µg Cu/g the tolerant plants contained
18 µg Cu/g and the sensitive plants 10 µg Cu/g. Higher root than shoot
concentrations of copper are normal in terrestrial plants.
In contrast to the situation for aquatic biota, copper levels in
soils can vary over a wide range of concentrations and plant genetic
tolerances allow an equally wide range of responses to these copper
exposures. Copper levels in foliage can be below the soil
concentrations over which they grow or can be very much higher in
accumulator species.
4.2.6 Terrestrial invertebrates
Moser & Wieser (1979) fed snails (Helix pomatia) on a diet
containing 230 or 1390 mg Cu/kg for 3 weeks. Animals exposed during
the summer accumulated copper concentrations ranging from 76 mg/kg
(dry weight) (buccal mass and oesophagus) to 238 mg Cu/kg (intestine).
Copper contents of midgut gland and foot were 44.7 and 56.0 µg/kg (dry
weight) respectively. In snails exposed during the winter months much
higher concentrations were accumulated, ranging from 106 mg Cu/kg in
the buccal mass and oesophagus to 1621 mg Cu/kg in the intestine. In
short-term (2-10 days) feeding experiments with lettuce containing
1390 mg Cu/kg, about 97% of the metal ingested remained in the snail.
Berger & Dallinger (1989) fed terrestrial snails (Arianta arbustorum)
on copper-enriched agar at concentrations of 209 mg Cu/kg or 723 mg
Cu/kg (dry weight). The highest concentrations of copper following
exposure to the lower concentration for 21 days were in the midgut
(492 mg Cu/kg). The copper concentration of the faeces increased
continuously during the experiment but the highest value recorded at
69.5 mg Cu/kg was only one-third of the concentration in the food.
In a 14-day copper balance study utilizing the higher dose
(723 mg/kg) the mean rate of copper uptake was 6 µg/day. The main
site of copper storage seemed to be the foot/mantle tissues where 49%
of the ingested copper was found. The efficiency of copper
assimilation always exceeded 95%. Dallinger & Wieser (1984)
maintained snails (Helix pomatia) on a diet of lettuce enriched with
533.8 mg Cu/kg for 32 days. Copper contents of foot (0.579 g dry
weight), midgut gland (0.326 g dry weight) and posterior gland (0.057
g dry weight) were 90.1, 42.7 and 15.0 µg after 32 days; copper
contents in foot and midgut gland had fallen to 39.6 and 23.1 µg after
38-48 days on a "clean" diet. Copper was distributed more evenly in
the organs of the snail than the other metals investigated (lead, zinc
and cadmium); the midgut gland did not play such a dominant role in
the storage of copper.
Dallinger & Wieser (1977) exposed three species of isopods to
copper concentrations of 340 and 5200 mg/kg (dry weight) in food
(birch litter) for 14 days. When feeding on natural litter with a low
concentration (20 mg Cu/kg) all three species lost more copper through
their faeces than they ingested. When fed artificially enriched
litter the efficiency of assimilation increased, so that at the
highest concentration tested between 80% and 99% of the ingested
copper was assimilated. Isopods are capable of digesting even tightly
bound copper during one passage of food through the gut. However,
they are unable to resorb more copper than they lose unless the food
is enriched with soluble copper or the rate of food passage through
the gut is slowed down.
4.2.7 Terrestrial mammals
Dodds-Smith et al. (1992a) maintained shrews (Sorex araneus) on
a diet containing copper at an intake of 2.13 mg/day for 12 weeks.
Mean whole-body copper concentrations were 23.6 mg/kg (dry weight) in
males and 64.8 mg/kg in females; mean total body burden was 64.7 µg Cu
in males and 150.1 µg Cu in females. Mean copper concentrations were
31.0 and 23.4 mg/kg in kidneys of males and females, and 192.5 and
820.5 mg/kg in livers of males and females, respectively (Dodds-Smith
et al., 1992b).
5. ENVIRONMENTAL LEVELS AND HUMAN EXPOSURE
5.1 Environmental levels
There is a very large amount of information on the levels of
total copper in the various environmental compartments but little
information on speciation. Therefore, an attempt has been made to
summarize those values related to temporal or geographical trends,
polluted sites and known sources of copper.
The largest release of copper is to land; the major sources of
release are mining operations, agriculture, solid waste, and sludge
from sewage treatment works. Mining and milling contribute most of
the solid wastes. Copper is released to water as a result of
natural weathering of soil, discharges from industries and sewage
treatment plants, and from antifouling paints. Copper compounds may
also be intentionally applied to water to kill algae. Copper is
emitted to the air naturally from windblown dust and volcanoes;
however, anthropogenic sources contribute more to modern atmospheric
levels from activities such as primary copper smelters, ore processing
facilities and incineration (ATSDR, 1990).
5.1.1 Air
Hong et al. (1996) measured copper concentrations in Greenland
ice samples. The results revealed that anthropogenic sources of
atmospheric copper first occurred in the Bronze Age, and that peaks of
pollution occurred 2000 years ago due to the Romans and 900 years ago
due to the Sung dynasty in China, before rapidly rising over the last
century with some evidence of decline in recent years.
The concentrations of copper in air depend on the proximity of
the site to major sources such as smelters, power plants, and
incinerators. Average concentrations are in the range 5-50 ng Cu/m3
in rural areas and 30-200 ng Cu/m3 in urban locations (Nriagu,
1979b). Evans et al. (1984) reported on the US EPA's national
surveillance network for the years 1977, 1978 and 1979. Copper levels
in air were 133, 138 and 96 ng/m3, respectively, for urban samples
and 120, 179 and 76 ng/m3 for non-urban samples. In the study 10 769
urban and 1402 non-urban air samples collected for 24 h were analysed.
The maximum urban and non-urban copper concentrations were 4625 and
4003 ng/m3, respectively.
Atmospheric copper concentrations at the South Pole were found to
range from 25 to 64 pg/m3 with a mean value of 36 pg/m3 (Zoller et
al., 1974). Copper concentrations in Atlantic aerosols were collected
during 1980-1982. Mean concentrations ranged from 1.0 to 4.5 ng/m3
for the North Atlantic and from 0.29 to 0.31 ng/m3 for the South
Atlantic. In remote areas of the Atlantic, where the influence of
continental sources is less, oceanic copper can make up over half of
the total copper in the aerosol (Chester & Murphy, 1986).
Sweet et al. (1993) analysed airborne particulate matter in
southeast Chicago and East St Louis, USA. Copper concentrations
ranged from < 0.1 to 1610 ng/m3 in fine particles (< 1-2.5 µm), and
from < 0.1 to 224 ng/m3 in coarse particles (2.5-10 µm). Concen
trations were found to be higher in samples from St Louis; these
higher levels of copper in both fine and coarse fractions occurred in
winds from the direction of several nonferrous metal smelters.
Anderson et al. (1988) analysed atmospheric aerosols collected in
Chandler, Arizona, USA in 1982. Several major copper smelters are
located approximately 120 km southeast of the sampling point. The
most abundant copper-bearing particle (particles containing > 0.5%
copper), representing 74% of the total, was associated with sulfur,
16% was associated with silicon and 4% was associated with chloride.
Germani et al. (1981) reported that mean copper levels in particulate
matter were found to be 2800 and 6800 ng Cu/m3 in the plumes of two
copper smelters in Arizona, USA. Mean concentrations ranging from
2000 to 9500 ng Cu/m3 were reported for the first 8 km of plumes from
five copper smelters (Small et al., 1981). Atmospheric particulate
aerosol samples were collected at sites along the normal plume pathway
at distances ranging from 2.5 to 8.0 km from a copper smelter (western
Poland). Copper concentrations were inversely correlated to distance
with levels of 165, 89 and 51 ng Cu/m3 (2.6, 1.4 and 0.8 nmol/m3) at
distances of 2.5, 5.0 and 8.0 km, respectively (Zwozdziak et al.,
1985).
Romo-Kröger & Llona (1993) analysed aerosols in the Chilean
central Los Andes mountain range at varying distances from a copper
mine. Copper concentrations in fine (< 0.4 µm) particles ranged from
414 ng/m3 (5 km from the mine) to 22 ng/m3 at > 25 km from the
mine. A similar correlation between distance from the mine and copper
levels was found for coarse (> 8.0 µm) samples although levels were
lower, ranging from 40 to 101 ng Cu/m3. Romo-Kröger et al. (1994)
found that copper levels were related to mining operations. Sampling
at 13 km from the mine revealed copper concentrations of 66 and 131
ng/m3 for fine (< 2.5 µm) and coarse (2.5-15 µm) particles,
respectively, during mining operations. Sampling during strike
periods gave levels of 22 and 50 ng Cu/m3, respectively.
Johnson et al. (1987) reported elevated levels of copper in fog
water 3 km downwind of a refuse incinerator in Switzerland. Highest
copper concentrations were associated with lower pHs. The maximum
concentration was 673 µg Cu/litre (10.6 µmol/litre) at pH 1.94, with
levels > 127 µg Cu/litre being associated with pH values < 3.6.
The annual average concentrations of copper in aerosols < 10 µm
in the Netherlands varied between 11 and 25 ng/m3. None of the eight
sites was directly affected by industrial sources (Slooff et al.,
1989).
5.1.2 Water and sediment
Copper is widely distributed in water because it is a naturally
occurring element. Nriagu (1979b) reported average copper levels in
seawater ranging from 0.15 µg/litre in open ocean to 1.0 µg/litre in
polluted near-shore waters; levels in fresh water were 1.0-20
µg/litre. Other reports indicate that copper concentrations in
seawater are highly variable, ranging from 0.005 µg/litre in the Black
Sea (Haraldsson & Westerlund, 1988) to 40 µg/litre in estuaries in
southwest Spain (Cabrera et al., 1987). Additional variation in
copper concentrations is related to depth and the area in the ocean
examined. Surface concentration in the North Pacific Ocean drops from
0.1 µg Cu/litre (1.2 nmol/kg) in the California Current to 0.03-0.04
µg Cu/litre (0.4-0.5 nmol/kg) in the central oceanic region, and
increases to 0.24 µg Cu/litre (3 nmol/kg) in deep waters (Boyle et
al., 1977; Bruland, 1980). In the North Atlantic Ocean surface waters
display values of copper from 0.07 µg/litre (1.1 nmol/kg) to 0.11
µg/litre (1.7 nmol/kg), whereas concentration of the metal increases
to 0.13-0.26 µg/litre (2-4 nmol/kg) in deep waters (Moore, 1978).
Similarly, in the Ligurian Sea, Italy, Fabiano et al. (1988) reported
3.57-16.6 µg dissolved Cu/litre in the surface layer (0-50 m) and
0.7-2 µg/litre in deeper waters (200-2000 m). Bryan & Langston (1992)
reported dissolved copper concentrations of up to 600 µg/litre for
Restronguet creek, a branch of the Fal estuary, United Kingdom, which
receives acidic drainage from past and present mining activity.
Bubb & Lester (1994) found mean copper concentrations in total
and soluble (filter size 0.2 µm) river water for the river Stour,
United Kingdom, to be 5.8 (3.0-19.5) and 2.2 (1.0-5.5) µg/litre,
respectively. Background levels were 1.0 µg Cu/litre derived from an
upper catchment control site. Fourfold increases in copper
concentrations were apparent downstream of a sewage treatment works.
Dissolved copper was monitored for 11 months in four recreational
marinas, a large harbour, two major river systems and a heavily used
shipping canal in Chesapeake Bay, USA. Mean copper concentrations
were 9.1, 13.2, 17.8 and 18.2 µg/litre for the four marinas, 7.9
µg/litre for the harbour, 6.4 and 11.9 µg/litre for the two river
systems and 9.6 µg/litre for the shipping canal. Copper concentrations
ranged from < 10-80 µg/litre for the marinas to 10-14 µg/litre for
the harbour and 10-20 µg/litre for the river systems and the shipping
canal. The authors concluded that the likely source of the highest
copper concentrations was from antifouling paints used on boats in the
marinas (Hall et al., 1988). An evaluation of dissolved copper
concentrations at three sampling stations in 1989 showed that mean
concentrations from biweekly sampling for four months were 2.7, 7.8
and 10 µg Cu/litre. Copper concentrations decreased with distance from
marinas, and at all three stations were significantly lower in 1989
than in 1988 (Hall et al., 1992).
Parrish & Uchrin (1990) sampled Lakes Bay, near Atlantic City,
USA during the summer of 1986. Dry weather concentrations of copper
were found to be typical of those found in natural waters, but higher
levels were recorded during storm events. Significant amounts of
copper were found to originate from a major stormwater sewer which
discharges into the bay. Total copper in runoff from a car park near
Portland, Oregon, USA varied among different storm events over a wide
range of concentrations (< 2-33 µg/litre). Copper levels in a
detention pond ranged from 5 to 12 µg/litre. Copper was found to be
deposited in pond sediments in a small highly concentrated plume (up
to 130 mg/kg) extending from the runoff inlet pipe (Mesuere & Fish,
1989).
Hurley et al. (1996) measured the concentration of copper and
several other metals in 11 tributaries (rivers) feeding Lake Michigan,
USA using low-level techniques. They reported dissolved and total
copper concentrations ranging from 0.2 to 2.0 and 0.4 to 5.5 µg/litre,
respectively.
Shiller & Boyle (1987) measured dissolved concentrations of
copper in the lower Mississippi river, USA seven times. The
Mississippi was chosen because it is the most heavily industrialized
of the 10 largest rivers in the world. The authors concluded that the
levels of copper and several other metals do not appear to be
significantly higher than in several other less industrialized and
disturbed rivers. Dissolved copper concentrations ranged from 1.16 to
1.96 µg/litre. Samples from the Yangtze, Amazon and Orinoco rivers
were analysed for comparison. Dissolved concentrations of 1.24, 1.52
and 1.20 µg/litre were determined, similar to levels in the
Mississippi river.
Ouseph (1992) reported that dissolved and particulate copper
concentrations in the unpolluted zone of the river Periyar, India,
were 0.8-10.0 µg/litre and 48-140 mg/kg, respectively, in 1985-1986.
The Cochin estuary is subjected to various types of effluents from the
Eloor and Chitrapuzha industrial belts. Levels in the estuary ranged
from 2.2 to 22.2 µg/litre for dissolved copper and from 44 to 298
mg/kg for particulate copper. Copper concentrations showed high
seasonal variations, with the lowest levels being detected during the
monsoon season.
Filipek et al. (1987) found that dissolved copper concentrations
reflected the acidity of waters affected by acid mine drainage of West
Squaw Creek, California, USA. At pH > 5, copper concentrations were
generally below the detection limit (< 0.01 mg/litre). Dissolved
copper concentrations ranged from 0.12 to 13.5 µg/litre at pH 3-4, and
at pH 2.4 a concentration of 190 µg/litre was found. Håkansson et al.
(1989) found that the transfer of copper from the aqueous to the solid
particulate phase is significant at pH 3-3.5 and increases with pH.
Copper concentrations in suspended solids were 2.7, 2.0 and 0.5 mg/kg
at pH levels of 4.5, 5.4 and 6.5, respectively, in a drainage stream
for a mine waste deposit. Camusso et al. (1989) monitored seasonal
variations in copper in suspended particulate matter in the north
basin of the acidic (pH 4.4) Lake Orta, Italy, between 1985 and 1987.
Copper in the lake occurred mainly in the dissolved form (94%) and
levels are still high (32-34 µg/litre) because of past industrial
activity.
Sediment is an important sink and reservoir for copper.
Background levels of copper in natural river sediments range from 16
to 5000 mg/kg (dry weight) (Förstner & Wittmann, 1981). Copper levels
in marine sediments range from 2 to 740 mg/kg (dry weight) (Nriagu,
1979b). Bryan & Langston (1992) reported that sediment copper levels
in United Kingdom estuaries range from 10 to > 2000 mg/kg (dry
weight), the highest values being for Restronguet creek which receives
acidic drainage from mining activity. In the creek, adsorption of
most of the dissolved copper by flocculated oxides of iron and
associated humic substances during estuarine mixing leads to very high
sediment concentrations.
Bubb et al. (1991) found that copper loadings for fluvial
sediments from the river Yare, United Kingdom, ranged from 5 to 375
mg/kg. Levels displayed the profile of a pollution plume originating
from a point source. A peak located at 1-2 km from a sewage treatment
works outlet was recorded. Bubb & Lester (1994) found copper
concentrations at 24.2 and 39.0 mg/kg above and below a sewage
treatment works, respectively. Background levels from a control site
were 6.17 mg Cu/kg.
Palanques & Díaz (1994) found that the surface sediments of the
continental shelf off Barcelona, Spain, are greatly influenced by
anthropogenic contamination of heavy metals discharged by the littoral
sewers and the Besos river. Copper concentrations ranged from 300 to
400 mg/kg at the mouth of the Besos river and declined at increasing
distances from the shoreline.
A large gold and copper mining project began in 1984 on the Ok
Tedi river, a tributary of the Fly river, Papua New Guinea. Baker et
al. (1990) analysed suspended sediment samples from the Torres Strait
near the mouth of the Fly river system in 1989. Mean copper
concentrations ranged from 1.4 to 13.3 µg/kg. The highest levels of
copper were found at stations closest to the Fly river. Sediments of
the Ok Tedi river are enriched with copper. Approximately 60% of the
input has a particle size of < 100 µm and is transported as a
suspended load throughout the entire length of the river (> 1000 km).
Copper concentrations in the fraction < 2 µm reaches levels of 6000
mg/kg (Salomons & Eagle, 1990). Mean copper concentrations in the
surficial sediments of the Fly river delta and the Torres Strait were
28 and 8.2 mg/kg, respectively (Baker & Harris, 1991).
Copper contamination of sediment samples in northern Sweden was
correlated with distance from the Ronnskar smelter. Concentrations
ranged from 1556 mg Cu/kg at a distance of 3 km to 37 mg Cu/kg at 80
km (Johnson et al., 1992). Ünlü & Gümgüm (1993) analysed sediment
samples from the Tigris river, Turkey, in the vicinity of the Ergani
copper plant. Copper concentrations were 641 mg/kg 5 km upstream of
the plant, 3433 mg/kg at the outflow and around 900 mg/kg downstream.
5.1.3 Soil
Median total copper concentrations in uncontaminated soil were
reported to be 30 mg/kg (range 2-250 mg/kg) (Bowen, 1985). Shacklette
& Boerngen (1984) analysed soil samples from various locations in the
USA, finding that copper concentrations ranged from < 1 to 700 mg/kg
with an average of 25 mg/kg. Kabata-Pendias & Pendias (1984) reviewed
the worldwide literature on copper in uncontaminated surface soils and
report mean concentrations ranging from 6 to 80 mg Cu/kg (dry weight).
Much higher levels were associated with mining activity,
metal-processing industries and fertilizer and fungicide application.
Copper can accumulate in soils from the long-term application of
fertilizers or fungicides. Reuther & Smith (1952) analysed soils from
mature Florida citrus groves and found that copper oxide levels in the
topsoil increased with grove age. Copper oxide levels of 247 and 93
mg/kg (dry weight) were measured at depths of 0-8 cm and 8-15 cm,
respectively. At depths of > 15 cm copper oxide levels of æ 18 mg/kg
were measured. Copper oxide levels in adjacent untreated soil ranged
from 1 to 2 mg/kg. Christie & Beattie (1989) reported an accumulation
of copper in soil from the application of pig slurry (50-200 m3/ha
per year). EDTA-extractable copper concentrations of up to 85.2 mg/kg
were recorded; levels in control soils ranged from 4.4 to 5.4 mg/kg.
Paoletti et al. (1988) found that in Italy vineyard soil to which
copper-containing fungicide had been applied contained mean copper
concentrations of 89.8 mg/kg (dry weight). Soils from other locations
contained mean levels ranging from 44.0 to 52.1 mg/kg. Holmgren et
al. (1993) analysed surface soil samples from agricultural regions
throughout the USA. Copper concentrations ranged from 0.3 to 495
mg/kg (dry weight). Copper levels were higher in the organic soil
areas of Florida, Oregon and the Great Lakes, reflecting the use of
copper fertilizers and fungicides.
Fjeldstad et al. (1988) found that levels of copper in surface
peat showed a negative correlation with distance from a nickel
smelting factory in Kristiansand, Norway. Dumontet et al. (1990)
monitored copper in acidic peat located along two transects from a
smelter plant in the Noranda region of Quebec, Canada and found that
copper concentrations in surface samples (0-15 cm) ranged from 5525
mg/kg at a distance of 1 km to 28 mg/kg at 42.5 km. The majority of
the deposited copper remained in the upper 15 cm of the soil profile.
Soil samples taken in the vicinity of a copper smelter at Legnica in
southern Poland contained copper levels of 7400 mg/kg (Helios Rybicka
et al., 1994). Wu & Bradshaw (1972) reported that soil copper levels
in the vicinity of a metal refinery (southwest Lancashire, United
Kingdom) established in 1900 contained total copper concentrations
ranging from 1930 to 4830 mg/kg. Hunter et al. (1987a) reported mean
surface soil copper concentrations of 15.1, 543 and 11 000 mg/kg at a
control site, 1 km from a copper refinery (Merseyside, United Kingdom)
and at the refinery, respectively. Beyer et al. (1985) monitored
soils 10 km upwind and 2 km downwind of zinc smelters in eastern
Pennsylvania, USA. Copper concentrations ranged from 12 to 34 mg/kg
and from 9.9 to 440 mg/kg (dry weight) for the two sites,
respectively. Almost all of the copper contamination was held at the
surface of the mineral soil.
5.1.4 Biota
5.1.4.1 Aquatic
The levels of copper in marine algae vary from 0.64 µg/g in
Laminaria religiosa from Japan (Suzuki et al., 1987) to 407 µg/g in
Jania rubens from Antikyra Gulf, Greece (Malea et al., 1994). An
important source of variation in the copper content in algae is the
part of the plant analysed, generally being higher in older parts than
in fast growing, younger apices.
Freshwater mussels (Unio pictorum) in the area of a sailing
boat harbour (Lake Balaton, Hungary) contained significantly higher
levels of copper than those from open water areas. Mean gill and
adductor muscle copper concentrations were, respectively, 203 and 221
mg/kg (dry weight) in the harbour and < 20 mg/kg in open water
(V-Balogh, 1988). Batley et al. (1992) analysed Sydney rock oysters
(Saccostrea commercialis) from the Georges river, New South Wales,
Australia. Mean copper concentrations ranged from 12 to 95 mg/kg (wet
weight) in 1988 and from 19 to 89 mg/kg in 1991, and the authors state
that overall copper concentrations in oysters have fallen since the
banning of tributyltin. Claisse & Alzieu (1993) found an increase in
copper concentrations in oysters collected between 1979 and 1991 in
the bay of Arcachon, France. Annual mean copper concentrations have
increased from 48.3-81.1 mg/kg (dry weight) in 1979 to 74.6-135 mg/kg
in 1991. Data collected from 1977 to 1990 by the California mussel
watch programme were analysed for long-term trends in copper. Copper
showed a steady increase over time at 5 of the 20 sampling stations.
The authors suggest that the increases in copper may be related to
increased vessel traffic and the increased use of copolymer copper
antifouling paints (Stephenson & Leonard, 1994).
Rainbow et al. (1989) monitored the copper concentrations in
several species of talitrid amphipod at several sites in the United
Kingdom. Orchestia gammarellus was found to be the most suitable
biomonitor of copper in British coastal waters. Weeks (1992a) found
the talitrid amphipod Platorchetsia platensis to be a good indicator
species in Danish waters. Samples with significantly higher copper
burdens, for example, 110 mg Cu/kg (dry weight) compared to 32 mg
Cu/kg, were associated with local sources of metal enrichment, due to
anthropogenic inputs (antifouling paint leachates) or geological
conditions. Negligible quantities of copper were found in cast exuvia
of talitrid amphipods during the moult cycle (Weeks et al., 1992b).
Moore et al. (1991) found the beach-hopper (Orchestia gammarellus)
to be a very convenient and sensitive biomonitoring species for copper
levels along the North Sea coasts. Typical background concentrations
were approximately 70 mg Cu/kg (dry weight); samples with higher
concentrations (up to 218 mg Cu/kg) were associated with local sources
of contamination such as antifouling paints or the metal-rich
mineralogy.
Alikhan et al. (1990) measured the concentration of copper in
crayfish (Cambarus bartoni) trapped from increasing distances, up to
150 km from a nickel-copper smelter (Canada). Their results indicate
that the concentrations in the crayfish decreased with increasing
distance from the source; the highest concentration (1986 µg Cu/g) was
measured in the hepatopancreas.
Schmitt & Brumbaugh (1990) analysed freshwater fish from
throughout the USA in 1984-1985. A mean copper concentration of 0.65
mg/kg (wet weight) and a maximum copper level of 23.1 mg/kg were
recorded. No significant change in the mean concentration of copper
was found when compared with monitoring results from 1976.
Lee & Stuebing (1990) analysed liver tissue from river toads
(Bufo juxtasper) near a copper mine in east Malaysia. Mean copper
concentrations in toads downstream of the mine and from a control area
were 438 mg/kg (dry weight) and 46 mg/kg, respectively. Copper levels
of 117 and 273 mg/kg were recorded in toads collected from areas known
to be rich in minerals.
5.1.4.2 Terrestrial
Stewart et al. (1991) sampled tree ring wood from kahikatea trees
in urban Christchurch and the west coast of South Island, New Zealand.
For the urban ring wood cores copper levels showed an elevation over
baseline levels with an approximately threefold increase beginning
around 1940. This was probably due to increased industrial emissions.
Kalac et al. (1996) measured the concentrations of copper in
edible mushrooms in the vicinity of mercury and copper smelters in
eastern Slovakia. Copper concentrations up to 236 mg/kg and 231 mg/kg
(dry weight) were measured in Lepiota procera and Lepisia nuda,
respectively.
The metalliferous hillocks of the Shaba Province in southwest
Zaire have soil copper concentrations of up to 30 g/kg (Malaisse et
al., 1979). The region supports an extremely unusual endemic flora,
composed mainly of herbs and grasses, that can tolerate concentrations
of copper in excess of 1% in the soil. Terrestrial higher plants
which accumulate copper concentrations in excess of 1000 mg/kg (0.1%)
(dry matter) are known as "hyperaccumulators" (Brooks et al., 1977).
Brooks et al. (1980) reported hyperaccumulation of copper in 24 taxa
from the Shaban region. The most unusual of these is
Aeollanthus biformifolium which can contain as much as 13.7 g/kg
(1.37%) (dry weight) in the whole plant (Malaisse et al., 1978).
The first workers to present data indicating hyperaccumulation of
copper were Duvigneau & Denaeyer-De Smet (1963) who reported values of
1200, 1660 and 1960 mg Cu/kg (dry weight) for
Ascolepis metallorum, Silene cobalticola and
Haumaniastrum robertii, respectively.
The labiate (mint family) Becium homblei occurs on copper
deposits in Zaire, Zimbabwe and Zambia. Reilly (1967) and Reilly &
Reilly (1973) described B. homblei as a cuprophile, tolerant
to > 70 g Cu/kg (dry weight) in soil, and accumulating up to 17% of
copper in the leaves, organically bound to the cell walls. They also
noted that some other species of Becium in the same area had no
special ability to accumulate copper.
Hunter et al. (1987a) reported annual mean copper concentrations
in the dominant plant species growing near a metal refinery in the
United Kingdom (Agrostis stolonifera, Festuca rubra,
Equisetum arvense and Tussilago farfara). Mean copper
concentrations ranged from 7.6 to 18.6, 22.8 to 25.8 and 73.3 to 260
mg/kg (dry weight) at a control site, 1 km from a metal refinery and
at the refinery respectively. Vegetation levels of copper showed
marked seasonal variations at contaminated sites with peak values
during the winter months. The increased levels were due to a
combination of root absorption and accumulation of particles on
external leaf surfaces. Copper concentrations in grasshoppers
(Chorthippus brunneus) ranged from 37.5 mg/kg (dry weight) at a
control site to 380 mg/kg at the refinery (Hunter et al., 1987c).
Hunter et al. (1987b) analysed invertebrates from both contaminated
and semi-contaminated grasslands in the vicinity of a major copper
refinery. All species showed significant elevations of total body
copper concentrations relative to controls. Highest concentrations
were found in isopoda species. Detritivorous soil macrofauna showed
accumulation of copper (2-4 times) with respect to concentrations in
refinery site organic surface soil and plant litter. Herbivorous
invertebrates also showed body : diet concentration factors of 2-4
times for copper.
Ferns growing in the vicinity of ore smelters at Sudbury,
Ontario, Canada, contained copper concentrations ranging from 27.2 to
73.0 µg/g (dry weight). Plants collected from control sites contained
concentrations ranging from 7.4 to 11.5 mg Cu/kg (Burns & Parker,
1988). Analysis of lowbush blueberry (Vaccinium angustifolium) at
sampling sites ranging from 6.5 to 74 km from Sudbury smelting
operations revealed a significant relationship between copper
concentrations and distance from the smelter (Bagatto et al., 1993).
Alikhan (1993) analysed terrestrial isopods (Porcellio spinicornis)
2 km downwind of a primary smelting works (nickel) in Ontario, Canada.
Mean copper concentrations in the isopods were 1137 mg/kg (dry weight)
for the contaminated site and 685 mg/kg for a control site. Leaf
litter contained approximately 12 times more copper at the
contaminated site than at the control site.
Morgan & Morgan (1988) analysed earthworms (Lumbricus rubellus
and Dendrodrilus rubidus) from both contaminated (the vicinity of
disused nonferrous metalliferous mines) and noncontaminated sites in
Wales. There were significant positive correlations between total
copper concentrations in the earthworms and in the soil. Copper
concentrations in earthworms ranged from 8 and 9 mg/kg (dry weight) at
uncontaminated sites to 104 and 34 mg/kg at contaminated sites for the
two species.
Ash & Lee (1980) analysed earthworms from roadside verges in the
United Kingdom and found a relationship between traffic density and
copper burden. Mean copper concentrations ranged from 3.9 to 8.9
mg/kg (dry weight) for heavy traffic, 2.3 to 6.6 mg/kg for
intermediate traffic and 0.2 to 0.83 mg/kg for low levels of traffic.
However, for the more contaminated sites other industrial sources of
copper could not be ruled out.
Wieser et al. (1976) found two species of isopods
(Tracheoniscus rathkei and Oniscus asellus) to be good indicator
species for copper. Total copper concentrations in isopods ranged
from 74 mg/kg (dry weight) for a spruce forest to 538 mg/kg for an
overgrown slag heap of an old copper mine in the Tirol region of
Austria. Hopkin et al. (1993) proposed the isopod Porcellio scaber
as an ideal candidate for biomonitoring the bioavailability of metals
to soil and leaf litter invertebrates. The authors provide a table of
concentration ranges for this species related to degrees of
contamination. For example, isopod copper concentrations of < 250
mg/kg (dry weight) would be classified as uncontaminated with medium
contamination at 400-600 mg/kg and high contamination at 600-1000
mg/kg. Hopkin et al. (1986) analysed hepatopancreas and whole body of
woodlice (Porcellio scaber) collected from 89 sites in southwest
England. The main source of copper pollution was centred on
Avonmouth, the site of a primary zinc, lead and cadmium smelting
works. The correlation coefficients between the concentrations of
copper in woodlice and soil, and between woodlice and leaf litter,
were positive and statistically significant.
Rose & Parker (1983) reported concentrations of copper in tissues
of ruffed grouse from a site near a copper-nickel smelter and a
control, uncontaminated site near Sudbury, Ontario, Canada. Mean
copper concentrations in kidney, liver and breast muscle ranged from
11.7 to 24.6, 12.6 to 16.3 and 1.5 to 2.3 mg/kg (dry weight),
respectively. Their results indicate no difference between the two
sites.
Hunter & Johnson (1982) analysed small mammals in the vicinity of
a copper refinery in the United Kingdom. Liver concentrations were
significantly elevated at the refinery in wood mouse
(Apodemus sylvaticus) (23.7 mg Cu/kg dry weight) and common shrew
(Sorex araneus) (56.1 mg Cu/kg) but not in short-tailed vole
(Microtus agrestis) (13.5 mg Cu/kg). However, even these
significant accumulations were rather limited bearing in mind the soil
copper levels of 2000-3000 mg/kg (dry weight) at the refinery site.
At reference sites copper concentrations in whole-body samples of
small mammals ranged from 8 to 13 mg/kg (dry weight) (Smith &
Rongstad, 1982; Beyer et al., 1985).
5.2 General population exposure
5.2.1 Air
Pulmonary exposure occurs through the inhalation of dusts, fumes,
smoke and sprays that contain copper.
Exposure to copper by inhalation is determined by air
concentrations, particulate size and the respiratory rate.
Concentrations of copper determined in over 3800 samples of ambient
air at up to 29 sites in Canada over the period 1984-1993 averaged
0.014 µg/m3. The maximum value was 0.418 µg Cu/m3, detected in 66%
of samples (Dann, 1994). In the USA, air levels of copper vary
between 96 and 138 ng/m3 in urban samples and 76 and 176 ng/m3 in
non-urban settings (see section 5.1.1), though levels as high as 4629
ng/m3 have also been recorded.
Based on data collected in the province of Ontario, Canada,
copper levels in ambient air have decreased over 70% in the last 10
years, though some of this decrease is likely attributable to
variations in sampling and analytical methods (OMME, 1992).
Estimated mean intake, based on these data (22 m3 air/day)
(ICRP, 1974) and the mean Canadian values, are less than 0.28 µg/day.
5.2.2 Food and beverages
The actual concentration of copper in food and beverages from
various countries varies widely depending upon the food product, the
growing conditions (soil, use of fertilizers high in copper, water,
use of copper fungicides) and the type of processing used; in
particular, pH levels and the use of copper vessels (Tanner et al.,
1979; Muller et al., 1996).
In some countries, it has been customary to prepare milk by
boiling it in copper vessels. Levels of copper in such milk have been
reported as up to about 60 mg/litre (Muller et al., 1996). Studies
have shown that copper binds predominantly to casein, which is the
main constituent of milk protein. In acidic pH (as in gastric juice)
casein liberates most of this bound copper as a copper ion, making it
available for rapid absorption (O'Neill & Tanner, 1989). Calculations
reveal that whereas total breast feeding would supply up to 0.9 µmol
Cu/kg per day (60 µg/kg per day), feeding similar amounts of brassy
milk would supply up to 14.6 µmol Cu/kg per day (930 µg/kg per day) or
10-20 times the physiological intake per kg body weight per day.
Traditional "tinning" of copper and brass vessels protects from such
contamination by copper, yet it is a procedure often neglected because
of cost and effort.
Copper is widely distributed in foods, with organ meats (e.g.
liver) and seafood having the highest concentrations (10-100 mg/kg)
and dairy products having relatively low levels (Table 5). High
levels of copper have also been identified in wheat bran, beans and
seeds, based on a recent, detailed investigation (Jorhem & Sundstrom,
1993). Baseline values have been reported as 0.2-0.3 µg Cu/litre for
mother's milk and 0.7-1.1 µg Cu/kg for infant formula (Richmond et
al., 1993). Chocolate may contain more than 5 mg Cu/kg. Values
quoted for tea and coffee are highly variable but may exceed 10 mg
Cu/kg (dry weight) (Slooff et al., 1989; ATSDR, 1990). In general
most other foods contain much less than 10 mg Cu/kg.
Copper levels in common foodstuffs and beverages have been
determined in many countries, including the USA (Pennington et al.,
1986), Australia (NFA, 1992) and the Netherlands (Slooff et al.,
1989). Copper levels in representative foodstuffs in these three
countries are given in Table 5. From these market basket surveys,
average daily intakes have been calculated (Pennington et al., 1986,
1989; Slooff et al., 1989; NFA, 1992), or actual dietary surveys have
been conducted to determine the daily intake from food and beverages
(Pettersson & Sandström, 1995).
Representative mean total daily intakes of copper from foods and
beverages in several countries are given in Table 6. As shown, the
total daily intake of copper in adults varies between 0.9 and 2.2 mg.
Intake in children has been estimated to be 0.6-0.8 mg/day (0.07-0.1
mg/kg body weight per day).
In relation to the intake of copper in food, the WHO (1996) noted
the insufficiency of global data and concluded that:
"The scarcity of adequately planned studies is again evident,
with insufficient data from Africa, the Eastern Mediterranean and
South-East Asia. The apparently higher proportion of European
studies suggesting undesirably low population mean intakes of
copper needs to be investigated more closely to determine whether
it is a truly characteristic feature of diets of the eastern
German communities from which these particular samples were
drawn. Before it is concluded that intakes of copper are likely
to be reasonably adequate in the Americas, the western Pacific
fringe and the remainder of Europe, it must be strongly
emphasized that none of the surveys covered were representative
of those socially and nutritionally disadvantaged communities in
which food preferences lead to the consumption of diets providing
as little copper as those reported to induce clinical signs of
deficiency elsewhere" (WHO, 1996).
A summary of preliminary data from a global literature survey of
dietary intakes by IAEA has been published (WHO, 1996). When all the
IAEA data are considered, approximately 10% of reported mean intakes
are below the proposed minimum basal mean value for copper in adult
males (1.2 mg/day) and approximately 25% are below the corresponding
minimum normative mean population intake (1.4 mg/day). Intakes five
times higher than the basal minimum mean are observed in some
population groups, but these are still well below the upper limit of
the safe range of mean population intake (12 mg Cu/day for men) and
there is no evidence from the IAEA database that the copper intake
from diets for young children is sufficiently high to cause concern in
the communities studied.
5.2.3 Drinking-water
5.2.3.1 Organoleptic characteristics
The taste of copper in drinking-water has been described as
metallic, bitter and persistent. Taste thresholds have been reported
between 0.8 and 5 mg Cu/litre, depending on the purity of the water
(Cohen et al., 1960; Béguin-Bruhin et al., 1983). Concentrations of
copper greater than 5 mg/litre may render water unpalatable although
individuals can adapt to such levels (Scheinberg & Sternlieb, 1994).
Aesthetic considerations relating to copper levels in drinking-water
include blue or green staining of plumbing fixtures, hair and laundry.
5.2.3.2 Copper concentrations in drinking-water
Levels of copper in surface waters used for the production of
drinking-water are presented in section 5.1.2. Copper is also
introduced into drinking-water during distribution, owing to leaching
from plumbing fixtures and copper piping. Leaching is dependent upon
a number of factors, including pH, temperature, hardness, carbon
dioxide content of the water, the length of time in contact with the
pipe or fixture and the age of the piping (Schock & Neff, 1988; Alam &
Sadiq, 1989). Some of these factors cannot easily be controlled; in
particular, hard waters with high buffering capacity cannot have the
pH raised sufficiently to moderate copper solvency (Dieter et al.,
1991). It is thus insufficient to ascribe all problems of copper
solvency to soft, acidic waters with low buffering capacity and
nonadjusted pH.
In distributed water from 70 municipalities across Canada, median
concentrations of copper ranged from < 0.02 mg/litre to 0.75
mg/litre. In about 20% of the distributed water supplies, the level of
copper was significantly higher than the corresponding treated water
samples. Furthermore, the increase was higher in those areas where the
water was soft and corrosive (Meranger et al., 1979).
Table 5. Levels of copper in foodstuffs (mg/kg wet weight)a
Food stuff Mean Minimum Maximum n
Meat
beef 0.8, 1.1 0.74 1.6 39
pork 0.9, 1.4 0.44 7.22 150
lamb 1.6 1.1 1.9 24
Liver
beef 39 8.8 87 7
pork 9.0 0.9 29 126
lamb 97 28 195 32
Kidney
beef 3.7 2.8 4.2 6
pork 6.1 2.9 15 75
Fruit
apples 0.25 0.21 0.31 6
pears 0.81 0.48 2.7 24
bananas 0.95, 0.96 0.70 1.2 12
Vegetables
potatoes 0.72, 0.96 0.26 2.2 40
carrots 0.40, 0.61 0.26 0.95 30
lettuce 0.47, 0.72 0.20 1.4 40
tomatoes 0.36, 0.55 0.29 1.1 26
Fish
cod 0.19 0.12 0.28 5
tuna 0.64 0.48 0.80 9
Wheat
flour 1.5 0.95 2.9 56
bread (white) 1.5 0.89 2.2 32
Milk
cow 0.06 trace 0.14 31
human 0.54 0.22 0.90 28
Cocoa powder 36.4 33.0 410 9
a Adapted from Jorhem & Sundstrom (1993) for Sweden
and NFA (1993) for Australia
Table 6. Estimated average dietary intake of copper in various countries
Country Method of Intake of copper Reference
samplinga (mg/day)
Australia MB (adult male) 1.9 NFA (1992)
MB (adult female) 2.2
MB (2 years) 0.8
Denmark DD 1.2 Bro et al.
(1990)
Finland TDb 2.00 Kumpulainen
et al. (1987)
Germany DD 0.95 Anke (1991)
The Netherlandsc MB 1.5 Slooff et al.
(1989)
Norway DD 1.0 Pettersson &
Sandström
(1995)
Sweden MB 1.20 Becker &
Kumpulainen
(1991)
United Kingdom TD (adult male) 1.63 Gregory et al.
TD (adult female) 1.23 (1990)
TD (1.5-4.5 years) 0.5 Gregory et al.
(1995)
USAc MB (6-11 months) 0.47 Pennington
MB (2 years) 0.58 et al. (1986)
MB (adult male) 1.24
MB (adult female) 0.94
a MB = market basket survey; TD = total diet study;
DD = duplicate diet study
b Total diet from food record
c In calculations of dietary intake of copper the USA
and the Netherlands consider water as part of the diet
In the USA, 85% of fully flushed tap water samples had copper
levels below 0.06 mg/litre and 98% were below 0.46 mg/litre. Less than
1% exceeded 1 mg Cu/litre and the maximum level measured was 2.37 mg
Cu/litre (US EPA, 1991).
The difference between samples of running water and those where
water was standing for some time is evident from studies in several
countries. Murphy (1993) measured copper levels in drinking-water
fountains in 50 schools in New Jersey, USA. Median levels in
first-draw water (0.26 mg Cu/litre) decreased significantly after 10
min of flushing (0.068 mg Cu/litre), but increased by lunchtime to
0.12 mg Cu/litre after normal use of fountains. In Canada, copper
levels in running water from private wells were extremely low, but 53%
of the samples from standing water exceeded 1 mg Cu/litre (Maessen et
al., 1985). In a study in one US city (Seattle), mean copper levels
in running and standing water were reported as 0.16 and 0.45 mg/litre,
respectively, with 24% of standing water samples exceeding 1.0
mg/litre (Dangel, 1975). In the Netherlands, values between 0.2 and
3.8 mg Cu/litre were reported in water standing 16 h. This compares
to the level of 3.0 mg/litre in water standing 16 h, which is the
maximum permissible level for copper in drinking-water in the
Netherlands (Slooff et al., 1989). These same authors report average
copper levels between 0.04 and 0.69 mg/litre in other municipalities.
Pettersson & Sandström (1995) reported that in a study of 400
children aged 9-21 months the daily intake of copper from
drinking-water ranged between 0.01 and 3.2 mg, with a mean of 0.3 mg.
The study was conducted in two cities where it was suspected that
levels of copper in drinking-water were high. In these cities, the
mean copper levels in standing water were 0.7 mg/litre with a 90th
percentile of 2.1; in water for consumption, the mean was 0.6 mg/litre
with a 90th percentile of 1.6 mg/litre.
From the data available, and assuming a daily intake of
drinking-water of 1.4 litres (IPCS, 1994), daily intakes of copper
from drinking-water by adults will vary between less than 0.01 mg to
over a few mg per day, with highest intake in areas with corrosive
water using copper piping.
5.2.4 Miscellaneous exposures
In addition to airborne copper and copper in foods and beverages,
the general population may be exposed to this metal from a variety of
other sources. It is extremely difficult to quantify such exposures
and in most cases they make only a minor contribution to the daily
intake of copper by the general population when compared to the major
source of copper which is food and drinking-water (1-3 mg Cu/day).
Intake of dietary supplements containing copper will also contribute
to total exposure.
In a study of the metal content of tobacco, the copper content in
cigarette tobacco was found to vary between 9 and 66 µg Cu/g with a
mean value of 15.6 µg Cu/g (Mussalo-Rauhamaa et al., 1986).
Approximately 0.2% of this copper was detected in mainstream smoke
(about 0.05 µg Cu/cigarette). This would result in a daily exposure
of about 1 µg Cu from 20 cigarettes (Mussalo-Rauhamaa et al., 1986).
Dermal exposure to copper can result from the use of consumer
products containing copper pigments, through the use of copper as an
algicide in swimming pools and the use of copper jewellery. No
quantitative exposure levels could be found.
Excluding the use of copper IUDs, the use of copper in medical
applications has been replaced with other treatment regimens.
However, in rare cases, notably the treatment of burns with copper
sulfate, increased copper absorption has occurred with resulting
toxicities observed (Eldad et al., 1995). The use of copper IUDs may
result in exposure to as much as 80 µg Cu per day (Kjaer et al., 1993)
with decreasing levels after the first few weeks after insertion.
Copper is a component of many amalgams used in dentistry,
including mercury amalgams. The loss of copper from these sources has
been reported as minimal (Johansson & Moberg, 1991; Lussi et al.,
1992).
5.3 Occupational exposures
There is a wide range of industrial activities in which workers
can be exposed to copper and copper compounds. Copper exposures in
occupational settings are to particulates to which the metal or metal
compound is adsorbed or to metal fumes (aerosols).
In the mining industry, workers (miners and millers) are exposed
to dusts both from rocks and from the ore itself, containing 0.05-5%
of copper (Weant, 1985). Multiple exposures occur, as the ore may
contain high levels of nickel, arsenic and silica (McLaughlin et al.,
1992). Exposure to copper fumes and to a lesser extent dusts is a
feature of smelting operations but can occur through brassing,
welding, cutting or polishing of copper and brass and in joinery shops
where preserved woods are used. Other occupations in which exposures
to copper and compounds occur are agriculture (fungicides), wood
working, textiles, munitions and pyrotechnics, electrical, paint,
paper and tyre manufacturing (Fisher, 1992).
Very little published data could be found on copper
concentrations in air within occupational settings. Although dust and
fume levels may be measured regularly, they are normally reported in
terms of concentrations of other elements of greater toxicological
significance (e.g. arsenic, lead, acid mist). The bias towards
reporting these contaminants explains the difficulty of relating any
health effects noted in these environments to copper. Most countries
have set exposure standards for copper containing dust in the range
0.5-1 mg Cu/m3 and for copper fumes between 0.1 and 0.2 mg Cu/m3
(ILO, 1991).
Some sense of the relationship between air copper and serum
copper levels can be obtained from a study of copper milling and
sanding operations in which exposures were reported as 0.01 and 0.68
mg Cu/m3, respectively: plasma copper levels in these workers ranged
from 660 to 1260 µg Cu/litre, all below the upper level reported for
adults of 1300 µg Cu/litre (NIOSH, 1981a). In another study (NIOSH,
1981b), personal sampling of smelter workers in the blast and
converter furnaces and in the sampling area had a mean copper fume
concentration of 0.39 Cu/m3 with a range from 0.12 to 0.99 mg Cu/m3,
while personal samples for workers exposed to copper dust during the
cleaning of waste heat boilers and mertz furnace tear-down had average
exposures ranging from 1.2 to 17.6 mg Cu/m3. Serum copper values in
these workers were unrelated to occupational exposure levels.
Particle size distribution for the dust exposures were not given,
which may partly explain the lack of a relationship. Exposures during
welding of brassware ranged from 0.027 to 0.89 µg Cu/m3 with a mean
of 0.36 µg Cu/m3 (Rastogi et al., 1992).
5.4 Total human intake of copper from all environmental pathways
For healthy, non-occupationally-exposed humans the major route of
exposure to copper is oral. As shown in Table 6, the total daily
intake of copper in adults ranges between 0.9 and 2.2 mg. A majority
of studies have found intakes to be at the lower end of that range.
The variation reflects different dietary habits as well as different
agricultural and food processing practices used worldwide. In some
cases, drinking-water may make a substantial additional contribution
to the total daily intake of copper, particularly in households where
corrosive waters have stood in copper pipes. In areas without copper
piping copper intake from drinking-water will seldom exceed 0.1
mg/day, although intakes greater than a few mg per day can result from
corrosive water distributed through copper pipes. In general, total
daily oral intakes of copper will be between 1 and 2 mg/day, although
they may occasionally exceed 5 mg/day.
All other intakes of copper (inhalation and dermal) are
insignificant in comparison to the oral route. Inhalation adds
0.3-2.0 µg/day from dusts and smoke. Even women using copper IUDs
will be exposed to only 80 µg or less of copper per day in addition to
their oral intake of between 1 and 3 mg.
6. KINETICS AND METABOLISM IN LABORATORY ANIMALS AND HUMANS
Copper is an essential trace element involved in a variety of
critical metabolic processes. However, as with other essential trace
elements such as iron and zinc, excessive exposure may be toxic. All
mammals have metabolic mechanisms that maintain homoeostasis (a
balance between metabolic requirements and prevention against toxic
accumulation). Special populations with genetic defects or
abnormalities in the metabolism of copper may be sensitive to levels
of exposure that are nontoxic to persons without these defects. This
chapter provides an overview of the metabolic mechanisms that provide
copper homoeostasis in mammalian systems.
An organism, or cells within an organism, will seek to maintain
copper levels within a range that avoids both deficiency and excess.
The mechanisms for absorption and storage of copper are relatively
little studied but include biological chelators, specific receptors,
sequestering peptides and proteins and uptake pumps. Likewise, the
defence mechanisms to prevent or limit copper toxicity include
extracellular chelators, sequestering peptides and proteins, export
pumps and disposal of the metal into vesicles. Many of the peptides
and proteins that are involved in these events have been characterized
and their metabolic roles investigated. The regulation of copper
metabolism is not fully understood, although a great deal is being
learned from simple model systems.
Critical to the metabolism of copper is the chemical behaviour of
the element and its complexes because this behaviour controls its
interaction with other elements in processes such as absorption,
transport, distribution and toxicity. The general metabolism of
copper is described in the following sections. The bulk of the
studies related here are derived from animal and other model systems.
Where appropriate, sections will highlight human studies.
6.1 Essentiality
The essentiality of copper was not recognized until 1928 when
Hart et al. (1928) showed copper to be essential for erythropoiesis in
rats fed a milk-based diet. He was able to correct the anaemia by the
addition to the diet of ash from animal or vegetable sources. He went
on to demonstrate that the hydrogen sulfide precipitate from the ash,
containing copper sulfide, was responsible for the recovery. Similar
findings in humans established the basis for essentiality (Mills,
1930; Josephs, 1931).
Copper is also essential for the utilization of iron in the
formation of haemoglobin (Friberg et al., 1979) and in the maturation
of neutrophils (Percival, 1995).
The essentiality of copper arises from its specific incorporation
into a large number of enzymatic and structural proteins. The role of
copper in oxidation/reduction enzyme activities is a consequence of
its ability to function as an electron transfer intermediate. Thus
copper is present in enzymes involved in cellular respiration, free
radical defence, neurotransmitter function, connective tissue
biosynthesis and cellular iron metabolism. In some of them, copper is
required as a cofactor, e.g. superoxidase dismutase 1 (SOD1),
cytochrome oxidase and ceruloplasmin. Moreover, the oxidase
activities of ceruloplasmin and SOD1 have been shown to specifically
require copper. In other cases, copper appears to be involved as an
allosteric component of enzymes, conferring an appropriate structure
for their catalytic activity. No other element can substitute into
these proteins to provide the redox properties that copper provides.
These enzymes serve critical functions in their respective organisms
(Hartmann & Evenson, 1992; Linder & Hazegh-Azam, 1996). An
illustrative selected list of the enzymes that rely on the redox
properties of copper for catalysis is shown in Table 7.
Copper plays an important role in the activation and repression
of gene transcription. Studies of copper-regulated transcription in
yeast have advanced the identification of the mechanisms of action of
copper-regulated transcription factors in eukaryotes. ACE1 (Dameron
et al., 1991) and AMT (Zhou & Theil, 1991) are homologous copper-DNA
binding proteins that regulate the synthesis of the metallothionein
message through specific fungal promoter elements in, respectively,
Saccharomyces cerevisiae and C. glabrata. The S. cerevisiae SOD
is also regulated by ACE1 (Gralla et al., 1991; Carry et al., 1991).
Metal responsive elements (MREs), 13-15 base pair repeats, have been
found in the metallothionein promoters of all higher eukaryotes, but
the metal-regulated transcription factors have not been characterized.
Mac1 has been found to regulate the transcription of FRE1 (encoding a
plama membrane protein associated with both Cu(II) and Fe(III)
reduction) and CTT1 (encoding the cytosolic catalase) (Jungmann et
al., 1993).
Despite the obvious differences in physical form, at a
metabolic/biochemical level animals have very similar molecular
requirements for copper. The deficiencies, therefore, are very
similar to those described for copper deficiencies in humans. The
copper-dependent enzyme lysyl oxidase, for instance, has been
associated with connective tissue disorders involving cardiovascular
lesions, bone formation and eggshell development. Cardiovascular
lesions associated with copper deficiencies have been found in mice
(Rowe et al., 1977), rats (Petering et al., 1986), rabbits (Hunt &
Carlton, 1965; Hunt et al., 1970), pigs (Ganezer et al., 1976;
Schoenemann et al., 1990), and cattle (Mills et al., 1976). In
chickens and mice the lesions have been linked to decreases in lysyl
oxidase (Rowe et al., 1977). Similarly rats (Alfaro & Heaton, 1973),
cattle (Mills et al., 1976) and chicks (Rucker et al., 1969) manifest
bone formation defects in copper deficiencies. Copper-deficient hens
lay eggs with weak or no shells as a result of the failure of lysyl
oxidase in the oviduct (Harris et al., 1980). Animals also show
evidence of hair discolouration and brittleness and flaccid skin, as
seen in humans (Blakley & Hamilton, 1985).
Table 7. Copper metalloenzymes and proteinsa
Enzyme Function
Amino acid oxidase amino acid metabolism
Ascorbate oxidase terminal oxidase in plants
Azurin electron transfer
Benzylamine oxidase oxidation of amines
Ceramide galactosyl transferase myelin synthesis
Ceruloplasmin copper transport, oxidation
Cytochrome c oxidase terminal oxidase in animals
Diamine oxidase amine metabolism
Dopamine-ß-hydroxylase norepinephrine (noradrenalin) synthesis
Galactose oxidase carbohydrate metabolism
Haemerythrin oxygen transport
Haemocyanin oxygen transport
Indole 2,3-dioxygenase amine metabolism
Laccase terminal oxidase, plants
Lysyl oxidase collagen, elastin cross-linking
Plastocyanin electron transfer in plants
Polyphenyl oxidase quinone biosynthesis
Prostaglandin reductase prostaglandin biosynthesis
Rusticyanin electron transfer in fungi
Stellacyanin electron transfer in fungi
Superoxide dismutase superoxide radical destruction, dismutation
Tyrosinase amino acid metabolism, pigment formation
Uricase nucleic acid metabolism
Spermine oxidase amine metabolism
Tryptophan 2,3-dioxygenase amino acid metabolism
Monoamine oxidasea neurotransmitter synthesis
a Linder & Hazegh-Azam (1996)
6.2 Homoeostasis
6.2.1 Cellular basis of homoeostasis
An interpretation of the intracellular homoeostasis of copper in
an human hepatocyte (the pathway and regulation of the importation,
utilization, detoxification and export of copper) is illustrated in
Fig. 1. Copper itself has a major role in the regulation of the
mechanisms that control its cellular homoeostasis.
Copper as Cu(II) entering into hepatocytes is initially reduced
and complexed by glutathione, prior to binding and induction of
metallothionein (Freedman, 1989). Alternatively, copper entering the
cell may be exported by a copper ATPase translocase.
Metallothionein, the main intracellular copper-binding protein,
is a protein with 62 amino acids and two domains, rich in cysteine
(30%), which can bind up to 12 Cu(I) atoms. The metallothioneins are
involved in the detoxification and possibly storage of excess copper
(Bremner, 1987). All metallothioneins are transcriptionally regulated
by metals, except two newly isolated metallothioneins that may have
specialized functions (Hammer, 1986; Palmiter, 1993; Palmiter et al.,
1993). A wide variety of metals have been shown to induce the
synthesis of metallothioneins. The mammalian transcription factor is
a complex of proteins activated by a wide range of metals (Palmiter,
1993). When copper binds to the transcription factor complex, its
affinity for metal regulatory elements in the promoter of the
metallothionein gene is enhanced. The resulting increased level of
metallothionein sequesters the excess copper, preventing toxicity.
Copper ions are exported from liver cells by a P-type copper ATP
translocase (Cox, 1995). The copper translocases in liver are located
in the Golgi, endoplasmic reticulum and plasma membrane and are
responsible for copper transport. A mutation of this gene is
responsible for Wilson disease. Copper is poorly incorporated into
ceruloplasmin when the translocase is defective (Cox, 1995). Metal
ions are also sequestered into lysosomes, especially in conditions of
copper overload (Mohan et al., 1995).
6.2.2 Absorption in animals and humans
Foods rather than water contribute virtually all of the copper
consumed, and the copper content of different foods varies
considerably. Absorption of copper occurs primarily through the
gastrointestinal tract although small amounts can be incorporated
through inhalation and skin contact. The intestinal absorption
process is affected by numerous physiological and dietary factors as
described in section 6.4.
Radioisotope studies in experimental animals suggest that copper
is absorbed from the stomach to some extent, but that the major site
of absorption is the duodenum (Van Campen & Mitchell, 1965). The pH
of the stomach is such that many weak copper complexes will
dissociate. Enzymatic degradation of proteins and dietary fibres
should also make the metal more available. It also appears likely
that low molecular weight substances (e.g. amino acids) in
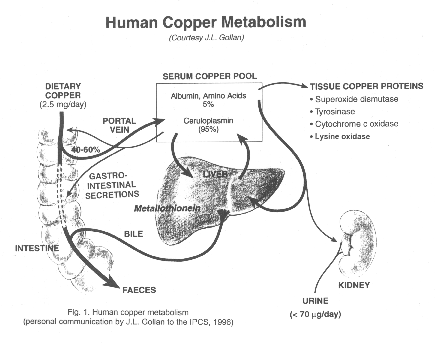 gastrointestinal secretions such as saliva, gastric and pancreatic
juice, bind copper and thereby maintain the metal in solution in the
alkaline milieu of the upper small intestine (Gollan & Dellor, 1973).
Moreover, it has been suggested that copper is primarily absorbed in
the form of amino acid complexes (Marceau et al., 1970). Limited
absorption of copper also occurs at the distal part of the small
intestine. Absorption of copper across the brush border into the cells
of the intestinal mucosa and its subsequent transfer across the
basolateral membrane into interstitial fluid and blood occur by
different mechanisms. Transfer across the mucosal barrier probably
occurs by non-energy-dependent diffusion. With the levels of copper
normally ingested, transfer of copper across the basolateral membrane
appears to be rate-limiting and is mediated by a saturable,
energy-dependent mechanism. At higher intakes, additional diffusional
or carrier-mediated systems in the basolateral membrane come into
play, and it seems likely that these are the sites where competition
for absorption between copper and other transition metal ions takes
place (Linder, 1991).
Turnlund et al. (1989) have used stable isotope methodology to
study copper absorption in adults. Diets were labelled extrinsically
with 65Cu and isotope mass ratios were analysed in the diets and
stools by thermal ionization mass spectrometry. Copper absorption was
dependent on the amount of copper in the diet; when a low copper diet
(0.78 mg Cu/day) was given, absorption was 55.6%, whereas it was 36.3%
from the same diet with copper added to an adequate level (1.68 mg
Cu/day) and 12.4% from the same diet but with high copper content
(7.53 mg Cu/day). Thus, it appears that copper absorption in adults is
saturable and that the percentage absorbed decreases with the level of
dietary copper. However, total retention of copper increased with the
level of dietary copper. Balances were positive even at the lower
copper level studied, suggesting that copper intakes of approximately
0.8 mg/day are adequate to sustain balance.
Early balance studies in preterm infants by Cavell & Widdowson
(1964) and Dauncey et al. (1977) showed negative balances of copper
for several months after birth. Most of the copper was found in the
stool, suggesting ineffective absorption or poor retention mechanisms.
Negative copper balance was also found in 40% of infants studied by
Tyrala (1986) despite feeding a formula with a copper concentration of
2.1 mg/litre. More recent studies in "healthy" preterm infants fed
modern artificial formula or unpasteurized human milk using combined
chemical balance and stable isotope tracer (65Cu) determinations
indicate that they absorb sufficient copper to meet the requirements
imposed by growth. Twelve infants fed preterm human milk absorbed
40-60% of intake while 33 receiving premature formula absorbed only
15%. The absolute retention of copper in infants fed human milk (40-50
µg/kg per day) approached the expected retention based on in utero
accretion data. This study demonstrates that infants respond to a
higher copper intake in a similar way to adults, by increasing fecal
losses and decreasing percentage absorption (Ehrenkrnaz et al., 1989).
A portion of the absorbed copper is lost during the turnover of
the intestinal cells and is subsequently lost in the faeces. Copper
absorbed into the intestinal endothelial cells can be sequestered by
metallothionein or may pass into the portal circulation.
Metallothionein may be an intermediate through which all or part of
the absorbed copper passes in route to the circulation (Felix et al.,
1990). Most of the copper transfer across the serosal membrane appears
to be done by the copper translocase. This mechanism operates in
animals and humans, and homologous proteins have been identified in
yeasts (Rad et al., 1994) and bacteria (Odermatt et al., 1993; Solioz
et al., 1994). Intestinal metallothionein may be acting as a
temporary metal-storage protein and be involved in the detoxification
of excess copper.
Pulmonary absorption occurs through the inhalation of dusts,
fumes, smoke and sprays. Persistent exposure to copper in sprays,
such as Bordeaux mixture, can lead to increased absorption and
accumulation (Pimentel & Marques, 1969; Pimentel & Menezes, 1975;
Viren & Silvers, 1994).
Topical use of copper compounds, as treatment for or prevention
of microbial infections, can lead to increased copper absorption
(Eldad et al., 1995).
6.2.3 Transport, distribution and storage
The liver is the major organ for the distribution of copper in
mammals. The liver sequesters the newly absorbed copper, routing it
through the blood to other tissues (Owen, 1965; Evans, 1973; Marceau &
Aspin, 1973a; Sternlieb, 1980). In blood, copper is distributed into
a nonexchangeable red cell pool, a plasma pool associated with
proteins, and a labile pool of low molecular weight complexes. In
humans, approximately 80-90% of the plasma copper is tightly bound
ceruloplasmin while the rest is bound to albumin and amino acids.
In rats, ingested copper (64Cu) appears first in the blood
complexed to albumin; a small portion of newly absorbed copper was
later shown to complex with amino acids in the serum (Neumann &
Sass-Kortsak, 1967). Albumin is a 68 kDa protein, found in serum and
in the interstitial spaces, which has copper binding sites.
Approximately 50% of the copper in whole blood is in erythrocyte SOD
and small peptide complexes. Erythrocyte copper does not play a role
in the transport of newly absorbed copper from the gut to the liver
(Gubler et al., 1953). Ceruloplasmin does not have a role in transport
of copper from gut to the liver, which is principally carried out by
albumin and amino acid complexes. Recently in vivo NMR analysis of
whole blood has confirmed in humans that copper in the portal
circulation is bound to albumin (Bligh et al., 1992) adding weight to
the earlier studies (Bearn & Kunkel, 1964).
Transport from the liver to peripheral tissues is one of the most
widely debated issues in the field of copper metabolism, but it is
thought to involve ceruloplasmin, albumin, transcuprien or amino
acids. Metallothionein has been suggested to play an important role
in the transport of copper in fetal blood. Its concentration is
elevated in the plasma and there appears to be little copper bound to
ceruloplasmin and albumin (Bremner, 1987). The proposal that
metallothionein is involved in the fetal copper transport has been
questioned, as mouse mutants lacking metallothionein develop normally
(Michalska & Choo, 1993; Masters et al., 1994).
Transport of copper from the liver to the peripheral tissues is
presumed to require either ceruloplasmin or serum albumin. The
available studies can neither exclude or prove the possibility that
one of these proteins is an obligatory copper transporter (Linder et
al., 1998). The peripheral tissues of humans with little or no
ceruloplasmin are not copper deficient (Frommer, 1981). Radioisotope
studies (Owen, 1965; Marceau & Aspin, 1973a,b), in which an isotope of
copper (64Cu or 67Cu) is used to trace the transfer of copper from
one metabolic pool to another, are more supportive of ceruloplasmin's
role in copper transport. Its role is also supported by nutritional
studies (DiSilvestro & Harris, 1981; Harris & DiSilvestro, 1981) and
combined isotopic and nutritional studies (Dameron & Harris, 1987a,b;
Percival & Harris, 1990, 1991; Steinkuhler et al., 1991). The
conflicting observations could be reconciled if there is redundancy in
the transport process, as might be expected for a critical process
like the delivery of copper.
Receptors for ceruloplasmin have been tentatively identified in
the plasma membrane fractions of chick aorta and heart (Stevens et
al., 1984), rat erythrocytes (Stern & Frieden, 1993), rat liver
(Kataoka & Tavassoli, 1984; Tavassoli et al., 1986; Omoto & Tavassoli,
1990) and rat brain (Mash et al., 1990). Membrane receptors for
ceruloplasmin have also been described in human erythrocytes (Barnes &
Frieden, 1984) and leukocytes (Kataoka & Tavassoli, 1985), and K562
cells (Percival & Harris, 1988, 1990). The studies by Percival &
Harris (1990) imply that the copper may be removed from ceruloplasmin
after reduction and that the protein may not be internalized.
A carrier-mediated facilitated diffusion system for uptake of
copper complexes, amino acids and small peptides, into rat
hypothalamus has been identified (Hartter & Barnea, 1988). The system
has a broad ligand specificity with respect to amino acids (histidine,
cysteine, threonine, glycine) and polypeptides (Gly-His-Lys,
glutathione) but will not transport albumin-bound copper.
Absorbed copper is primarily incorporated into the soluble
fraction of the liver and is associated with three main liver
fractions in the cytosol: a high molecular weight pool that has not
been completely identified, a 30 000 kDa pool which appears to be SOD
and a 10 000 kDa pool composed mostly of metallothionein. In chicks
and other animals, newly absorbed copper appears to be initially
incorporated into SOD and metallothionein (Balthrop et al., 1982), the
amount incorporated into each varying with the amount of copper
absorbed and the route of administration (Prins & van den Hamer,
1981). Some of the copper that enters the liver is not retained in or
does not enter the protein fractions and is instead excreted through
the bile. Copper bound to metallothionein may be targeted for
excretion through the bile, but may be used in the synthesis of other
copper proteins (Bremner, 1987). The role of metallothionein in the
cellular detoxification of copper, and possible roles for this protein
in the uptake, storage and transport of copper, have been reviewed by
Bremner (1987).
The liver synthesizes and regulates the plasma levels of
ceruloplasmin, the major copper-binding protein in serum and
cerebrospinal fluid. Some other tissues also synthesize
ceruloplasmin, or isoforms produced from alternative splice sites
(Yang et al., 1990).
Ceruloplasmin (ferroxidase) is a 160 kDa, blue, heavily
glycosylated, alpha2-globulin, with 6-8 tightly bound Cu(II) atoms
(Owen, 1982). It is an acute-phase plasma protein, increasing in
concentration in a variety of non-specific diseases. It also has
ferroxidase activity and facilitates the oxidation of Fe2+ to Fe3+
(Frieden & Hsieh, 1976).
Copper-deficient diets lower total liver copper, metallothionein
copper (Balthrop, 1982), and copper-zinc SOD activity (Dreosti &
Record, 1978; Bettger et al., 1978). Synthesis of fully active
ceruloplasmin by the liver is decreased or eliminated in
copper-deficient animals (Owen, 1965; Harris & DiSilvestro, 1981) and
in humans with Wilson disease. In contrast, deficient diets can lower
the copper enzyme levels in some tissues even when the tissue copper
level is constant. Aortic lysyl oxidase, an extracellular enzyme,
decreases in chicks on a copper-deficient diet (Harris et al., 1974),
even though the tissue copper level does not decrease (Balthrop et
al., 1982).
Copper balance and tissue distribution in typical adult humans is
summarized in Fig. 1. Liver copper content accounts for close to 20%;
this is the only true storage site that can be mobilized in case of
negative copper balance. Muscle accounts for nearly 40% of total body
copper and brain close to 20%. Connective tissue, blood and kidney
each accounts for 8%.
The fetus is fully dependent on copper uptake from the maternal
circulation. The transport of copper through the placenta is mediated
by a specific carrier copper transport from ceruloplasmin (McArdle &
Erlich, 1991; Lee et al., 1993). Other copper-binding complexes such
as albumin, or histidine-bound copper, can also contribute to the
fetal supply (Wirth & Linder, 1985). The fetus accumulates copper at a
mean rate of close to 50 µg/kg per day, principally over the later
half of pregnancy; over half of the copper is stored in the liver,
mainly in the form of metallothionein (Widdowson et al., 1974). The
increase in fetal liver store is due to both increased liver size and
higher concentration per unit of liver weight. The brain is the second
site for copper in fetal life; by the end of gestation the fetus will
have accumulated close to 15 mg of copper, of which 9 mg will be in
the liver. After birth the concentration of copper in the liver drops
during the initial months of life, reaching adult levels by 6 months.
Copper saturation of metallothionein is high during the first 6 months
of life (up to 50%), dropping quickly thereafter (Klein et al., 1991).
Biliary secretion is extremely low in utero and rises progressively
postnatally.
Pregnancy is associated with increase copper retention: this may
be due in part to decreased biliary excretion induced by hormonal
changes typical of pregnancy. Serum copper and ceruloplasmin rise
significantly during the last trimester (McArdle, 1995). Maternal
plasma copper concentrations during the latter half of gestation are
5-7 times higher than levels measured in the cord blood.
6.2.4 Excretion
Bile constitutes the major route of excretion of liver copper in
mammals, and thus represents the most important homoeostatic mechanism
determining the hepatocellular levels of the metal (Cousins, 1985;
Winge & Mehra, 1990). Approximately 80% of the copper leaving the
liver is excreted via the bile (Winge & Mehra, 1990). The urinary
excretion of copper is quantitatively unimportant and only 30-60 µg of
copper is eliminated through this route per day in adult human
(Harris, 1991).
Several pathways have been proposed to explain copper transport
into the bile (Kressner et al., 1984). Kinetic studies using
radioisotopes of copper have revealed that the intracellular source of
copper to be excreted in the bile is in a different compartment from
the copper destined for incorporation into ceruloplasmin (Dunn et al.,
1991). The existence of at least two transcellular pathways via the
hepatocytes has been proposed. Copper transport into bile takes place
in association with the biliary excretion of glutathione (Freedman et
al., 1989). It has been suggested that glutathione is involved in the
final step of copper excretion from the hepatocyte into the bile
(Alexander & Aaseth, 1980). The coordinated release of copper and
lysosomal enzymes into the bile of normal and copper-loaded rats
suggests that biliary copper may be largely derived from lysosomes
(Gross et al., 1989) and thus biliary copper excretion may be related
also to the hepatocellular content of metallothionein.
Copper is found bound to a range of unidentified components of
both high and low molecular weight, which may consist of protein,
micelles, bile salts, peptides and amino acids, depending on the
species and on the degree of copper loading (Bremner, 1987). However,
none of the major forms can be related to copper complexes identified
in the liver, although small amounts of ceruloplasmin, metallothionein
and glutathione or their degradation products may be present (Sato &
Bremner, 1984; Bremner et al., 1987).
In rats, net biliary copper excretion is relatively low in the
first week of life and is independent of metallothionein and
glutathione secretion. Excretion increases significantly as
glutathione output increases (Mohan et al., 1995). Studies with human
hepatic and gallbladder bile have documented the presence of a major
high molecular weight glycoprotein, which avidly binds copper (Gollan
& Dellor, 1973). A low molecular weight component(s) is also present
in both rat and human bile (Gollan & Dellor, 1973). Both the high and
low molecular weight components await characterization. Copper bound
to the macromolecular component in bile undergoes minimal intestinal
reabsorption. Thus, biliary copper does not appear to undergo
significant enterohepatic circulation (Gollan & Dellor, 1973), with
most being recovered in the faeces (Winge & Mehra, 1990).
In sheep, biliary excretion of copper does not represent the
major elimination pathway. However, this route of copper excretion can
be enhanced by the administration of tetrathiomolybdate (Winge &
Mehra, 1990). In addition to an elevation in biliary excretion of
copper, the hepatic copper levels are also reduced in treated sheep
(Gooneratne et al., 1989). The limited biliary excretion of copper in
sheep may partly account for the susceptibility of sheep to
copper-associated toxicity (Winge & Mehra, 1990).
Animals that tolerate copper well exhibit an enhanced biliary
excretion of copper. Copper-loaded rats, with hepatic copper levels
up to 8-fold greater than controls, have shown a 10-fold increase in
biliary copper output (Gross et al., 1989). Biliary obstruction
induced by deliberate ligation or pathological lesions, or due to a
particular metabolic state of the animal, leads to significant hepatic
copper retention as well as some increase in urinary copper excretion
(Gross et al., 1989). Retention of hepatic copper also occurs in
pregnant rats correlating with diminishing biliary excretion (Winge &
Mehra, 1990).
At least three genetic disorders associated with defective
hepatobiliary copper transport and accumulation of copper in the liver
have been described: Wilson disease (hepatolenticular degeneration) in
human and copper toxicosis in Bedlington terriers and Long-Evans
cinnamon rats (Sternlieb, 1980; Schilsky & Sternlieb, 1993; Mori et
al., 1994). These disorders are characterized by a decreased biliary
copper excretion, but differ from each other in the hepatic
distribution of the retained copper.
Minimal amounts of copper are lost in human sweat. The loss is
not believed to be sufficient to disturb the normal copper balance
(Turnlund et al., 1990).
6.3 Methods of studying homoeostasis
The purpose of this section is to highlight appropriate clinical
and biochemical methods that can be used to assess the copper status
of laboratory animals and humans. The goal is not to provide a
compendium of methods and analytical techniques but to offer an
overview of how to conduct these studies.
6.3.1 Analytical methods
A detailed discussion of analytical methods for the determination
of copper in solids and dilute liquids is given in chapter 2 of this
monograph and in WHO (1996). In general, solid samples require an
acid digestion prior to flame AAS. Low concentration samples require
more sensitive methods such as GF-AAS. Radioactive copper isotopes
64Cu and 67Cu (chapter 2) have been widely used in experimental
animals and cell culture studies to follow the uptake and distribution
of the metal (Petris et al., 1996). The short half-lives of these
isotopes and safety considerations make them less suitable for human
studies. The stable isotope 65Cu is now widely available and
relatively inexpensive. Determination of the enrichment of the
65Cu/63Cu ratio in human body fluids and excreta after a bolus dose
of 65Cu can be measured either by thermal ionization mass
spectrometry (TIMS) (Turnlund et al., 1989) or by ICP-MS (Lyon & Fell,
1990; Lyon et al., 1995, 1996).
6.3.2 Intake
The principle purpose of dietary intake analysis is to determine
the adequacy of copper supply and bioavailability for the general
population or sub-populations. Dietary analysis requires the
determination of copper in food and liquids that are consumed.
6.3.3 Diet
The preferred procedure for assessment of copper intake is the
use of "duplicate diet studies" in which a duplicate portion of all
food normally consumed by the test subject is collected, and the total
copper content determined. A secondary method is to estimate the
copper intake through dietary surveys using food composition from
tables. Descriptions of methods for dietary assessment of the trace
elements have been published by WHO (1996).
There is a need for standardized sampling and analytical
procedures for the determination of dietary copper. There is also a
great need for standardized sampling and analytical procedures for the
analysis of copper in drinking-water. Where appropriate, the copper
content of foods such as infant formulae prepared using drinking-water
should also be measured.
6.3.4 Balance studies
The difference between the total copper input (diet and water)
and the total output (faeces and urine) is the copper balance.
Balance data provide an estimate of whether the body is losing or
gaining copper. Copper balance can be used to estimate the amount
required to prevent deficit, since a negative balance in the long run
will give rise to clinical signs of deficit; conversely, a positive
balance, except during growth, will give rise to potential problems
once reserves are replete. In order to achieve copper balance children
require 0.1-0.15 mg Cu/kg body weight per day; adults need 0.02-0.05
mg Cu/kg body weight (1-3 mg/day). In general the percentage of
copper absorbed from the intestinal tract decreases as copper intake
increases.
Estimation of copper excretion is primarily made by the
determination of fecal copper loss. Healthy subjects are in
equilibrium; that is, dietary intake equals fecal copper output (see
Fig. 1 on page 78). The duration of faecal collection should be at
least 3-5 days for children and appropriate inert markers should be
used to ensure completeness of collection. Longer periods may be
necessary for adequate balance studies in adult humans. Fecal output
represents both the copper that is not absorbed from the gut and also
any excreted through the bile.
Urinary copper is a minor pathway for excretion (see Fig. 1) but
should be measured to assure completeness of any balance study.
Urinary copper is increased when renal tubular function is
compromised. It can also be increased in copper overload (O'Donohue et
al., 1993). Sequential measurement of urinary copper excretion can be
used to monitor chelation therapy in Wilson disease.
The balance data from chemically defined diets are used to
develop an understanding of the bioavailability and percentage
retention using different copper intakes. Such data can be used to
estimate the amount of copper required to prevent deficit and give
some information on the functional and clinical effects of excess
intakes. Some balance studies are summarized in Table 8.
The use of copper tracers, radioisotopes and stable isotopes
provides kinetic information to complement the balance studies. The
results from such studies can be mathematically modelled to provide
estimates of whole body and specific tissue compartments, such as
liver stores. True absorption and endogenous losses can be directly
measured from the copper isotope ratios in stool and diet (Turnlund et
al., 1991).
The reference interval for serum copper for normal adult males is
in the range 800-1200 µg/litre (WHO, 1996). Values for women are
about 10% higher. Serum copper is reduced in moderate to severe
symptomatic copper deficiency. However, serum copper concentration is
not a sensitive marker of recent onset of deficiency (Milne et al.,
1990; Turnlund et al., 1990; Milne & Johnson, 1993). Other conditions
which modify these laboratory parameters include inflammation or
infection, neoplasms and anticonvulsant or oestrogen therapy
(Solomons, 1979; Fischer et al., 1990; Jain & Mohan, 1991; Nielsen et
al., 1992; Milne & Johnson, 1993).
In copper-deficient infants, it is mainly the ceruloplasmin-bound
fraction of serum copper that is decreased (Holtzman et al., 1970).
The non-ceruloplasmin fraction of serum copper is much less affected
and is more rapidly restored when copper supplementation is initiated.
Apo-ceruloplasmin cannot be detected in human serum during copper
deficiency, suggesting that even if the apo-form may accumulate in the
liver (Holtzman et al., 1970), ceruloplasmin is not released until the
holo-form can be formed. However, even if apo-ceruloplasmin cannot be
detected in its completely unsaturated form, low ceruloplasmin enzyme
activity, concomitant with normal immunoreactive ceruloplasmin levels,
has been observed in copper-deficient human adults. In fact, it has
been suggested that the ratio between ceruloplasmin oxidase activity
and its mass concentration determined by immunological methods may be
used as an indicator of copper status (Milne & Johnson, 1993). Recent
studies by one group, in which the enzymatic activity and
concentration of ceruloplasmin have been measured, show that in copper
deficiency there is a reduction of enzymatic activity of ceruloplasmin
and the ceruloplasmin protein concentration is conserved (Johnson &
Murphy, 1988). Therefore, the enzymatic activity/concentration
ceruloplasmin ratio may be a better indicator of copper status, with
the additional advantage that it is not influenced by factors such as
hormones and gender (Vohra et al., 1965).
Plasma copper will be elevated (up to three times the upper
reference value) in acute copper toxicity. In such circumstances,
signs of intravascular haemolysis may be present. However, in chronic
copper overload, plasma copper and ceruloplamin concentrations are not
elevated (O'Donohue et al., 1993).
Table 8. Daily copper intake and copper balance studies
Subjects Methods Results Reference
4 patients aged metabolic balances were mean copper total excretion and retention were 1.39 and 0.34 Thorn et
between 0.36 performed on subjects who µmol/kg per day at a mean copper intake of 1.73 µmol/kg per day al. (1978)
and 1.53 years had been on a comminuted (110 µg/kg body weight per day) increasing to 1.72 and 0.51 µmol/kg
chicken diet mixed with a per day, respectively, at a mean copper intake of 2.23 µmol/kg per
trace element supplement day (142 µg/kg body weight per day)
for at least 3 weeks
11 girls, the effect of feeding two copper excretion in the feces was significantly increased when Greger
12.5-14.2 years different levels of zinc subjects consumed the diet with the higher level of zinc. The copper et al.
(11.32 mg and 11.64 mg/day) fecal losses and apparent retention of the girls when fed 11.64 mg of (1978)
on copper balance was zinc daily were 30.60 ± 6.50 ng/day and -0.97 ± 6.09 mg/day,
determined during a 30-day respectively. The corresponding figures for girls when fed 11.32 mg/day
period of zinc were 27.99 ± 1.67 ng/day and 1.40 ± 1.56 mg/day, respectively
11 men aged subjects were confined to a absorption and retention averaged 36.3 ± 1.3% and 0.17 mg/day, Turnlund
22-35 years metabolic research unit for 90 respectively, with an adequate-copper diet (1.68 mg/day). Absorption et al.
days to determine the effect of averaged 55.6 ± 0.9% and retention averaged -0.316 mg/day for 6 days (1989)
the level of dietary copper on and 0.093 mg/day for the next 36 days of a low-copper diet
absorption and retention (0.785 mg/day).
Absorption averaged 12.4 ± 0.9% with a high-copper diet (7.53 mg/day)
and retention was strongly positive at first, decreasing linearly with
time. In conclusion: copper absorption is strongly dependent on dietary
copper level and copper balance can be achieved by most young men from
a diet of 0.8 mg of copper daily
10 obese men balance studies were the mean daily intakes of zinc and copper in the soy group were 6.81 Lowy et
conducted over 40 days. Two and 3.1 mg/day, respectively, and in the collagen group these figures al. (1986)
diets providing, 400 kcal were 0.32 and 0.54 mg/day, respectively. Copper balances were
(1.7 MJ) and 100 g of protein determined during eight 5-day periods. During each period copper
daily were administered; to balance was markedly positive in the soy-diet group and negative in
five subjects, a collagen diet the collagen-diet group
that was severely deficient
in both zinc and copper,
Table 8. (continued)
Subjects Methods Results Reference
10 obese and another five subjects,
men a soy diet that provided a
marginal intake of zinc and
an adequate intake of copper
24 men aged subjects received one of two apparent copper balance was significantly greater when the subjects Reiser
21-57 years diets low in copper (1.03 mg consumed the fructose diet (copper intake 1.11 ± 0.02 mg, balance et al.
per day and 2850 kcal, 12 MJ) 0.17 ± 0.08 mg) as compared to the starch diet (copper intake (1985)
and containing 20% of the 0.94 ± 0.04 mg, balance -0.08 ± 0.08 mg)
calories as either fructose or
cornstarch
SOD is a copper-containing enzyme found in the cytosol of
virtually all cells, including the erythrocyte. Reduced SOD activity
has been demonstrated in copper-deficient animals and in humans (Uauy
et al., 1985). This decrease is proportional to the magnitude of the
deficiency of this mineral (Harris & Percival, 1991). Studies in
humans have shown decreased activity of erythrocyte SOD in
copper-deficient patients or in subjects receiving a low copper intake
(Disilvestro & Harris, 1981; Van der Berg & Beynen, 1992). SOD
activity was restored to a normal level when the subjects' diet or
drinking-water was supplemented with copper (Vohra et al., 1965; Van
der Berg & Beynen, 1992).
It has also been shown in humans that cytochrome c oxidase
activity of leukocyte and platelets is reduced in copper deficiency
(Johnson & Murphy, 1988). This decrease occurs before the appearance
of a reduction of SOD activity (Johnson & Murphy, 1988). If
confirmed, this finding suggests that cytochrome c oxidase activity in
leukocytes or platelets could be a sensitive indicator of copper
status. Although there is no single specific indicator of copper
deficiency (WHO, 1996), evidence of deficiency can be based on
observing the rate of disappearance of copper-dependent enzymic
activities and their subsequent return to normal levels with copper
supplementation. Deficiency studies are very valuable because
specific proteins can be singled out and studied with little
interference from other cuproenzymes. For instance, extracellular
lysyl oxidase, intracellular SOD and mitochondrial cytochrome oxidase
can be assayed, and changes over time following copper repletion
experiments can be used to trace the movement of copper through the
cellular compartments. To be a sensitive tool in nutritional studies,
an enzyme must respond reversibly to a copper deficiency, be easily
quantitated and have a short half-life so the change in activity can
be measured rapidly. Unfortunately, the copper enzymes used in many
studies are difficult to quantitate, hard to purify and have long
half-lives. The sensitivity of deficiency studies can be enhanced by
using copper isotopes to label the target proteins, which can then be
identified and quantitated enzymatically, immunochemically or by both
procedures. The major requirement in such experiments is that the
turnover, synthesis or activation of the enzyme must be rapid so the
isotope can be incorporated into the target protein and measured in a
reasonably short period of time.
Excessive copper accumulation in the liver can be determined by
needle biopsy. This requires an adequate sample taken under controlled
conditions in order to avoid contamination. Analysis must be carried
out in a specialized laboratory. This is the preferred method for
measurement of copper excess and should be included in the evaluation
of children and adults with liver disease of unknown aetiology. The
reference value for liver copper is 20-40 µg/g (dry weight) but is
significantly higher in the newborn. Nonspecific copper accumulation
occurs in a variety of cholestatic liver disease without a specific
pathological effect. Liver copper in excess of 250 µg/g (dry weight)
in the presence of other biochemical and clinical evidence is
indicative of Wilson disease, ICC or ICT (see chapter 8). Copper
accumulation in other tissues can be assessed only by postmortem
analysis.
6.4 Biochemical basis of copper toxicity
The requirement for copper in various organs or systems within
the body is effectively regulated by homoeostatic control mechanisms.
Toxicity is likely to occur only when such homoeostatic control within
any particular compartment is overwhelmed and/or basic cellular
defence or repair mechanisms are impaired.
The essentiality and potential toxicity of copper in biological
systems relies basically on the specific electron configuration,
particularly of the outer electron shells. Accordingly, the cuprous
(Cu+) ion is highly polarizable and binds mainly to nitrogen- and
sulfur-containing ligands by sharing their electronic orbitals. Cupric
(Cu2+) ions, on the other hand, are able to form both coordination
complexes with oxygen-containing ligands and partly covalent bonds
with nitrogen- and sulfur-containing centres. Therefore, copper has to
be considered fairly reactive and able to bind strongly to many types
of electron-rich structures. The affinity of copper ions towards a
particular ligand, however, is also influenced by the polarizability
of the ligand itself (Nriagu, 1979).
Toxicity of copper may arise when excess copper provokes the
following adverse reactions:
* Structural impairment of essential metal binding sites by
displace ment of metals resulting, for example, in membrane
changes such as depolarization and impairment of receptors or
transporter molecules (Alt et al., 1990).
* Functional impairment by binding of copper to crucial sites in
such macromolecules as DNA or enzymes particularly containing
sulfhydryls, carboxylates or imidazoles (Alt et al., 1990). This
will lead to direct protein damage, or oxidative DNA changes
leading to various functional changes, because of the large
number of enzymes dependent upon copper and the possible
misreading of genetic codes.
* Cellular injury due to the production of oxyradicals by the
Fenton reaction (Goldstein & Czapsky, 1986):
Cu+ + H2O2 --> Cu2+ + OH* + OH-
The excessive production of such radicals will initiate a cascade
of oxidation-reduction reactions (oxidative stress) finally leading to
the loss of cellular integrity. The causes of injury considered
include increased cytosolic calcium levels, ATP depletion, thiol
oxidation, lipid peroxidation, DNA damage and critical damage to
organelles such as mitochondria and lysosomes.
Threshold levels for copper toxicity have not yet been
established, although the main intracellular binding site for copper,
metallothionein, appears to become saturated with copper before the
occurrence of any toxic effects. Metallothionein also has been
suggested to act as an intracellular antioxidant, thereby protecting
cells by the direct scavenging of reactive oxygen species. In vitro
metallothionein exhibits a very high reaction constant for hydroxyl
radicals (Thornalley & Vasak, 1985) and according to recent
experiments, mouse cells lacking metallothionein were more sensitive
to oxidative stress (Liu et al., 1995).
6.5 Interactions with other dietary components
The absorption of copper is inhibited by the presence of some
other essential and nonessential trace metals (e.g. zinc, iron,
molybdenum, lead and cadmium) (WHO, 1996). The absorption of copper
is also influenced by a number of other dietary and endogenous
factors. Easily digested proteins may enhance copper absorption; for
example, proteins in human milk are more easily digested than proteins
in cow's milk and lend to enhance copper absorption. Citrate,
phosphate and glutamate all form complexes with copper that facilitate
absorption. Phytate, dietary cellulose fibre and ascorbic acid
decrease copper absorption (Cousins, 1985).
6.5.1 Protein and amino acids
Animal protein enhances copper absorption (Turnlund et al.,
1983). Copper absorption was higher from an animal protein diet (41%)
than from a plant protein diet (34%). Different milk proteins have
been shown to have varying effects on copper status: whey protein had
a negative effect on copper absorption (Lynch & Strain, 1990). Soy
protein isolates, as used in infant formula, reduce copper
bioavailability (Lo et al., 1984; Greger & Mulvaney, 1985). Specific
amino acids are known to form complexes with divalent cations such as
copper. Histidine chelates copper with a greater affinity than it does
zinc (Ashmead et al., 1985). Copper accumulation in the mucosal tissue
was higher when an excess of histidine to copper and zinc was used
(Wapnir & Balkman, 1992). It is possible that a copper-histidine
complex may be an effective way to provide bioavailable copper. In
contrast, cysteine has an inhibitory effect on copper utilization
(Robbins & Baker, 1980; Baker & Czarnecki-Maulden, 1987). This effect
on copper absorption is evident at both deficient and excess copper
levels in the diet (Aoyagi & Baker, 1994).
6.5.2 Phytate and fibre
Turnlund et al. (1984) used stable isotopes to study the effect
of copper on the absorption of phytate and alpha-cellulose in young
men. They found no effect of either component in human subjects and
suggested that high levels of phytate or fibre do not decrease copper
absorption. The authors proposed that zinc-phytate complexes
precipitate at the pH of the gastrointestinal tract, whereas
copper-phytate complexes do not. Since phytate in the soluble
copper-phytate complex can easily be replaced by other chelators, such
as amino acids (Jacobsen & Slotfeldt-Ellingsen, 1983), there may be no
inhibitory effect of phytate on copper absorption. A study on cereal
products supports this hypothesis (Lyon, 1984); zinc solubilized from
cereal by the addition of acid precipitated completely when the pH was
raised to 7, whereas copper remained in solution.
6.5.3 Ascorbic acid
Van den Berg & Beynen (1992) suggested that the primary effect of
high dietary ascorbic acid was to reduce intestinal absorption of
copper, but that it also increased hepatic uptake and biliary
excretion of 64Cu. The effect of ascorbic acid on copper metabolism
was more pronounced in copper-deficient than in copper-adequate
animals.
Finley & Cerklewski (1983) found decreased ceruloplasmin oxidase
activity and lower serum copper in young adult men after 64 days of
1500 mg ascorbic acid/day (values were determined after the vitamin
was discontinued). However, this effect could be independent of lower
copper absorption, as Jacob et al. (1987) found no difference in
copper absorption in young men given different levels of ascorbic
acid. Ascorbic acid may promote the dissociation of copper from
ceruloplasmin, thus lowering its oxidase activity. This was supported
by the finding that immunological quantitation of ceruloplasmin showed
no change in apoprotein levels. A clinical study on low birth weight
(LBW) infants fed formula supplemented with ascorbic acid (50 mg/day)
did not show any negative effects on copper balance (Stack et al.,
1990). However, the LBW infants were largely in negative copper
balance and thus may have been copper deficient. It is possible that
ascorbic acid under these conditions may not exert overall negative
effects on copper utilization as observed in copper-deficient rats
(Van den Berg et al., 1994).
6.5.4 Zinc
High levels of dietary zinc have a negative effect on copper
absorption. Since supplemental zinc is often used in infants, children
and pregnant women in order to avoid possible zinc deficiency, the
possible interference with copper absorption needs to be considered.
High doses of zinc (40-50 mg/day) have been used successfully to treat
patients with Wilson disease (Brewer et al., 1983; Hoogenraad & van
den Hamer, 1983). Zinc limits the amount of copper absorbed (Lyons et
al., 1995), possibly by increasing intestinal metallothionein
concentrations and, therefore, slowing the progression of the disease
(Fischer et al., 1983; Oestreicher & Cousins, 1985). However, high
intakes of zinc should be viewed with some concern since copper
deficiency may be induced. Conversely, copper supplementation may
interfere with zinc absorption (Salim et al., 1986).
Human subjects fed diets with different zinc/copper ratios have
not exhibited a significant effect on copper absorption. August et al.
(1989) used a stable isotope of copper to study copper absorption in
young adults and elderly subjects. They used zinc/copper ratios of
2 : 1, 5 : 1 and 15 : 1, finding no significant effects of these
ratios on copper absorption.
6.5.5 Iron
Copper absorption may also be affected by high levels of dietary
iron. Haschke et al. (1986) studied the effect of two levels of iron
fortification of infant formula on copper balance in full-term
infants. They found that the higher level of iron (10.8 mg/litre)
resulted in lower copper balance than when the lower iron level was
used (1.8 mg/litre). Barclay et al. (1991) have shown reduced SOD
levels in premature infants given iron supplements. Earlier studies in
experimental animals had shown a reduction in liver copper
concentrations when dietary iron was increased 10-fold (Smith &
Bidlack, 1980). However, modest supplements of iron did not appear to
affect serum copper levels in older infants (Yip et al., 1985).
Several studies suggest that high dietary iron only affects copper
absorption when copper status is low or marginal (Cohen et al.,
1985a,b; Johnson & Murphy, 1988).
High intakes of iron and ascorbate may act together to adversely
affect copper status. Johnson & Murphy (1988) found that high iron
with ascorbic acid caused severe anaemia in copper-deficient rats and
decreased plasma ceruloplasmin by 44% in copper-adequate rats. Since
iron and ascorbate are commonly used together in nutritional
supplements for humans, the possibility of a negative effect on copper
metabolism should be considered.
6.5.6 Carbohydrates
In rats, dietary fructose worsens the effects of copper
deficiency (Fields et al., 1984; Reiser et al., 1985) in that fecal
and urinary excretion of copper are elevated when the rats are fed
fructose as compared to starch. Data from humans do not support these
findings (Reiser et al., 1985; Holbrook et al., 1989).
6.5.7 Infant diets
Studies on full term infants fed on breast or cow's milk formula
suggest that copper is better absorbed from human milk than from a
cow's milk formula (Dörner et al., 1989). Studies using stable
isotopes of copper support this finding (Ehrenkranz et al., 1989).
Studies in suckling rats have revealed slightly higher copper
bioavailability (estimated from uptake of 64Cu by 6 h post-dosing)
from human milk than from cow's milk formula (Lonnerdal et al., 1985).
A more recent study, using the same rat pup model, evaluated several
varieties of infant formula (Lonnerdal et al., 1994). In general,
copper absorption was relatively high from milk formulae but lower
from soy formulae. The lower copper bioavailability from cow's milk
combined with its low copper content most likely explains the copper
deficiency found in some premature infants fed cow's milk formulae.
6.5.8 Other interactions (molybdenum, manganese, selenium)
Dietary molybdenum, in the presence of sulfate, forms insoluble
complexes with copper thereby decreasing the availability of copper
for absorption. Thus, high levels of molybdenum in the diet may
induce or aggravate copper deficiency (Ladefoged & Sturup, 1995). The
addition of copper to diets of rats decreases tissue manganese levels,
suggesting that copper impairs manganese absorption. Manganese
absorption is greatest in animals that are deficient in copper and
manganese (Johnson & Korynta, 1992). Research efforts on
copper-selenium interactions have not been revealing, except for
showing the complementarity in antioxidant protection of copper SOD
and selenium-containing glutathione peroxidase (Fischer et al., 1992;
Olin et al., 1994).
7. EFFECTS ON LABORATORY MAMMALS AND IN VITRO TEST SYSTEMS
The effects of exposure of experimental animals to common
inorganic salts of copper have been summarized in Tables 9-12. These
studies represent the better-quality and better-documented studies in
each toxicological area. Studies in which the compound was
administered by injection have generally not been included, owing to
their uncertain relevance to environmental or occupational exposures.
The results of such studies have, however, been included in the table,
when no information was available for more relevant routes of
exposure.
In this section and the associated tables, information on dosage
with respect to body weight was obtained from the original papers
wherever possible. When doses were not expressed in this way by the
investigators and could not be calculated from the data provided,
approximate doses have been estimated based on data presented in
standard sources (IAT, 1963; FDO, 1965; Gold et al., 1984).
7.1 Single exposure
7.1.1 Oral
The acute oral toxicity of various copper salts is summarized in
Table 9. A wide range of LD50 values has been reported, with the
most soluble salts (e.g. copper(II) sulfate and copper(II) chloride)
generally being more acutely toxic than those with lower solubility
(e.g. copper(II) hydroxide and copper(I) oxide). From the available
information on copper(II) sulfate, rats appear to be less susceptible
to copper than domestic animals; this pattern is also evident in
studies involving repeated exposure (section 7.2). In the various
acute studies, as the lethal oral dose is approached, signs of copper
toxicity include excessive salivation, vomiting, diarrhoea, gastric
haemorrhage, increased heart rate, hypotension, haemolytic crisis,
convulsions and paralysis.
7.1.2 Dermal
In the only dermal studies identified, LD50 values of > 1124
and > 2058 mg Cu/kg body weight per day were reported, the first for
rats exposed to copper(II) oxysulfate (NIOSH, 1993) and the second for
rabbits exposed to copper(II) hydroxide (Tomlin, 1994).
7.1.3 Inhalation
The LC50 value for inhalation exposure of rabbits to copper(II)
hydroxide (physical form and duration unspecified) was > 1303 mg
Cu/m3 (Tomlin, 1994). Intratracheal instillation in rats of
copper(II) oxide at 222 mg Cu/kg body weight was lethal (NIOSH, 1993).
Table 9. Toxicity of copper compounds after a single oral exposure
Salt Species LD50 value Equivalent Reference
(mg/kg body copper dose
weight) (mg Cu/kg
body weight)
Copper(II) rat 595 208 NIOSH (1993)
acetate rat 710a 226 Smyth et al.
(1969)
mouse 1600a 509 Schafer &
(lethal dose) Bowles (1985)
Copper(II) rat 159 82 Lehman (1951)
carbonate mouse 320 165 Schafer &
(lethal dose) Bowles (1985)
Copper(II) rat (male) 1350 388 Hasegawa et
carbonate rat (female) 1495 430 al. (1989)
hydroxide rabbit 317 91 NIPHEP (1989)
Copper(II) rat 140 66 Lehman (1951)
chloride mouse 190 90 NIPHEP (1989)
guinea-pig 32 15 NIPHEP (1989)
Copper(II) rat 1000 651 Pesticide
hydroxide Manual (1991)
Copper(II) rat 940b 247 Smyth et al.
nitrate (1969)
Copper(I) rat 470 417 Smyth et al.
oxide (1969)
Copper(II) rat 700-800 417-476 Tomlin (1994)
oxychloride rat 1440 857 NIPHEP (1989)
Copper(II) rat 300 120 Lehman (1951)
sulfate rat 960c 244 Smyth et al.
(1969)
mouse 50 (LD100) 20 Venugopal &
Luckey (1978)
rabbit 125 50 Eden & Green
(1939)
a Monohydrate
b Trihydrate
c Pentahydrate
Guinea-pigs exposed to copper(II) oxide aerosol at 1.6 mg/m3
(1.3 mg Cu/m3, as particles with a count median diameter
approximately 0.03 µm) for 1 h showed significant reductions
( P <0.05) in tidal volume, minute volume and lung compliance, both
during and after exposure, while respiratory frequency was slightly
but not significantly increased (Chen et al., 1991).
In two studies involving the intratracheal instillation in rats
of copper(II) oxide (Hirano et al., 1993) or copper(II) sulfate
pentahydrate (Hirano et al., 1990) at doses of up to 0.1 or 0.05 mg
Cu/rat, respectively (roughly 0.36 or 0.18 mg Cu/kg body weight),
acute inflammatory changes were evident in the lungs from 0.018 mg
Cu/kg body weight with the soluble sulfate salt and from 0.073 mg
Cu/kg body weight with the insoluble oxide.
7.2 Short-term exposure
There have been numerous studies of the effects of short-term
exposure to copper compounds. In rats exposed by the oral route to
approximately 30-50 mg Cu/kg body weight per day as copper(II)
sulfate, the most common compound-related effects observed have
included those on the liver, kidney and lungs, as well as alterations
in haematology (particularly anaemia) and in blood biochemistry.
Effects are qualitatively similar with other copper compounds, and in
other species. However, pigs and especially sheep are more
susceptible to the toxic effects of copper compounds; exposure of
sheep to doses of 1.5-7.5 mg Cu/kg body weight per day in diet as
copper(II) sulfate or copper(II) acetate was associated with
progressive liver damage, followed by a haemolytic crisis and
ultimately death. In inhalation studies, morphological changes were
induced in the tracheal epithelium and in the alveoli by short-term
inhalation of 0.06 mg Cu/m3 copper(II) sulfate in mice, but not in
hamsters.
7.2.1 Oral
The most comprehensive studies of short-term toxicity in rats and
mice were conducted by Hébert et al. (1993). In a 15-day feeding
study in rats involving the administration of up to 16 000 mg/kg
copper(II) sulfate pentahydrate in the diet (estimated intakes up to
305 mg Cu/kg body weight per day), weight gain was reduced from 194 mg
Cu/kg body weight per day, but there were no other overt signs of
toxicity. Effects on the forestomach were evident from 45 mg Cu/kg
body weight per day, on the kidneys from 93 mg Cu/kg body weight per
day, and on the liver and bone marrow from 194 mg Cu/kg body weight
per day. The NOEL in this study was 23 mg Cu/kg body weight per day
(Hébert et al., 1993). When the same investigators administered
copper(II) sulfate to rats in the drinking-water for 15 days at up to
30 000 mg/kg (estimated intakes up to 97 mg Cu/kg body weight per
day), the various clinical signs of toxicity and deaths that were
evident from around 31 mg Cu/kg body weight per day were attributed to
dehydration, as a result of the poor palatability of the
drinking-water. The NOEL in females was 26 mg Cu/kg body weight per
day, while in males there was evidence of kidney damage from the
lowest dose tested of 10 mg Cu/kg body weight per day (Hébert et al.,
1993). (Effects on gastric mucosa have only been observed in rodent
studies in which copper(II) sulfate was administered in the diet, and
not in the drinking-water studies. It is likely that these effects
are due to irritation, particularly as copper(II) sulfate may
dissociate to form sulfuric acid in the stomach.)
From the evidence of one 15-day feeding study (Hébert et al.,
1993), mice appear to be less sensitive than rats to the toxic effects
of copper. When copper(II) sulfate pentahydrate was administered at
up to 16 000 mg/kg in the feed, weight gain was reduced only in
females at the top dose (estimated intake 781 mg Cu/kg body weight per
day), while the only effects observed on microscopic examination of
the liver, kidneys and forestomach were hyperplasia and hyperkeratosis
in the forestomach from 197 (males) or 216 (females) mg Cu/kg body
weight per day. The NOEL in this study was 92 mg Cu/kg body weight
per day in males and 104 mg Cu/kg body weight per day in females. In
the equivalent drinking-water study, the findings (reduced water
consumption, body weight, clinical signs at doses of 58-62 mg Cu/kg
body weight per day and higher) were again, as in the rats, thought to
be confounded by dehydration of the treated animals (Hébert et al.,
1993).
Other studies summarized in more extensive reviews on copper
(Slooff et al., 1989; ATSDR, 1990) have deficiencies in design and/or
level of experimental details and results, which make it impossible to
utilize in any dose-response evaluation. They are, therefore, not
considered here.
7.2.2 Inhalation
7.2.2.1 Copper(II) sulfate
When unspecified numbers of mice and hamsters were exposed by
inhalation to copper(II) sulfate aerosol at 0.06 mg Cu/m3 for 3
h/day, 5 days/week for 1 or 2 weeks, the tracheal epithelium and the
alveoli of mice were altered in appearance, whereas hamsters showed no
treatment-related effects on the tracheal epithelium or on ciliary
activity (Drummond et al., 1986).
7.2.2.2 Copper chloride
In an inhalation study, repeated exposure of rabbits (group sizes
not specified) to copper(II) chloride aerosol at 0.6 ± 0.3 mg Cu/m3
for 6 h/day, 5 days/week for 4-6 weeks did not produce any
histological lesions in the lungs, and alveolar macrophage activity
appeared to be unaffected despite some morphological changes
(Johansson et al., 1983, 1984; Lundborg & Camner, 1984).
7.3 Repeated exposure: subchronic toxicity
There are a limited number of studies of the subchronic toxicity
of copper compounds to animals. In comprehensive studies in rats,
there were histopathological effects on the forestomach and
indications of anaemia at 34 mg Cu/kg body weight per day as
copper(II) sulfate in diet. Higher doses elicited degenerative
changes in the liver and kidney in rats in this and several other
studies, with recovery observed in some of these. As was observed in
the short-term studies (section 7.2), mice are markedly less sensitive
than rats to the toxicity of copper(II) sulfate. Other copper
compounds have not been well studied, although exposure of rats to
approximately 10 mg Cu/kg body weight per day as copper(I) chloride
induced transient reductions in the activities of glutathione
S-transferases, and the same dose as copper(II) carbonate increased
systolic blood pressure and haemoglobin levels.
7.3.1 Oral
7.3.1.1 Copper(II) sulfate
The critical study is that of Hébert et al. (1993) which is
described here. Details of other experiments of repeated long-term
exposures of copper are given in Table 10.
In comprehensive 90-day studies in both rats and mice (Hébert et
al., 1993), in which copper(II) sulfate pentahydrate was administered
in the feed at up to 8000 mg/kg in rats (up to 138 mg Cu/kg body
weight per day) and up to 16 000 mg/kg in mice (up to around 1000 mg
Cu/kg body weight per day), there were no overt signs of toxicity
other than a dose-related reduction in growth (statistically
significant in male and female rats from 67 and 138 mg Cu/kg body
weight per day, respectively, and in male and female mice from 97 and
267 mg Cu/kg body weight per day). Microscopic examination of the
tissues revealed hyperplasia and hyperkeratosis in the forestomach in
both species (from 34 mg Cu/kg body weight per day in rats and from
187-267 mg Cu/kg body weight per day in mice), and liver and kidney
effects in the rats only (from 67 mg Cu/kg body weight per day). In
the rats, iron levels were reduced in the spleen, and haematological
changes indicative of microcytic anaemia were observed at 34 mg Cu/kg
body weight per day and higher. The NOEL was 17 mg Cu/kg body weight
per day in rats, and 44 and 126 mg Cu/kg body weight per day in male
and female mice, respectively. The liver and kidney effects observed
in the rats in this study included inflammation of the liver and
degeneration of the kidney tubule epithelium, and were similar to
those found at higher doses (> 100 mg Cu/kg body weight per day) in
more limited studies in rats (Haywood, 1980, 1985; Haywood & Loughran,
1985).
Table 10. Toxicity of copper after repeated oral doses
Species Protocol Results Effect level Reference
Copper(II) copper sulfate pentahydrate given Survival was unaffected. Body weight gain was significantly NOEL: 17 mg Hébert
sulfate in the feed for 92 days at levels of depressed in the males at 4000 mg copper sulfate/kg diet Cu/kg body et al.
Rats (F344/N, 0, 500, 1000, 2000, 4000 and 8000 (P < 0.05) and in both sexes at 8000 mg copper sulfate/kg weight per (1993)
groups of 10 mg/kg diet. Estimated intakes were diet (P < 0.01). Average feed consumption was reduced day
males and 10 0, 8, 17, 34, 67 or 138 mg Cu/kg in both sexes at 8000 mg copper sulfate/kg diet. There
females, body weight per day. were no other clinical signs of toxicity in the treated rats LOEL: 34 mg
additional Comprehensive microscopic Cu/kg body
groups of 10 examinations carried out at the Gross and microscopic lesions of the forestomach weight per
males & 10 top dose level, in the controls, (hyperplasia and hyperkeratosis of the limiting ridge) were day
females for and in the animals that died early. seen at 2000 mg copper sulfate/kg diet and above.
pathology Liver, kidney and forestomach Inflammation of the liver was seen in all rats at 8000 mg
studies at examinations were carried out to copper sulfate per kg diet, all males and 6/10 females at
intermediate establish a NOEL. Intermediate 4000 mg copper sulfate/kg diet and one male at 2000 mg
time points) haematology and clinical chemistry copper sulfate/kg diet. In the kidneys, cytoplasmic protein
evaluations carried out on droplets were evident, particularly at the top two doses,
days 5 and 21, and urinalysis and minimal nuclear enlargement of, and degeneration in, the
on day 19. These tests also tubule epithelium were seen at the top dose. From 2000 mg
carried out at termination copper sulfate per kg diet, iron levels were reduced in the
of the study spleen (both sexes) and haematological changes indicative of
microcytic anaemia were seen on day 21 and at the end of the
study. Significant increases in red bloodcells and
reticulocytes were seen in the high-dose males at the end of
the study. A number of other clinical chemistry and urinalysis
parameters were affected at the top two dose levels
Rats (Wistar, Rats fed diets containing 0 or 3000 In group not supplemented with copper for first 15 weeks only one dose Haywood
groups of 16 mg Cu/kg as copper sulfate for of experiment, clinical effects (lethargy, ruffled coats) tested &
males) 15 weeks (equivalent to 270 mg seen on administration of 6000 mg Cu/kg diet. No such effect (effects at Loughran
Cu/kg body weight/day). Four rats seen in 'copper-primed' group. Livers of rats given 3000 100mg Cu/kg (1985)
per group killed and livers removed mg Cu/kg diet for 15 weeks showed only mild effects body weight
for examination, remaining rats (believed to indicate ongoing recovery from damage that per day)
then fed diets containing 6000 mg was assumed to have occurred in the earlier weeks) at 15
Cu/kg as copper sulfate for a weeks, and feeding of 6000 mg Cu/kg diet for a further 3
further 3 weeks weeks had no significant hepatotoxic effects. The unprimed
Table 10. (continued)
Species Protocol Results Effect level Reference
group suffered hepatocellular necrosis and inflammation
after the 3-week exposure to 6000 mg/kg
Rats (strain Rats fed diet containing 2000 mg Inflammation and extensive necrosis of the liver and bile only one dose Haywood
unspecified, Cu/kg diet as copper sulfate duct hyperplasia were evident by week 6. By week 15 there tested (1980)
groups of 24 (equivalent to about 100 mg Cu/kg was considerable recovery, although some fibrosis and less (effects at
treated and body weight/day). Groups of 4 marked hyperplasia of the bile duct could still be seen 100 mg Cu/kg
12 control treated and 2 control rats killed body weight
males) after 1, 2, 3, 6, 9 and 15 weeks Greenish discolouration of the kidneys was seen in some per day)
and their liver and kidneys rats at week 6. Microscopic effects (eosinophilic droplets
examined histologically in the cytoplasm of cells in the proximal convoluted tubules
and desquamation of these cells into the lumen) first
appeared at week 3, and were more severe at 6 weeks.
Regeneration was almost complete at 15 weeks
The investigators concluded that repeated copper dosing
elicits a similar response in the kidneys and the liver, both
organs adapting to the excess copper, resulting in the
development of tolerance in the treated rats
Blood was taken from the above Alanine aminotransferase activity was significantly increased Haywood
rats prior to sacrifice and (P < 0.05) at week 1 (indicative of liver damage), rose to a &
analysed for enzyme activity maximum around weeks 6-9, and remained at that level to Comerford
the end of the study. Ceruloplasmin activity was elevated (1980)
(P < 0.05) from week 6 until the end of the study. Alkaline
phosphatase activity and bilirubin levels were unaffected
by copper treatment
Rats (Wistar, Rats fed diets containing 0, Rats receiving 6000 mg Cu/kg diet did not grow and were LOEL: 270 Haywood
groups of 28 3000, 4000, 5000 or 6000 mg in poor condition. Two died at 2 weeks. At 6 weeks the mg Cu/kg (1985);
males) Cu/kg diet as copper sulfate for survivors developed diarrhoea, began to lose weight and body weight Haywood
up to 15 weeks (equivalent to 0, were killed. At 3000-5000 mg/kg of copper sulfate, the per day &
270, 360, 450 and 540 mg Cu/kg animals showed clinical signs of toxicity (poor growth, Loughran
body weight per day based on ruffled fur) at around 3-5 weeks, but their condition (1985)
the mean final weight of the rats subsequently improved; by week 15 they appeared sleek
fed 3000 mg Cu/kg diet). Four and active, but were only half the weight of controls
Table 10. (continued)
Species Protocol Results Effect level Reference
rats at each dose level killed at
1, 2, 3, 4, 5, 6 and 15 weeks. Microscopic changes were evident in the liver (necrosis,
Liver and kidneys removed for inflammation, hepatocytic hypertrophy, nuclear
histological examination enlargement) within 1-2 weeks, depending on the dose, but
began to subside from week 6 onwards, with regeneration by
week 15 (except at 6000 mg Cu/kg diet where the effects
persisted). Microscopic effects on the kidneys (an increase
in eosinophilic cytoplasmic droplets in cells of the
proximal tubules followed by extrusion of the droplets and
exfoliation of the cells, degenerative changes to proximal
tubules) were seen at 2-5 weeks at all dose levels, with
recovery from weeks 6-15
Mice (B6C3F1, Copper sulfate pentahydrate given Survival was unaffected. A dose-related depression in NOEL: 44 Hébert
groups of 10 in the feed for 92 days at levels of body weight gain was observed in both sexes and 126 mg et al.
males and 0, 1000, 2000, 4000, 8000 and (statistically significant from 2000 mg copper sulfate/kg Cu/kg body (1993)
10 females) 16 000 mg/kg diet. Estimated diet in males and 4000 mg copper sulfate/kg diet in females, weight per
intakes were 0, 44, 97, 187, 398 P < 0.05), although average feed consumption was day in males
and 815 mg Cu/kg body weight similar in treated and control mice. No other clinical and females
per day in males and 0, 52, 126, signs of toxicity were observed respectively
267, 536 and 1058 mg Cu/kg
body weight per day in females. Gross and microscopic lesions of the forestomach LOEL: 97
Comprehensive microscopic (hyperplasia and hyperkeratosis of the limiting ridge) and 267 mg
examinations carried out at the were seen at 4000 mg copper sulfate/kg diet and above Cu/kg body
top dose level, in the controls, weight per
and in the animals that died early. There were no reported effects on the liver or kidneys, day in males
Liver, kidney and forestomach and iron levels in the spleen were normal and females
examined to establish a NOEL respectively
Copper(I) Rats given drinking-water Activity of glutathione S-epoxide transferase was only one Freundt
chloride containing 0 or 100 mg CuCl/litre significantly inhibited (P < 0.05) after treatment dose tested &
Rats (Sprague- (equivalent to 0 or 10 mg Cu/kg for 15 days (-29% compared with controls) but not (effects seen Ibrahim
Dawley, groups body weight per day). Livers after 30 or 90 days. Glutathione S-aryl transferase at 10 mg (1991)
of 5 females) removed after 15, 30 or 90 days activity was unaffected after 15 days, was Cu/kg body
of treatment for determination of significantly inhibited (P < 0.05) after 30 days weight per
activity of glutathione S-epoxide (-7%), and was still slightly but not significantly day)
Table 10. (continued)
Species Protocol Results Effect level Reference
transferase and glutathione reduced after 90 days (-6%). (These enzymes catalyse
S-aryl transferase the metabolic inactivation of reactive substances)
Copper(II) Rats given 18 or 100 mg Cu/kg Body weight, urine output and feed and water intakes did only one Liu &
carbonate diet as copper carbonate for not differ with copper intake. High-dose rats showed dose tested Medeiros
Rats (Wistar or 15 weeks (equivalent to about increased systolic blood pressure compared with low-dose (effects seen (1986)
spontaneously 1.7 and 9.6 mg Cu/kg body rats, particularly in the Wistar strain (Wistar P < 0.05, at 9.6 mg
hypertensive weight per day). Blood pressure SHR P < 0.01 at week 15). Haemoglobin levels were increased Cu/kg body
rats (SHR), measured 3 times/week at high copper intake (P < 0.05), while total cholesterol, weight per
groups of 10 triglycerides and glucose levels in the blood were day)
males of unaffected
each strain)
7.3.1.2 Copper chloride
The task group was aware of an ongoing study in guinea-pigs which
were orally dosed from their first day of life with milk formula
containing copper(II) chloride (10, 15, 30 mg Cu/kg body weight per
day) for 28 days in order to study the effect of exposure to copper in
early life on copper homoeostasis and toxicity (Summer & Dieter,
personal communication, 1996).
7.4 Long-term exposure chronic toxicity or carcinogenicity
The chronic toxicity/carcinogenicity of copper compounds has not
been well characterized (see Table 11). Increased mortality and
growth retardation or effects on the liver, kidneys or stomach have
been observed in rats following long-term ingestion of 27-150 mg Cu/kg
body weight per day as copper(II) sulfate, or 44-45 mg Cu/kg body
weight per day as copper(II) acetate, in several limited studies.
Long-term ingestion of copper(II) sulfate at 10 mg Cu/kg body weight
per day induced marked hepatotoxicity in rabbits. An oral study in
dogs did not show significant toxic effects at the highest dose of 8.4
mg Cu/kg per day, given as copper gluconate (Shanaman et al., 1972).
The available studies of the carcinogenicity of copper compounds
in rats and mice have given no indication that copper salts are
carcinogenic. However, the short duration or low level of exposure,
the small group sizes employed, the limited extent of
histopathological examination, or inadequate reporting limits the
conclusions which can be drawn from such studies. The studies
summarized in Table 11 are, therefore, inadequate to test the
carcinogenic potential of copper compounds with any degree of
certainty. In several studies, administration of copper compounds
inhibited the development of tumours induced by known carcinogens (see
Table 11).
7.5 Reproductive and developmental toxicity
As shown in Table 12, there is some limited evidence that
exposure to copper compounds can affect reproduction in animals. In
some studies of rats exposed by the oral route, the weights and/or
histology of the testes, seminal vesicles, uterus or ovaries have been
affected by chronic intakes of 27-120 mg Cu/kg body weight per day as
copper(II) sulfate, acetate, or gluconate, although the results are
inconsistent between studies and the reporting of some studies is
deficient. In mice, there were no effects on male or female
reproductive organs at 398-537 mg Cu/kg body weight per day as
copper(II) sulfate in the diet. In a single study of rats inhaling
copper(II) chloride aerosol, there were effects on sperm, testis
weight and circulating levels of reproductive hormones.
Table 11. Chronic toxicity or carcinogenicity after long-term exposure
Protocol Results Effect level Reference
Copper(II) Rats fed diets containing 0, 530 Body weight gain was retarded at 1600 mg Cu/kg LOEL (non-neoplastic Harrisson
sulfate or 1600 mg Cu/kg diet as copper diet in the males. Stomachs of the high-dose effects): et al.
Oral sulfate for 40-44 weeks (approx. females were enlarged. Other findings at the high 27 mg Cu/kg body (1954)
Rats 0, 27 or 80 mg Cu/kg body weight dose were 'bronzed' kidneys, 'bronzed' or yellowish weight per day in
(Sprague-Dawley, per day in males and 0, 40 or 120 livers, hypertrophied ridges between cardiac males, 40 mg
groups mg Cu/kg body weight per day in and peptic portions of stomach, and blood in the Cu/kg body weight
of 25 males females). (Reduced amounts fed intestinal tract. Microscopic effects (not further per day in females
and 25 for the first month of the described) were seen in the kidneys in the high-dose
females) experiment.) Microscopic group (presumably in both males and females), and
examination of limited number of effects on the liver were seen in both males and
organs Study inadequately described females, presumably in both dose groups
Rats Rats given diets containing Excess copper caused decreased body weight gain Toxic effects at Carlton
(Sprague-Dawley, deficient (1 mg Cu/kg diet) or and increased mortality with or without DMN or AAF 40 mg Cu/kg body & Price
groups of 50 excess (800 mg Cu/kg diet) levels treatment. The only effects reported in the rats not weight per day (1973)
or 58 males, of copper (as copper sulfate) for 9 exposed to these two carcinogens were liver
additional months (equivalent to about 0.05 necrosis and transitional nodules in the liver in Exposure too short
groups of or 40 mgCu/kg body weight per 3/32 and 1/32 animals, respectively at 800 mg Cu/kg and group size
55-102 males day). Within each treatment group, diet (none at 1 mg Cu/kg diet), and 1 kidney tumour inadequate to
also given separate groups given DMN in the low-copper group (42 rats) assess the
dimethyl the drinking-water (50 mg Cu/kg carcinogenic potential
nitrosamine diet) or AAF in the diet (0.06%), Both DMN and AAF exposure markedly increased of copper sulfate
(DMN) or in both cases for 4 days in every the incidence of liver necrosis and transitional itself, but the data
acetylamino- 8 for 6 months, or no further nodules and each induced a similar incidence of suggest it may
fluorene treatment. Five rats per group liver tumours in rats fed excess copper or have an inhibitory
(AAF) killed after 90 days, and an copper-deficient diets. There were no kidney effect on
additional 5/group killed every neoplasms in the AAF-treated groups, but 57% of DMN-induced kidney
30 days thereafter. Limited the rats in the DMN group on a copper-deficient tumours and
range of organs examined diet (17/30) had kidney neoplasms compared with AAF-induced
microscopically 0% (0/29) on the higher copper diet extra-hepatic tumours
Table 11. (continued)
Protocol Results Effect level Reference
The incidence of AAF-induced extrahepatic
neoplasms was apparently reduced by the excess
copper diet (5/30 vs 11/27 in the low copper group)
Mice Copper sulfate pentahydrate The numbers of mice with ovarian tumours were Exposure too short Burki &
(C57BL/6J, supplied in the drinking-water at 0/10, 0/12, 11/11 and 6/11 in the untreated and group size Okita
groups of 198 mg/litre for 46 weeks controls, copper-treated mice, DMBA-treated mice and inadequate to (1969)
10-12 (equivalent to about 10 mg Cu/kg DMBA + copper-treated mice respectively, assess the
females) body weight per day). One group suggesting that copper sulfate may inhibit tumour carcinogenic potential
received copper sulfate treatment development to some extent. The corresponding of copper sulfate
alone, a second was given an figures for lymphomas were 1/10, 2/12, 3/11 itself, but the data
intravenous injection of DMBA and 3/11 suggest it may
(a known carcinogen) 2 weeks inhibit the
after copper treatment began, and development of
two further groups were untreated DMBA-induced ovarian
or received DMBA treatment only. tumours
Mice killed at 46 weeks and a
limited range of organs studied
microscopically
Rabbits 10 ml of a 1% solution of copper Effects on the liver included degeneration and Only one dose Tachibana
(strain and sulfate (equivalent to about 10 mg vacuolation of the hepatocytes, granule formation tested (effects (1952)
numbers Cu/kg body weight) given to in the cytoplasm, morphological changes in the at 10 mg Cu/kg
unspecified) rabbits daily or on alternate days nuclei, and atrophy and compensatory hypertrophy body weight
"for up to 400 days and over". "in the late stage". Marked infiltration of round per day)
Rabbits evidently killed at cells (mainly lymphocytes) into "interhepatic
various time intervals, some tissues" was seen after 200 days (and to a lesser
as early as 33 days. Liver extent after shorter periods of administration).
examined macroscopically Proliferation of the interstitial connective
and histologically tissues was also evident after 200 days, and became
much more marked after 300 days, "with a resulting
picture of liver cirrhosis". Haemorrhage and
necrosis of the liver occurred in some animals
Table 11. (continued)
Protocol Results Effect level Reference
A dysfunction in sugar metabolism was evident after
30-60 days of copper administration, with temporary
recovery after 90 days but further impairment after
120-150 days. There were no effects on serum
bilirubin or total serum proteins.
Copper Rats fed diets containing 0 or Mortality was increased, and food intake and body Only one dose Harrisson
gluconate 1600 mg Cu/kg diet as copper weight gain were retarded by 1600 mg Cu/kg diet in tested (effects at et al.
Oral gluconate for 40-44 weeks both sexes. Stomachs enlarged in both sexes, while 80 mg Cu/kg (1954)
Rats (equivalent to about 0 or 80 mg hypertrophy of the uteri, ovaries, or seminal body weight per
(Sprague-Dawley, body weight per day in males, vesicles was observed. Other findings were "bronzed" day in males,
groups of 25 and 0 or 120 mg Cu/kg body kidneys, "bronzed" or yellowish livers, and 120 mg Cu/kg
males and weight per day in females). hypertrophied ridges between cardiac and peptic body weight per
25 females) (reduced amounts fed for the first portions of stomach, and blood in the intestinal day in females)
month of the experiment). tract. Microscopic effects (not further described)
Microscopic examination of a were seen in the kidneys of copper-exposed rats
limited number of organs. Study (presumably in both sexes), and effects on the liver
inadequately described were seen on both males and females. Levels of
copper in liver were nearly twice as high as in rats
receiving an equivalent dose of copper as
copper(II) sulfate, corresponding to their
relative toxicities
Dogs (Beagle, Dogs fed diet containing 0, No effect on mortality or body weight gain. Physical Elevated SGPT Shanaman
groups of 0.012%, 0.06% and 0.24% copper examinations, haematology, urinalysis and most in 2 of 12 dogs (1972)
6-8 males gluconate for 6-12 months blood biochemical analysis revealed no effect of the on 8.4 mg Cu/kg
and 6-8 (equivalent to 0, 0.42, 2.1 compound except in two of the 12 dogs on the body weight per
females) and 8.4 mg Cu/kg per day). Detailed highest dose which showed elevated levels of serum day evaluated by
study of haematological biochemical GPT; this was reversible. No compound related the Task Group
and urinalysis parameters, and gross on microscopic pathologic lesions or changes as not
tissue copper concentrations in in organ weight were seen. At 6 and 12 months, toxicologically
kidney, liver and spleen. Detailed there was a gross-dependent increase in copper significant
necropsy, histopathology and level in kidney, liver and spleen. Liver biopsy from
organ weight information provided 4 animals at 0, 4 and 12 weeks after withdrawal of
12 months dosing (0.24% copper gluconate) showed
some reversibility of liver copper level
Table 11. (continued)
Protocol Results Effect level Reference
Copper(II) Rats fed diets containing 0 or 0.5% Rats in all groups were reported to consume the Study inadequate Howell
acetate copper acetate (approximately 87 same amounts of food. In one experiment, of for assessing the (1958)
Oral mg Cu/kg body weight per day) animals treated with DMAB alone, 17/20 carcinogenic
Rats (various throughout their lifetimes. Second developed tumours, compared with 4/16 in those potential of copper
strains, set treated in the same way, exposed to both DMAB and copper acetate. acetate itself, but
groups of except 0.09% Comparable incidences for a subsequent the data suggest
5 males p-dimethylamino-benzene (DMAB), experiment were 7/8 and 0/8, respectively it has an inhibitory
and 5 a known liver carcinogen, included effect on
females) in the diet for the entire period. DMAB-induced tumours
Liver, spleen and grossly abnormal
tissues were examined
microscopically
Rats Control group fed meal containing Growth was reduced by 23% in the treated rats. Only one dose Llewellyn
(Holtzman, 18 mg Cu/kg diet, treated group Weights of the heart, spleen, lung and kidney were tested et al.
groups of fed meal supplemented with 2600 unchanged, while testis weights were increased. (non-neoplastic (1985)
10 males) mg Cu/kg diet copper acetate Effects on liver weight are unclear from the effects at 45 mg
(approximately 45 mg Cu/kg body information provided Cu/kg body weight per
weight per day) for 21 weeks. day)
Limited number of organs Examination of the bones revealed no qualitative
weighed. Long bones (osteoporosis, osteomalacia, modelling defects) or
radiographed and measured quantitative effects, although femur length was
decreased relative to controls (P < 0.05)
Intraperitoneal Injection of copper acetate 3 times Only 5/20 mice survived at the top dose. The Inadequate group Stoner
injection per week for 8 weeks at total numbers of mice with lung tumours were 4/15 (27%), size to determine et al.
Mice (Strain doses of 36, 90 or 180 mg/kg body 9/18 (50%) and 3/5 (60%) for the 36, 90 and 180 whether copper (1976)
A/strong, weight (roughly 12, 31 or 63 mg mg/kg body weight groups respectively, compared acetate increases
groups of 10 Cu/kg body weight). Control mice with 7/19 (37%) in the control group. The average the spontaneous
males and 10 received vehicle alone (0.85% number of lung tumours per mouse (0.40, 0.56 and lung tumour
females) NaCl). Mice sacrificed 22 weeks 2.00 tumours per mouse in the low-dose, mid-dose incidence in this
after the last injection. Microscopic and high-dose groups, respectively) increased susceptible strain
examination limited to the lungs dose-dependently but was not statistically of mice
Table 11. (continued)
Protocol Results Effect level Reference
and any tissues that appeared significantly different from the control incidence
abnormal on gross examination (0.42) at any dose level. No other tumours were
of a small number of organs identified in a limited range of tissues
Copper(II) Mice given 0 or 1000 mg copper Study results inadequately reported. Survival was The group sizes Bionetics
8-hydroxy- 8-hydroxyquinoline/kg body weight apparently unaffected by the treatment were too small Research
quinoline (roughly 0 or 180 mg Cu/kg body and an inadequate Labs.
Oral weight) by gavage (in 0.5% No statistically significant increases in tumour number of doses (1968)
Mice (B6C3F1 gelatine) on days 7-28 of age, incidences were observed in either strain of mice were tested to
and B6AKF1, and then fed diets containing compared with controls assess the
groups of 18 2800 mg compound/kg diet carcinogenic
males and 18 (providing about 60 mg Cu/kg potential of copper
females per body weight per day) for remainder 8-hydroxyquinoline
strain) of the 18-month study. Extent
of microscopic examination
unclear, but certainly very limited
Unspecified Rats maintained on diets No colonic tumours occurred in rats treated only Carcinogenic Greene
copper salts containing 0.6, 25 or 100 mg with copper, while all DMH-treated rats had tumours. potential of et al.
Oral Cu/kg diet copper (equivalent to There was a significant increase (P < 0.001) in copper cannot (1987)
Rats 0.03, 1.25 or 5 mg Cu/kg body colonic tumours (3.14 ± 0.39 tumours/cm colon) in be assessed
(Sprague-Dawley, weight per day) for 25 weeks and rats fed the copper-deficient diet (0.6 mg Cu/kg from this
groups of then killed. A second series also diet) and treated with DMH, compared with rats fed study
10 males) received 16 weekly doses of a diets containing normal or high copper levels and
carcinogen (1,2-dimethylhydrazine, treated with DMH (0.74 ± 0.07 and 0.76 ± 0.08
DMH, 20 mg/kg body weight) tumours per cm colon, respectively). A greater
proportion of these tumours were malignant
(P < 0.01) in the copper-deficient group (92%
compared with 70 and 76% in the normal and high
copper groups)
Table 12. Reproductive and developmental toxicity of copper
Species Protocol Results Effect level Reference
Copper(II) Copper sulfate pentahydrate given No effects were seen on testis, epididymis or cauda No effects Hébert
sulfate in the diet for 92 days at epididymis weight, spermatid counts or sperm motility observed at 67 et al.
Oral concentrations of 0, 500, 2000 or 4000 in males of either species, at any tested dose. The mg Cu/kg body (1993)
Rats (F344/N, mg/kg. Estimated intakes 0, 8, 34 length of the oestrous cycle in females was weight per day
groups of 10 or 67 mg Cu/kg body weight per unaffected. A slight dose-related decrease was seen
males and day. Sperm morphology and in the percentage of the oestrous cycle spent in
10 females) vaginal cytology evaluated oestrus but this effect did not achieve statistical
significance (P > 0.05)
Mice Males and females given 0, 0.5, 1, Developmental malformations (including NOEL: 53 mg Lecyk
(C57BL and 1.5, 2, 3 or 4 g copper sulfate/kg hydrocephalus, encephalocoeles, and abnormalities of Cu/kg body (1980)
DBA, groups feed (approximately 0, 27, 53, 80, the ribs and vertebrae) occurred in groups of both weight per
of 7-22 106, 159 or 213 mg Cu/kg body strains given > 3 g/kg feed. C57BL stock had day
females, weight per day) for 1 month prior abnormalities in 1/55 and 3/35 live fetuses and DBA
unspecified to mating. Treatment presumably stock in 2/56 and 4/45, in the 3 and 4 g/kg feed LOEL: 80 mg
number of continued in females until sacrifice groups respectively. No abnormalities were found Cu/kg body
males) on day 19 of pregnancy in controls (65 live C57BL fetuses, 76 live DBA weight per
fetuses). Mean values for litter size, live fetuses day
and mean fetal weight were reduced in groups of both
strains given > 1.5 g/kg feed. Statistical
significance not reported, but reductions appear to
have been dose-related in some cases
Mice Mice given 0 or 6 mg Cu/kg per litre No data were presented on litter size or the incidence One dose group Kasama
(C3H/HeN as copper sulfate in drinking-water of abnormalities. Copper administration during only (effects & Tanaka
and C3H/HeJ, from day 13 of pregnancy to delivery pregnancy alone did not affect body weight or organ observed at (1988)
females, (approximately 1.6 mg Cu/kg body weights (cerebrum, liver and kidney) of the offspring 1.3-1.6 mg
numbers weight per day). Half of the within 24 h after birth, but continued copper Cu/kg body
unspecified) copper-treated animals then received administration during lactation resulted in significant weight per
5 mg Cu/kg per litre as copper sulfate reductions in neonatal body weight at 7-13 days of day)
in the drinking-water during lactation age (P < 0.05) and in the weight and protein content
(approximately 1.3 mg Cu/kg body of the cerebrum, liver and kidney of neonates at
weight per day) while the remainder 13 days of age (P < 0.05). The offspring of the
received tap water alone. Neonates copper-treated animals showed various changes
sacrificed and examined at 13 days in enzyme activity in these organs
of age
Table 12. (continued)
Species Protocol Results Effect level Reference
Mice Copper sulfate pentahydrate given No effects were seen on testis, epididymis or cauda No effects Hébert
(B6C3F1, in the diet for 92 days at epididymis weight, spermatid counts or sperm observed at (1993);
groups of 10 concentrations of 0, 1000, 4000 or motility in males at any tested dose. The length of 398 mg Cu/kg Hébert
males and 8000 mg/kg diet. Estimated intakes the oestrous cycle in females was unaffected body weight per et al.
10 females) 0, 44, 187 or 398 mg Cu/kg body weight day in males, (1993)
per day in males and 0, 52, 267 or 537 mg Cu/kg
537 mg Cu/kg body weight per day body weight per
in females. Sperm morphology and day in females
vaginal cytology evaluated
Mink Males and females given 0, 25, 50, There were no overt toxic effects in the NOEL: 6 mg Aulerich
(standard 100, 200 mg Cu/kg diet as copper copper-treated adults. No information was provided on Cu/kg body et al.
dark, groups sulfate pentahydrate developmental malformations. Kit weight at 4 weeks weight per (1982)
of 4 males (approximately 3, 6, 12 or 24 mg Cu/kg (but not at birth) was significantly reduced in the 100 day
and 12 body weight per day), for mg/kg group (P < 0.05). No such effect was evident
females) 9 months before mating and for at 200 mg/kg. Kit mortality (birth to 4 weeks) in the LOEL: 12 mg
3 months after mating 100 and 200 mg/kg groups appeared to be increased Cu/kg body
(38% and 32% compared to 12% in controls weight per
(statistical significance not reported), and in all day
treated groups litter mass (at weaning) was
reduced (statistical significance not reported), with
some evidence of a dose-related effect. An adverse
effect of copper on lactation was suggested
Copper(II) Rats given 0 or 2600 mg/kg copper An increase in relative testis weight was seen One dose group Llewellyn
acetate acetate in the diet (approximately in treated rats. No data were presented to support only (effect et al.
Oral 45 mg Cu/kg body weight per day) this statement observed at 45 (1985)
Rats for 21 weeks followed by sacrifice. mg Cu/kg body
(Holtzman, The control diet contained 18 weight per day)
groups of mg/kg copper (roughly 1 mg Cu/kg
10 males) body weight per day). Testis
weights examined at termination
Table 12. (continued)
Species Protocol Results Effect level Reference
Rats An increasing concentration (up to There were no overt signs of toxicity in the treated Only one dose Haddad
(Wistar albino, 0.185%) of copper acetate females. In the groups that continued to normal group (effects et al.
groups of 14 administered in the drinking-water delivery or were sacrificed at 21.5 days of pregnancy, observed at (1991)
treated and 6 for 7 weeks immediately prior to the number of offspring per litter and the mean fetal 65 mg Cu/kg
or 7 control mating (up to approximately 65 mg weight were similar to the values in the control groups. body weight
females for Cu/kg body weight per day). Groups External examination and serial sectioning revealed per day)
each of the sacrificed at 11.5 or 21.5 days of no malformations. Examination of the 11.5 day old
three times pregnancy, or after delivery. (It is embryos revealed significant reductions (P < 0.005)
of sacrifice) not clear whether copper acetate in mean yolk sac diameter, crown to rump length and
exposure continued during mean somite number. In the 21.5 day old fetuses
pregnancy) there was a significant reduction in ossification in 6
of the 7 ossification centres examined, while in
newborn rats only 3 centres (cervical vertebrae,
caudal vertebrae and hindlimb phalanges) showed
a similar reduction (P < 0.025)
Copper(II) 0, 1600 mg Cu/kg as copper The authors reported hypertrophy of the uteri, ovaries One dose group Harrisson
gluconate gluconate in the diet (approximately and seminal vesicles. However, in the tabled data, it only (effects et al.
Oral 0 or 82 mg Cu/kg body weight per appears that the weight of the uterus and ovaries is observed at 82 (1954)
Rats day in males and 0 or 120 mg Cu/kg reduced in females, and that the weight of the testes mg Cu/kg body
(Sprague-Dawley, body weight per day in females) for is reduced, while that of the seminal vesicles is weight per day
40-44 weeks. (Reduced amount unaffected in males. The histopathology of these in males, 120
groups of 25 fed for the first month of the tissues was evidently unremarkable. Levels of copper mg Cu/kg body
males and experiment.) Microscopic examination in liver were nearly twice as high as in rats receiving weight per day
25 females) of a limited number of organs. an equivalent dose of copper as copper(II) sulfate in females)
Study inadequately described
Copper(II) Exposure to aerosols containing The rats exposed at 19.6 mg Cu/m3 showed overt LOEL: 2.5 mg Gabuchyan
chloride 5.2 or 41.4 mg copper chloride/m3 signs of toxicity (not further described). Both Cu/m3 (1987)
Inhalation (approximately 2.5 or 19.6 mg concentrations significantly increased the incidence
Rats (white, Cu/m3) for 4 months. Functional of dead and abnormal sperm (P < 0.05) in comparison
groups of 11 state and morphology of gonads with untreated controls. Sperm motility, testis weight
or 12 exposed assessed after 2.5 and 4 months and testosterone and oestradiol levels were all
and 12 of exposure reduced in a dose-related manner, although statistical
control significance (P < 0.05) was reached only at the
males) higher concentration. Significant reductions in the
Table 12. (continued)
Species Protocol Results Effect level Reference
levels of luteinizing hormone, follicle-stimulating
hormone and prolactin were evident at the lower
concentration (P < 0.05), but no dose-response
relationship was apparent
In a limited number of studies, oral exposure of rodents to
copper compounds during gestation induced embryo/fetotoxic effects and
(at higher doses) developmental effects. Exposure to copper(II)
sulfate induced effects on neonatal body weight, and on organ weights
and biochemistry in mice at 1.3-1.6 mg Cu/kg body weight per day,
while higher doses were embryolethal to mice (at 80 mg Cu/kg body
weight per day) and to mink (at 12 mg/kg body weight per day).
Developmental effects, including delayed ossification, were induced in
rats exposed to 65 mg Cu/kg body weight per day as copper(II) acetate,
and terata were induced in mice at 159 mg Cu/kg body weight per day as
copper(II) sulfate.
7.6 Mutagenicity and related end-points
7.6.1 Copper sulfate
7.6.1.1 In vitro
The genotoxicity of most copper compounds has not been
extensively studied.
Copper (II) sulfate, when studied in strains T98, T100 and TA102
of Salmonella typhimurium with and without metabolic activity, even
at cytotoxic concentrations or the limit of solubility, did not
exhibit mutagenic activity (Moriya et al., 1983; Marzin & Phi, 1985).
A similar lack of activity was reported, at up to cytotoxic
concentrations, in the absence of a metabolic activation system in the
SOS Chromotest with Escherichia coli PQ37 (Olivier & Marzin, 1987),
in a test for reversion to streptomycin independence in E. coli
Sd4-73 (Iyer & Szybalski, 1958), in the rec-assay with
Bacillus subtilis H17 and M45 (Matsui, 1980) and in tests for
penicillin and/or streptomycin resistance in Micrococcus aureus
FDA209 (Clark, 1953).
When rat hepatocytes were incubated for 20 h with 7.9, 15.7, 31.4
or 78.5 µmol/litre copper(II) sulfate solution (the highest
concentration being moderately cytotoxic), there was a significant
increase in unscheduled DNA synthesis at each concentration in a
roughly dose-related manner. Copper was shown to have accumulated in
the nucleus at these dose levels (Denizeau & Marion, 1989).
7.6.1.2 In vivo
A single intraperitoneal injection of copper(II) sulfate
pentahydrate in mice induced a dose-related increase in the incidence
of chromatid type chromosome aberrations in the bone marrow 6 h after
dosing between 0.28 and 1.7 mg Cu/kg body weight (Agarwal et al.,
1990). Only at the highest dose tested (1.7 mg Cu/kg body weight)
were chromosomal breaks enhanced significantly. In the micronucleus
test no evidence of genotoxic activity was found in mice given a
single injection of copper(II) sulfate pentahydrate at 1.7, 3.4 and
5.1 mg Cu/kg body weight (Tinwell & Ashby, 1990). Bhunya & Pati (1987)
reported a significant dose-related increase in the incidence of
micronuclei after two injections at doses between 1.3 and 5 mg Cu/kg
body weight per injection; however, this study did not utilize a
positive control and is thus difficult to interpret.
7.6.2 Other copper compounds
7.6.2.1 In vitro
Copper(II) chloride also showed no evidence of mutagenic activity
in Salmonella typhimurium strains TA98, TA102, TA1535 and TA1537 in
the presence or absence of a metabolic activation system when studied
at concentrations up to those causing cytotoxicity (Wong, 1988). It
was similarly inactive in the rec-assay with Bacillus subtilis H17
and M45, as was copper(I) chloride (Nishioka, 1975; Kanematsu et al.,
1980).
Copper(II) 8-hydroxyquinoline showed evidence of weak mutagenic
activity in one strain (TA100) of S. typhimurium in the presence,
but not in the absence, of a metabolic activation system. No activity
was evident in four other Salmonella strains, nor in
Escherichia coli WP2 hcr, in either the presence or the absence of a
metabolizing system (Moriya et al., 1983). An earlier study reported
negative results in strains TA98, TA100, TA1535 and TA1537, with or
without metabolic activation, but the maximum concentration tested was
very low (Räsänen et al., 1977).
In Chinese hamster V79 cells, copper(II) nitrate produced
dose-related increases in the mutation frequency (resistance to
8-azaguanine) at 0.01 and 0.1 mmol/litre and in the frequency of
sister chromatid exchanges at 0.01-0.5 mmol/litre (Sideris et al.,
1988). The investigators reported an increase in the molecular weight
of DNA isolated from the cells, which was attributed to binding of the
copper ions to the DNA.
7.7 Other studies
7.7.1 Neurotoxicity
There are few studies of the neurological effects of copper
compounds. In rats, oral exposure to copper(II) sulfate in two
studies did not affect the results of behavioural tests, but did alter
brain neurochemistry. Injection of copper(II) chloride altered levels
of neurotransmitters in the brain of rats.
7.7.1.1 Copper sulfate
Dietary administration of 250 mg/kg Cu (as copper(II) sulfate
pentahydrate) to groups of six male rats for 30 days, providing 5 mg
Cu/rat per day (equivalent to about 20 mg Cu/kg body weight per day)
did not affect their locomotor activity, learning ability or
relearning capacity and memory (Murthy et al., 1981). Analysis of
biogenic amines in the brain revealed a significant increase in
dopamine and norepinephrine (noradrenaline) levels (P < 0.02).
In another study using rats loaded with copper through
administration of 0.125% copper(II) sulfate in the drinking-water for
11 months (equivalent to about 46 mg Cu/kg body weight per day), there
were no overt effects on the behaviour of the eight treated females
(de Vries et al., 1986). Neurological effects in the brain included a
disturbance in striatal dopamine metabolism (reduced levels of the
dopamine metabolite, 3,4-dihydroxyphenylacetic acid), a three-fold
increase in the affinity of D2-dopamine receptors and a 50% reduction
in the number of these receptors. Brain levels of dopamine and
noradrenaline, and that of the noradrenaline metabolite,
3,4-dihydroxyphenylethylene glycol, were unaffected in copper-loaded
animals (de Vries et al., 1986).
7.7.1.2 Copper chloride
Daily intraperitoneal injections of copper(II) chloride to 12
male rats at a dose of 2 mg Cu/kg body weight per day for 21 days
resulted in significant increases in dopamine and norepinephrine
(noradrenaline) levels in the brain (P < 0.05), while the level of
5-hydroxytryptamine in the brain was similar to that in saline-treated
controls (Malhotra et al., 1982).
7.7.2 Immunotoxicity
Only copper(II) sulfate has been tested for its immunomodulatory
effect. In studies summarized in this section, oral exposure of mice
to this compound affected measures of both humoral and cell-mediated
immune function, while inhalation adversely affected host resistance
and pulmonary macrophage activity.
7.7.2.1 Copper(II) sulfate
The administration of copper(II) sulfate in the drinking-water of
mice at 50, 100 and 200 mg Cu/litre for up to 10 weeks resulted in the
dose-related inhibition of a number of immune system parameters in two
studies. (These levels would normally be equivalent to 10, 20 or 40
mg Cu/kg body weight per day, but water consumption decreased with
increasing copper concentrations. It was reported that total copper
intake increased with increasing level, though no further detail was
provided.) At 50 mg Cu/litre, the lymphoproliferative response to
lipopolysaccharide from E. coli was depressed, while the production
of autoantibodies against bromelain-treated mouse red blood cells was
increased (Pocino et al., 1991). These parameters were also affected
at 100 and 200 mg Cu/litre, along with decreased lymphoproliferative
response to concanavalin A, and decreased antibody response and
delayed-type hypersensitivity response to sheep erythrocytes (Pocino
et al., 1990, 1991). A NOEL could not be established in these two
studies.
In an inhalation study in mice, single or repeated 3 h exposures
to copper(II) sulfate aerosol resulted in significant
immunosuppressive effects, including reduced bactericidal activity of
the alveolar macrophages to Klebsiella pneumoniae and reduced
resistance to infection by Streptococcus zooepidemicus. These
effects were evident after a single exposure at 0.28 mg Cu/m3 and
above and after 5 or 10 daily exposures at 0.06-0.07 mg Cu/m3. A
NOEL was not established in these studies (Drummond et al., 1986).
In hamsters, a single 4 h exposure to copper(II) sulfate
pentahydrate aerosol at 0.3-7.1 mg Cu/m3 resulted in reduced
pulmonary macrophage activity and volume from 3.2 mg Cu/m3 within 1 h
after exposure; no effect was observed at 0.3 mg Cu/m3 (Skornik &
Brain, 1983).
7.8 Biochemical mechanisms of toxicity
The mechanism(s) by which copper may lead to cell injury are
discussed in section 6.
8. EFFECTS ON HUMANS
8.1 General population: copper deficiency and toxicity
Copper is an essential element. Most tissues therefore have
measurable amounts of copper associated with them and, in general,
cells, tissues and organisms have mechanisms to maintain its
availability while limiting its toxicity (homoeostasis).
In most situations, if we explore the indices of function
affected by copper excess or deficit we will find altered indicators
prior to the onset of clinical signs or symptoms. In some situations
we can use the functional indicators instead of clinical signs, since
they are closely associated. The least significant manifestations in
terms of human health are the physiological changes that occur in
response to high or low copper intakes. Most of the changes observed
in these situations represent adaptive or homoeostatic mechanisms to
prevent deficit in response to low intake or prevent toxicity in
response to high intake.
8.2 Copper deficiency
Characteristic clinical features of copper deficiencies in
infants are anaemia refractory to iron, and low copper plasma levels
(Sturgeon & Brubaker, 1956). Copper deficiency has been considered the
likely cause of the anaemia, but it was not until the completion of a
series of controlled case studies of copper deficit in infants
recovering from malnutrition (Cordano et al., 1964) that the full
spectrum of copper deficiency was demonstrated. Subsequent reports
during the 1970s of acquired copper deficiency in low-birth-weight
neonates and in infants and children receiving copper-free total
parenteral nutrition, clarified the indispensable nature of copper as
an essential nutrient for humans (Widdowson et al., 1974; Shaw, 1992).
8.2.1 Clinical manifestations of copper deficiency
Clinically evident copper deficiency occurs relatively
infrequently in humans. The most consistent clinical manifestations of
copper deficiency are anaemia, neutropenia and bone abnormalities
including fractures. The haematological changes are characterized by
the existence of a hypochromic, normocytic or macrocytic anaemia,
accompanied by a reduced reticulocyte count, hypoferraemia,
neutropenia and thrombocytopenia. In a small proportion of cases there
is microcytic anaemia (Williams, 1983). Bone marrow cytological
examination reveals megaloblastic changes and vacuolization of the
erythroid and myeloid progenitors. There is also an arrest of the
maturation of myeloid precursors and the appearance of ringed
fibroblasts. These alterations are unresponsive to iron therapy but
are readily corrected by copper supplementation (Schubert & Lahey,
1959; Prohaska et al., 1985). The current prevailing view is that
anaemia in copper deficiency is due to defective iron mobilization
resulting from reduced ceruloplasmin (ferroxidase l) activity.
A summary of some reports of clinical manifestations of copper
deficiency in humans is given in Table 13. As seen clearly from the
table, many of the reports of deficiency originate in infants and
young children, particularly those with low birth weight or
malnourished after birth. Healthy infants receiving less than 0.1 mg
Cu/kg body weight per day are at risk of deficit. For those with low
birth weight or affected by protein energy malnutrition the figure is
close to 0.2 mg/kg per day. These latter conditions affect a sizeable
proportion of children at a global level. It has been estimated that
about 16% of live births or some 20 million infants per year are of
low birth weight (< 2500 g) (WHO, 1990). The presence of bone
abnormalities is very common in copper deficiency in low-birth-weight
infants and in young children (Heller et al., 1978; Danks, 1988; Shaw,
1992). These abnormalities, which mimic the changes observed in
scurvy, include osteoporosis, fractures of the long bones and ribs,
epiphyseal separation, fraying and cupping of the metaphyses with spur
formation, and subperiosteal new bone formation (Danks, 1988; Shaw,
1992). Less frequent manifestations of copper deficiency are
hypopigmentation of the hair and hypotonia (Danks, 1988; Shaw, 1992),
impaired growth (Castillo-Duran & Uauy, 1988), increased incidence of
infections (Castillo-Duran et al., 1983), and alterations of
phagocytic capacity of the neutrophils (Heresi et al., 1985). In
addition, abnormalities of cholesterol and glucose metabolism have
been reported, but are not so well established (Klevay et al., 1984,
1986; Reiser et al., 1987). Prevalence of cardiovascular disease has
been linked to high zinc and low copper in the diet but this
hypothesis has not been validated (Lukaski et al., 1988).
It has been shown that copper deficiency is associated with
increased incidence of infection and impaired weight gain in infants
recovering from malnutrition (Castillo-Duran et al., 1983;
Castillo-Duran & Uauy, 1988). The initial randomized controlled trial
included 27 infants recovering from protein energy malnutrition: 13
received 80 µg/kg per day of copper supplement for 3 months while 14
matched infants received a placebo. Plasma copper and ceruloplasmin
dropped in the placebo group, 30% of whom had low copper plasma
levels, while values rose in the supplemented group during the rapid
growth phase of recovery. The mean number of upper respiratory
infections, febrile days, and number of febrile episodes per child per
month were similar in both groups. However, seven infants presented
clinical evidence of severe lower respiratory infection (mainly
pneumonia) in the placebo group versus only one subject in the copper
supplemented group ( P < 0.025) (Castillo-Duran et al., 1983). In a
separate case control study, 11 infants identified as
copper-deficient, based on low plasma copper and low ceruloplasmin,
and 10 matched copper-sufficient infants at a similar stage of their
nutritional recovery, were supplemented with 80 µg Cu/kg, as copper
sulfate, daily for 30 days. The daily weight gain and daily energy
intake were significantly higher relative to controls in the
copper-deficient group shortly after supplementation (Castillo-Duran &
Uauy, 1988).
Table 13. Clinical copper deficiency
Subjects Study and results Reference
11 copper-deficient In a prospective case control, growth was evaluated 1 month before and 1 month after copper Castillo
infants (plasma supplementation with 80 mg/kg body weight. Weight/age and weight/length indices increased -Duran et
copper < 70 µg/litre significantly after supplementation in the copper-deficient group. Daily energy intake was al. (1988)
and ceruloplasmin significantly higher in the copper-deficient group after supplementation than it was in the control
< 200 mg/litre) and group. Daily weight gain after supplementation increased significantly in the copper-deficient group
10 control infants and the value for daily weight gain after supplementation was significantly higher than that of the
control group for the equivalent amount of time
24 males aged The subjects received diets low in copper (1.03 mg/day per 2850 kcal [12 MJ]) and containing either Reiser
21-57 years 20% of the calories as fructose or cornstarch. During the course of feeding the diets for 11 weeks, et al.
four of the subjects exhibited heart-related abnormalities and were removed from the study (1985)
(1 myocardial infarction, 2 severe tachycardia and 1 a type II second-degree heart block). There
were no changes in serum copper and ceruloplasmin. However, fructose ingestion significantly
reduced erythrocytic SOD. Repletion of the subjects with 3 mg Cu/day for 3 weeks significantly
increased SOD levels in subjects previously fed fructose but not starch. These results suggest that
the type of dietary carbohydrate fed can differentially affect indices of copper status in humans.
Copper deficiency could play a role in human heart disease
24 males aged The subjects were fed an experimental diet inadequate in copper (0.36 mg/day per 1000 kcal Reiser
21-57 years [4.18 MJ]) for 11 weeks showed significant increase in LDL cholesterol and significant decrease et al.
in HDL cholesterol when compared to either their pretest self-selected diets (0.57 mg Cu/day per (1987)
1000 kcal) or a repletion diet (1.41 mg Cu/day per 1000 kcal [4.18 MJ])
8 men aged The subjects were fed diets low in copper (0.89 ± 0.10 mg/day), for periods ranging from 105 to Milne
18-36 years 120 days. One man who was in a negative balance showed a significantly reduction in plasma et al.
copper, immunoreactive ceruloplasmin and erythrocyte SOD. Serum cholesterol was (1990)
significantly elevated by the end of the 15 week depletion. Another two men presented a slightly
negative balance and a trend to lower plasma copper and SOD. Two of four subjects tested
had impaired glucose clearance during depletion. Conclusion: intakes of below 0.9 mg/day
apparently result in signs of copper depletion in healthy adults
Table 13. (continued)
Subjects Study and results Reference
11 men aged The effects of low-copper diets on indexes of immune response were examined in 11 subjects Kelley
21-32 years during a 90 day metabolic study. Daily copper intake for the first 24 days, the next 42 days and the et al.
last 24 days of the study was 0.66, 0.38 and 2.49 mg, respectively. Feeding the diet with (1995)
0.38 mg/day was associated with a significant decrease in the proliferation of peripheral blood
mononuclear cells cultured with phytohemagglutinin, concavalin A, or pokeweed, and an increase
in the percentage of circulating B cells (CD 19+)
3 month old infant An infant with a birth weight of 1140 g fed an infant formula low in copper developed low plasma Al-Rashid
copper and ceruloplasmin, anaemia, neutropenia, apnea, metaphyseal flaring and cupping. & Spangler
These changes were reversed after copper supplementation (1971)
6 month old infant An infant with a birthweight of 1140 g fed exclusively with cow's milk presented hypocupraemia, Ashkenazi
low ceruloplasmin, sideroblastic anaemia, neutropenia, osteoporosis with blurring and cupping et al.
of the metaphyses, depigmentation of skin, enlarged and distended blood vessels of the scalp, (1973)
and hypotonia. Treatment with 3 mg Cu/day reversed these abnormalities
7 month old infant An infant receiving total parenteral nutrition (TPN) from birth to 7 months showed osteoporosis Heller
and soft tissue calcifications. Plasma copper and ceruloplasmin levels were markedly reduced. et al.
The infant died and postmortem examination showed a reduced liver copper content. (1978)
A 10 month preterm infant required TPN during the first 4 months of life because of bowel
resection at age 10 days presented hypocupraemia, anaemia, neutropenia, osteoporosis,
irregularity of the metaphyses and subperiosteal new bone formation. These changes were
reversed by the feeding of a formula containing 1 mg Cu/litre
7 month old infant A preterm infant (birth weight 2050 g) fed only powdered milk who presented a persistent Tanaka
diarrhoea, developed hypocupraemia, neutropenia, and severe anaemia. Bone radiography showed et al.
generalized osteoporosis, flaring and cupping of the metaphyses of the long bones and a fracture (1980)
of the right fibula. All these abnormalities were alleviated after treatment with copper sulfate
Two 6 month old One infant fed only cow's milk since birth presented decreased serum copper and ceruloplasmin, Levy
infants microcytic anaemia and neutropenia. Another infant fed a diet predominantly mainly of cow's milk, et al.
presented reduced concentration of serum copper and ceruloplasmin, and microcytic anaemia. (1985)
A radiological study showed increased density of the preparatory calcification areas with spur
formation at the proximal parts of the femurs. In both cases the abnormalities were recovered
after the addition of chicken, meat and vegetables
Table 13. (continued)
Subjects Study and results Reference
30 year old woman Following extensive bowel resection, a woman received parenteral nutrition not supplemented Zidar
with copper. The patient developed hypocupraemia, subnormal ceruloplasmin levels, anaemia et al.
and severe neutropenia. Following supplementation of the parenteral solution with 4 mg Cu/day (1977)
an increase in reticulocyte count, haemoglobin and neutrophils was observed
Copper deficiency is associated with altered immunity in humans
(Prohaska & Failla, 1993). Heresi et al. (1985) studied 19
hypocupraemic infants before and after 1 month of copper
supplementation. The phagocytic activity of polymorphonuclear
leukocytes increased by 30% after copper supplementation while
immunoglobulins remained unchanged. Kelley et al. (1995) described a
decrease in the proliferation of peripheral blood mononuclear cells
cultured with different mitogens in 11 men receiving a low-copper
diet.
An increased concentration of total cholesterol and low density
lipoprotein (LDL) cholesterol and a reduction of high density
lipoprotein (HDL) cholesterol concentration have been observed in
subjects fed an experimental diet low in copper (Klevay et al., 1984).
Low copper intake has also been demonstrated to diminish glucose
tolerance (Klevay et al., 1986), alter cardiac rhythm and
electrocardiogram, and modify the hypertensive response to a hand-grip
test (Lukaski et al., 1988). However, other studies have not validated
the results of changes in cholesterol and glucose metabolism.
The role of copper deficit in altered neurodevelopment has been
postulated on the basis of the high copper content of the brain,
especially of the basal ganglia. The existence of a prenatal critical
phase in central nervous system (CNS) development during which copper
deficiency can cause CNS damage has been suggested (Danks, 1988). This
could explain the severe mental deficiency associated to prenatal
tissue deficit found in Menkes disease while postnatally acquired
nutritional copper deficiency is not accompanied by neurological
abnormalities.
8.2.2 Biological indicators of copper deficiency: balance studies
The determination of the levels of copper intake which will
prevent deficiency without resulting in toxicity (homoeostasis) has
been discussed fully in section 6.3. Several of the most promising
biological indicators for copper deficiency as well as toxicity, for
example, cytochrome c oxidase, levels of LDL, ceruloplasmin and serum
copper are also discussed in section 6.3.
In view of the importance of this subject for the determination
of human health risks (deficit and excess) from exposure to copper, it
is repeated here for emphasis.
8.3 Toxicity of copper in humans
8.3.1 Single exposure
Acute toxicity due to ingestion of copper is infrequent in humans
and is usually a consequence of the contamination of beverages
(including drinking-water) or from accidental or deliberate ingestion
of high quantities of copper salts.
Numerous case reports of single oral exposures to high levels of
copper have been reported. Such exposures, including suicide attempts
with copper sulfate, have occurred in youths and adults at doses
ranging from 0.4 to 100 g Cu (Chuttani et al., 1965; Mittal, 1972;
Stein et al., 1976; Walsh et al., 1977; Chugh et al., 1977; Williams,
1982; Jantsch et al., 1985). Symptoms including vomiting, lethargy,
acute haemolytic anaemia, renal and liver damage, neurotoxicity,
increased blood pressure and respiratory rates. In some cases, coma
and death followed. There are also a number of reports of high dose
copper ingestion in beverages (35-200 mg/litre; Hopper & Adams 1958;
Semple et al., 1960).
8.3.2 Repeated oral exposures
8.3.2.1 Gastrointestinal and hepatic effects
In case reports and cross-section studies, consumption of
drinking-water contaminated with copper has been associated with
nausea, abdominal pain, vomiting and diarrhoea (Table 14). In none of
these studies have the doses of copper ingested been well
characterized. In addition, microbiological quality of the water
supplies or other contributing factors were not assessed. Also,
symptoms may have been over-reported owing to lack of blinding of
subjects.
An often cited report is that of Wyllie (1957) in which acute
gastrointestinal symptoms were reported in 10 people consuming a
cocktail contaminated with copper from the cocktail shaker. Owing to
limitations in reporting and confounding, this study is considered
inadequate to serve as a basis for characterization of concentrations
of copper which results in adverse health effects.
In a family in Vermont, USA, living at the end of a copper main,
there were recurrent episodes of gastrointestinal illness. There were
no symptoms in two other families of similar age and sex distribution
on the same street exposed to lower levels (Spitalny et al., 1984).
Symptoms ceased with a change of water source.
Knobeloch et al. (1994) reported on five investigations of
gastrointestinal upset associated with ingestion of
copper-contaminated water. Data were obtained from questionnaires on
age, weight, water use habits, duration of exposure and symptoms.
There was generally a higher incidence of intermittent or constant
symptoms of diarrhoea, abdominal cramps or nausea in those who
consumed first-draw water, in infants and young children and among
residents of newly constructed or renovated houses. In one study,
gastrointestinal symptoms occurred in 8 of 14 people ingesting 0.6-3.8
mg Cu/day from drinking-fountains (1.6-7.7 mg Cu/litre) compared with
3/26 people ingesting < 0.55 mg Cu/day from drinking-water.
Table 14. Gastrointestinal effects associated with copper in potable water or beverages
Observations Comments Reference
10 of 13 nurses experienced nausea, vomiting, diarrhoea, weakness, abdominal owing to limitations in reporting Wyllie
cramps and headache following ingestion of an alcohol lemon cocktail from and confounding (alcohol, fasted (1957)
cocktail shakers containing copper; reconstruction of the episode suggested state); unknown whether 5.3 mg
that copper ingestion varied between 5.3 and 32 mg is a LOAEL or NOAEL; study
considered inadequate to establish
effect levels
In three of four family members residing in Vermont at the end of a copper main, well-conducted study that provides Spitalny
there were recurrent episodes over 1.5 years of gastrointestinal illness 5-20 min useful information on levels of et al.
after drinking tap water in the morning (median level of copper in incoming copper in water which induce (1984)
water, 3.1 mg/litre; single maximum level 7.8 mg/litre); no symptoms in two acute effects
other families of similar age and sex distribution on the same street exposed to
lower levels (medians, 1.58 and 0.02 mg/litre); copper levels in hair significantly
higher in symptomatic family; symptoms ceased with change of water source
Three children (1-2.5 years old) with prolonged diarrhoea and weight loss limited usefulness for risk Stenhammar
exposed to tap water containing 0.22-1 mg/litre. Symptoms disappeared when assessment (1979)
water replaced with that of lower copper content
Association between the copper content in drinking water (0.35-6.5 mg/litre viral or other microbiological Berg &
in first-draw water) at 7 new Swedish kindergartens and diarrhoea in attending causes of diarrhoea were not Lundh
children < 3 years old. The symptoms disappeared when the children went studied. Limited usefulness for (1981)
home for a few days but reappeared when they returned to the kindergarten risk assessment
Five different case reports of gastrointestinal illness in individuals, families or data inadequate to establish Knobeloch
residents completing questionnaires. Higher incidence of gastrointestinal effects effect levels et al.
with first-draw water compared with flushed water (1994)
Micronodular cirrhosis and acute liver failure was described in a
case report (O'Donohue et al., 1993). A 26-year-old male consumed
copper tablets at 30 mg/day (tablet formulation unspecified) for 2
years, followed by 60 mg/day for an unspecified period, before
presenting with symptoms of liver failure. The patient had
Kayser-Fleisher rings; laboratory investigations revealed normal serum
copper (22.6 mmol/litre) and serum ceruloplasmin (0.27 mmol/litre) but
very high urinary excretion of copper (207 mmol/24 h) compared to the
normal (< 1.2 µmol/24 h). An emergency liver transplant was
performed and the patient made a good recovery. The mean copper
content of the removed liver was 3230 µg/g (normal 20-50 µg/g).
Histology resembled that of Indian childhood cirrhosis and Wilson
disease (see section 8.4).
8.3.2.2 Reproduction and development
After adjusting for confounding variables, there was no
association between the risk of spontaneous abortion in a population
of Massachusetts women exposed to copper in drinking-water (> 1
mg/litre) during 1976-1978 (Aschengrau et al., 1989). In a small
study of trace element status, there was a significant positive
relationship between placental copper and birth weight, and a negative
correlation between the copper/zinc ratio and birth weight (Mbofung &
Subbarau, 1990). These data are inadequate to assess the
reproductive/developmental effects of copper in humans.
8.3.2.3 Cancer
Epidemiological studies in which the association between copper
intake and/or levels of copper in serum and cancer has been
investigated are presented in Table 15.
In geographical/ecological studies in China (Chen et al., 1992)
and the USA (Schrauzer et al., 1977), associations between serum
copper or copper intake and some cancers were reported. However, owing
to the lack of consideration of individual exposure and confounding
factors in such studies, they contribute little to assessment of the
weight of evidence for carcinogenicity.
Interpretation of the available analytical epidemiological
(case-control or cohort) studies is complicated by the fact that
increased serum concentrations of copper could be related to
alterations in copper handling resulting from the disease state.
Available analytical epidemiological studies in which concentrations
of copper in serum were determined only following diagnosis of cancer
(Çetinkaya et al., 1988; Cavallo et al., 1991; Prasad et al., 1992;
Dabek et al., 1992) are uninformative, therefore, with respect to the
possible aetiological role of cancer in the disease. In prospective
studies where concentrations of copper in serum have been determined
prior to disease development, associations between serum copper levels
generally greater than 1.25 mg/litre and either total or breast cancer
have been observed, though there is no convincing evidence of a
Table 15. Epidemiological studies on cancer in the general population
Study protocol Results Comments Reference
A nested, matched case-control study The mean serum copper level in the When adjusted for other Coates
was conducted to compare the serum control group was 115 ± 36 µg/dl, factors which might influence et al.
copper levels of 133 cancer cases whereas the case group mean was both the serum copper levels (1989)
identified between 1974 and 1984 123 ± 37 µg/dl. The groups were split and the risk of all cancer
among 5000 members of a North into quartiles with copper serum levels sites combined (i.e.
West Washington State employee corresponding to 43-92, 93-107, occupational status, family
cohort, with 241 controls selected at 108-125 and 126-276 µg/dl. The history of cancer, cigarette
random from the same initial cohort. relative risk estimates of cancer, all smoking, alcohol consumption
Cases and controls were matched for sites combined, by quartile levels of and use of exogenous
age (in 5-year groupings), sex, race serum copper, increased steadily, with oestrogens), the relative risk
(white/nonwhite) and year and season that in the upper quartile reaching estimates did not differ
of blood sampling. 48% of the study statistical significance (RR=1.0, 1.1, 1.3 appreciably from the
population was male and 97% was and 2.4 for the quartiles and 95% unadjusted risk estimates
white. Blood had been collected in the CI=0.6-2.2, 0.7-2.7 and 1.1-5.1 for
initial study in 1972-1974 (before the 2nd-4th quartiles, respectively)
diagnosis)
A case-control study of 35 There was no difference in the serum Numbers in the individual Prasad
early-diagnosed oesophageal cancer copper levels of the cases compared tertiles were small; limited et al.
patients who had not received treatment with the controls (1.29 ± 0.03 and control for confounders; (1992)
and were attending, for the first time, 1.24 ± 0.04 mg/litre, respectively). serum analyses for copper
a cancer hospital in India. Dietary When the cohorts were analysed after diagnosis; though
habits over the preceding 6 months according to blood copper levels more cases in highest
and blood biochemical parameters corresponding to 0.75-0.99, tertile based on serum
were assessed and compared with 1.00-1.25 and > 1.25 mg/litre, copper, no difference
35 control subjects matched for age, more cases occurred in the highest between daily copper
sex, socioeconomic status, rural/urban group compared with the controls intake for cases and
residence, and chewing, smoking (20 and 13, respectively; P < 0.025). controls
and drinking habits (minimal control There was no difference between the
for confounders) daily copper intake values for cases
and controls (3.6 ± 0.64 and
3.4 ± 0.43 mg)
Table 15. (continued)
Study protocol Results Comments Reference
A 6-9 year prospective follow-up The mean levels of serum copper Kok et al.
study of an initial cohort of a Dutch were not significantly increased in (1988)
population of 10 532, aged 5 years the cancer death patients over
or more, was conducted to the end of those in the controls (1.33 mg/litre
December 1983. The serum copper compared with 1.25 mg/litre; P=0.08).
concentrations (sampled on initial For subjects in the highest serum
entry into the study) of 64 cancer quintile (> 1.43 mg/litre), the relative
death patients and 62 cardiovascular risk, adjusted for various factors,
death patients were compared with of death from cancer, was 3.7
those from randomly selected, (95% CI=1.5-9.1) compared with
sex- and age- (in 5 year intervals) the adjusted relative risk pooled
matched members of the original cohort, from quintiles 2-4 (serum copper
still alive on 31 December 1983. Each range 1.05-1.43 mg/litre). For the
case was matched with two controls. lowest serum quintile (< 1.05 mg/litre),
Cancer cases and their controls the adjusted relative risk of death
were matched for smoking status from cancer was 1.8 (95% CI=0.7-4.7)
A case-control study was conducted The mean dietary intakes of copper Results essentially negative Cavallo
on 214 patients, first diagnosed for in the control and case cohorts were but serum copper et al.
primary carcinoma of the breast and estimated to be 2.8 ± 1.1 and concentrations determined (1991)
not previously undergoing therapy, 2.7 ± 1.1 mg/day, respectively. The after admission
randomly selected among consecutive correlation between copper intake
admissions to a cancer institute in and copper blood level was examined
Milan, Italy, from May 1982 to June and was found not to be significant.
1985. Controls (N=215) were patients Both groups were split into quartiles
with a variety of diagnoses other than of dietary copper intake for
breast cancer. Dietary copper intakes comparison. No significant trend in
were estimated from dietary the OR estimates for breast cancer
questionnaires. Blood samples were were found
taken the day after admission and the
serum copper levels determined
Table 15. (continued)
Study protocol Results Comments Reference
A second set of 47 cases and 46 Mean serum copper levels were
age-matched controls from Montpellier, significantly decreased in the cases
France, which represented a when compared with the controls.
sub-sample of a larger study concerning The mean serum copper level was
diet and breast cancer, was found to be significantly higher in
investigated. Controls consisted of the cases than the controls
patients admitted, for the first time,
to neurology or neurosurgery wards.
Blood samples were taken the day after
admission and the serum copper levels
determined
When the results of the mean blood
copper levels in the two areas were
pooled, the difference between the
cases and controls was found to be
substantially less, but the mean level
was still statistically higher in controls.
When the groups were split into
quartiles of serum copper level, the
pooled ORs were not significantly
different from each other nor was there
any significant trend in values.
Adjustment for dietary zinc, which
competes in the absorption of copper,
and other elements, in particular iron,
vitamin C and raw fibre, did not allow
the correlation between copper intake
and blood level to reach significance
Table 15. (continued)
Study protocol Results Comments Reference
Serum copper and zinc levels were Mean serum copper levels increased Serum levels measured Çetinkaya
measured in 20 healthy women and from control to benign to malignant after diagnosis. No control et al.
100 women with gynaecological groups for potential confounders (1988)
tumours. 70 patients had benign and
30 had malignant genital tumours
The plasma copper The breast cancer cases were diagnosed an Adjustments were made Overvad
concentrations of a group of 46 women average of 11 years (range 1-17 years) after for possible confounding et al.
who developed breast cancer entry into the study cohort. The mean initial by known indicators of (1993)
between 1968 and 1985 were copper levels were 1.26 mg/litre in the control breast cancer, i.e. family
compared with an age-stratified group and 1.31 mg/litre in the cases (95% Cl history of breast cancer,
random sample of 138 women. for overall difference=-0.07-0.17). The groups age, age at first live birth,
Both groups were taken from an were split into quartiles corresponding to parity, weight and oral
initial cohort of 5100 ostensibly initial copper concentrations of < 1.03, contraceptive use
healthy women studied between 1.04-1.19, 1.20-1.33 and > 1.34 mg/litre,
1968 and 1975, aged 28-75 and the adjusted odds ratio for the 1.04-1.19 The authors suggest a
years and living on the island mg/litre quartile set at 1.0. The adjusted odds U-shaped risk response
of Guernsey, United Kingdom. ratios were: 1.8 (95% CI=0.6-5.4), 1.6 (95% although this is not
Plasma samples were CI=0.5-5.4) and 3.2 (95% CI=1.1-9.4) for supported by the reported
collected at the start of the the < 1.03, 1.20-1.33 and > 1.34 mg/litre results
study and on development of quartiles, respectively, with only the last
breast cancer, and the levels group reaching statistical significance
of copper analysed
Total serum copper and The serum copper concentrations did not alter The average estimated Dabek
cerulo-plasmin levels were determined significantly with time during the study year. A daily dietary copper intakes et al.
in 13 pre- and 10 significantly higher serum copper level was noted were apparently lower in (1992)
postmenopausal breast cancer patients in the premenopausal breast cancer patients the patients (1.46 mg/day)
aged 39 ± 7 and 66 ± 6 years, (mean = 18.7 ± 0.62 µmol/litre) when compared than in the normal control
respectively. The levels were with the two premenopausal control groups subjects (1.63 mg/day;
compared with those in a group (means = 16.5 ± 0.30 and 16.7 ± 0.43 µmol/litre, difference P = 0.05) and
of 14 pre- and 11 postmenopausal respectively; P < 0.03). No such difference was this could not, therefore,
omnivorous women noted in the postmenopausal patients. directly explain the results
aged 33 ± 6 and 57 ± 5 years, Postmenopausal patients showed significantly lower
Table 15. (continued)
Study protocol Results Comments Reference
respectively and with those in ceruloplasmin levels (mean = 0.309 ± 0.011 g/litre) No control for smoking
a group of 12 pre- and 11 than the corresponding control groups (means =
postmenopausal vegetarian 0.387 ± 0.013 and 0.355 ± 0.11 g/litre, The investigators concluded
women aged 34 ± 7 and respectively, P < 0.01), this being more pronounced that the high serum
59 ± 5 years, respectively who when the control groups were pooled (P < 0.001). copper/ceruloplasmin ratio
were all free of breast cancer. Again, there was no overall significant in the breast cancer patients
Fasting serum samples were change with time during the study year. may reflect disordered
collected on three consecutive The copper/ceruloplasmin ratios were higher in copper metabolism in this
days, typically four times in a year both groups of patients, these increases being disease (serum levels
significant in the premenopausal group when determined after diagnosis)
compared with the corresponding omnivorous
controls (P <0.05) and in the postmenopausal
patients when compared with both the omnivorous
(P < 0.001) and vegetarian (P < 0.01) control
groups. The ratio in the postmenopausal patients
(mean = 3.94 ± 0.096 µg/g) was significantly higher
than in the premenopausal patients (mean = 3.44 ±
0.061 µg/g; P < 0.001)
dose-response trend in this regard (Kok et al., 1988; Coates et al.,
1989; Overvad et al., 1993). Moreover, there has been no association
between intake of copper and cancer, in those few analytical
epidemiological studies in which it has been investigated (Cavallo et
al., 1991; Dabek et al., 1992; Prasad et al., 1992).
There is therefore little convincing evidence that copper plays
an aetiological role in the development of cancer in humans.
8.3.3 Dermal exposure
Sources of topical exposure to copper have come from its use in
pigments, ornaments, jewellery, dental amalgams, and IUDs, and as an
antifungal agent and an algicide. Though copper algicides are used in
the treatment of water in swimming pools and reservoirs, there are no
reports of toxicity from these applications.
Copper or copper salts may induce allergic contact dermatitis in
susceptible individuals. Signs and symptoms include itching, redness,
swelling, vesicle formation and pustulation. Patch-testing to
identify the sensitized state generally involved using covered 24-48 h
contact with 0.5-5.0% copper sulfate in water or petrolatum. Numerous
reports have been published on the allergic response to unintentional
and defined dermal exposure to copper or preparations containing
copper (Hackel et al., 1991; Nordlend & Linden, 1991; Klapheck et al.,
1994; Krolczyk et al., 1995), however, the exposure concentrations
leading to any effect are poorly characterized in most cases.
Routine patch testing of 1190 eczema patients found that only 13
(1.1%) cross-reacted to 2% copper sulfate in petrolatum. The
investigators warned of the possibility that contamination of copper
with nickel (a well-established contact allergen) might have been the
cause of the apparent reaction to copper (Karlberg et al., 1983). In
an investigation of copper and zinc status in 22 asthmatic, 21
eczematous and 19 healthy Italian children (age-matched), the
asthmatic group had higher mean values for serum and hair copper
concentrations, and the eczematous group had higher mean hair copper
concentrations, than did healthy controls. Estimated dietary copper
intakes were said to be similar for the three groups and ranged from
90 to 111% of the "safe and adequate" intakes (Di Toro et al., 1987).
8.4 Disorders of copper homoeostasis: populations at risk
Because copper is an essential metal, there are homoeostatic
mechanisms to maintain copper levels within defined limits. However,
there are a number of disorders in homoeostatic mechanisms which can
result in deficiency or toxicity from exposure to copper at levels
which are tolerated by the general population. In addition to this,
gross overexposure to copper can overwhelm the homoeostasis mechanisms
in the normal individual. The hereditary copper metabolic disorders
are Menkes disease and Wilson disease.
8.4.1 Menkes disease
Menkes disease is an X-linked recessive disorder of copper
metabolism that occurs in approximately 1 in 200 000 live births.
Clinically the condition resembles a copper deficiency state and is
characterized by skeletal abnormalities, severe mental retardation,
neurological degeneration and death in early childhood. The symptoms
of Menkes disease result from a deficiency of copper and its effects
on the function of copper-dependent enzymes.
The gene for the condition has been isolated (Chelly et al.,
1993; Mercer et al., 1993; Vulpe et al., 1993) and designated MNK.
The gene codes for a 1500-amino-acid P-type cation transporting
ATPase, with strong homology to the bacterial and yeast cation
transporting ATPases. The MNK gene also has strong homology to the
gene that is defective in Wilson disease (see section 8.4.2) (Bull et
al., 1993; Thomas et al., 1995).
Although the gene involved is widely expressed (except in liver),
and copper actually accumulates in some cells (such as fibroblasts,
kidney and placenta), the primary defect is a marked reduction in the
first phase of copper transport. Most of the copper entering mucosal
cells from the diet does not enter the portal circulation and travel
to the liver and elsewhere. As a result, in most tissues, enzymes that
depend upon copper for their functions will be inactive or have
reduced activity. This may be the reason for the diverse clinical
symptoms observed in Menkes patients. The MNK protein has structural
similarities to Mg(II), Na(I), K(I), and Ca(II) transporters from
various organisms. P-type ATPases have a conserved aspartate residue
which is phosphorylated in the course of cation transport and have
specific metal-binding sequences. The metal binding sequences are
similar to those of P-type ATPases of bacteria, characterized by a
G-M-T-C-XX-C motif. The Menkes disease and Wilson disease genes both
encode proteins with six of these metal-binding sequences in the
N-terminal half of the molecules, and multiple hydrophobic (probably
membrane spanning) sequences nearer the C-terminal. They share a 59%
amino-acid sequence identity with each other, and, respectively, share
43% and 33% identities with the bacterial transporter CopA (Solioz et
al., 1994). In Menkes disease the liver is not overtly affected,
whereas in Wilson disease the liver is the primary site of damage. The
gene for Menkes disease (also called Mc1) has been mapped to band
q13 on chromosome X (Mercer et al., 1993), and cloned, again by three
independent research groups (Mercer et al., 1993; Vulpe et al., 1993;
Chelly et al., 1993).
The primary defect appears to involve defective expression of a
transporter that transfers copper across the basolateral membrane of
intestinal mucosal cells. The transporter also may play a role in
other cells, because it is widely expressed. It seems possible that
its function might be to aid in copper efflux from cells, since Menkes
fibroblasts accumulate the metal and fail to express the MNK gene.
This may not be the case in other tissues where accumulation has not
been observed. In Menkes disease, intestinal absorption of copper, or
its transfer across the placenta to the fetus, does not totally
exclude copper from the body, since this is incompatible with life.
Some cell types in tissues such as the intestine accumulate copper
(Waldrop & Ettinger, 1990) which is subsequently lost as the
intestinal cells are sloughed. The bulk of the metal is believed to
accumulate in the Menkes-affected cell in metallothionein complexes.
The lack of copper transport across the gut is one factor in
production of a copper deficiency in most tissues. Most likely,
transporters for other metal ions can be used, at least to some
extent, for copper transfer. Nevertheless, there is a still a serious
copper deprivation in most tissues of the body, with the consequence
that copper-dependent enzymes in all areas are affected and have a
diminished function.
Lysyl oxidase has been shown to be important in cross-linking
collagen and elastin and its lack of activity may explain the
connective tissue lesions. Low levels of cytochrome c oxidase may
contribute to poor thermal regulation. Tyrosinase deficiency would be
expected to lead to hypopigmentation of the skin and hair. The pili
torti (twisted or "kinky" hair) observed in Menkes patients is related
to the cross-linking failure of keratin which is dependent on copper.
Deficiency of cytochrome c oxidase, SOD and dopamine betahydroxylase
may result in neurological degeneration, mainly by oxygen free
radicals (Bankier, 1995).
The clinical features observed in Menkes patients are a direct
result of the failure of copper to be incorporated into specific
copper-dependent enzymes (Kodama, 1993). Hence, Menkes disease mimics
a deficiency in copper. Babies with Menkes disease are often born
prematurely; and although they appear to have fine, normal-looking
hair they often have problems associated with temperature instability,
jaundice and feeding (Bankier, 1995). Many pass the developmental
milestones of head control and responsive smile, but by the age of 3
months they develop loss of head control and begin to have seizures.
They have truncal hypotonia (a condition of diminished tone of the
skeletal muscles and diminished resistance of muscles to passive
stretching) and progressive spasticity of the limbs. The hair becomes
fragile, lustreless and hypopigmented. The hair feels to the touch
like steel wool, owing to pili torti. The skin becomes hypopigmented
and hyperextensible (cutis laxa) and the joints become hypermobile
(Martin et al., 1994).
The bones are osteoporotic with flared metaphyses of the long
bones, rib fractures and possible wormian bones (small irregular bones
in the sutures between the bones of the skull) visible by cranial
radiography. In the case of severe occipital horn syndrome the main
effect is bone spurs, perhaps because of disordered connective tissue
function and neurological problems (Kaler et al., 1994). The
vasculature is tangled and elongated owing to numerous splits and
fragmentations in arterial elastic fibres and thickened intima.
Alterations in the central nervous system include severe mental
retardation, seizures and ataxia which are due to intense degenerative
changes of the brain and the cerebellum with a pronounced alterations
of the Purkinje cells (Iwata et al., 1979). Subdural and cerebral
haematoma may occur. There is progressive deterioration until death
occurs, usually by the age of 5. Urinary tract diverticulum (a pouch
or sac produced by herniation of the mucous membrane through a defect
of the lining of the urinary tract) is common.
The majority of patients with Menkes disease present with severe,
classical symptoms although individuals with milder symptoms and/or
longer survival have been observed (Haas et al., 1981; Gerdes et al.,
1988). A spectrum of mutations adversely affecting protein expression
has been observed in severely affected Menkes patients. The diseases
X-linked cutis laxa (Levinson et al., 1993; Yeowell et al., 1994),
occipital horn syndrome (Kaler et al., 1994) and milder Menkes
phenotypes result from mutations that only diminish or alter MNK
expression.
8.4.2 Wilson disease
Samuel A.K. Wilson described a disorder of the nervous system
associated with liver cirrhosis. Wilson wrote that the disease, "...is
familial, invariably fatal (and caused by) a toxin generated in
connection (with) the hepatic cirrhosis that is always found after
death" (Wilson, 1912). Following this lead in 1920, Hall concluded
that Wilson disease occurred only in individuals who inherited a
defective gene (Hall, 1921) which Bearn later showed to be recessive
(Bearn, 1960). It was not until 1948 that Cumings identified that
copper was indeed the toxin in Wilson disease, finding that the liver
and brain of patients had an extremely high content of the metal
(Cumings, 1948).
Wilson disease is the most extensively described inherited
disorder of copper metabolism. The gene is distributed worldwide,
having been demonstrated in virtually all races. Current global
estimates indicate that the incidence rate of the disease is
approximately 1 in 30 000 live births, with prevalency ranging from 15
to 30 per million. The gene frequency varies between 0.3 and 0.7%,
corresponding to a heterozygote carrier rate of slightly greater than
1 in 100.
Genetic studies from a large Israeli-Arab kindred identified a
linkage between the Wilson disease locus and the erythrocyte enzyme
esterase D, thereby establishing that the gene mutation responsible
for Wilson disease was located on chromosome 13 (Frydman et al.,
1985). Using multipoint linkage techniques, the abnormal gene for
Wilson disease was localized more specifically to 13q14-q21. In 1993,
a candidate gene for Wilson disease (WND) was reported independently
by several different groups of investigators, using slightly different
strategies for positional cloning (Bull et al., 1993; Petrukhin et
al., 1993; Tanzi et al., 1993). The WND gene consists of a
transcript of approximately 7.5 kilobases, which is expressed
primarily in liver, kidney and placenta; it has also been detected in
heart, brain, lung, muscle and pancreas, albeit at much lower levels.
The full-length cDNA sequence of the WND gene (Bull et al., 1993;
Tanzi et al., 1993) predicts a protein of 1411 amino acids which is a
member of the cation-transporting P-type ATPase subfamily, highly
homologous to the Menkes disease gene product and the
copper-transporting ATPase (CopA) found in copper-resistant strains of
Enterococcus hirae.
From sequence analysis of the cDNA, the WND protein is predicted
to possess a metal-binding domain (containing five specific binding
sites), an ATP-binding domain, a cation channel and phosphorylation
region, and a transduction domain responsible for the conversion of
the energy of ATP hydrolysis to cation transport. To date, more than
30 disease-specific mutations in the Wilson disease gene have been
identified, and it has been postulated that different mutations at
that locus may explain the clinical variability. Moreover, the
variety of mutations identified in the Wilson disease gene potentially
may affect copper transport to varying degrees, and at different
cellular sites (Schilsky, 1994). However, detailed genetic and
epidemiological studies suggest that the variability in clinical
expression observed in Wilson disease patients may not be solely a
consequence of allelic heterogeneity, since marked differences in
presentation, age of onset and disease course have been observed in
family members who have inherited two identical mutant alleles
(Walshe, 1995).
Developments in the molecular genetics of Wilson disease have
provided a means for carrier detection and early diagnosis (Sternlieb,
1993). In fact, several studies using haplotype analysis of relatives
with closely linked markers have permitted precise carrier detection
with less than 1-2% error. There also is a report of prenatal
exclusion of Wilson disease by analysis of DNA polymorphism in a
chorionic villus biopsy performed at 9 weeks gestation (Cossu et al.,
1992). Unfortunately, the use of genetic techniques in the diagnosis
of Wilson disease has significant limitations. Currently, DNA marker
studies can be performed only within families, and under circumstances
where the diagnosis has already been established definitely in at
least one family member by standard biochemical methods. The index
patient's DNA is then used as a reference to recognize the
disease-carrying chromosomes in other members of the family. However,
spontaneous chromosomal rearrangements can cause such markers to be
uninformative, thereby limiting the diagnostic reliability. These
findings indicate considerable potential difficulties for DNA-based
genetic screening, since most patients will possess alleles with two
different mutations of the Wilson disease gene (Schilsky, 1994).
Given the rapidity and accuracy of biochemical analyses in
establishing the diagnosis of Wilson disease, as well as the
aforementioned limitations of genetic testing, standard biochemical
methods should continue to be utilized in the evaluation of most
suspected cases. In addition, genetic screening of young family
members of patients afflicted with the disorder would facilitate early
diagnosis and permit initiation of therapy in the presymptomatic
state.
It is postulated that the harmful effects of excess copper are
mediated by the generation of free radicals, which deplete cellular
stores of glutathione and oxidize lipids, enzymes and cytoskeletal
proteins. Indeed, it has been shown that a number of intracellular
systems are disrupted by elevated copper concentrations, including
organellar membranes, DNA, microtubules, and various enzymes and
proteins, although the principal cellular target of copper toxicity is
unknown. In the earliest stages of hepatocellular injury,
ultrastructural abnormalities involving the endoplasmic reticulum,
mitochondria, peroxisomes and nuclei have all been identified
(Sternlieb, 1990). These changes, in conjunction with diminished
mitochondrial enzyme activities, may be important steps in the
pathophysiological events leading to lipid peroxidation and
triglyceride accumulation in the hepatocyte.
Wilson disease patients exhibit impaired biliary excretion of
copper, which is believed to be the fundamental cause of copper
overload. The prompt reversal of abnormal copper metabolism in Wilson
disease patients following orthoptic liver transplantation confirms
that the primary defect resides in the liver. It has been proposed
that the Wilson disease gene product is responsible for copper
secretion from the liver cell, either across the canalicular (apical)
membrane of the hepatocyte or into a subcellular compartment that
communicates with the bile canaliculus (Tanzi et al., 1993). The
latter is consistent with a putative lysosomal defect underlying the
diminished biliary excretion and systemic accumulation of copper
observed in patients with Wilson disease. In addition, in an animal
model of Wilson disease, the Long-Evans Cinnamon (LEC) rat, excessive
hepatic copper accumulation occurs in the setting of diminished
biliary excretion. These rodents exhibit impaired entry of copper
into the lysosomes, with normal delivery of lysosomal copper to the
bile (Schilsky et al., 1994). The LEC rat is a mutant strain of the
Long-Evans rat which spontaneously develops fulminant hepatitis at 3-4
months of age, resulting in a 40% mortality rate. Surviving animals
manifest chronic hepatic disease, low serum ceruloplasmin levels and
increased copper concentrations in the liver. Thus, the LEC rat
shares many important clinical, biochemical and histological features
with Wilson disease, and the recent availability of this animal model
will probably provide new insight into the pathogenesis of the human
disorder.
The biochemical defect which leads to the accumulation of copper
in Wilson disease is present at birth; however, clinical symptoms
rarely are observed before the age of 5 years. The initial signs of
Wilson disease are generally detected in older children, adolescents
and young adults, although case reports have documented the clinical
onset as early as 4 years. Wilson disease patients typically present
with hepatic and/or neurologic dysfunction. Less commonly, patients
present with skeletal, cardiac, ophthalmologic, endocrinologic or
dermatologic symptoms. Approximately 25% of patients have involvement
of two or more organ systems at initial evaluation, although, with the
advent of aggressive screening, there has been a significant increase
in the number of asymptomatic patients diagnosed. The clinical
manifestations of Wilson disease are summarized in Table 16.
Table 16. Clinical manifestations of Wilson disease
(hepatolenticular degeneration)
Organ system Symptoms
Hepatic cirrhosis, chronic active hepatitis, fulminant failure
Neurologic bradykinesia, rigidity, tremor, ataxia, dyskinesia,
dysarthria, seizures
Psychiatric behavioural disturbances, cognitive impairment, affective
disorders, psychosis
Ophthalmologic Kayser-Fleischer rings, sunflower cataracts
Haematologic haemolysis, coagulopathy
Renal renal tubular defects, diminished glomerular filtration,
nephrolithiasis
Cardiovascular cardiomyopathy, arrhythmias, conduction disturbances,
autonomic dysfunction
Musculoskeletal osteomalacia, osteoporosis, degenerative joint disease
Gastrointestinal cholelithiasis, pancreatitis, spontaneous bacterial
peritonitis
Endocrine amenorrhoea, spontaneous abortion, delayed puberty,
gynaecomastia
Dermatologic azure lunulae, hyperpigmentation, acanthosis nigricans
Hepatic involvement in Wilson disease tends to manifest at a
younger age (mean 8-12 years) than does neurological dysfunction, and
is nonspecific, mimicking the features of a variety of acute and
chronic liver diseases. Three major clinical patterns of liver
disease are observed: cirrhosis, chronic active hepatitis and
fulminant hepatic failure. In the early asymptomatic phase of Wilson
disease, or in the presence of inactive cirrhosis, liver tests may be
normal or only minimally elevated. In the majority of cases, hepatic
injury develops insidiously and, if untreated, pursues a chronic and
relentless course to cirrhosis. Hepatocellular carcinoma is uncommonly
associated with Wilson disease, in contrast to haemochromatosis.
An estimated 5-30% of patients with Wilson disease exhibit
clinical, biochemical and histological features similar to those
observed in chronic active hepatitis (Scott et al., 1978; Schilsky et
al., 1991). The diagnosis may be overlooked in these patients, since
a significant number, almost 50% in one series (Scott et al., 1978),
have no evidence of neurologic dysfunction or Kayser-Fleischer rings
on ophthalmologic examination. Serum ceruloplasmin levels also may be
normal in the setting of severe hepatic inflammation. It has been
estimated that Wilson disease represents the underlying aetiology in
5% of patients with idiopathic chronic active hepatitis who are under
35 years of age (Schilsky et al., 1991). A distinctive feature of
wilsonian chronic active hepatitis is the relatively modest elevations
of serum aminotransferase levels in the presence of severe
hepatocellular necrosis and inflammation.
More dramatically, Wilson disease occasionally manifests as
fulminant hepatic failure. These patients may be indistinguishable
from individuals with viral-induced hepatic necrosis, and many of the
biochemical tests used to establish the diagnosis of Wilson disease
are abnormal in patients with other forms of fulminant hepatic failure
(McCullough et al., 1983). The clinical features most suggestive of
fulminant wilsonian hepatitis include the presence of intravascular
haemolysis, splenomegaly, and Kayser-Fleischer rings. Biochemical
markers indicative of Wilson disease include relatively mild
elevations in serum transaminases despite massive hepatic necrosis,
hyperbilirubinaemia with normal or low alkaline phosphatase levels,
and a markedly elevated serum copper concentration. The serum level
of aspartate aminotransferase (ASAT) typically is higher than that of
alanine aminotransferase (ALAT), as a result of the associated
haemolysis. Although uncommonly observed in wilsonian fulminant
hepatic failure, Kayser-Fleischer rings are not pathognomonic, since
they are occasionally seen in patients with other cholestatic hepatic
disease. Liver biopsy with measurement of quantitative copper may be
helpful, although deranged clotting function may preclude this
procedure, or necessitate the transjugular approach. If a biopsy
specimen is obtained, histological evidence of cirrhosis
(predominantly micronodular) in a young patient with fulminant
hepatitis is suggestive of Wilson disease, as is an elevated hepatic
copper content. Wilson disease patients with acute hepatic failure
tend to be young and to have a fulminant clinical course, with
survival generally no longer than days to weeks unless liver
transplantation is performed. Even when transplantation is
unavailable for patients, it remains imperative to make the diagnosis
of Wilson disease for the purpose of aggressive medical therapy and
family screening.
The simplest screening procedure includes a slit-lamp examination
of the eyes, and measurement of serum ceruloplasmin and transaminase
(ALAT, ASAT) levels. If Kayser-Fleischer rings are present on
ophthalmologic examination and ceruloplasmin levels are below 200
mg/litre in a patient with neurologic signs or symptoms, the diagnosis
of Wilson disease is established. If a patient is asymptomatic,
exhibits isolated liver disease, or lacks corneal rings, the
coexistence of a hepatic copper concentration above 250 µg/g (dry
weight) and a low serum ceruloplasmin level also is sufficient to make
the diagnosis.
The normal serum concentration of ceruloplasmin is 200-400
mg/litre. Although a decreased ceruloplasmin level per se is not
diagnostic of Wilson disease, approximately 90% of all patients, and
85% of individuals presenting with hepatic manifestations of the
disease, have levels that are below the normal range.
The 10% of heterozygous carriers of the gene for Wilson disease
who manifest diminished serum levels of ceruloplasmin, yet never
develop clinical symptoms or signs of the disease, may cause
diagnostic confusion. These individuals, who represent approximately
1 in 2000 of the general population, may present a difficult
diagnostic dilemma if they fortuitously develop chronic active
hepatitis or cirrhosis (of another aetiology), thereby mimicking the
clinical, biochemical and histological features of Wilson disease.
Normal ceruloplasmin concentrations are found in up to 15% of patients
with Wilson disease and active liver involvement (Scott et al., 1978).
The urinary excretion of copper is greater than 100 µg/24 h
(normal < 40 µg/24 h) in most patients with symptomatic Wilson
disease, reflecting increased serum levels of the readily filterable
fraction of nonceruloplasmin copper.
If Kayser-Fleischer rings or neurological abnormalities are
absent, a liver biopsy for quantitative copper determination is
essential to establish the diagnosis of Wilson disease. Care must be
taken to ensure that the biopsy needle and specimen container are free
from copper contamination. The normal hepatic copper concentration
varies from 15 to 55 µg/g (0.24-0.87 µmol/g) dry liver. Virtually all
untreated patients with Wilson disease have elevated hepatic copper
levels, ranging from 250 to as high as 3000 µg/g dry liver. Values
below 250 µg/g are usually attributable to the irregular distribution
of copper in the liver, particularly in the presence of cirrhosis,
when small fragmented biopsy samples are obtained. The finding of a
normal hepatic copper concentration effectively excludes the diagnosis
of untreated Wilson disease. However, an elevated liver copper level
alone is insufficient to establish the diagnosis of Wilson disease,
since concentrations above 250 µg/g may be found in other chronic
hepatic disorders (most cholestatic conditions). In the great
majority of individuals with prolonged cholestasis, serum
ceruloplasmin concentrations are either normal or increased. The
histochemical staining of liver biopsy specimens for copper is of
little diagnostic value in patients with Wilson disease.
8.4.3 Hereditary aceruloplasminaemia
Although no defect in copper metabolism has been identified in
cases of aceruloplasminaemia, this condition is included here because
ceruloplasmin is a genetically regulated, copper-binding protein with
a role in iron metabolism (Harris & Gitlin, 1996) (see chapter 6).
Recent evidence indicates that genetic abnormalities of
ceruloplasmin synthesis occur as an autosomal recessive condition
(Logan et al., 1994). Clinical signs and symptoms in these patients
include mental confusion, memory loss, dementia, cerebellar ataxia,
altered motor function, retinal degeneration and diabetes (Miyajima et
al., 1987; Logan et al., 1994; Harris, 1995; Morita et al., 1995).
Biochemical signs are decreased serum copper levels and absent or
nonfunctional ceruloplasmin in plasma and impaired copper absorption
(Harris, 1995). Isotopic tracer studies demonstrate enhanced copper
incorporation into liver with limited release into plasma since
ceruloplasmin synthesis is absent, yet copper delivery to tissues is
preserved (Miyajima et al., 1987; Harris, 1995). In fact, copper
homoeostasis appears to be minimally affected while striking
abnormalities in iron metabolism are found.
There is a significant decrease in serum iron, normal
iron-binding capacity, markedly elevated serum ferritin and low
urinary iron excretion. Iron deposition in liver, brain, pancreas and
other tissues is markedly increased. The alterations in iron
homoeostasis are correctable by the intravenous administration of
ceruloplasmin (Ragan et al., 1969). On the basis of this evidence the
clinical symptoms are most like the result of iron overload in brain,
pancreas and other critical organs, rather than induced by a copper
deficit.
8.4.4 Indian childhood cirrhosis
Indian childhood cirrhosis (ICC) was once a major cause of infant
mortality on the Indian subcontinent (Kumar, 1984). The peculiar
epidemiological, clinical and histopathological features, the
enigmatic aetiology and the uniformly fatal outcome have baffled many
for over a century now (Achar et al., 1960; Chawla et al., 1973;
Bhagwat & Walia, 1980; Sethi et al., 1993).
Epidemiologically, the illness normally strikes between the ages
of 6 months and 3 years (Bhave et al., 1992) although it can occur up
to 5 years of age (Nayak & Ramalingaswamy, 1975). There is a male
predominance and high rates of parental consanguinity, and up to 22%
of siblings are affected.
Clinically, the onset is generally insidious (86%). In the early
stage of the disease the complaints are nonspecific such as abdominal
distention, irregular fever, excessive crying and altered appetite. In
a few children, the disease begins with jaundice, but commonly
jaundice is a late feature. In the second clinical stage of the
disease, the liver is characteristically firm with a "leafy" edge.
The progress is relentless and within a few months, the patient
progresses on to the terminal stages with jaundice,
hepatosplenomegaly, oedema and ascites. Death is usually due to
intercurrent infections or terminal hepatocellular failure leading to
haemorrhagic complications or hepatic coma.
The standard liver function tests are usually deranged but not
specific for the differentiation of early ICC from other childhood
liver disorders. Serum copper is raised significantly in ICC. The mean
serum copper values increase with the clinical progression of the
disease (Tanner et al., 1979; Sharda & Bhandari, 1984; Sethi et al.,
1993). Serum ceruloplasmin levels, however, are normal or elevated,
in contrast to Wilson disease. Hepatic copper is increased. A
hepatic copper level > 800 µg/g dry weight helps distinguish ICC from
other liver disorders occurring at this age.
Histopathology remains the cornerstone of definitive diagnosis.
(Parekh & Patel, 1972; Bhave et al., 1982, 1983). The two most
discriminatory features of ICC now recognized are typical widespread
coarse dark brown orcein staining and intralobular pericellular
fibrosis (Pradhan et al., 1983). Hepatocytic necrosis (seen in 97%)
and hyaline (66%) are also diagnostic though late features. Portal
fibrosis, inflammation and disruption of the limiting plate are seen
in most cases, but also are seen in other liver disorders and hence
are not of discriminatory value. Parenchymal fat is usually absent and
cholestasis is a late feature (Pandit & Bhave, 1983). Raised hepatic
copper, indicated by orcein staining, is seen consistently in ICC.
Intensity of orcein staining correlates significantly with the
histopathological grade of the disease (Sethi et al., 1993).
Various aetiological agents have been implicated in ICC, but none
has so far been confirmed. Tanner et al. (1983) stated that "early
introduction of copper-contaminated animal milk is of aetiological
importance", based on the observation that ICC was predominantly seen
in children who were bottle-fed rather than breast-fed, and that milk
stored in brass vessels prior to feeding became contaminated with high
levels of copper. Experimentally, boiling and storing of milk in
untinned brass vessels raises its copper concentration more than 60
times, and copper and brass vessels have been used traditionally in
some parts of India to boil and store milk and water. Although
ingestion of large amounts of copper in early infancy may be a factor
in the aetiology, it cannot fully explain the disease. Approximately
half of the patients presenting with ICC had received milk which had
been previously stored in brass vessels (Sharda & Bhandari, 1984).
In a study in India, a group of 32 children who developed
cirrhosis had a significantly higher mean value of serum copper
measured after diagnosis than a control group of 10 healthy
age-matched children. The use of brass utensils to carry, boil and
store milk occurred in only 14 (44%) of the cases, and increased serum
copper levels were not limited to these. In another 82 children
suffering from cirrhosis, liver biopsies revealed raised liver
concentrations of copper in all cases, and levels increased with the
severity of the disease (Sethi et al., 1993).
In some cases, other family members and siblings had received
milk from the same source as the ICC cases but were found to have
normal serum and urinary copper levels (Sharda & Bhandari, 1984).
Furthermore, that ICC has been seen in children who have been
breast-fed suggests that copper is unlikely to be the sole cause of
the illness (Sethi et al., 1993).
Because of the familial occurrence and high consanguinity, a
genetic aetiology of ICC has been suspected (Agrawal et al., 1979;
Sethi et al., 1993). Chandra (1976) reported a pedigree analysis
compatible with autosomal recessive inheritance. Although both serum
and hepatic concentrations increased with the severity of the disease,
the copper content is variable at the same stage of the disease.
Thus, genetic heterogeneity in ICC has been postulated (Sethi et al.,
1993).
The copper chelator d-penicillamine has been given to early ICC
patients, and histological improvement and remission in up to 65% of
patients has been claimed (Tanner et al., 1987). This is a single
study on only 29 patients; therefore, more work needs to be done to
definitely determine the role of d-penicillamine in the treatment of
ICC.
There has been a reduction of ICC in India (Bhave et al., 1992).
Whether this reduction is due to the reduction of the use of brass
vessels, or due to increasing intercaste marriages leading to genetic
dilution, or both, is yet unclear.
A similar reduction in fatal infantile liver cirrhosis in a
region of Austria has been reported (Müller et al., 1996). An
ecogenetic aetiology proposed in these conditions requiring a
convergence of a genetic predisposition with a high copper intake
could also be a prerequisite for the development of ICC. However,
whether ICC represents a specific form of infantile copper toxicosis
(ICT) or is an unrelated infantile cirrhosis is yet to be determined.
The relative importance of the role of environmental exposure to
copper and the genetic predisposition to copper accumulation have not
yet been determined.
8.4.5 Idiopathic copper toxicosis, or non-lndian childhood
cirrhosis
Scattered reports of early childhood cirrhosis similar to ICC,
referred to as copper-associated idiopathic copper toxicosis (ICT)
have appeared from some Western countries (Walker-Smith & Blomfield,
1973; Müller-Höcker et al., 1987; Adamson et al., 1992; Gormally et
al., 1994). It is unclear whether the aetiology of this disease is
the same as that of ICC as seen in India (section 8.4.4).
Müller-Höcker et al. (1987, 1988) described the first three cases in
Germany with histological and clinical features of ICC, including very
high liver copper levels. Eife et al. (1991) reported a total of 22
such cases (13 fatal) in Germany up to 1990 and attributed them to
ICT. All the families involved from Germany and elsewhere, lived in
rural areas and were supplied with soft and acidic water from private
wells using copper pipes. The exposed children were breast-fed only
briefly or not at all and their formula had been made up with well
water, presumably contaminated with copper. Details on three of the
aforementioned German cases were given by Müller-Höcker et al. (1987,
1988), Schramel et al. (1988) and Weiss et al. (1989). The water
copper levels (non-representative single values) varied from 0.4 to
15.5 mg Cu/litre. These values were not measured during the time of
exposure, but several months later. The authors attributed the
illness to copper toxicosis, possibly in connection with an unproven
genetic predisposition and/or unusual high copper exposure of the
babies via the formulas.
Müller et al. (1996) reported on the largest non-Indian series of
cases of a disease they regarded as identical to ICC or ICT.
Unfortunately they were unable to obtain liver samples to confirm high
copper values, and relied on photographs for histology to demonstrate
the similarity with ICC. In the Tyrol region of Austria between 1900
and 1974, 138 fatal cases of this cirrhosis were found. Detailed
family pedigree analysis suggested that susceptibility to the disease
was inherited in an autosomal recessive fashion and that the
copper-rich diet of the region induced the symptoms (experiments
duplicating methods of milk preparation using copper vessels suggested
copper levels of up to 60 µg/litre). Many similarly fed infants did
not develop cirrhosis. There have been no cases since 1974. The
authors speculated that this could be due to the replacement of copper
and brass vessels, although increased mobility of the population and
fewer consanguineous marriages may have diluted the gene pool reducing
the number of homozygous children. This report provides a likely
explanation for the causation and natural history of copper-associated
ICT in Austria and possibly elsewhere.
A number of case reports on childhood cirrhosis associated in
most cases with only intermediate hepatic copper levels (< 400 µg/g
dry weight) have been described worldwide, but no environmental copper
exposure was evident (Lim & Choo, 1979; Maggiore et al., 1987; Aljajeh
et al., 1994; Baker et al., 1995).
In order to test the hypothesis that ICT is an entirely
environmental condition, Scheinberg & Sternlieb (1994) reported on
three Massachusetts, USA, towns where drinking-water was known to
contain high levels of copper (8.5-8.8 mg Cu/litre on first-draw
samples after 6 h of stagnation). Between 1969 and 1991, mortality of
3000 children under the age of 6 years with liver and other diseases
were studied. During that period there were 135 deaths among the
study population but none from cirrhosis or any form of liver disease.
The sample size of this study was insufficient to fully test the
proposed hypothesis.
Fewtrell et al. (1996) reported 220 patients aged up to 7 years
with liver disease in the United Kingdom in 1991-1993. Copper
exposure in tap water was mostly below 3 mg/litre, but in 15 cases
higher levels may have occurred. In this series of patients too no
cases of ICT were detected.
A retrospective, multicentre study (Schimmelpfennig et al., 1996)
detected a total of 103 cases of early childhood cirrhosis of
different causes for the years 1982-1994 in Germany. The three cases
described in detail by Müller-Höcker et al. (1987, 1988) were not
included in this study. In only two cases were the exact conditions
of increased copper exposure reliably reconstructed and other
aetiologies of cirrhosis excluded. The concentrations of copper in
the tap water in these two cases were 9-26 mg/litre owing to specific
conditions of the individual water supplies. These concentrations may
have been the cause of one fatal case and may have led to severe liver
disease in the other. Recently a case of adult liver cirrhosis
associated with a daily copper intake of 0.5-1.0 mg Cu/kg body weight
was described (see section 8.3.2) (O'Donohue et al., 1993). Based on
these collective data, a purely environmental basis for ICT cannot be
confirmed or excluded; thus, the cause of liver injury remains
uncertain.
8.4.6 Chronic liver diseases
Copper retention occurs as a result of impaired biliary
excretion. As reviewed recently by Zucker & Gollan (1996), conditions
such as primary biliary cirrhosis, primary sclerosing cholangitis,
extrahepatic biliary obstruction or atresia, intrahepatic cholestasis
of childhood and chronic active hepatitis can lead to liver copper
levels above 250 µg Cu/g dry weight. These patients can be
distinguished from those with Wilson disease on the basis of history,
physical findings and elevated or normal serum ceruloplasmin levels.
The presence of hepatic disease requires caution in the provision of
dietary copper. Correction of biliary output in the cholestatic
condition may lead to decrease in liver copper levels (Ohi & Lilly,
1980).
8.4.7 Copper in infancy
Fetal copper metabolism is different from that in children or
adults. Neonates have high levels of copper in the liver and low
levels of serum copper and ceruloplasmin (Epstein, 1983) and elevated
levels of metallothionein that decrease after birth. After the age of
about 6 months both liver copper and serum copper levels come within
the adult range. The ratio of hepatic concentration of copper in
newborns to that of an adult human is 15 : 4 (Goyer, 1991).
Acquired copper deficiency is a clinical syndrome that occurs
mainly in infants (Shaw, 1992), although it has also been described in
children and in adults. Copper deficiency is usually the consequence
of decreased copper stores at birth (see chapter 6), inadequate
dietary copper intake, poor absorption, elevated requirements induced
by rapid growth or increased copper losses. Excretion of copper is
usually via the bile, but if renal tubular reabsorption is impaired
urinary losses may be quite high. The multiple factors that may lead
to deficiency commonly coexist in copper-deficient subjects. Copper
deficiency is more frequent in preterm infants, especially of very low
birth weight, owing to their reduced copper stores at birth given the
smaller relative size of the liver and higher requirements determined
by their high growth rate (Widdowson & Dikerson, 1964; Widdowson et
al., 1974; Dauncey et al., 1977; Sutton et al., 1985; Hurley & Keen,
1988).
Infants fed exclusively diets based on cow's milk are more prone
to develop copper deficiency because of the low copper content of milk
and limited absorption of this mineral in cow's milk. In contrast,
breast-fed infants absorb more copper; this may be due to the lower
casein content of human milk or to factors present in human milk which
enhance copper absorption (Naveh et al., 1981; Lönnerdal et al.,
1985). In developing countries, where infant feeding is often based on
cow's milk enriched with a high concentration of refined
carbohydrates, copper deficit may be more prevalent because fructose
and other refined sugars lower copper absorption.
On the basis of published information, the most common cause of
copper deficiency is insufficient copper supply during the nutritional
recovery of malnourished children (Shaw, 1992). These infants present
several factors which are frequently associated to copper deficiency:
history of low birth weight, short duration of breast-feeding, a diet
based on cow's milk and a highly refined carbohydrate, or increased
losses of nutrients due to diarrhoeal disease and frequent infections.
During nutritional recovery they grow 5-10 times as fast as normal for
their age group, thus increasing the nutrient requirement.
8.4.8 Malabsorption syndromes
Copper deficiency has been reported in subjects with
malabsorption syndromes such as coeliac disease, tropical sprue,
cystic fibrosis, partial gastrectomy or short bowel syndrome due to
intestinal resection (Williams, 1983; Rodriguez et al., 1985; Hayton
et al., 1995). Copper deficit should be suspected in infants with
prolonged or recurrent diarrhoeal episodes, abnormal bile loss,
intestinal resections, or loss of intestinal contents from intestinal
fistula (Williams, 1983; Castillo-Duran et al., 1988). Castillo-Duran
et al. (1988) evaluated the magnitude of copper loss in 14 infants
during acute diarrhoeal episodes requiring hospitalization. The
results were compared with those obtained in 15 matched control
infants. Faecal losses of copper were twice as high in the diarrhoea
group as in the control subjects. This group presented a negative
copper balance up to 7 days after hospital admission. Copper losses
were directly related to faecal weight. Furthermore, Rodriguez et al.
(1985) compared the copper status of 19 children exhibiting chronic
diarrhoea with two control groups (19 healthy and 11 malnourished
children). Plasma copper levels were 30% lower and hair copper content
decreased 3-4-fold in the group with chronic diarrhoea relative to the
control groups.
High oral intakes of zinc and iron decrease copper absorption and
may lead to copper deficiency (Prasad et al., 1978; Williams, 1983).
This phenomenon is used as a therapeutic strategy in Wilson disease
where high zinc intake (40-50 mg/day) has been demonstrated to lower
copper absorption. Copper deficiency has been also documented in
subjects receiving penicillamine or other cation chelating agents, or
high doses of oral alkali therapy which enhance copper losses
(Williams, 1983).
8.4.9 Parenteral nutrition
Patients fed with intravenous nutrient mixtures lacking
sufficient copper will develop symptomatic deficiencies after 3-12
months (Shike et al., 1981). In adults, this presents as an
iron-resistant anaemia, with a mark fall in neutrophils. In children,
as well as the haematological abnormality, there are marked effects in
bone: characteristic radiological changes, greater ease of fracture
and reduced bone age (Shaw, 1992).
It has been shown that infusion of 0.3 mg Cu/day will maintain a
70 kg adult in copper balance (Shike et al., 1981). However, in
patients with high volume fistula or diarrhoeal losses additional
copper may be needed. The adult normative requirements of 1.3 mg
Cu/day will maintain plasma copper within the reference interval and
prevent the development of deficiency disease (Shenkin et al., 1987).
An increased amount of copper may be required in patients who have
high volume fistula fluid or diarrhoeal losses.
The neonatal requirements for copper will vary according to such
factors as premature delivery and low birth weight. It has been
suggested that approximately twice as much copper is required by the
pre-term infant compared to the term infant (Shaw, 1992; WHO, 1996).
Where there is evidence of choleostasis, copper supplements in
both adults and children should be reduced or withheld and the patient
monitored for any signs of developing copper toxicity.
8.4.10 Haemodialysis patients
Copper homoeostasis mechanisms available for regulating
gastrointestinal absorption of copper are bypassed by parenteral
administration. Copper toxicity in patients on haemodialysis is not
common. In two studies of four patients exposed to poorly defined
concentrations of copper in the dialysis fluid (0.056 to > 0.11
mg/litre) headache, sweating, nausea, hypotension, stupor and coma
were reported (Klein et al., 1972; Lyle et al., 1976). Similar signs
and symptoms were reported in three patients exposed to copper
concentrations between 5.1 and 8.8 mg/litre of dialysate (Manzler &
Schreiner, 1970).
8.4.11 Cardiovascular diseases
Changes in copper concentrations have been associated with
ischaemia (Kinsman et al., 1990), as well as various cardiovascular
and cerebrovascular related problems (Peterson et al., 1990).
Reviewing the relationship between ischaemic heart disease and copper
deficiency, Sorenson (1989) found evidence that copper deficiency can
elevate blood pressure. Impaired tissue formation has been associated
with copper deficiency, particularly with the cardiovascular system
(Farquharson et al., 1989; McCormick et al., 1989; Saari & Johnson,
1990; Tinker et al., 1990). Variation in copper intake may cause
significant changes in the SOD level in certain cardiac tissue (Askari
et al., 1990).
There are some reports concluding that elevated serum copper
levels (nondietary copper exposure) are implicated in the onset of
cardiovascular disease. In two double-blind studies, groups of 7 or 8
males took a supplement of copper gluconate providing 2 or 3 mg
Cu/day, respectively, for 6 weeks. Groups of 6 males formed control
groups in each case. The data suggested that 2 and 3 mg Cu/day could
increase LDL cholesterol and total serum cholesterol, respectively.
However, the control groups showed a variability in levels that made
these findings questionable. At 3 mg Cu/day, there was an increase in
the haemoglobin level after 6 weeks (Medeiros et al., 1991). An
earlier study found no significant changes in the serum levels of
copper, zinc, magnesium, triglyceride, serum glutamic-oxaloacetic
transaminase (SGOT), gamma-glutamyl transpeptidase (GGT), lactate
dehydrogenase (LDH) or alkaline phosphatase, in a group of 7 subjects
ingesting 10 mg Cu/day for 12 weeks as copper gluconate. Both treated
and placebo groups reported nausea, diarrhoea, heartburn and back
pain. The small group sizes should be noted (Pratt et al., 1985).
In England a correlation study, with measurements made after
diagnosis of coronary heart disease, has shown higher serum copper
levels in cardiovascular disease patients (Punsar et al., 1975). A
follow-up study in the Netherlands compared the copper and zinc intake
in cardiovascular mortality; the adjusted risk of death from
cardiovascular disease showed a U-shaped pattern which was four times
higher in subjects in the highest quartile for serum copper (> 1.43
mg/litre), but a twofold excess mortality was also observed in
subjects with low serum copper (< 1.05 mg/litre) (Kok et al., 1988).
It is noteworthy that causal interpretation of these data is difficult
because the disease might have affected serum copper levels.
Furthermore, the possibility that elevated serum copper levels are the
result of preclinical disease could not be ruled out. Also,
information on vitamin C, iron status and other nutrients that are
associated with copper is not available. In another prospective
study, baseline serum copper levels were measured in 1666 randomly
selected Finnish males aged 42-60 years in 1984-1988, and the cohort
followed until December 1989. When divided into tertiles of initial
serum copper, the highest tertile experienced acute myocardial
infarction in 4.6% of the subjects, compared with 3.6% in the medium
tertile and only 0.9% in the lowest tertile. After adjustments, the
relative risks for the three groups were 4.0, 3.5 and 1.0,
respectively (Salonen et al., 1991). It should be stressed that
elevated serum copper could be a consequence rather than a causal
factor for acute myocardial infarction.
The same group of authors reported that the mean increase in the
maximal common carotid intima media thickness after 2 years was
greater in men with high serum copper concentrations, those with low
serum selenium concentrations and those with raised serum LDL
cholesterol concentrations. They concluded that there was a
synergistic effect of copper, a low serum concentration of selenium,
and LDL cholesterol concentration in atherogenesis (Salonen et al.,
1991).
The association between serum ceruloplasmin level and the
subsequent incidence of myocardial infarction and stroke were studied
in a nested case-control study in Finland. High serum ceruloplasmin
levels were significantly associated with higher future odds of
myocardial infarction but not of stroke, which support the hypothesis
that a high serum ceruloplasmin level is a risk factor for myocardial
infarction (Reunanen et al., 1992). This was consistent with the
described positive relationship between high serum copper and the
aggregation of classical risk factors (McMaster et al., 1992). Several
investigators (Taggart et al., 1986; Fraser et al., 1989) reported
that ceruloplasmin is a positive acute-phase reactant and increases in
response to injury and infection in parallel with other plasma protein
markers such as C-reactive protein.
All these observations may seem incongruous when juxtaposed with
the copper-deficiency theory (Klevay, 1975), but they are not in
conflict with the theory because high serum copper does not prove high
copper absorption. Experiments with animals reveal that the opposite
may be true (Klevay, 1988, 1992). Thus, the role of elevated serum
copper (unrelated to dietary copper exposure) in the aetiology of
cardiovascular disease remains a matter of controversy and
conjuncture.
8.5 Occupational exposure
It has been reported that occupational exposure to copper fume
results in metal fume fever (Armstrong et al., 1983) and a similar
condition has been reported from inhalation of finely ground
copper-oxide dust (Schiatz, 1949). Air concentrations capable of
producing these effects are not well defined. Schiatz (1949) reported
on conditions in a postwar factory in which ventilation systems were
inoperative. In this case, exposures were likely to be unusually high
compared to plants with adequate industrial hygiene.
Most industrial exposures are to a mixture of copper and other
contaminants, and assessing the effects of copper alone from such
studies is extremely difficult. This restricts the usefulness of much
of the data on Bordeaux mixture sprayers (Pimentel & Menezes, 1977;
Plamenac et al., 1985), from the mining and smelting of copper
(Ruoling & Mengxuan, 1990; Chen et al., 1993) and from the maintenance
of moulds in a paper mill (Srivastava et al., 1992). Copper refinery
studies are less likely to be confounded by mixed exposures. Studies
where effects could reasonably be attributed to copper are discussed
below.
A large historical prospective study of 3550 men working for at
least 1 year in the tank house of nine copper refineries in the USA
(Logue et al., 1982) provided no statistically significant evidence of
an increased risk of cancer.
Suciu et al. (1981) reported on a clinical study of workers
exposed to copper dust during the sieving and electrolysis processes.
Exposures at the time of the clinical examinations were very high,
ranging from 464 mg Cu/m3 in 1971 to 111 mg Cu/m3 in 1973 [present
widely recognized exposure limits are typically 1 mg Cu/m3 (ILO,
1991)]. Signs and symptoms studied and their occurrence included
hepatomegaly in 55.6%, digestive disorders in 10-15%, and a range of
respiratory signs and symptoms. Normal serum copper values in
unexposed workers were reported as 0.76-1.17 mg/litre. In 1970-1973,
the proportion of workers with serum copper above the normal range
increased from 40% to 92%. Using a number of assumptions, absorption
of copper can be estimated as being in the range of 200 mg/day. The
absence of control data and information on methods used for measuring
exposure severely limit the usefulness of this study (Suciu et al.,
1981).
In another study, Gleason (1968) reported symptoms similar to the
common cold with sensations of warmth and stuffiness of the head in
workers polishing copper plates using an aluminium oxide abrasive on
buffing wheels. Air samples in front of the buffing wheel were
reported at 0.12 mg Cu/m3 but at times estimated to be a factor of
2-3 times higher. Microscopic examination indicated the particulates
to be metallic copper rather than copper-oxide dust.
No adequate studies were found on the effects of occupational
exposures to copper on fertility or fetal development.
9. EFFECTS ON OTHER ORGANISMS IN THE LABORATORY AND FIELD
9.1 Bioavailability
Copper usually has limited bioavailability in environmental
media, and this needs to be carefully considered in all assessments of
its environmental impacts. Bioavailability refers to the degree to
which total chemical in the environment (e.g. water, sediment, food
items) can actually be taken up by organisms (Rand & Petrocelli,
1985). The more bioavailable a chemical is, the greater the potential
for toxicity or bioaccumulation. Bioavailability can be affected by
the speciation of a chemical (i.e. certain species will be more or
less able to interact with and pass through the absorptive surfaces of
organisms), but can also be affected by other physicochemical
properties of the media which regulate uptake of chemicals.
9.1.1 Bioavailability in water
A large body of environmental literature demonstrates that
bioavailability is generally poorly related to the concentration of
total metal in water. Major factors reported to limit copper
bioavailability are adsorption to suspended particles, complexation by
dissolved organic matter and complexation by some inorganic ligands
such as carbonate (Sunda & Guillard, 1976; Brungs et al., 1976; Allen
& Brisben, 1980; Giesy et al., 1983; Borgmann & Ralph, 1983, 1984;
Borgmann & Charlton, 1984; Meador, 1991; Verweij, 1992; Erickson et
al., 1996). Copper toxicity is usually found to decrease with
increasing water hardness, possibly because calcium and copper compete
for adsorption sites on biological surfaces, so that greater calcium
concentrations will limit copper adsorption (Zitko & Carson, 1976;
Howarth & Sprague, 1978; Chakoumakos et al., 1979; Miller & Mackay,
1980; Pagenkopf, 1983). Copper toxicity has also been reported to be
affected by pH, which may be due either to hydrogen ion affecting
copper speciation or to the interactions of copper with biological
surfaces (Howarth & Sprague, 1978; Miller & Mackay, 1980; Borgmann,
1983; Meador, 1991; Erickson et al., 1996).
Particular attention has been paid to the possibility that the
principal bioavailable species is the free copper (cupric) ion.
Several studies have shown a close correlation of copper toxicity to
cupric ion activity as the concentrations of organic ligands vary
(Sunda & Guillard, 1976; Allen & Brisbin, 1980; Meador, 1991; Verweij
et al., 1992). However, other studies have shown that this
correlation is not always good for some organic ligands and organisms
(Giesy et al., 1983; Borgmann & Charlton, 1984; Borgmann & Ralph,
1983, 1984; Erickson et al., 1996). In fact, certain hydrophobic
copper complexes appear to have high bioavailability (Ahsanullah &
Florence, 1984). Studies which evaluated the effect of pH on copper
toxicity also do not show a close correlation of toxicity with cupric
ion activity (Borgmann 1983; Meador, 1991). Toxicity on the basis of
cupric ion will also vary with varying water hardness, although if
this is due to competitive interactions it does not contradict the
notion that cupric ion is the principal bioavailable species. More
information and analysis regarding the "free ion activity model" for
metal toxicity and metal bioavailability is provided in a review by
Campbell (1995).
The bioavailability of Cu(I) has been largely ignored since
soluble or complexed forms of Cu(I) have not been thought to occur in
significant amounts in aerobic environments. However, studies by
Moffett & Zika (1987) speculate that Cu(II) can be directly or
indirectly reduced to Cu(I) by photochemical processes. If this
should occur in seawater, chloride ions might stabilize the Cu(I)
through complex formation.
Whatever the mechanisms, bioavailability can vary widely and must
be considered in any interpretation and application of toxicity data
such as those presented later in this chapter. Additional
consideration must be given to the condition of organisms and any
physicochemical exposure conditions which affect organism
susceptibility without affecting bioavailability, such as temperature
and sodium concentrations (Erickson et al., 1987, 1996). Some
empirical strategies exist for doing this. The US EPA water quality
criteria for copper (US EPA, 1984) are adjusted for hardness, based on
regression analysis of studies in which toxicity was evaluated at
various hardness levels. This addresses only some aspects of
bioavailability, and EPA procedures allow for criteria to be modified
based on toxicity tests in site water which evaluate bioavailability.
Welsh et al. (1993) provide empirical equations for the effects of pH
and organic carbon on the acute toxicity of copper to fathead minnows.
Erickson et al. (1987) proposed similar equations for several
physicochemical factors affecting acute copper toxicity. Such
empirical approaches have considerable utility, but can be expensive
to develop. Some recent research has introduced predictive models
which are more mechanistically based and have a potential for
providing better extrapolations.
9.1.1.1 Predicting effects of copper on fish gill function
Gills of freshwater fish have two important physiological
functions; transport of gas (oxygen, carbon dioxide, ammonia) and
uptake of active ions (sodium, calcium) (Wood, 1992; Playle, 1997). At
environmentally realistic levels for anthropogenically contaminated
waters, metals exert their toxic effects by binding to these sodium
and calcium pump-associated ligands in a highly specific fashion,
thereby inhibiting the inward transport of the essential nutritive
ions. These ligands are, therefore, the proximate receptors for the
metals; the free cationic forms of the metals are the most potent in
binding to these receptors. For cupric and cadmium ions, strong
relationships between the gill metal burden and mortality have been
determined experimentally (MacRae et al., in press). Thus, it may be
possible to predict toxicity from gill metal burden for these two
metals and potentially other cationic metals.
Viewed in the above context, the specific receptor ligands on the
gill are entirely analogous to other anionic ligands in the water
column which may also bind the cationic metal - for example chloride,
hydrogen carbonate and dissolved organic carbon (DOC) - and indeed the
gill ligands will compete with these natural ligands for the metal
(Playle et al., 1993a,b). The final metal partitioning will depend in
part on the affinities and numbers of natural ligands relative to gill
ligands. Naturally occurring cations in the water column (e.g.
sodium, calcium, hydrogen) will compete with the metal for both the
natural anionic ligands and gill receptor ligands. Aquatic
geochemical speciation programs such as MINEQL+ and MINTEQA2
(Allison et al., 1991; Schecher & McAvoy, 1992) are specifically
designed to deal with these competitive interactions and can be used
to produce accurate equilibrium models of the metal partitioning among
the various ligands in the water, provided the water chemistry is
known. At present, these programs do not contain binding constants
for the gill receptor ligands and therefore deal only with
partitioning within the water column. However, they allow the user to
add constants for other ligands at will. A problem with these
modelling approaches is that the biomembrane-water interaction is
treated as an equilibrium situation, whereas it is, in fact, a dynamic
reaction and kinetic factors (rate constants) should also be taken
into account.
Recently, methods have been developed to determine conditional
equilibrium binding constants of copper and other metals to the gill
receptor ligands (Janes & Playle, 1995). In brief, these involve
experimental determination of equilibrium gill metal burden after
exposure of the fish (3 h) to environmentally relevant levels of the
metal in the presence of various concentrations of natural and/or
synthetic ligands with known metal-binding constants. Analogous
competition experiments can be run in the presence of various
concentrations of natural cations to determine the conditional binding
constants of the gill receptors for such cations. These constants can
then be added into chemical speciation calculation programs to make a
prediction of gill receptor loading with metal, and therefore
toxicity, in any water with known chemistry.
The advantages of this predictive modelling approach include the
following:
* it is mechanistically based
* for the first time in aquatic toxicology it allows estimation of
metal dose at the receptor surface directly associated with
toxicity
* it takes all important water chemistry factors into account (not
just hardness, for example)
* it can deal with multiple metals simultaneously.
This approach to modelling toxicity allows for flexible,
site-specific criteria based on the known chemistry of the receiving
water and the known chemistry of the gill surface. This approach is
also currently being investigated for freshwater invertebrates.
9.1.2 Bioavailability of metals in sediments
Determining the bioavailability of metals sorbed to sediments is
a key to understanding their potential to accumulate in aquatic
organisms and to induce toxic effects. Considerable published data
indicate that total metal concentrations on sediments are not a good
estimator of the bioavailable fraction of the total chemical present
(Ruiz et al., 1991; DeVevey et al., 1993; Allen & Hansen, 1996).
Total metal concentrations in sediments which produce toxic effects
can differ by a factor of 10-100 for different sediments. In order to
assess the potential for toxicity based on chemical measurements, the
bioavailable fraction of the total metal present needs to be
estimated. A number of approaches to determining metal
bioavailability associated with sediments have been evaluated,
including carbon normalization and sorption of metals in oxic
freshwater sediments to particulate carbon and the oxides of iron and
manganese (Jenne, 1987).
Recently, the dominant role of the sediment sulfides in
controlling metal bioavailability has been demonstrated (DiToro et
al., 1990, 1991; Ankley et al., 1991). Sulfides are common in many
freshwater and marine sediments and are the predominant form of sulfur
in anaerobic sediments (usually found as iron sulfide). The ability
of sulfide and metal ions to form insoluble precipitates with water
solubilities well below the toxic threshold of dissolved metal is well
known (DiToro et al., 1990). This accounts for the lack of toxicity
from sediments and sediment pore waters even when high metal
concentrations are present (Ankley et al., 1991). The same authors
have shown that the solid-phase sediment sulfides that are soluble in
weak cold acid, termed acid volatile sulfides (AVS), are a key factor
in controlling the toxicity of heavy metals (copper, cadmium, nickel,
lead, zinc). Toxicity due to these metals is not observed when they
are bound to sediment and when, on a molar basis, the concentration of
AVS is greater than the sum of the molar concentrations of metals.
When the ratio of the sum of the simultaneously extracted metals to
AVS concentration exceeds 1.0 on a molar basis, toxic effects due to
metals may be expressed, if the metal(s) are not complexed by other
ligands. The key concept here is that the metal : AVS ratio can be
used to predict the fraction of the total copper concentration present
in sediment that is bioavailable.
Limitations to the AVS : metal ratio approach occur when the AVS
concentration is low. This could occur in fully oxidized sediments.
Most sediments have at least a small zone where the sediments are oxic
near the sediment-water interface. The importance of this zone has
been demonstrated for copper relative to AVS and accumulation of
copper in midge (Chironomus tentans) (Besser et al., 1996). In
these situations, other phases (i.e. iron and manganese oxides,
dissolved organic carbon and particulate organic carbon) can play an
important and more dominant role in determining the bioavailability of
copper. The available data suggest that AVS concentrations may be
sufficient in both freshwater and marine ecosystems to be the dominant
sorbing phase for copper and other metals, except in fully aerobic
sediments.
9.2 Essentiality
Copper is an essential element for all biota. Copper was
identified in plant (Bucholtz, 1816; Meissner, 1817) and animal
(Sarzeau, 1830; Harless, 1847) systems in the nineteenth century and
postulated to be a biological catalyst in the early twentieth century
(Fleurent & Levi, 1920; Guerihault, 1920). Subsequent nutritional
studies demonstrated that copper and other metals were necessary for
optimal growth of plants and animals (McHargue, 1925, 1926, 1927a,b;
Arnon & Stout, 1939; Woolhouse, 1983). Copper was shown to be an
essential element for animals by Hart et al. (1928) who demonstrated
that copper, as well as iron, is necessary to prevent anaemia in rats.
Copper is also essential for the utilization of iron in the formation
of haemoglobin (Friberg et al., 1979); hence its involvement in
anaemia.
9.2.1 Animals
To satisfy their internal metabolic demands, all species in a
given habitat are adapted to the natural concentration range of
essential elements. Therefore, laboratory-generated no-observed-effect
concentrations (NOECs) substantially below the natural background
concentration of copper require further attention as they appear to
violate evolutionary principles. This may be explained by the concept
of the optimal concentration band of essential elements (OCEE). This
concept is well known in the field of ecotoxicology of essential
elements, but has not so far been accommodated in the regulatory
context. Thus although ecotoxic at high concentrations, copper may
also be limiting or cause symptoms of deficiency at low ambient
bioavailable concentrations.
Most crustaceans and molluscs possess the copper-containing
haemocyanin as their main oxygen-carrying blood protein. Haemocyanin
doubles their requirement for copper compared to other invertebrates
(Hopkin, 1993).
White & Rainbow (1985) calculated theoretical estimates for the
minimum metabolic requirements of copper in molluscs and crustaceans.
Enzymatic requirements for both groups were estimated to be 26.3 mg
Cu/kg (dry weight). The possession of haemocyanin as a respiratory
pigment adds a further nonenzymatic metabolic requirement of 125 mg
Cu/kg for certain gastropod molluscs and 57.4 mg Cu/kg for some
crustaceans such as decapods. However, Depledge (1989) recalculated
the amount of copper required by decapod crustaceans to be 82.8 mg/kg
(dry weight). Hopkin (1993) estimated that terrestrial isopods
require a minimum whole-body concentration of 50 mg Cu/kg. Evidence on
copper concentrations of certain decapod crustaceans in the deep sea
suggests that circumstances exist where there is insufficient
bioavailable copper for the decapods to meet all their metabolic
copper requirements (Rainbow, 1988). Small specimens of the
mesopelagic caridean Systellaspis debilis, for example, have low
copper concentrations (30 mg/kg dry weight), body concentrations
reaching only 100 mg/kg in large adults. According to the theoretical
calculations of Depledge (1989) the smaller S. debilis would only
have sufficient absorbed copper to match enzymatic needs, whereas
larger adults have sufficient copper for haemocyanin requirements as
well. This is indeed the case; Rainbow & Abdennour (1989) found that
small S. debilis contained little, if any haemocyanin, large animals
containing a more typical haemocyanin complement. Moreover, juvenile
S. debilis undertake limited vertical migrations. This may be
related to the shortage of haemocyanin in juveniles, indicating that
insufficient bioavailable copper in the mesopelagic environment may
limit activity levels until sufficient copper has been accumulated to
allow the synthesis of increased haemocyanin concentrations. Ambient
copper availability in the deep ocean is so low that levels of copper
in juvenile crustaceans are a reflection of copper deficiency. Any
such deficiency is only overcome in adults which have had sufficient
time to accumulate body copper concentrations meeting all metabolic
requirements.
Analysis of concentrations of copper in invertebrates from
uncontaminated sites suggests that some terrestrial invertebrate
species may be copper deficient (Hopkin, 1993). In mammals,
molybdenum has been shown to influence the tissue and blood levels of
copper. Copper deficiency may occur in mammals when the intake of
molybdenum is excessive (Friberg et al., 1979). This is thought to be
due to the formation of copper molybdate.
Problems related to copper and molybdenum metabolism have been
widely reported in grazing domestic livestock, and there are some
reports of concern for wildlife (Ward & Nagy, 1976; Flynn et al.,
1977; Robbins, 1983). The metabolism of copper, molybdenum and
inorganic sulfate is extremely complex and interrelated (Underwood,
1977). The interactions of copper and molybdenum can result in two
toxic scenarios; excess copper-deficient molybdenum, or deficient
copper-excess molybdenum. In the presence of inorganic sulfur it is
impossible to delineate between the toxicity of one and deficiency of
the other (Buck et al., 1976). Deficiency or excess of copper and
molybdenum are most prominent among ruminants and directly related to
copper-molybdenum balance in soil and forage.
King et al. (1984) examined copper and molybdenum levels in
white-tailed deer from a uranium-mining district of Texas, USA, where
molybdenosis was reported in cattle. Liver copper levels ranged from
0.47 to 0.94 µg/g in all samples, and there was no difference between
mined and unmined areas. Only 1 deer of 36 examined contained
detectable levels of molybdenum. The authors suggest that 6 deer with
liver copper levels < 1.0 µg/g were probably suffering from copper
deficiency that was not molybdenum-induced. Keinholz (1977) reported
that mean copper and molybdenum levels in liver of deer from a
molybdenum mining area were 40 and 1 µg/g, respectively, above control
levels.
Ward & Nagy (1977) demonstrated that mule deer were able to
withstand much higher dietary levels of molybdenum (1000 µg/g) than
domestic livestock. The authors point out, however, that the diet
used was a pelleted concentrate which may have affected availability
of molybdenum to the deer. They did observe that mule deer rejected
feed with excess molybdenum. The ability of wildlife to select feeds
low in molybdenum would reduce the chances of toxicity.
A copper deficiency in moose on the Alaskan Kenai peninsula
impaired hair and hoof keratinization, and reduced reproduction (Flynn
et al., 1977). Adult females in the Kenai moose population had a 53.5%
pregnancy rate compared with 91.6% for moose in another area of
Alaska. Copper levels in the moose browse (5.7 µg/g) are considered
marginal for domestic livestock. Examination of tissue molybdenum and
sulfur levels led the authors to believe that the copper deficiency
was not molybdenum induced (Flynn et al., 1976).
Aulerich & Ringer (1976) showed that addition of 25 or 50 µg Cu/g
to the diet stimulated growth of young mink (dark ranch phase). Up to
200 µg Cu/g in the diet had no effect on adult mink reproduction but
there was increased kit mortality at this level (Aulerich et al.,
1982). Liver copper levels increased in proportion to dietary levels,
but supplemental copper had no effect on the concentration of zinc or
iron in mink liver. The acute (21-day) LC50 (intraperitoneal
injection) of copper sulfate and copper acetate in adult mink was 7.5
and 5.0 mg/kg, respectively (Aulerich et al., 1982).
There is a marked difference between species in their ability to
tolerate high levels of copper. Levels that are toxic to ruminants
(30-50 µg Cu/g) are well tolerated by nonruminants. A difference in
the rate of copper absorption from the diet between ruminants and
nonruminants may partially explain the difference in sensitivity (Buck
et al., 1976). Rats, swine and mink can tolerate up to 200-250 µg
Cu/g in the diet (Aulerich et al., 1982).
There is also some indication that the source or quality of
dietary protein may be a factor in copper toxicity. Suttle & Mills
(1966) observed severe copper toxicosis in swine receiving whitefish
meal but not in those receiving soybean-oil meal, with both diets
containing up to 425 µg Cu/g. It is also possible that the effects of
dietary protein source on copper toxicity are related to their
concentrations of elements such as zinc and iron, both of which have
been shown to protect swine from the adverse effects of high (250-750
µg/g) levels of dietary copper (Ritchie et al., 1963).
9.2.2 Plants
9.2.2.1 Aquatic plants
Copper must be provided as a micronutrient (as copper chloride or
copper sulfate) in the culture media for growing algae (McLachlan,
1973). Copper participates, as part of the plastocyanin molecules, in
the electron transport during photosynthesis, and as co-factor in a
number of enzymatic reactions and metabolic pathways (Bidwell, 1979;
De Boer, 1981; Lobban et al., 1985).
9.2.2.2 Terrestrial plants
Copper is an essential micronutrient for normal plant nutrition
(Woolhouse, 1983; Marschner, 1986; Fernandes & Henriques, 1991;
Larcher, 1995), because this element is constituent of a number of
plant enzymes (Adriano, 1986; Fernandes & Henriques, 1991), some of
which are listed in Table 7. Copper is required in small amounts:
5-20 mg/kg in plant tissue is adequate for normal growth (Nriagu,
1979; Clarkson & Hanson, 1980; Howeler, 1983; Stevenson, 1986), less
than 4 mg/kg is considered deficient (Robson & Reuter, 1981; Howeler,
1983; Marschner, 1986) and more than 20 mg/kg is considered toxic
(Stevenson, 1986). However, depending on the plant species, plant
organ, developmental stage, and nitrogen supply, these ranges can be
larger (Thiel & Finck, 1973; Robson & Reuter, 1981). Adriano (1986)
reports a variety of soil types which are deficient in copper for
normal plant growth including peat and muck soils, alkaline and
calcareous soils, highly leached sandy and acid soils, and soils
heavily fertilized with nitrogen, phosphorus or zinc. Zinc is
expected to serve as an uptake competitor. Typical visible symptoms
of copper deficiency are stunted growth, distortion of young leaves,
necrosis of the apical meristem, and wilting and bleaching of young
leaves (Rahimi & Bussler, 1973). Copper deficiency results in
insufficient lignification of the cell walls of the xylem vessels
(Rahimi & Bussler, 1974; Pissarek, 1974) indicating that the degree of
lignification is a good indicator of nutritional copper status in
plants.
9.3 Toxic effects: laboratory experiments
Since copper is an essential metal for aquatic and terrestrial
organisms, care must be taken when interpreting toxicity test results.
For all organisms there will be an optimum concentration range, with
copper being toxic or deficient above or below this optimum range. A
wide variety of factors will influence this optimum range including
previous exposure, test conditions and species sensitivity.
9.3.1 Microorganisms
9.3.1.1 Water
Dutka & Kwan (1981) reported a 15-min Microtox EC50 at 3800 µg
Cu/litre. Microtox EC50 (15 min) values were reported at 1200
µg/litre for a copper chloride solution and at 600 µg/litre in sewage
(Codina et al., 1993). Blaise et al. (1994) calculated 5-, 15-,
30- and 60-min EC50s in Microtox tests to be 1100, 150, 70 and 60 µg
Cu/litre, respectively. Carlson-Ekvall & Morrison (1995) report that
the 30-min EC50 for Photobacterium phosphoreum was 136 µg Cu/litre.
The toxicity of copper in the presence of various organic substrates
identified in sewage sludge was found to vary from < 20 µg/litre for
ethyl xanthogenate to > 500 µg/litre for tannic acid.
Codina et al. (1993) calculated copper EC50 values for two
Pseudomonas fluorescens growth inhibition tests, a baker's yeast
(Saccharomyces cerevisiae) test, a respiratory inhibition test with
baker's yeast and a respiratory inhibition test with P. fluorescens.
The EC50 values were 51.7, 48.7, 73.2, 78.8 and 150.9 mg Cu/litre,
respectively.
Berk et al. (1985) calculated a 15-min EC50, based on inhibition
of ciliate chemotactic response, to be 150-160 µg Cu/litre for the
freshwater ciliate Tetrahymena sp. Copper concentrations of 5 and
50 µg/litre were found to be significantly inhibitory to chemotactic
responses of the marine ciliates Miamiensis avidus and Paranophrys
sp., respectively.
In a static test system Schafer et al. (1994) exposed the
freshwater ciliate Tetrahymena pyriformis to copper. They
calculated 48-h and 96-h EC50s, based on growth inhibition to be
8.017 and 10.18 mg Cu/litre, respectively; NOECs were 3.563 and 3.818
mg Cu/litre, respectively.
Madoni et al. (1992) isolated seven ciliate species from the
activated sludge of a sewage treatment works. The 24-h LC50s ranged
from 1.45 µg Cu/litre for Blepharisma americanum (free-swimming
form) to 64 µg Cu/litre for Euplotes affinis (a crawling form).
Madoni et al. (1994) isolated a further two ciliates
(Spirostomum teres and Drepanomonas revoluta) and found 24-h
LC50s to be 3.51 and 1.75 µg Cu/litre, respectively.
Tijero et al. (1991) studied the effect of copper on an anaerobic
digester system. A concentration threshold of 20 mg Cu/litre was
reported, and a 50% reduction in digester yields was found at a copper
concentration of 40 mg/litre.
Isolda & Hayasaka (1991) studied the effect of copper (20 and
1000 mg/litre) on the microbial processes in pond sediment for 4
weeks. Copper had no significant effect on glucose mineralization,
nitrogen fixation or dehydrogenase activity. Methanogenesis was
significantly reduced at both copper concentrations and the highest
exposure significantly reduced phosphatase activity.
Flemming & Trevors (1988) studied the effect of copper on nitrous
oxide (N2O) reduction in anaerobically incubated freshwater sediment
at 15°C. A concentration-dependent decrease in sediment pH and a
significant decrease in nitrous oxide reduction were observed at
copper concentrations ranging from 500 to 5000 mg/kg. However, when
copper-amended microcosms were pre-incubated to allow the sediment pH
to return naturally to pH 7.1, an inhibitory effect on nitrous oxide
reduction was only observed at 5000 mg Cu/kg.
Martínez et al. (1991) calculated the 60-min EC50, based on
3H-thymidine incorporation (a measure of bacterial heterotrophic
activity), to be 32 µg Cu2+/litre for naturally occurring bacteria
from the river Rhone (Mediterranean Sea) plume. Tubbing et al. (1995)
found EC50s, based on 3H-thymidine and 3H-leucine incorporation and
proteolytic activity, to be 28-100, 28-90 and 585-1997 µg Cu/litre,
respectively.
Schreiber et al. (1985) exposed the marine bacterium
Vibrio alginolyticus to copper under aerobic and anaerobic
conditions. The copper concentration at which there was a 50%
reduction in heat production (TC50) was used to compare the toxicity
under aerobic and anaerobic conditions. Copper was more toxic to the
bacterium in anaerobic culture (TC50 = 133 µg/litre (2.1 µmol/litre))
than in aerobic culture (TC50 = 406 µg/litre (6.4 µmol/litre)). The
addition of organic chelators (EDTA and nitrilotriacetic acid)
protected the anaerobic cultures from the toxic effects of copper,
indicating that copper-organic complexes are not toxic to the
bacterium.
9.3.1.2 Soil
Toxicity of copper to soil microorganisms is summarized in Table
17.
Chang & Broadbent (1981) calculated the threshold (EC10) and
EC50 concentrations, based on the inhibition of carbon dioxide
production in a silt loam soil amended with alfalfa and sewage sludge,
to be 4.2 and 22 mg/kg (65.6 and 347 nmol/g) for DTPA-extractable
copper (bioavailable copper).
Rogers & Li (1985) incubated soil for 6 days in the presence of
copper. EC50s, based on inhibition of soil dehydrogenase activity,
were 29 mg Cu/kg for soil enriched with 1% alfalfa and 53 mg Cu/kg for
soil that was not enriched.
Lighthart et al. (1983) measured soil microbial respiration in
five soil types after treatment with copper. After a 45-day
incubation at 20°C the lower level treatments (3.2 and 32 mg Cu/kg,
0.05 and 0.5 mmol/kg) had little effect, with mean inhibitions of less
than 20%. Higher levels of 320 and 3200 mg Cu/kg (5 and 50 mmol/kg)
inhibited respiration by up to 35% and 60%, respectively. Bremner &
Douglas (1971) report that copper concentrations of 50 mg/kg inhibited
soil urease activity by 13-16% following a 5-h incubation period.
Doelman & Haanstra (1984) found that short-term (2 weeks)
exposures to copper (150-8000 mg/kg) caused decreases in the rate of
soil respiration. Long-term (up to 18 months) exposure was less clear
cut. In sand there was a significant decrease at copper
concentrations of 400 mg/kg and in sandy peat there was a significant
decrease at 1000 mg/kg. The effect of copper in silty loam and clay
was less apparent with a significant decrease and increase at 8000
mg/kg for the two soil types, respectively. Doelman & Haanstra (1986)
calculated EC50s, based on inhibition of soil urease activity. After
6 weeks EC50s were 260, 570, 1370 and 4200 mg Cu/kg for sand, sandy
loam, clay and sandy peat, respectively, and after 18 months they were
680, 1990, 1080 and 1970 mg Cu/kg, respectively.
Table 17. Toxicity of copper to soil microorganisms
Organisms Parameter End-point Concentration Reference
Soil EC10 and EC50 inhibition of CO2 production 4.2 and 22 mg/kg for silt loam soil Chang &
microorganisms amended with alfalfa and sludge Broadbent (1981)
EC50 inhibition of soil 29 mg/kg for soil enriched with 1% Rogers & Li
dehydrogenase activity alfalfa; 53 mg/kg for soil not enriched (1985)
45-day EC50 soil respiration 320 and 3200 mg/kg resulted in Lighthart et
35 and 60% inhibition al. (1983)
5-h EC50 inhibition of soil urease inhibition between 13% and 16% Bremner &
activity Douglas (1971)
6-week EC50 inhibition of urease activity 260 mg/kg in sand to 4200 mg/kg Doelman &
in sandy peat Haanstra (1986)
18-month EC50 glutamic acid reduction 55 mg/kg in sand to 1000 mg/kg Haanstra &
(significant time in sandy peat Doelman (1984)
reduction)
18-month ED50 reduction of arylsulfatase 287 mg/kg in sand to 6991 mg/kg Haanstra &
activity in sandy peat Doelman (1991)
6-month EC50 microbial biomass 890 mg/kg in sandy loam; Frostegard et
4321 mg/kg in humus al. (1993)
15-week EC50 population growth up to 5000 mg/kg when exposed in El-Sharouny et
soil; 10 mg/kg when exposed in agar al. (1988)
Soil ciliate 7-day EC10 and population growth 331.5 and 971.6 µg/litre Janssen et al.
(Colpoda EC50 (1995)
cucculus)
Haanstra & Doelman (1984) report that copper significantly
reduced glutamic acid decomposition time, in an 18-month incubation,
at 55 mg/kg in sand, at 400 mg/kg in silty loam and clay and at 1000
mg/kg in sandy peat. Haanstra & Doelman (1991) calculated 18-month
ED50s, based on reduction of arylsulfatase activity, ranging from 287
mg Cu/kg (4.51 mmol/kg) in sand to 6991 mg Cu/kg (110 mmol/kg) in
sandy peat.
Frostegård et al. (1993) incubated forest humus and arable soil
(sandy loam) with copper for 6 months at 22°C. EC50s, based on a
decrease in the ATP content, were 4321 and 890 mg Cu/kg (68 and 14
mmol/kg) for the two soils, respectively. An EC50, based on a
reduction in respiration, was > 8134 mg Cu/kg (> 128 mmol/kg) for
forest humus. In both soil types, copper exposure caused gradual
changes in the phospholipid fatty acid composition.
El-Sharouny et al. (1988) studied the effects of copper (500,
2000 or 5000 mg/kg) on soil mycoflora. The application of copper
sulfate to the soil resulted in a significant increase in the count of
total fungi after 1 week. There was little further increase after 5
weeks but at the end of the 15-week exposure there were significant
increases. The increases were mainly due to Aspergillus niger,
A. sydowii, A. versicolor, Penicillium chrysogenum and
Rhizopus stolonifer. When similar species were exposed via agar
medium there were significant decreases at all copper exposures (10,
50 and 100 mg/kg), the highest exposure eliminating all but
Aspergillus niger which survived at very low levels.
Janssen et al. (1995) found the 7-day EC10 and EC50 for the soil
ciliate Colpoda cucculus, based on population growth, to be 331.5
and 971.6 µg Cu/litre (5.22 and 15.3 µmol/litre), respectively.
9.3.2 Aquatic organisms
9.3.2.1 Plants
Care should be taken in interpreting published algal assay
results for copper. Most of the algal assay EC50 results reported in
the literature refer to studies of cell division rate carried out in
full culture media. Culture media contain chemicals such as iron,
manganese, citrate, silicate and EDTA which bind copper and reduce its
toxicity. When the algal cells are removed from the culture medium,
washed, and the assay carried out in a natural water (seawater or
river water) the cell division rate is usually much more sensitive to
copper (Stauber & Florence, 1987; Stauber, 1995). Acute toxicity of
copper to freshwater and marine algae is summarized in Table 18.
Wurtsbaugh & Horne (1982) exposed a natural phytoplankton
association from Clear Lake, California, USA, to copper for a period
of 6 days. Chlorophyll a and nitrogen fixation were significantly
reduced at copper concentrations of > 20 µg/litre and carbon fixation
was significantly reduced at > 10 µg/litre. Biomass estimates
indicated that the blue-green alga Aphanizomenon flos-aquae was more
sensitive to copper than were diatoms.
Wong & Chang (1991) reported that copper concentrations of 250
µg/litre significantly reduced the growth rate of
Chlorella pyrenoidosa: the alga did not grow at copper
concentrations of 500 and 750 µg/litre. Photosynthetic rate and
chlorophyll a during the log phase were significantly reduced at 100
µg Cu/litre.
Metaxas & Lewis (1991) found that the marine diatoms
Skeletonema costatum and Nitzschia thermalis did not grow at total
copper concentrations above 32 µg/litre (0.5 µmol/litre) and 38
µg/litre (0.6 µmol/litre), respectively. At lower concentrations
Skeletonema showed increasing growth rate and lag phase with
increasing copper concentrations whereas Nitzschia showed decreasing
growth with increasing copper exposure.
Visviki & Rachlin (1994b) studied the effects of copper on the
algae Dunaliella salina and Chlamydomonas bullosa in acute (96 h)
and chronic (8 month) exposures. Acute exposures of 378 and 49.6 µg
Cu/litre (5.94 and 0.78 µmol/litre) for the two species, respectively,
had no significant effect on the ultrastructure of cells. However,
chronic exposure (0.03 µg Cu/litre (4.9 × 10⁻⁴ µmol/litre)) caused
significant increases in lipid number and relative volume of
Dunaliella and significant increases in cell volume, and decreases
in periplasmalemmal space and cell wall relative volumes in
Chlamydomonas.
A 50% reduction in the total algal cell volume of
Selenastrum capricornutum in standard algal assay medium (SAAM)
occurred at 85 µg Cu/litre after 14 days. For
Chlorella stigmatophora grown in 28% artificial seawater plus SAAM
for 21 days a value of 70 µg Cu/litre was found for the same parameter
(Christensen et al., 1979).
Winner & Owen (1991a) found that copper (20 and 40 µg/litre)
caused significant reductions in community richness of phytoplankton
exposed for 5 week periods during different seasons of the year.
Copper significantly changed the algal divisions (percentage
composition of total phytoplankton) during the spring and autumn but
not during the summer.
Winner & Owen (1991b) exposed the green alga
Chlamydomonas reinhardii to copper in 72-h tests. The NOECs based on
deflagellation and changes in cell density varied from 12.2 to 49.1 µg
Cu/litre and from 12.2 to 43.0 µg Cu/litre for the two parameters,
respectively.
Schäfer et al. (1993) found 7-day and 10-day EC50s, based on
growth inhibition, to be 31.5 µg Cu/litre for the green alga
Chlamydomonas reinhardii in flow-through tests with copper sulfate.
Table 18. Toxicity of copper to algae
Organism Conditionsa Temperature Copper salt Parameter End-point Concentration NOEC Reference
(°C) (µg/litre) (µg/litre)
Green alga stat 20 sulfate 72-h EC50 growth inhibition 79 5 Schafer et al.
(Chlamydomonas (1994)
reinhardii) flow 24 sulfate 96-h EC50 growth inhibition 47 ND Schafer et al.
(1993)
Green alga stat 24-26 sulfate 72-h EC50 growth inhibition 47 ND Nyholm (1990)
(Selenastrum capricornutum) stat 24-26 sulfate 72-h EC50 biomass 35 ND Nyholm (1990)
Marine alga 15 chloride 96-h EC50 growth inhibition 50 ND Visviki &
(Chlamydomonas bullosa) Rachlin (1994a)
Green alga stat 20 sulfate 72-h EC50 growth inhibition 120 5.6 Schafer et al.
(Scenedesmus subspicata) (1994)
Marine alga ND 15 chloride 96-h EC50 growth inhibition 481 ND Visviki &
(Dunaliella minuta) Rachlin (1991)
Marine alga ND 15 chloride 96-h EC50 growth inhibition 377 ND Visviki &
(Dunaliella salina) Rachlin (1994a)
a Stat = static conditions (water unchanged for duration of test); flow = flow-through conditions (copper concentration in water continuously
maintained); ND = no data available.
Shanmukhappa & Neelakantan (1990) exposed the unicellular algae
Synechosystis aquatilis to copper. They found 6-h EC50s, based on
chlorophyll reduction, were 650 µg Cu/litre. A slightly reduced EC50
(720 µg Cu/litre) was found when algae were exposed to copper in the
presence of humic acid (10 µg/litre).
There are several studies which have assessed the effects of
copper on various marine algae. Hall et al. (1979) found that the
growth rate (as measured by an increase in wet weight) of
Ectocarpus siliculosus (a tolerant strain) decreased from a mean
value of 756% in controls to 86% in algae exposed to 500 µg Cu/litre.
The nontolerant strain was unable to grow under the two experimental
copper exposures (250 and 500 µg/litre).
Reed & Moffat (1983) studied the responses of tolerant and
nontolerant isolates of the green alga Enteromorpha compressa to
copper concentrations of up to 610 µg/litre (9.6 µmol/litre). They
found that none of the physiological processes that were tested (cell
viability, net photosynthesis, intracellular potassium and
dimethylsulfoniopropionate content) were affected by the highest
exposure concentration with the tolerant isolate. However, the
nontolerant isolate showed symptoms of copper toxicity at all copper
exposures ranging from 114 to 610 µg/litre (1.8 to 9.6 µmol/litre).
The authors concluded that this copper tolerance was genetically
determined as the progeny retained the same pattern of response to
copper enrichments. On the other hand, Correa et al. (1996) found
that the progeny of copper-tolerant isolates of
Enteromorpha compressa from northern Chile responded in the same
manner as the progeny of non-tolerant isolates of the same species.
Chilean Enteromorpha compressa grew well at 100 µg Cu/litre (from a
copper-polluted site) and at 10 µg Cu/litre (from a nonpolluted site)
and it was concluded that physiological plasticity rather than
genotype was involved in tolerance to copper.
Stauber & Florence (1987) found that copper ions depressed both
cell division and photosynthesis in the marine diatom
Asterionella glacialis (101.6 µg Cu/litre; 1.6 × 10⁻⁶ mol/litre)
and the freshwater green alga Chlorella pyrenoidosa (63.5 µg
Cu/litre; 10 × 10-7 mol per litre). Ionic copper concentrations
(176.5 µg Cu/litre; 27.8 × 10⁻⁷ mol per litre) which were inhibitory
to cell division in the marine diatom Nitzchia closterium had no
effect on photosynthesis, respiration, ATP production, electron
transport or membrane ultrastructure. The authors suggest that the
main toxic effect of copper on N. closterium is to act within the
cytosol; a different toxic mechanism was apparently operating with
A. glacialis and C. pyrenoidosa because both cell division and
photosynthesis were affected by copper. Lipid-soluble organocopper
complexes were found to be much more toxic than ionic copper. Stauber
& Florence (1985a,b) showed that the toxicity of ionic copper to
Nitzchia closterium was reduced by the addition of manganese(III)
and iron(III) hydroxides to the culture medium. Stauber & Florence
(1987) demonstrated that the addition to the algal growth medium of
trivalent metal ions such as aluminium, iron, chromium, or divalent
metals such as manganese and cobalt (which can be oxidized by algae to
trivalent species) reduced the toxicity of copper ions. The trivalent
species form a layer of hydrated metal oxide around the cell which
adsorbs copper ions.
Chung & Brinkhuis (1986) assessed the effects of copper at 5, 10,
50, 100 and 500 µg/litre on the early stages of development in the
kelp Laminaria saccharina. It was found that the release of
meiospores from copper-tested sorus materials was reduced by
concentrations of 50 µg Cu/litre. Settlement and germination of
meiospores were not affected by concentrations of up to 500 µg
Cu/litre. Development of gametophytes and gametogenesis were delayed
at concentrations of > 50 µg Cu/litre. Growth of the sporophytes was
inhibited at concentrations > 10 µg Cu/litre. Hopkin & Kain (1978)
found that sporophyte growth and gametophyte germination of
Laminaria hyperborea were inhibited at 10 and 100 µg Cu/litre,
respectively.
Brown & Rattigan (1979) exposed the pondweeds Elodea canadensis
and Lemna minor to copper. A 24-h IC50 (photosynthetic oxygen
evolution) was calculated to be 150 µg Cu/litre for Elodea. In
28-day tests copper concentrations of 3100 and 130 µg/litre caused 50%
plant damage in Elodea and L. minor, respectively. Dirilgen &
Inel (1994) calculated a 7-day IC50, based on frond growth, to be
1540 µg Cu/litre for the duckweed Lemna minor.
9.3.2.2 Invertebrates
Acute and short-term toxicity
The acute toxicity of copper to freshwater and marine
invertebrates are summarized in Tables 19 and 20, respectively. For
freshwater invertebrates 48-h L(E)C50s range from 5 µg Cu/litre for a
daphnid species to 5300 µg Cu/litre for an ostracod; 96-h LC50s for
marine invertebrates range from 29 µg Cu/litre for the bay scallop to
9400 µg Cu/litre for the fiddler crab.
Kaitala (1988) reported an 8-day LC50 for mussels
(Mytilus edulis) at 127 µg Cu/litre and a 10-day LC50 for clams
(Macoma baltica) at 54 µg Cu/litre. Beaumont et al. (1987) exposed
veliger larvae of common mussel (M. edulis) and scallop
(Pecten maximus) to copper for 15 days. LC50s were calculated to
be 400 and 85 µg Cu/litre for the two species, respectively.
Centeno et al. (1993) studied the effect of temperature (10-30°C)
on the 24-h LC50 of copper on the third instar of the crustacean
Streptocephalus proboscideus. A significant increase in toxicity was
observed at the highest temperature tested. Zou & Bu (1994) observed
an increase in the acute toxicity of copper to the water flea
Moina irrasa with increasing temperature (20-30°C). Snell et al.
(1991) found that the acute toxicity of copper to the rotifer
Brachionus calyciflorus was significantly increased at 10, 25 and
30°C when compared with tests at both 15 and 20°C.
Table 19. Acute toxicity of copper to freshwater invertebrates (24-h to 96-h L(E)C50s)a
Organism Size/ age Conditionsb Temperature Hardness (mg pH Copper Parameter Concentration Reference
(°C) CaCO3/litre) salt (µg/litre)
Snails
Amnicola sp. eggs stat 17 50 7.6 ND 24-h LC50 4500 Rehwoldt et al.
eggs stat 17 50 7.6 ND 96-h LC50 9300 (1973)
adult stat 17 50 7.6 ND 24-h LC50 1500 Rehwoldt et al.
adult stat 17 50 7.6 ND 96-h LC50 900 (1973)
Goniobasis ND stat 15 154 8.5 sulfate 96-h LC50 390 Paulson et al.
livescens (1983)
Lithoglyphus ND flow 15 22 7.2 chloride 96-h LC50 8 Nebeker et
virens al. (1986)
Juga plecifera ND flow 15 22 7.2 chloride 96-h LC50 15 Nebeker et
al. (1986)
Physa integra ND flow 15 45 7.7 sulfate 96-h LC50 39 Arthur &
Leonard (1970)
Campeloma ND flow 15 45 7.7 sulfate 96-h LC50 1700 Arthur &
decisum Leonard (1970)
Gastropod
Potamopyrgus juvenile flow 15 298 8.0 sulfate 48-h LC50 58 Watton &
jenkinsi juvenile flow 15 298 8.0 sulfate 96-h LC50 54 Hawkes (1984)
prime adult flow 15 298 8.0 sulfate 48-h LC50 112 Watton &
prime adult flow 15 298 8.0 sulfate 96-h LC50 77 Hawkes (1984)
senescent flow 15 298 8.0 sulfate 48-h LC50 87 Watton &
adult Hawkes (1984)
senescent flow 15 298 8.0 sulfate 96-h LC50 79
adult
Table 19. (continued)
Organism Size/ age Conditionsb Temperature Hardness (mg pH Copper Parameter Concentration Reference
(°C) CaCO3/litre) salt (µg/litre)
Bristle worm
Nais sp. ND stat 17 50 7.6 ND 24-h LC50 2300 Rehwoldt et al.
ND stat 17 50 7.6 ND 96-h LC50 90 (1973)
Oligochaete
Lumbriculus ND stat 25 290 6.6 nitrate 96-h LC50 130 Shubauer-Berigan
variegatus ND stat 25 290 7.3 nitrate 96-h LC50 270 et al.
ND stat 25 290 8.3 nitrate 96-h LC50 500 (1993)
Water fleas
Daphnia magna 6-24 h stat 25 80-100 7.4-7.8 sulfate 24-h LC50 380 Ferrando et
al. (1992)
ND stat 17-19 44-53 7.4-8.2 chloride 48-h EC50 9.8 Biesinger &
ND stat 17-19 44-53 7.4-8.2 chloride 48-h EC50 60 with food Christensen
(1972)
< 24 h stat 21.6 143 7.1-7.9 oxide 48-h EC50 26 Lewis (1983)
ND stat ND 175 8.1 sulfate 48-h EC50 23-27c LeBlanc (1982)
< 24 h stat 20 ND 6.5 sulfate 48-h LC50 7 Oikari et al.
< 24 h stat 20 ND 6.5 sulfate 48-h LC50 45 humic (1992)
water
< 24 h stat ND 45 7.2-7.4 48-h LC50 54 Mount &
< 24 h stat ND 45 7.2-7.4 48-h LC50 53 Norberg (1984)
< 24 h stat 20 130-160 8.2-9.5 sulfate 72-h LC50 86.5 Winner &
Daphnia pulex < 24 h stat 20 130-160 8.2-9.5 sulfate 72-h LC50 86 Farrell (1976)
Daphnia parvula < 24 h stat 20 130-160 8.2-9.5 sulfate 72-h LC50 72 Winner &
Daphnia ambigua < 24 h stat 20 130-160 8.2-9.5 sulfate 72-h LC50 67.7 Farrell (1976)
ND stat$ 28.5 200 7.9 48-h LC50 54.6 Vardia et al.
Daphnia ND ND ND ND ND 96-h LC50 9.4 (1988)
lumholtzi
Daphnia hyalina 1.27 mm stat 10 ND 7.2 chloride 48-h LC50 5 Baudouin &
Scoppa (1974)
Table 19. (continued)
Organism Size/ age Conditionsb Temperature Hardness (mg pH Copper Parameter Concentration Reference
(°C) CaCO3/litre) salt (µg/litre)
Moina irrasa < 24 h stat 20 < 5 8.0 chloride 48-h LC50 5.9 Zou & Bu (1994)
Moina macrocopa ND stat$ 24-27 ND 6.5 sulfate 48-h LC50 80 Wong (1992)
Ceriodaphnia < 12 h stat 25 57 8.2 sulfate 48-h LC50 13.4 Oris et al. (1991)
dubia < 12 h stat 25 45 7.7 ND 48-h LC50 17-32d Belanger et al.
< 12 h stat 25 179 8.3 ND 48-h LC50 67e (1989)
< 12 h stat 25 94 8.15 ND 48-h LC50 34-37d Belanger et al.
< 12 h stat 25 179 8.3 ND 48-h LC50 78-81e (1989)
ND stat 25 290 6.2 nitrate 48-h LC50 9.5 Schubauer-Berigan
ND stat 25 290 7.1 nitrate 48-h LC50 28 et al.
ND stat 25 290 8.6 nitrate 48-h LC50 200 (1993)
Ceriodaphnia < 4 h stat ND 45 7.2-7.4 ND 48-h LC50 17 Mount &
reticulata Norberg (1984)
Simocephalus < 24 h stat ND 45 7.2-7.4 ND 48-h LC50 57 Mount &
vetulus Norberg (1984)
Copepods
Cyclops 1.27 mm stat 10 ND 7.2 chloride 48-h LC50 2500 Baudouin &
abyssorum Scoppa (1974)
Eudiaptomus 1.27 mm stat 10 ND 7.2 chloride 48-h LC50 500 Baudouin &
padanus Scoppa (1974)
Amphipods ND stat 17 50 7.6 ND 24-h LC50 1200 Rehwoldt et al.
Gammarus sp. ND stat 17 50 7.6 ND 96-h LC50 910 (1973)
Gammarus 3-5 mm stat$ 12 151 6.8-7.2 ND 48-h LC50 47 Taylor et al.
pulex 3-5 mm stat$ 12 151 6.8-7.2 ND 96-h LC50 37 (1991)
ND stat$ ND 104 8.33 ND 48-h LC50 41 Stephenson
ND stat$ ND 104 8.33 ND 96-h LC50 21 (1983)
Table 19. (continued)
Organism Size/ age Conditionsb Temperature Hardness (mg pH Copper Parameter Concentration Reference
(°C) CaCO3/litre) salt (µg/litre)
G. pulex ND stat$ ND 249 8.33 ND 48-h LC50 183 Stephenson
(contd). ND stat$ ND 249 8.33 ND 96-h LC50 109 (1983)
Gammarus ND stat 8 240 8.1 chloride 24-h LC50 179 Pantani et al.
italicus (1990)
Gammarus ND flow 15 45 7.7 sulfate 96-h LC50 20 Arthur &
pseudolimnaeus Leonard (1970)
Hyallela azteca ND stat 25 290 6.2 nitrate 96-h LC50 17 Scubauer-
ND stat 25 290 7.1 nitrate 96-h LC50 24 Berigan et al.
ND stat 25 290 8.4 nitrate 96-h LC50 87 (1993)
Echinogammarus ND stat 7.5-8.5 240 7.9 chloride 96-h LC50 720 Pantani et al.
tibaldii (1995)
Crangonyx 4 mm stat 13 50 6.75 sulfate 48-h LC50 2440 Martin &
pseudogracilis 4 mm stat 13 50 6.75 sulfate 96-h LC50 1290 Holdich (1986)
Isopod
Asellus 7 mm stat 13 50 6.75 sulfate 96-h LC50 9210 Martin &
aquaticus Holdich (1986)
Ostracod
Cypris ND stat$ 28.5 200 7.9 ND 48-h LC50 5363 Vardia et al.
subglobosa 96-h LC50 277.3 (1988)
Rotifers
Brachionus juvenile stat 20 36.2 7.3 sulfate 24-h LC50 200 Couillard et al.
calyciflorus (1989)
ND stat 25 24-h LC50 26 Snell et al.
(1991)
ND stat 25 80-100 7.4-7.8 sulfate 24-h LC50 76 Ferrando et al.
(1992)
Table 19. (continued)
Organism Size/ age Conditionsb Temperature Hardness (mg pH Copper Parameter Concentration Reference
(°C) CaCO3/litre) salt (µg/litre)
Brachionus neonate stat 25 80-100 7.4-7.8 sulfate 24-h LC50 19 Snell &
rubens Persoone
(1989b)
Keratella ND stat 20 ND 8.3 chloride 24-h LC50 101 Borgmann &
cochlearis Ralph (1984)
Anostracan
crustacean
Streptocephalus 2nd/3rd ND 20 8-10 6.4-6.6 sulfate 24-h LC50 120 Centeno et al.
proboscideus instar (1993)
2nd/3rd ND 20 71-110 7.6-7.8 sulfate 24-h LC50 210 Centeno et al.
instar (1993)
2nd/3rd ND 20 250-327 7.9-8.2 sulfate 24-h LC50 520 Centeno et al.
instar (1993)
Freshwater adult flow 15 17 6.96 sulfate 96-h LC50 34 (total Cu) Daly et al.
shrimp (1990a)
Paratya adult flow 15 17 6.96 sulfate 96-h LC50 16 (Cu ion) Daly et al.
australiensis (1990a)
Midges
Chironomus sp. ND stat 17 50 7.6 ND 24-h LC50 650 Rehwoldt et al.
ND stat 17 50 7.6 ND 96-h LC50 30 (1973)
Chironomus 3rd instar stat 13 25 6.3 sulfate 48-h EC50 327 Khangarot &
tentans Ray (1989)
1st instar stat 19-22 42.7 7.6 sulfate 96-h EC50 16.7 Gauss et al.
1st instar stat 19-22 109.6 7.8 sulfate 96-h EC50 36.5 (1985)
1st instar stat 19-22 172.3 8.1 sulfate 96-h EC50 98.2 Gauss et al.
4th instar stat 19-22 42.7 7.6 sulfate 96-h EC50 211 (1985)
4th instar stat 19-22 109.6 7.8 sulfate 96-h EC50 977 Gauss et al.
4th instar stat 19-22 172.3 8.1 sulfate 96-h EC50 1184 (1985)
Table 19. (continued)
Organism Size/ age Conditionsb Temperature Hardness (mg pH Copper Parameter Concentration Reference
(°C) CaCO3/litre) salt (µg/litre)
C. tentans 1st instar stat$ 20 71 ND chloride 96-h LC50 298 Nebeker et al.
(contd). 2nd instar flow 20 84 ND chloride 96-h LC50 773 (1984a)
3rd instar flow 20 84 ND chloride 96-h LC50 1446 Nebeker et al.
4th instar flow 20 84 ND chloride 96-h LC50 1690 (1984a)
Chironomus 4th instar stat 20 40-48 7.2-7.6 sulfate 48-h LC50 739 Kosalwat &
decorus Knight (1987a)
Chironomus 2nd instar stat$ 12 151 6.8-7.2 48-h LC50 1200 Taylor et al.
riparius 2nd instar stat$ 12 151 6.8-7.2 96-h LC50 700 (1991)
a EC50s based on immobilization; ND = no data available.
b Stat = static conditions (water unchanged for duration of test); stat$ = static renewal conditions
(water changed at regular intervals); flow = flow-through conditions (copper concentration in water
continuously maintained).
c Range of means for three duplicate tests.
d Range of tests from different culture sources; parental diet was synthetic.
e Range of tests from different culture sources; parental diet was algal.
Table 20. Acute toxicity of copper to marine invertebrates (24-h to 96-h L(E)C50S)a
Organism Size/age Conditionsb Temperature Salinity pH Salt Parameter Concentration Reference
(°C) (%) (µg/litre)
Bay scallop juvenile stat$ 20 25 ND chloride 96-h LC50 29 Nelson et al.
Argopecten (1988)
irradians
Surf clam juvenile stat$ 20 25 ND chloride 96-h LC50 51 Nelson et al.
Spisula (1988)
solidissima
Squid larvae stat 8.6 30 8.1 chloride 96-h LC50 309 Dinnell et al.
Loligo opalescens (1989)
Cabezon larvae stat 8.3 27 7.9 chloride 96-h LC50 95 Dinnell et al.
Scorpaenichthys (1989)
marmoratus
Amphipod 24 h stat 20 32 ND sulfate 96-h LC50 110 Ahsanullah &
Allorchestes adult stat 20 32 ND sulfate 96-h LC50 500 Florence (1984)
compressa
American lobster larvae stat 20 30.5 ND nitrate 96-h LC50 48 Johnson &
Homarus Gentile (1979)
americanus
Dungeness crab larvae stat 8.5 30 8.1 chloride 96-h LC50 96 Dinnell et al.
Cancer magister (1989)
Fiddler crab 24-29 mm stat 29 25 ND sulfate 96-h LC50 9420 Devi (1987)
Uca annulipes 24-29 mm stat 29 25 ND sulfate 96-h LC50 12 820c Devi (1987)
Fiddler crab 24-29 mm stat 29 25 ND sulfate 96-h LC50 8380 Devi (1987)
Uca triangularis 24-29 mm stat 29 25 ND sulfate 96-h LC50 14 810c Devi (1987)
Table 20. (continued)
Organism Size/age Conditionsb Temperature Salinity pH Salt Parameter Concentration Reference
(°C) (%) (µg/litre)
Ragworm 20 mm stat 12 7.3 ND nitrate 96-h LC50 357 Ozoh (1992a)
Hediste 20 mm stat 12 29.2 ND nitrate 96-h LC50 512 Ozoh (1992a)
diversicolor 20 mm stat 22 7.3 ND nitrate 96-h LC50 247 Ozoh (1992a)
20 mm stat 22 29.2 ND nitrate 96-h LC50 500 Ozoh (1992a)
Copepods
Tisbe battagliai nauplius stat$ 20 34-35 6.2-8.2 nitrate 96-h LC50 64Hutchinson et
adult stat$ 20 34-35 6.2-8.2 nitrate 96-h LC50 88al. (1994)
Tisbe holothuriae ND stat 22 38 ND sulfate 48-h LC50 370 Verriopoulos
& Dimas (1988)
Rotifer
Brachionus neonate stat 25 15 7.7 ND 24-h LC50 120 Snell &
plicatilis neonate stat 25 30 7.7 ND 24-h LC50 130 Persoone
(1989a)
Sand shrimp adult flow 13.7 30.1 7.9 chloride 96-h LC50 898 Dinnell et al.
Crangon sp. (1989)
Penaeid shrimp protozoeal stat 27 30-34 8.7 sulfate 48-h LC50 160 Wong
Metapenaeus mysid stat 27 30-34 8.7 sulfate 48-h LC50 1580 et al.
ensis postlarva stat 27 30-34 8.7 sulfate 48-h LC50 4760 (1993)
Mysid shrimp 3 days stat ND ND chloride 96-h LC50 17 Martin et al.
Holmesimysis (1989)
costata
Grass shrimp
Palaemonetes juvenile stat$ 20 10 ND ND 48-h LC50 2100 Burton &
pugio Fisher (1990)
ND stat 22 25 8.3-8.7 acetate 96-h LC50 3700Curtis et al.
(1979)
Table 20. (continued)
a EC50s based on immobilization; ND = no data available.
b Stat = static conditions (water unchanged for duration of test); stat$ = static renewal conditions (water changed at regular intervals);
flow = flow-through conditions (copper concentration in water continuously maintained).
c Animals collected from a polluted site (6.8-30.6 µg Cu/litre).
Ozoh (1992c) found that sediment affected the acute response of
both juvenile and adult ragworms (Hediste diversicolor) to copper.
Without sediment, increasing salinity (7.3 to 30.5%) and increasing
temperature (12 to 22°C) reduced the acute toxicity of copper, whereas
in the presence of sediment increasing temperature and increasing
salinity increased the acute toxicity of copper.
Snell & Persoone (1989a,b) exposed neonate rotifers to copper for
24 h; NOEC was 20 µg Cu/litre at a salinity of 15%, 50 µg Cu/litre at
30% for the marine rotifer Brachionus plicatilis and 9.4 µg/litre
for the freshwater rotifer Brachionus rubens. Ozoh & Jones (1990)
studied the effects of salinity and temperature on the toxicity of
copper to ragworm (Hediste diversicolor) in 96-h tests. Larvae at 1
day old were more susceptible to copper than at 7 days old.
Increasing salinity from 7.6 to 30.5% reduced copper toxicity.
Stephenson (1983) reported that copper was 4-6 times more toxic
to Gammarus pulex in soft water (100 mg CaCO3/litre) than in hard
water (250 mg CaCO3/litre). Similar findings were reported by Gauss
et al. (1985) for first and fourth instar midge Chironomus tentans
exposed to copper in acute toxicity tests. First instar larvae were
the most sensitive with 96-h EC50s, based on immobilization, at 16.7
µg Cu/litre in soft water (40 mg CaCO3/litre) and 98.2 µg Cu/litre in
hard water (170 mg CaCO3/litre). The 48-h LC50s of copper to
Ceriodaphnia dubia increased from 35 to 79 µg/litre when the water
hardness was increased from 94 to 170 mg CaCO3/litre (Belanger et
al., 1989). Increasing the hardness from 8-10 to 250-327 mg
CaCO3/litre decreased the 24-h LC50 of copper to the third instar of
the crustacean Streptocephalus proboscideus irrespective of the
temperature (Centeno et al., 1993). In similar tests a significant
increase in toxicity was noted at pH 6.0 when compared with tests
carried out at pHs ranging from 7.6 to 10.0.
Shaner & Knight (1985) found that alkalinity had a significant
effect on the acute toxicity of copper-bearing sediments to
Daphnia magna. The 24-h LC50s were 1332 and 1578 mg/kg at
alkalinities of 600 and 1000 mg bicarbonate/litre, respectively.
LC50s predicted by multiple regression models calculated levels
ranging from 1146 to 5966 mg/kg at alkalinities ranging from 571 to
2286 mg bicarbonate/litre.
The addition of humic acid reduced the acute toxicity of copper
to daphnids. The mean 72-h LC50 increased from 28.3 µg Cu/litre in
water containing no added humic acid to 53.2 µg Cu/litre in water to
which 1.5 mg humic acid/litre had been added (Winner, 1984). Giesy et
al. (1983) showed a positive correlation between LC50 values for
exposure of Simocephalus serrulatus to copper and total dissolved
carbon concentration. Pantani et al. (1995) reported similar results
for the amphipod Echinogammarus tibaldii with the acute toxicity of
copper being reduced by the addition of humic acid, fluvial sediment
or bentonite. Humic acid significantly reduced the acute toxicity of
copper to Daphnia pulex at all levels of water hardness tested (58,
115, and 230 mg CaCO3/litre) (Winner, 1985). Winner (1984) exposed
Daphnia pulex to 30 µg Cu/litre in the presence of varying amounts
of humic acid for up to 30 days. Daphnids showed significantly better
survival in water containing 0.38, 0.75 or 1.50 mg humic acid/litre
than in water to which no humic acid had been added. In the absence of
humic acid only one brood of young was produced because of premature
deaths of females. The addition of 0.38 mg humic acid/litre produced
49 broods but the mean brood size was significantly smaller than humic
acid controls. Daphnids maintained on 30 µg Cu/litre and 1.50 mg
humic acid/litre produced 101 broods with brood sizes significantly
larger than humic acid controls. Meador (1991) determined that humic
acid decreased the toxicity of Daphnia magna on the basis of total
copper, but toxicity was constant on the basis of cupric ion activity.
In contrast, Borgmann & Ralph (1983) and Borgmann & Charlton (1984)
found that free metal concentrations did not provide a constant
measure of copper toxicity to Daphnia magna as organic matter
concentrations changed.
McLeese & Ray (1986) found the toxicity of copper to the marine
shrimps Crangon septemspinosa and Pandalus montagui to be reduced
when complexed with EDTA. LC50s (144-h) were 1400 and 50 µg
CuCl2/litre for the two species, respectively, whereas LC50s for
copper-EDTA complexes were > 30 000 µg/litre. However, 144-h LC50s
for the clam Macoma balthica were 6000 µg/litre regardless of the
form of copper exposure. In solutions containing nitrilotriacetic
acid (NTA) or glycine, uncomplexed copper(II) ions were found to be
the most acutely toxic form of copper to the freshwater shrimp
Paratya australiensis. However, although the copper-NTA complex did
not contribute to the toxic effect, the copper-glycine complex appears
to be mildly toxic (Daly et al., 1990a). The acute toxicity of copper
to P. australiensis was shown to decrease in solutions of increasing
alkalinity. Additional experiments revealed that the tolerance to
copper at higher alkalinities was caused by a combination of
physiological effects associated with increased ionic strength of the
test waters and changes in metal speciation (Daly et al., 1990b). The
presence of natural organic matter significantly reduced the toxicity
of copper to P. australiensis (Daly et al., 1990c). Daly et al.
(1992) found that post-moult shrimps were more sensitive to acute
copper toxicity than individuals at other stages of the moult cycle.
Baird et al. (1991) found that the 48-h EC50 for different
clones of Daphnia magna ranged from 10.5 to 70.7 µg Cu/litre.
Pre-exposure of daphnids (Daphnia magna) to 10 µg Cu/litre resulted
in a significant reduction in the subsequent acute toxicity: 48-h
LC50s in pre-exposed animals ranged from 58 to 80 µg Cu/litre whereas
those of unexposed daphnids ranged from 23 to 27 µg Cu/litre (LeBlanc,
1982).
Collyard et al. (1994) found little effect of age class (0.2-22
days) on the acute (96-h) toxicity of copper to the amphipod
Hyallela azteca. With the exception of the 6-8-day age class, which
appeared to be the most sensitive to copper, the 95% confidence limits
overlapped for the different age groups. The 48-h LC50s for the
penaeid shrimp Metapenaeus ensis at different developmental stages
were 160 µg Cu/litre (protozoaeal), 1580 µg Cu/litre (mysid) and 4760
µg Cu/litre (post-larval), showing that tolerance to acute copper
toxicity increased with age (Wong et al., 1993).
Sosnowski et al. (1979) found that the sensitivity (72-h LC50)
of the copepod Acartia tonsa was strongly correlated with field
population density and food ration. The 72-h LC50s ranged from 9.0
to 78.0 µg Cu/litre. There was an inverse correlation between the log
LC50 and adult A. tonsa density at the time of collection. The log
LC50 increased with increasing food ration. Lewis (1983) exposed
Daphnia magna to copper in 48-h static toxicity tests at six
different loading densities. There was a trend of increasing toxicity
at the lower density levels. However, the differences in LC50 values
were not biologically significant, with the maximum difference being
approximately threefold.
Dave (1984) found the 48-h EC50, based on immobilization, for
unfed and fed daphnids (Daphnia magna) to be 6.5 and 18.5 µg
Cu/litre, respectively. Neonates of Ceriodaphnia dubia from mothers
reared on an algal diet were 1.4-1.5 times more resistant to copper in
acute toxicity tests than those reared on a synthetic diet (Belanger
et al., 1989).
Nell & Chvojka (1992) reported that copper concentrations of 8
µg/litre significantly reduced the growth of Sydney rock oysters
(Saccostrea commercialis) in 4-week studies. Exposure of oysters to
copper concentrations ranging from 8 to 64 µg/litre and 20 ng tributyl
tin oxide/litre showed an additive effect on growth.
Bodar et al. (1989) exposed parthenogenetic eggs of
Daphnia magna to copper concentrations of 1.0, 10 and 25 mg/litre.
Copper exposure at concentrations exceeding 1.0 mg/litre significantly
reduced the total development of daphnid eggs. However, stages 1 and
2 (which take about half of the development time from egg to juvenile)
showed only a slight decrease in the mean lifetime of individuals in
these stages at copper concentrations of 10 and 25 mg/litre.
Therefore the toxicity of copper, apparent in the total developmental
effect, is exerted at stages 3-6.
Hutchinson et al. (1994) exposed copepods (Tisbe battagliai) to
copper for 7 days. NOECs for nauplius survival, adult survival and
reproduction were 10, 18 and 6 µg Cu/litre, respectively; LOECs were
18, 32 and 10 µg Cu/litre, respectively. A subchronic value was
calculated as the geometric mean of the highest NOEC and the lowest
LOEC; these were 13 µg Cu/litre for nauplius survival, 24 µg Cu/litre
for adult survival and 8 µg Cu/litre for reproduction.
Long-term and reproductive toxicity
Ringwood (1992) exposed gametes and early life stages of sea
urchins (Echinometra mathaei) and the bivalve Isognomon
californicum to copper. EC50s, based on fertilization,
for sea urchins (1 h) and bivalves (2 h) were 14 and 55 µg Cu/litre,
respectively; NOECs were 5.0 and 20 µg Cu/litre, respectively. A 48-h
EC50 (embryo survival) was 7.0 µg Cu/litre with a NOEC of 1.0 µg
Cu/litre. A NOEC for bivalve growth (96 h) was 1.0 µg Cu/litre.
Stromgren & Nielsen (1991) studied the effect of copper on
spawning, growth and mortality in larval, juvenile and mature common
mussel (Mytilus edulis). EC50s, based on larval growth (10 days)
and adult spawning frequency (30 days), were 5-6 and 2 µg Cu/litre,
respectively. The larval 10-day LC50 was estimated to be
approximately 10 µg Cu/litre.
Macdonald et al. (1988) exposed yellow crab (Cancer anthonyi)
embryos to copper in 7-day tests. Copper concentrations > 1000
µg/litre significantly reduced survival. Hatching of embryos and
larval survival were significantly reduced at 10 µg Cu/litre; no
embryos hatched at copper concentrations of 100 µg/litre or more.
Biesinger & Christensen (1972) exposed Daphnia magna to copper
for 3 weeks. A 3-week LC50 of 44 µg Cu/litre was found; the 3-week
EC50, based on reproductive impairment, was 35 µg Cu/litre. Dave
(1984) reports a 21-day EC50 (immobilization) of 1.4 µg Cu/litre.
Cowgill & Milazzo (1991) carried out a three-brood toxicity test
on Ceriodaphnia dubia. EC50s based on total progeny, mean brood
number and mean brood size were found to be 357, 348 and 326 µg
Cu/litre for metallic copper, and 305, 341 and 304 µg Cu/litre for
copper nitrate.
Oris et al. (1991) studied the effects of copper on the
reproduction of the cladoceran Ceriodaphnia dubia. Chronic survival
values, which were calculated as the geometric mean between NOEC and
LOEC, were 34.6 and 24.5-34.6 µg Cu/litre for 4- and 7-day tests,
respectively. EC50s, based on mean total young per female, were
38.2-40.4 and 30.7-30.8 µg Cu/litre for the two tests, respectively.
In 21-day tests Daphnia magna showed 100% mortality at 110 µg
Cu/litre. No significant effect on the intrinsic rate of natural
increase was observed up to and including 36.8 µg Cu/litre. The
carapace length was significantly reduced at 36.8 µg Cu/litre (Van
Leeuwen et al., 1988).
LeBlanc (1985) studied the competitive interactions between
Daphnia magna and Daphnia pulex in 28 day exposures to copper (10
and 30 µg Cu/litre) . D. pulex populations consistently exceeded
D. magna populations when cocultured in the absence of copper or
temporary exposures to 10 µg Cu/litre. Exposure to 30 µg Cu/litre
severely reduced initial population growth of D. pulex without
affecting D. magna. By day 14 D. magna populations were dominant;
however, D. pulex population growth was not completely suppressed
and by the end of the experiment (28 days) D. pulex had gained
population dominance. The reduced size of D. magna suggested that
D. pulex was out-competing D. magna for available food.
Ingersoll & Winner (1982) carried out 70-day toxicity tests with
Daphnia pulex. There was no significant effect on reproduction but
survival was significantly reduced at 10 µg Cu/litre giving an NOEC of
5 µg Cu/litre. However, in pulse toxicity tests daphnids were exposed
to 20 µg Cu/litre for 360 min/day (an average water concentration of 5
µg Cu/litre). Pulse exposures resulting in significant decreases in
survival, brood size and body length, and delays in the age at which
young were first produced.
Winner & Farrell (1976) exposed four species of daphnid to copper
at concentrations ranging from 20 to 100 µg Cu/litre for up to 130
days. All four species exhibited reductions in survival at
concentrations > 40 µg Cu/litre. Daphnia magna exhibited a
decrease in the instantaneous rate of population growth at 60 µg
Cu/litre; whilst the same parameter was affected at > 40 µg Cu/litre
for D. pulex, D. parvula and D. ambigua. Daphnia ambigua produced
significantly smaller broods at concentrations > 40 µg Cu/litre
whereas mean brood size did not decrease in D. pulex and D. parvula
until the concentration exceeded 60 µg Cu/litre. Mean brood size in
D. magna was unaffected by copper exposure.
De Nicola Giudici & Migliore (1988) studied the long-term
toxicity of copper on the freshwater isopod Asellus aquaticus. In
30-day tests copper (5 µg Cu/litre) had no significant effect on
female survival or birth rate. There was no significant effect on
growth during embryonic development; however, copper treatment during
juvenile development reduced body growth in 90-day exposures.
The development and hatchability of midge (Chironomus decorus)
eggs were unaffected by copper (as copper sulfate) concentrations
ranging from 100 to 5000 µg/litre. All larvae survived a 72-h
exposure except those at 5000 µg Cu/litre which died after only
partial emergence. The growth of larvae was significantly reduced
when they were reared in copper-spiked food-substrate. An EC50 based
on growth was 1602 mg Cu/kg (Kosalwat & Knight, 1987b).
Hatakeyama (1988) studied the effects of copper on the
reproduction of chironomids (Polypedilum nubifer) through water
(10-40 µg Cu/litre) and food (22-5180 µg Cu/g dry weight). Emergence
success decreased to 74%, 38%, 16% and 2% of control values at 10, 20,
30 and 40 µg Cu/litre, respectively. The number of egg clusters
produced by adults also decreased in accordance with the increase in
copper concentration from 242 in controls to 31 at 30 µg Cu/litre; at
40 µg Cu/litre eggs were not oviposited. A significant decrease in
emergence success occurred with food contaminated with 1770 mg Cu/kg:
no emergence occurred at 5200 mg Cu/kg.
In flow-through life cycle tests with caddisfly
(Clistoronia magnifica) concentrations of > 17 µg Cu/litre
prevented completion of the life cycle, and a significant reduction in
adult emergence occurred at 13 µg Cu/litre. The NOEC was found to be
8.3 µg Cu/litre (Nebeker et al., 1984b).
Arthur & Leonard (1970) exposed the amphipod
Gammarus pseudolimnaeus and the snails Physa integra and
Campeloma decisum for 6 weeks to concentrations of 2.9-28.0 µg
Cu/litre. For all three species, reduced survival and other
significant adverse effects occurred at concentrations of 14.8 µg
Cu/litre and above, but no effects were noted at concentrations of 8.0
µg Cu/litre and below. In 100-day exposure to copper,
Gammarus pulex populations densities were not affected at
concentrations up to 11.0 µg Cu/litre, but were reduced at
concentrations of 14.6 µg Cu/litre and above (Maund et al., 1992).
Phipps et al. (1995) determined 10-day LC50s for the amphipod
Hyalella azteca, the dipteran larva Chironomus tentans, and the
oligochaete Lumbriculus variegatus to be 31, 54, and 35 µg Cu/litre,
respectively, in Lake Superior (Canada) water (21-24°C). Nebeker et
al. (1986) reported 30-day LC50s for the snails Juga plicifera and
Lithoglyphus virens to be less than 8 µg Cu/litre. The 11-week
LC50 for zebra mussel (Dreissena polymorpha) was reported to be
130 µg Cu/litre (Kraak et al., 1992). The marine copepod
(Tisbe furcata)was determined to have a 96-h LC50 of 178 µg
Cu/litre, but concentrations as low as 56 µg Cu/litre were estimated
to significantly reduce the intrinsic rate of population increase
(Bechmann, 1994).
Biochemical, physiological and behavioural effects
Lin et al. (1992) exposed Pacific oysters (Crassostrea gigas)
to copper; 8-16 mg Cu/litre caused a significant increase in
filtration rates whereas concentrations > 32 mg/litre reduced
filtration rates. Glycine uptake rate was inhibited and the volume
specific glycine transport declined in the presence of copper.
Krishnakumar et al. (1990) exposed green mussels
(Perna viridis) to 25 µg Cu/litre for 2 weeks. Copper decreased
ammonia-nitrogen excretion and significantly decreased filtration
rate, O : N ratio, the scope for growth and growth efficiency; there
was a nonsignificant increase in oxygen uptake. Microscopic
examination of digestive glands revealed a significant increase in
lysosomal lipofuscin content and percentage incidence of tubule
dilation. Digestive cells showed extensive vacuolation of the
cytoplasm. Copper exposure caused almost 100% cilia loss and tubule
dilation.
Kraak et al. (1992) studied the effect of copper on the
filtration rate in zebra mussel (Dreissena polymorpha) over a 9-11
week period. Filtration rate was unaffected at concentrations of 13
µg Cu/litre. Expressed as a percentage of the controls the average
filtration rates of mussels exposed to 53, 72 and 90 µg Cu/litre were
44%, 33% and 27%, respectively. The EC50, based on filtration rate,
did not differ significantly from the 48-h EC50 (41 µg Cu/litre;
Kraak et al., 1994) during 9 weeks (43 µg Cu/litre). The NOEC for the
same parameter over 48 h was 16 µg Cu/litre (Kraak et al., 1994).
Ferrando & Andreu (1993) calculated 24-h EC50s, based on
filtration and ingestion rates, to be 43 and 53 µg Cu/litre for
Brachionus calyciflorus and 59 and 90 µg Cu/litre for
Daphnia magna.
Redpath & Davenport (1988) studied the action of three metals on
pumping rate in the common mussel (Mytilus edulis); they found that
pumping was stopped by shell valve adduction at copper concentrations
in the range 20.8-25.6 µg Cu/litre.
Mussels (Mytilus galloprovincialis) exposed to 40 µg Cu/litre
showed a significant increase in the levels of malondialdehyde
(indicative of the peroxidative process) and a decrease in the
concentration of glutathione in gills and digestive gland. The
lipofuscin content in lysosome of the digestive gland was
significantly increased (Viarengo et al., 1990).
Gill and hepatopancreas glycogen levels were significantly
reduced in freshwater mussels (Lamellidens corrianus) exposed to
concen trations of 100, 200 or 400 µg Cu/litre for up to 168 h
(Rajalekshmi & Mohandas, 1993).
Ferrando et al. (1993) studied the feeding rates of rotifers
(Brachionus calyciflorus) fed on the microalgae. A 5-h EC50, based
on feeding rate, was calculated to be 32 µg Cu/litre.
Weeks (1993) found a significant reduction in the feeding rate of
the talitrid amphipod Orchestia gammarellus at dietary
concentrations of 688 mg Cu/kg during 48-h tests. However, no
significant effect was found at concentrations up to and including 817
mg Cu/kg in 20-day exposures.
Phelps et al. (1983) studied the effects of copper-enriched
sediment on the burrowing behaviour of littleneck clams
(Protothaca staminea). Above a threshold of 5.8 mg Cu/kg added to
dry sediment, the time for 50% of the clams to burrow (ET50)
increased logarithmically with increasing sediment copper
concentration. Clams exposed to sediment mixed with a strong
chelating agent and copper showed no significant change in burrowing
time.
Interactions with other chemicals
Konar & Mullick (1993) studied the toxicity of different metal
mixtures on zooplankton (Diaptomus forbesi) in 48-h acute tests.
Zinc and iron individually were found to behave antagonistically in
combination with copper but synergistically when all three metals were
in combination. Copper in combination with lead alone, zinc and lead,
iron and lead, and a combination of all four metals showed a
synergistic interaction.
Vranken et al. (1988) exposed free-living marine nematodes
(Monhystera disjuncta) to copper in metal mixtures (mercury, zinc
and nickel). In 96-h tests, based on survival, all paired metal
mixtures acted in a less than additive manner. However, in EC50
tests, based on developmental inhibition, the response was not as
clear cut: the joint effect of copper with zinc, and copper with
nickel was synergistic. Copper-mercury combinations did not reveal a
clear mode of interaction.
Kaitala (1988) found that the presence of copper ions stimulated
the accumulation of zinc and magnesium in mussels (Mytilus edulis).
Zinc concentrations were 25% higher and zinc 100% higher than in the
absence of copper. Copper did not influence the uptake of magnesium
in burrowing clams (Macoma baltica) and zinc was not accumulated at
all.
9.3.2.3 Vertebrates
Lethality and growth effects
The acute toxicity of copper to freshwater and marine fish is
summarized in Tables 21 and 22, respectively. The 96-h LC50s for
freshwater fish range from 2.58 µg Cu/litre (Arctic grayling) to 7340
µg Cu/litre (bluegill). For marine fish, 96-h LC50 values range from
60 µg Cu/litre for chinook salmon to 1690 µg Cu/litre for killifish.
However, a 48-h LC50 for killifish was calculated to be 19 000 µg
Cu/litre. The toxicity of copper to amphibia is summarized in Table
23. For larvae of Bufo melanostictus and Xenopus laevis,
respectively, 48-h LC50s of 446 and 1700 µg Cu/litre were found.
Erickson et al. (1996) found the acute toxicity of copper to
fathead minnow (Pimephales promelas) to vary widely depending on the
chemical characteristics of the water. Increased pH, hardness,
sodium, dissolved organic matter and suspended solids each caused
toxicity to decrease on the basis of total copper concentrations, and
96-h LC50s, based on total copper, ranged from 7 to 305 µg Cu/litre
(0.11 to 4.8 µmol/litre) over the whole range of conditions tested in
flow-through tests. The results did not show a particularly good
correlation of toxicity to cupric-ion-specific electrode measurements.
The authors concluded that the effects of the different test
conditions on copper speciation have an important role in determining
toxicity; however, factors unrelated to chemical speciation also
influenced toxicity.
Smith & Heath (1979) studied the effect of temperature on the
acute (24-h) toxicity of copper to five species of freshwater fish.
There was considerable variation between species. There was a tendency
for a higher sensitivity at higher temperatures in goldfish, channel
catfish and rainbow trout; the converse was found for bluegill.
However, the differences caused by temperature were a factor of 2 or
less whereas the interspecies differences were as much as sixfold.
Table 21. Acute toxicity of copper to freshwater fish (48-h and 96-h LC50S)
Organism Size/age Conditionsa Temperature Hardness (mg pH Copper Parameter Concentration Reference
(°C) CaCO3/litre)b salt (µg/litre)
Chinook salmon 0.66 g stat 11-13 211 7.4-8.3 sulfate (25.3%) 96-h LC50 58 Hamilton
&
Oncorhynchus 0.87 g stat 11-13 211 7.4-8.3 sulfate (25.3%) 96-h LC50 54 Buhl
(1990)
tshawytscha alevin flow 12 24 7.1 ND 96-h LC50 26 Chapman
swim-up flow 12 24 7.1 ND 96-h LC50 19 (1978)
parr flow 12 24 7.1 ND 96-h LC50 38 Chapman
smolt flow 12 24 7.1 ND 96-h LC50 26 (1978)
Coho salmon 0.41 g stat 12 41.3 7.1-8.0 sulfate 96-h LC50 15 Buhl &
Oncorhynchus Hamilton
kisutch (1990)
6 g stat$ 13.5 33 7.0-7.5 ND 96-h LC50 17 (Cu2+) Buckley
6 g stat$ 13.5 33 7.0-7.5 ND 96-h LC50 164 (1983)
(total Cu)
2.7 kg flow 9.4 20 7.29 chloride 96-h LC50 46 Chapman
&
Stevens
(1978)
Rainbow trout 0.60 g stat 12 41.3 7.1-8.0 sulfate 96-h LC50 13.8 Buhl &
Oncorhynchus Hamilton
mykiss (1990)
1 g stat 12 44 7.1 Count-N* 96-h LC50 20.4 Mayer &
1 g stat 12 44 7.1 Count-NS* 96-h LC50 121 Ellersieck
1.6 g stat 13 44 7.1 sulfate (98%) 96-h LC50 135 (1986)
alevin flow 12 24 7.1 ND 96-h LC50 28 Chapman
swim-up flow 12 24 7.1 ND 96-h LC50 17 (1978)
parr flow 12 24 7.1 ND 96-h LC50 18 Chapman
smolt flow 12 24 7.1 ND 96-h LC50 29 (1978)
adult flow 9.2 42 7.57 chloride 96-h LC50 57 Chapman
&
Stevens
(1978)
Table 21. (continued)
Organism Size/age Conditionsa Temperature Hardness (mg pH Copper Parameter Concentration Reference
(°C) CaCO3/litre)b salt (µg/litre)
Brook trout juvenile flow 12 ND ND sulfate 96-h LC50 110 McKim &
Salvelinus Benoit
fontinalis (1971)
Cutthroat trout 2.1 g flow 13 194 7.8 chloride 96-h LC50 83.3 Chakoumakos
Salmo clarki 9.4 g flow 13 194 7.8 chloride 96-h LC50 221 et al.
25.6 g flow 13 194 7.8 chloride 96-h LC50 243 (1979)
Arctic grayling alevin stat 12 41.3 7.1-8.0 sulfate 96-h LC50 23.9-131c Buhl &
Thymallus fry stat 12 41.3 7.1-8.0 sulfate 96-h LC50 9.6 Hamilton
arcticus 0.34 g stat 12 41.3 7.1-8.0 sulfate 96-h LC50 2.58 (1990)
Fathead minnow 1 g stat 17 44 7.1 Count-N* 96-h LC50 35.9 Mayer &
Pimephales 1.1 g stat 17 44 7.1 Count-NS* 96-h LC50 154 Ellersieck
promelas 1.2 g stat 18 272 7.4 sulfate (98%) 96-h LC50 838 (1986)
22 mm flow 20-26 202 7.5-8.2 sulfate 96-h LC50 490 Pickering
55 mm flow 20-26 202 7.5-8.2 sulfate 96-h LC50 460 et al.
(1977)
3.2-4.2 cm stat 22 40-48 7.2-7.9 acetate 96-h LC50 390 Curtis et
al.
(1979)
47 mm flow 24 200 (154) 8.0 ND 96-h LC50 490 Geckler
et al.
56 mm flow 24 200 (154) 8.0 ND 96-h LC50 440 (1976)
Bluntnose minnow 15-16 mm flow 25 200 7.9-8.3 sulfate 96-h LC50 230 Horning
&
Pimephales Neiheisel
notatus (1979)
84 mm flow 24 200 (154) 8.0 96-h LC50 340 Geckler
et al.
(1976)
Bluegill 1.2 g stat 17 44 7.1 Count-N* 96-h LC50 3280 Mayer &
Lepomis 1.2 g stat 17 44 7.1 Count-N* 96-h LC50 13 700 Ellersieck
macrochirus 1 g stat 24 44 7.4 oxychloride (99%) 96-h LC50 980 (1986)
Table 21. (continued)
Organism Size/age Conditionsa Temperature Hardness (mg pH Copper Parameter Concentration Reference
(°C) CaCO3/litre)b salt (µg/litre)
L. machrochirus 1.5 g stat 18 44 7.1 sulfate (98%) 96-h LC50 884 Mayer &
(contd). 1.5 g stat 18 272 7.4 sulfate (98%) 96-h LC50 7340 Ellersieck
(1986)
18.6 g flow 24 200 (154) 8.0 ND 96-h LC50 8300 Geckler
19.2 g flow 24 200 (154) 8.0 ND 96-h LC50 10 000 et al.
(1976)
Green sunfish 1.1 g stat 18 44 7.1 sulfate (98%) 96-h LC50 3510 Mayer &
Lepomis 1.1 g stat 18 272 7.4 sulfate (98%) 96-h LC50 3400 Ellersieck
cyanellus (1986)
Pumpkinseed ND stat 28 55 8.0 ND 96-h LC50 2700 Rehwoldt
et al.
Lepomis gibbosus (1972)
Goldfish 0.9 g stat 18 272 7.4 sulfate (98%) 96-h LC50 13 800 Mayer &
Carassius Ellersieck
auratus (1986)
Golden shiner ND flow ND 72.2 7.5 chloride 96-h LC50 8460 Hartwell
et al.
Notemigonus (1989)
crysoleucas
Banded killifish ND stat 28 55 8.0 ND 96-h LC50 840 Rehwoldt
et al.
Fundulus (1972)
diaphanus
Striped bass ND stat 28 55 8.0 ND 96-h LC50 4000 Rehwoldt
et al.
Roccus saxatilis (1972)
White perch ND stat 28 55 8.0 ND 96-h LC50 6400 Rehwoldt
et al.
Table 21. (continued)
Organism Size/age Conditionsa Temperature Hardness (mg pH Copper Parameter Concentration Reference
(°C) CaCO3/litre)b salt (µg/litre)
Roccus (1972)
americanus
American eel ND stat 28 55 8.0 ND 96-h LC50 6000 Rehwoldt
Aguilla et al.
rostrata (1972)
Carp stat 28 55 8.0 ND 96-h LC50 800 Rehwoldt
et al.
Cyprinus carpio (1972)
3.5-5.5 g stat 20 50 7.5 ND 48-h LC50 118 Peres &
3.5-5.5 g stat 20 100 7.5 ND 48-h LC50 289 Pihan
3.5-5.5 g stat 20 300 7.5 ND 48-h LC50 751 (1991a)
3.5 cm stat$ 20 ND 7.1 sulfate 96-h LC50 300 Alam &
6.5 cm stat$ 15 ND 7.1 sulfate 96-h LC50 1000 Maughan
(1992)
Fantail 36.8 mm stat 19-21 ND ND sulfate 96-h LC50 333d Lydy &
Etheostoma 36.8 mm stat 19-21 ND ND sulfate 96-h LC50 385e Wissing
flabellare (1988)
Johnny darter 39.2 mm stat 19-21 ND ND sulfate 96-h LC50 489d Lydy &
Etheostoma 39.2 mm stat 19-21 ND ND sulfate 96-h LC50 569e Wissing
nigrum (1988)
Rainbow darter 41 mm flow 24 200 (154) 8.0 ND 96-h LC50 320 Geckler
et al.
Etheostoma (1976)
caeruleum
Orangethroat 55 mm flow 24 200 (154) 8.0 ND 96-h LC50 850 Geckler
darter et al.
Etheostoma (1976)
spectabile
Table 21. (continued)
Organism Size/age Conditionsa Temperature Hardness (mg pH Copper Parameter Concentration Reference
(°C) CaCO3/litre)b salt (µg/litre)
Stoneroller 60 mm flow 24 200 (154) 8.0 ND 96-h LC50 290 Geckler
Campostoma et al.
anomalum (1976)
Creek chub 64 mm flow 24 200 (154) 8.0 ND 96 h LC50 310 Geckler
Semotilus et al.
atromachulatus (1976)
Blacknose dace 47 mm flow 24 200 (154) 8.0 ND 96-h LC50 320 Geckler
Rhinichthys et al.
atratulus (1976)
Brown bullhead 39 mm flow 24 200 (154) 8.0 ND 96-h LC50 540 Geckler
Ictalurus et al.
nebulosus (1976)
Striped shiner 55 mm flow 24 200 (154) 8.0 ND 96-h LC50 790 Geckler
Notropis 55 mm flow 24 200 (154) 8.0 ND 96-h LC50 1900 et al.
chrysocephalus (1.7 g) (1976)
Mudfish 27.1 g stat ND ND ND sulfate 96-h LC50 4301 Ebele et
Clarias al. (1990)
anguillaris
Cichlid 82 g stat 22 ND 7.24 ND 96-h LC50 1059 Al-Akel
Oreochromis (1987)
niloticus
a Stat = static conditions (water unchanged for duration of test); stat$ = static renewal
conditions (water changed at regular intervals); flow = flow-through conditions
(copper concentration in water continuously maintained); ND = no data available.
Table 21. (continued)
b Alkalinity in parentheses (mg/litre).
c Range of LC50s for fish from different sources.
d Fish collected in winter
e Fish collected in summer.
Table 22. Acute toxicity of copper to marine fisha
Organism Size/age Conditions Temperature Salinity pH Copper Parameter Concentration Reference
(°C) (%0) salt (µg/litre)
Chinook salmon 1.6 g stat 11-13 brackish 7.6-8.1 sulfate 96-h LC50 60 Hamilton &
Oncorhynchus (25.3%) Buhl (1990)
tshawytscha
Coho salmon smolt flow 13 28.6 8.1 chloride 96-h LC50 601 Dinnell et
Oncorhynchus al. (1989)
kisutch
Topsmelt larvae stat 21 33 ND chloride 96-h LC50 238 Anderson et
Atherinops affinis al. (1991)
Tidewater 19 days stat 25 20 ND nitrate 96-h LC50 140 Mayer (1987)
silverside (34%)
Menidia peninsulae
Spot adult stat 25 20 ND nitrate 96-h LC50 280 Mayer (1987)
Leiostomus (34%)
xanthurus
Sheepshead minnow larvae stat$ 25 34-35 6.2-8.2 nitrate 96-h LC50 > 220 fed Hutchinson
Cyprinodon et al. (1994)
variegatus
Rivulus marmoratus 0.03-0.1 g flow 26-27 14 ND ND 96-h LC50 1250-1610 Lin & Dunson
(1993)
Killifish 0.02-0.13 g flow 26-27 14 ND ND 96-h LC50 1690 Lin & Dunson
(1993)
Fundulus juvenile stat$ 20 10 ND ND 48-h LC50 19 000 Burton &
heteroclitus Fisher (1990)
Dab 16.9 g flow 12 34.6 7.7 nitrate 96-h LC50 300 Taylor et al.
Limanda limanda (1985)
Table 22. (continued)
Organism Size/age Conditions Temperature Salinity pH Copper Parameter Concentration Reference
(°C) (%0) salt (µg/litre)
Grey mullet 0.87 g flow 12 34.6 7.7 nitrate 96-h LC50 1400 Taylor et al.
Chelon labrosus (1985)
Shiner perch adult flow 13.2 29.5 7.8 chloride 96-h LC50 418 Dinnell et
Cymatogaster al. (1989)
aggregata
a Stat = static conditions (water unchanged for duration of test); stat$ = static renewal conditions (water changed at regular intervals);
Flow = flow-through conditions (copper concentration in water continuously maintained); ND = no data available.
Chakoumakos et al. (1979) found the acute toxicity of copper to
cutthroat trout (Salmo clarki) to be inversely correlated with both
water hardness and alkalinity. The 96-h LC50s ranged from 15.7 µg
Cu/litre at low alkalinity (20.1 mg CaCO3/litre) and hardness (26.4
mg/litre) to 367 µg Cu/litre at high alkalinity (178 mg/litre) and
hardness (205 mg/litre). The most important copper species causing
toxicity within the pH range tested were Cu2+, Cu(OH)+ and
Cu(OH)20. The concentration of each of these species varies with pH
and alkalinity. Lower pHs favour Cu2+; higher pHs favour Cu(OH)+
and Cu(OH)20. Lower alkalinities favour all three species.
Peres & Pihan (1991a) reported a similar relationship between
acute copper toxicity and hardness for both carp (Cyprinus carpio)
and rainbow trout (Oncorhynchus mykiss): 48-h LC50s for trout
ranged from 25 µg Cu/litre to 560 µg Cu/litre at a water hardness
ranging from 10 to 300 mg/litre. For carp, LC50s ranged from 118 to
751 µg/litre whilst the hardness ranged from 50 to 300 mg/litre. The
toxicity of copper to rainbow trout decreased with increasing
hardness. LC50s (15 days) ranged from 18 µg Cu/litre at a hardness
of 12 mg CaCO3/litre to 96 µg Cu/litre at a hardness of 97 mg/litre.
Miller & Mackay (1980) tested the effects of different hardness
(12-99 mg CaCO3/litre) and alkalinity (10-51 mg CaCO3/litre) on
acute toxicity of copper to rainbow trout. Toxicity was inversely
related to hardness at all alkalinities and to alkalinity at higher
hardness. Incipient median lethal concentrations ranged from 18 to 96
µg Cu/litre. Howarth & Sprague (1978) evaluated the acute toxicity of
copper to rainbow trout in waters of various hardness, alkalinity and
pH and reported 96-h LC50s to range from 20 to 516 µg Cu/litre.
Cusimano et al. (1986) reported the 96-h LC50 for rainbow trout to
vary from 66 µg Cu/litre at pH 4.7 (alkalinity -0.2 mg CaCO3/litre)
to 2.8 µg Cu/litre at pH 7.0 (alkalinity 11 mg CaCO3/litre).
Welsh et al. (1993) determined the acute toxicity of copper to
larval fathead minnows in waters of varying pH and dissolved organic
carbon (DOC). Toxicity was inversely related to both parameters, with
96-h LC50s ranging from 2.0 µg Cu/litre at pH 5.6 and 0.2 mg
DOC/litre to 182 µg/litre at pH 7 and 16 mg DOC/litre. Empirical
regression equations were derived that could be useful for predicting
toxicity in different waters and the slopes of these equations were
similar to those reported by Erickson et al. (1987, 1996).
Anderson et al. (1994) reported 7-day LC50s and NOECs from three
different laboratories for larval topsmelt. LC50s were 162 and 274
µg Cu/litre and NOECs were 100 µg Cu/litre at a salinity of 34%.
LC50s were 55.7 and 58.4 µg Cu/litre and NOECs were 32 µg Cu/litre at
a salinity of 20%. LC50s and NOECs were calculated for topsmelt
which were spawned at different times of the year over a 2-year period
(1990-1991). NOECs for copper were 100 µg Cu/litre except two 180 µg
Cu/litre (November 1990) and 56 µg Cu/litre (May 1991); LC50s for
these tests ranged from 131 to 240 µg Cu/litre.
Table 23. Acute toxicity of copper to amphibians
Organism Size/age Conditionsa Temperature Hardness (mg pH Copper Parameter Concentration Reference
(°C) CaCO3/litre) salt (µg/litre)
Clawed toad larvae stat 20 ND ND sulfate 48-h LC50 1700 DeZwart &
Xenopus laevis Sloof (1987)
Toad larvae stat 31 185 7.4 sulfate 48-h LC50 446 Khangarot
Bufo larvae stat 31 185 7.4 sulfate 96-h LC50 320 & Ray
melanostictus (1987)
a Stat = static conditions (water unchanged for duration of test); ND = no data available.
McNulty et al. (1994) carried out a series of 7-day growth and
survival experiments with larval topsmelt (Atherinops affinis) of
different ages. Fish aged 0, 3 and 5 days were less sensitive to
copper than fish > 7 days old. LC50s ranged from 365 µg Cu/litre
in 0-day larvae to 137 µg Cu/litre in 20-day larvae. NOECs were
constant for all age groups at 180 µg Cu/litre for fish 1 and 3 days
old and 100 µg Cu/litre for all other groups. Pickering & Lazorchak
(1995) exposed fathead minnow (Pimephales promelas) to copper in a
7-day larval survival and growth test. The NOEC and LOEC, based on
growth, were 25 and 50 µg Cu/litre, respectively, for larvae 1, 4 and
7 days old. For survival the NOEC and LOEC were 200 and 400 µg
Cu/litre, respectively, for 1-day-old and 4-day-old larvae; however,
for 7-day-old larvae the NOEC and LOEC were 100 and 200 µg Cu/litre.
The subchronic value (geometric mean of NOEC and LOEC) was 35 µg
Cu/litre. The authors found the test to be relatively insensitive to
changes in test conditions.
Hutchinson et al. (1994) exposed sheepshead minnow larvae
(Cyprinodon variegatus) to copper for 7 days. NOECs for survival
and growth were 120 and 220 µg Cu/litre, respectively; LOECs were 220
and > 220 µg Cu/litre, respectively. A subchronic value was
calculated as the geometric mean of the highest NOEC and the lowest
LOEC; these were 160 µg Cu/litre for survival and > 220 µg Cu/litre
for growth.
Seven-day survival tests with coho salmon
(Oncorhynchus kisutch) carried out following 16 weeks exposure
indicate that the exposed fish became significantly more tolerant of
copper. The 168-h LC50 for previously unexposed fish was 220 µg
Cu/litre whereas fish exposed to 140 µg Cu/litre were 2.5 times less
sensitive at 550 µg Cu/litre (Buckley et al., 1982).
Collvin (1985) studied the effect of copper (1-81 µg Cu/litre) on
the maximal growth rate of perch (Perca fluviatilis) over a 30-day
period. Copper reduced maximal growth rate at concentrations > 22 µg
Cu/litre. Reduced growth rate was mainly an effect of reduced food
conversion efficiency attributed to an increased metabolism caused by
detoxification.
Lanno et al. (1985) fed rainbow trout (Oncorhynchus mykiss) on
a diet containing copper at concentrations ranging from 9 to 3088 mg
Cu/kg for 8 weeks, and from 8.5 to 664 mg Cu/kg for up to 24 weeks.
After 8 weeks reduced weight gain and feed intake, increased
feed : gain ratios and mortalities were observed in trout reared on
test diets containing > 730 mg Cu/kg. Trout receiving 1585 or 3088
mg Cu/kg showed pronounced food refusal. After 16 weeks trout reared
on a diet containing 664 mg Cu/kg had significantly lower live body
weights, although there was no significant difference after 24 weeks.
Mount et al. (1994) fed rainbow trout (Oncorhynchus mykiss) on
a brine shrimp (Artemia sp.) diet containing 440, 830 or 1000 mg
Cu/kg (dry weight) for up to 60 days. Fish fed the 830 or 1000 mg
Cu/kg diets showed 30% mortality during the experiment. No
significant effect of copper on growth was observed. The authors
conclude that waterborne copper released from Artemia may have
contributed to the mortality.
Effects on reproduction and early life-stages
Stouthart et al (1996) exposed newly fertilized common carp
(Cyprinus carpio) eggs to copper (19.1 and 50.8 µg/litre; 0.3 and
0.8 µmol/litre) at pH 6.3 and 7.6. No significant effect of copper on
egg mortality, larval heart rate and tail movement or whole-body
potassium and magnesium content was observed at pH 7.6. However,
whole-body sodium and calcium were significantly decreased and larval
mortality and larval deformation were significantly increased at the
higher copper exposure. At pH 6.3, exposure to 50.8 µg Cu/litre (0.8
µmol/litre) significantly increased egg mortality and decreased heart
rate and tail movements; premature hatching and a
concentration-dependent increase in larval mortality and larval
deformation were also observed. The whole-body content of potassium,
sodium, magnesium, and calcium were all significantly decreased by
both copper exposures at pH 6.3.
Anderson et al. (1991) carried out both fertilization tests and
embryo development tests on topsmelt (Atherinops affinis). In
fertilization tests percentage fertilization was measured following
exposure of sperm to copper. The NOEC values for four fertilization
tests ranged from 32 to > 90 µg Cu/litre; EC50s ranged from 24 to
163 µg Cu/litre. In embryo tests embryos were checked for up to 12
days for viability, abnormalities, mortality and hatching success.
The NOEC for embryo abnormalities ranged from 55 to 123 µg Cu/litre;
EC50s ranged from 115 to 180 µg Cu/litre. The NOEC for larval
hatching success and for larval abnormalities ranged from 55 to 123 µg
Cu/litre, and from 55 to 68 µg Cu/litre for the two parameters,
respectively; EC50s ranged from 108 to 182 µg Cu/litre, and from 75
to 190 µg Cu/litre.
Pickering et al. (1977) exposed fathead minnow
(Pimephales promelas) to copper (8-100 µg Cu/litre) at 6, 3 and 0
months prior to spawning. The prespawning exposure time had no
significant effect on reproduction. However, egg production was
significantly lower at concentrations of 37 µg Cu/litre or more. The
maximum acceptable toxicant concentration (MATC) was estimated to be
32 µg Cu/litre.
Dave & Xiu (1991) monitored the effects of copper chloride on
hatching and survival of zebrafish (Brachydanio rerio) exposed from
post-fertilization for 16 days. Significant mortality of embryos
occurred at concentrations of 32 µg Cu/litre and above during the
first day of exposure. For exposures of 1-16 µg Cu/litre, hatch was
significantly delayed relative to the control value of 4 days and
embryo mortality exceeded 50%. Delayed hatching was also reported at
concentrations < 1 µg Cu/litre, but effect levels are very uncertain
because exposure concentrations were unmeasured and background
concentrations are unknown.
Scudder et al. (1988) exposed embryos of fathead minnow
(Pimephales promelas) to total copper concentrations ranging from
0.6 to 621 µg Cu/litre from 5 to 10 h post-fertilization to 2 days
post-hatch. Significant declines in percentage survival and
percentage total hatch were observed at 621 µg Cu/litre but not at 338
µg Cu/litre. A significant increase in the number of embryos with
abnormalities was observed at > 338 µg Cu/litre. Larval fish were
exposed to copper at the same concentrations for 28 days post-hatch.
Fish growth was significantly reduced and percentage abnormalities
increased at the lowest treatment concentration (61 µg Cu/litre) and
effects increased with increasing concentration. Percent survival was
significantly reduced at concentrations of 113 µg Cu/litre and above
and the 28-day LC50 was estimated to be 128 µg Cu/litre.
Mount (1968) conducted an 11-month, full-life-cycle exposure of
fathead minnows to copper in a hard water (hardness 200 mg
CaCO3/litre, alkalinity 160 mg CaCO3/litre, pH 7.9). Growth and
survival were significantly reduced at 95 µg Cu/litre and reproduction
was completely suppressed at 32-34 µg Cu/litre, but unaffected at
14-15 µg Cu/litre. In a softer water (hardness 31 mg CaCO3/litre,
alkalinity 30 mg CaCO3/litre, pH 7.0), Mount & Stephen (1969)
reported survival, growth, and reproduction to be significantly
affected at 18.4 µg Cu/litre, but not at 10.6 µg Cu/litre.
McKim et al. (1978) tested the effects of copper on the growth
and survival of embryos and larvae of eight fish species. The
standing crop of fish after 30-70 days post-hatch was significantly
reduced at exposure concentrations of 32 µg Cu/litre for rainbow
trout, 34 µg Cu/litre for white sucker, 44 µg Cu/litre for brook
trout, 42 µg Cu/litre for lake trout, 46 µg Cu/litre for brown trout,
103 µg Cu/litre for lake herring, 104 µg Cu/litre for northern pike,
and 104 µg Cu/litre for smallmouth bass.
Seim et al. (1984) contrasted the effects of continuous and
intermittent (4.5 h/day) exposure of steelhead trout to copper for 78
days. The EC50 for growth reduction on the basis of average copper
concentrations was 46 µg Cu/litre for continuous exposure, but only 27
µg Cu/litre for intermittent exposure.
Sayer et al. (1989) exposed yolk-sac fry of brown trout
(Salmo trutta) to copper concentrations of 1.2, 2.5 and 5.1 µg
Cu/litre (20, 40 and 80 nmol/litre) at pH 4.5 and at calcium
concentrations of 20 or 200 µmol for 30 days. Mortalities were high
(70-100%) at the lower calcium concentration for all three copper
concentrations. Only one death was observed for copper and high
calcium exposures. At high calcium levels, impaired sodium, potassium
and calcium uptake were observed for all three copper concentrations.
Horning & Neiheisel (1979) exposed bluntnose minnow
(Pimephales notatus) to copper concentrations ranging from 4.3
(control) to 119.4 µg Cu/litre. Minnows exposed to 119.4 µg Cu/litre
for 60 days were significantly smaller than the other groups.
Survival of parental bluntnose minnows was not affected by any copper
concentrations during the 60-day exposure. Copper
concentrations > 18 µg Cu/litre significantly reduced the number of
spawnings, the total number of eggs produced and the number of eggs
per female. Therefore, the MATC based on reproductive impairment was
between 4.3 and 18 µg Cu/litre. Minnows held in "clean" water for 9
months ceased to spawn on exposure to 119.4 µg Cu/litre. Fish exposed
to 119.4 µg Cu/litre for the same 9-month period began to spawn 60
days after being transferred to "clean" water.
McKim & Benoit (1971) exposed brook trout
(Salvelinus fontinalis) to copper(II) concentrations ranging from
1.9 to 32.5 µg Cu/litre for 22 months. The highest concentration
decreased survival and growth in adult fish, and reduced the number of
viable eggs produced and hatchability. No effects on adult survival,
growth or reproduction were observed at copper concentrations of 17.4
µg/litre or less. Concentrations of 17.4 and 32.5 µg Cu/litre had
marked adverse effects on survival and growth of alevins and juvenile
fish. Therefore, the MATC for brook trout exposed to copper (hardness
45 mg CaCO3/litre; pH 7.5) was between 9.5 and 17.4 µg Cu/litre.
Benoit (1975) exposed bluegills (Lepomis macrochirus) to copper
concentrations ranging from 12 to 162 µg Cu/litre for a period of 22
months. Adult bluegill survival and reproduction were significantly
affected only at the highest copper concentration of 162 µg Cu/litre.
A 90-day exposure of larvae transferred at hatch revealed a
significant reduction in survival at > 40 µg Cu/litre; larval
growth was not significantly reduced at 77 µg Cu/litre and below.
Metabolic, biochemical and physiological effects
Beckman & Zaugg (1988) exposed chinook salmon
(Oncorhynchus tshawtscha) to natural springwater with an elevated
copper concentration (48 µg/litre). In parr, gill Na+, K+-ATPase
activity was unaffected by an 18-h exposure, whereas in smolt there
was significant inhibition. In both parr and smolt there were
significant increases in haematocrit and plasma glucose.
Arillo et al. (1984) investigated the effect of copper at levels
of 30-100 µg Cu/litre on a wide variety of biochemical parameters in
the rainbow trout (Oncorhynchus mykiss). The exposure period was 4
months. Copper significantly reduced ALAD (aminolaevulinic acid
dehydratase) activity in liver, carbonic anhydrase activity in blood,
gill sialic acid content and the respiratory control ratio and oxygen
consumption in liver mitochondria.
Heath (1991) exposed bluegill (Lepomis macrochirus) to a free
copper concentration of 261 µg Cu/litre for 7 days. Copper caused an
elevation in plasma glucose of approximately 100% and a significant
reduction in liver ATP. Acute hypoxia stress responses such as
hyperglycaemia, lower plasma sodium, lower liver ATP and higher plasma
potassium were accentuated by prior exposure to copper.
Nemcsók & Hughes (1988) exposed rainbow trout to concentrations
of 200 or 2000 µg Cu/litre for up to 48 h. Activities of blood
glucose, ASAT and ALAT were significantly increased after 24 h at 2000
µg Cu/litre and after 48 h at the lower concentration. Significant
decreases in acetylcholinesterase activity were observed over the same
time periods at each of the copper concentrations. Copper sulfate
(200 µg/litre) had only a slight damaging effect on tissues after 24 h
as indicated by biochemical and haematological parameters. However,
the addition of sulfuric acid (pH 6.5) significantly increased blood
glucose, ASAT, ALAT and lactate dehydrogenase, and significantly
decreased acetyl cholinesterase activity.
Muñoz et al. (1991) exposed juvenile rainbow trout to copper (50
µg Cu/litre) for 21 days. Copper caused rapid and significant
elevations of plasma cortisol levels; plasma sodium showed a
significant decrease for 7-15 days.
Lydy & Wissing (1988) studied the thermal resistance of fantail
darters (Etheostoma flabellare) and johnny darters (E. nigrum)
exposed to copper at sublethal concentrations for 96 h. Thermal
resistance was determined using the critical thermal maxima (CTMAX)
with loss of equilibrium as the end-point. The mean CTMAX value for
fantail darters exposed to 149 µg Cu/litre was 7.6°C below that of the
control means. In johnny darters, a concentration of 292 µg Cu/litre
depressed the CTMAX value by 5.2°C. The NOEC for the fantail darter
was 42 µg Cu/litre and for the johnny darter 128 µg Cu/litre.
Structural effects and malformations
Benedetti et al. (1989) exposed brown bullhead
(Ictalurus nebulosus) to concentrations of 5000 µg Cu/litre for 24 h
and 300 µg Cu/litre for 40 days. All fish reared for more than 1
month in 300 µg Cu/litre showed epidermal changes such as an increase
in mucus cell numbers and a tendency for the cells to become
superficial. In fish most severely impaired by copper poisoning the
epidermis appeared thinner in patches compared with controls. The
gills of fish exposed to 5 mg Cu/litre were markedly damaged with
swollen and hyperaemic lamellae, necrosis and disaggregation of the
epithelium, whereas fish in the 300 µg Cu/litre group showed more
variable gill damage. Histomorphological analysis of livers from both
groups did not reveal diffuse changes in the hepatic parenchyma.
However, areas of patchy degeneration and isolated degenerated
elements located within areas of normal hepatocytes were observed.
Histochemical staining revealed that all treated fish had lower liver
glycogen content than controls.
Khangarot (1992) investigated ultrastructural alterations in the
liver of snake-headed fish (Channa punctatus) following exposure to
50 and 100 µg Cu/litre using transmission electron microscopy. After
4 days at 50 µg Cu/litre there is a marked proliferation of the smooth
endoplasmic reticulum (SER), complete degeneration of rough
endoplasmic reticulum (RER), loss of ribosomes from the surface of
RER, a random distribution of ribosomes throughout the cytoplasm and
an increase in the number and size of SER cisternae. Mitochondrial
swelling, and the loss of internal and external mitochondrial
membranes, were observed. A large number of vacuoles and lysosome
having dense bodies were observed after 7 days exposure. The
lysosomal matrix frequently displayed crystalline structures of
various sizes and the nuclear size was reduced with chromatin material
clumped within the nucleus. Prominent changes in nuclei of fish
hepatocytes were observed after exposure to 100 µg Cu/litre. Rupture
of nuclear membranes and clumping of chromatin in necrotic cell nuclei
with the aggregation of interchromatin material at the centre of the
nucleus were recorded. More dilation and vesiculation were observed
in RER after 7 days. Aggregation of SER and RER, rupturing of
mitochondrial membrane, a decrease in the number of mitochondria and
an increase in the number of Golgi complexes were also observed.
Kirk & Lewis (1993) studied copper-induced changes in gills of
rainbow trout (Oncorhynchus mykiss) by scanning electron microscopy.
Trout exposed to 500 µg Cu/litre for 2 h showed collapse of lamellae
and considerable secretory activity of mucous cells. Filament tips
were swollen and bent, and had an increase in the number of mucous
cells which extruded copious amounts of mucus. Exposure of fish to
1000 µg Cu/litre caused the gills to be covered in mucus and cellular
debris. There were many ruptured and exhausted mucous cells, lamellar
fusion occurred and epithelial cells were extremely swollen throwing
the gill surface into swellings and ridges. There was a greater
proliferation of chloride and mucous cells, and increased mucus
secretion compared with the lower copper exposure.
Behavioural effects
Pedder & Maly (1985) studied the attraction-avoidance response of
rainbow trout at concentrations ranging from 500 to 4000 µg Cu/litre.
There was an initial attraction response at all copper concentrations
which led to high mortality at 3000 and 4000 µg Cu/litre. Avoidance
of copper was observed, following the initial period of attraction, at
> 500 µg Cu/litre; maximum avoidance at 1.0 mg Cu/litre. The 96-h
EC50, based on avoidance, was between 500 and 750 µg Cu/litre.
Hartwell et al. (1989) found the avoidance threshold for golden shiner
(Notemigonus crysoleucas) to be 26 µg Cu/litre in flow-through
tests.
Ellgaard & Guillot (1988) observed that exposure to copper
elicited a hypoactive response in bluegill at all concentrations
tested (40, 80 and 400 µg Cu/litre) and that the effect was
concentration-dependent. At all concentrations, locomotor activity
appeared to fall rapidly during the first 4 days following exposure
and then tended to plateau for the rest of the 8-day exposure.
Steele (1989) studied the effect of sublethal exposures of copper
(50, 100 and 200 µg Cu/litre) on the daily activity of sea catfish
(Arius felis) after a 72-h static exposure. Fish exposed to 0.1 or
0.2 mg Cu/litre showed significant hyperactivity and a loss of the
normal daily activity pattern of this species; the same two exposure
groups showed significantly less variability in activity.
9.3.2.4 Model ecosystems and community effects
Havens (1994a) dosed mesocosms with copper concentrations ranging
from 2 to 200 µg Cu/litre for 5 days. There was a significant
negative relationship between total algal biovolume and copper dose.
The decline in algal biovolume at higher doses (> 50 µg Cu/litre)
reflected the loss of Rhodomonas, Aphanizomeron, Chlamydomonas and
Ceratium. The assemblage that survived was dominated by diatoms.
There was a significant negative exponential relationship between
zooplankton biomass and copper dose. The most sensitive species were
the calanoid copepods with a biomass reduction of > 50% at 20 µg
Cu/litre; the cyclopoids were the most tolerant with more than 50% of
the biomass of cyclopoid copepodids surviving the highest dose.
Havens (1994b) exposed a freshwater plankton community to copper
(140 µg Cu/litre) for 14 days. Copper significantly reduced the dry
weight biomass of zooplankton, ciliates, flagellates and autotrophic
phytoplankton. Bacterial biomass was significantly increased; however,
this resource went virtually unexploited because the most effective
bacterial grazers (large cladocerans and protozoans) were greatly
reduced by copper exposure.
Hedtke (1984) exposed an aquatic microcosm to copper for 32 weeks
under flow-through conditions. No significant effects on material
cycling and biological structure were observed at 4.0 µg Cu/litre. At
9.3 µg Cu/litre primary production levels were significantly reduced
by the end of the experiment and dissolved organic carbon production
was substantially lower than controls. Copper concentrations > 30
µg Cu/litre significantly lowered primary production and macroalgal
growth, and there were substantial structural changes increasingly
shifting from autotrophic to heterotrophic systems with increasing
copper levels.
Scanferlato & Cairns (1990) spiked sediment with copper
concentrations of 10, 100 or 1000 mg Cu/kg dry sediment in an aquatic
microcosm. Most of the added copper remained bound to sediment
particles during the 8-week experiment. The lowest concentration had
no effect on the structure or function of the microcosm. In
microcosms exposed to 100 mg Cu/kg (500 µg Cu/litre in overlying
water) both chlorophyll a content and respiration were significantly
decreased. Other structural and functional attributes were rather
variable. Significant decreases in production, respiration,
respiration/biomass ratio, ATP and chlorophyll a, and significant
increases in assimilation ratio and autotrophic index were observed at
1000 mg Cu/kg (overlying water concentration = 20 mg Cu/litre).
Hart et al. (1992) evaluated the effects of copper on
phytoplankton communities in 5-m diameter (40-m3 volume) enclosures
in Island billabong (floodplain on Magela Creek, northern Australia).
Copper (1.3 g) was added to the enclosure at a rate thought to be 10×
the normal wet season values for Island billabong. Concentrations of
total copper over the 10-week experiment ranged from 2.2 to 51 µg
Cu/litre in the treatment and 3.9 to 26 µg Cu/litre in the control.
The addition of copper had little effect on the phytoplankton
populations.
Winner et al. (1990) evaluated the seasonal responses of
planktonic and benthic communities exposed to copper concentrations of
20 or 40 µg Cu/litre in oligotrophic ponds for 5-week periods.
Phytoplankton and zooplankton were more sensitive to copper in the
spring than in the summer or autumn. Zooplankton exhibited a 43% and
an 86% reduction in density in the 20 and 40 µg Cu/litre enclosures,
respectively. The authors suggest that this is related to seasonal
changes in the dissolved organic carbon content of the ponds.
Winner & Owen (1991a) evaluated the toxicity of copper to
daphnids in 7-day chronic tests (Ceriodaphnia dubia) and algae in
4-day cell reproduction tests (Chlamydomonas reinhardii) using
filtered pond water from Brandenburg Pond, Ohio, USA. The studies
were performed numerous times over a 6-month period. C. reinhardii
NOECs were typically 20-40 µg Cu/litre whereas for C. dubia they
were 50-80 µg Cu/litre. For both species, NOECs increased with
increasing alkalinity and hardness. C. reinhardii NOECs based on
cell growth also declined with increasing dissolved organic carbon
values.
Winner & Owen (1991b) examined the sensitivity of freshwater
phytoplankton communities to chronic copper exposure in 100-litre
polyethylene enclosures in Brandenburg Pond, Ohio, USA. The studies
were conducted in four 5-week exposures over the course of 2 years.
Nominal exposure levels of 0, 20 and 40 µg Cu/litre were used and
verified analytically. Over the course of the experiment 82 taxa of
phototrophs were identified in the enclosures. Seasonal variation in
algal population density was observed with the largest depression of
the algal populations in the two spring exposures at both the 20 and
40 µg Cu/litre concentrations. Summer and fall population responses
to copper at the 20 and 40 µg Cu/litre level were minimal, although
individual taxa were effected. During the first spring exposure,
effects on zooplankton and benthos were also measured (Moore & Winner,
1989). Small mayflies and chironomids were effected at 40 µg Cu/litre
and no effects on benthos were observed at 20 µg Cu/litre. Rotifers
and copepods exhibited significant reduction in density at both 20 and
40 µg Cu/litre. Daphnids were not affected at either treatment level,
which was consistent with laboratory toxicity tests with
Ceriodaphnia dubia.
Moore & Winner (1989) studied the effect of copper (20 and 40 µg
Cu/litre) on zooplankton and benthos in enclosure experiments. During
5-week exposures copper caused significant decreases in the alga
Uroglena, rotifers, cyclopoids and calanoid copepods. The density of
small mayflies and chironomids was significantly decreased at the
higher copper exposure. Other benthic organisms such as fingernail
clams, larger midges and mayflies were not affected by copper but
rather by fish predation and/or adult emergence. Daphnia achieved
significantly higher densities at 20 µg Cu/litre than in the controls.
Clements et al. (1989) conducted experiments in artificial
streams to examine the influence of water quality on the
macroinvertebrate responses to copper. The effects of copper on the
reduction of macroinvertebrate abundance was greater in streams of low
hardness (53-60 mg/litre) and alkalinity (49-61 mg/litre) at a copper
concentration of 6 µg Cu/litre compared with streams of higher
hardness (150-157 mg/litre) and alkalinity (137-146 mg/litre), and a
copper concentration of 15 µg/litre. However, the responses to copper
were highly variable among taxa. Tanytarsini chironomids and the
mayflies Baetis brunneicolor and Isonychia bicolor were
particularly sensitive, whereas Orthocladiini chironomids and
net-spinning caddisflies were quite tolerant of copper in experimental
streams.
Clements et al. (1988, 1990) conducted a series of
macroinvertebrate community toxicity tests with copper in
laboratory- and field-constructed aquatic streams using water from the
New River in Giles County, Virginia, USA. Rock-filled trays were
colonized by macroinvertebrates in the New River for 30 days and then
placed in either the laboratory- or the field-constructed streams. The
results of the 1988 laboratory experiments indicated that 96-h
exposures to copper (low dose = 15-32 µg Cu/litre) resulted in a
reduction in the number of taxa present by 24-36%. In 1990, 10-day
exposures were performed with copper and laboratory and field results
compared. The field-constructed streams showed significantly less
response to copper than the macroinvertebrates in laboratory-housed
streams. The low dose (11.3 µg Cu/litre) resulted in a 10% reduction
of taxa and 44% reduction in species abundance in field constructed
streams as compared to 56 and 75% reduction in laboratory streams,
respectively. Species of the order Ephemeroptera (mayflies) were the
most sensitive in both studies.
A field study was conducted at Shayler Run, a natural stream near
Clermont County, Ohio, USA, to determine the effects of copper on
stream biota (Geckler et al., 1976). A single nominal concentration
of 120 µg Cu/litre was chosen as the test level. This value was
selected because it was thought that it would be high enough to affect
sensitive fish populations, based on laboratory chronic fish studies
performed earlier. This stream was also known to receive sewage from
a small waste treatment plant 6.5 km (4 miles) upstream from the test
area. Measured concentrations in the treated portion of the stream
during the study ranged from 44.1 to 96.3 µg Cu/litre. All but one
abundant fish species in the stream and four of the five abundant
macroinvertebrates were adversely affected by the exposure to copper.
Leland et al. (1989) exposed oligotrophic streams to copper
concentrations ranging from 2.5 to 15 µg total Cu/litre (12-75 ng
Cu2+ activity/litre calculated by computer modelling). Declines in
population density of species representing all major orders
(Ephemeroptera, Plecoptera, Coleoptera, Trichoptera and Diptera)
occurred at 5 and/or 10 µg total Cu/litre. Herbivores were more
sensitive to copper toxicity than predators.
Saward et al. (1975) exposed a marine food chain, comprised of
phytoplankton, bivalves (Tellina tenuis) and fish (plaice
Pleuronectes platessa), to copper at concentrations of 10, 30 and
100 µg Cu/litre for 100 days. All copper exposures reduced the
standing crop and the rate of photosynthesis per unit of chlorophyll
a in phytoplankton. Copper adversely affected bivalve condition by
means of a reduction in carbohydrate reserves and nitrogen levels.
Fish showed reduced growth; however, no significant change in
condition or biochemical composition was reported.
9.3.3 Terrestrial organisms
9.3.3.1 Plants
Generally visible symptoms of copper toxicity are small chlorotic
leaves and early leaf fall. Growth is stunted, and initiation of
roots and development of root laterals are poor. Reduced root
development may result in a lowered water and nutrient uptake which
leads to disturbances in the metabolism and growth retardation
(Balsberg Påhlsson, 1989).
Toxicity to plants grown hydroponically
Beckett & Davis (1977) stated that yield alone is a poor index of
toxicity since the height of the plateau depends on many other
factors. The toxic effects of a given concentration also depend on
many factors. However, the effect on yield of a potentially harmful
element depends mainly on its concentration in the tissue. Therefore,
the tissue concentration of the element at the upper critical level
should be relatively independent of other factors. Davis & Beckett
(1978) grew barley (Hordeum vulgare), lettuce (Lactuca sativa),
rape (Brassica napus) and wheat (Triticum aestivum) in a nutrient
solution containing copper. The dry matter yield of these plants was
independent of the copper concentrations in their photosynthesizing
tissues, up to a critical concentration (upper critical level). The
upper critical concentrations of copper for barley, lettuce, rape and
wheat were, respectively, 19, 16, 21 and 21 mg Cu/litre. Beckett &
Davis (1978) exposed young barley plants to combinations of copper,
zinc and nickel. At tissue concentrations in excess of their
respective upper critical levels the toxic effects of copper and
nickel appear to be additive, but the combination of copper and zinc
appears to be antagonistic.
Taylor & Foy (1985) observed that plants of Triticum aestivum
exposed to 3 mg Cu/litre (50 µmol/litre), as copper sulfate, showed
acute signs of copper toxicity, including mild necrosis and symptoms
of induced iron deficiency in the leaves, and inhibition of root
growth and lateral root initiation. Plants exposed to 50 mg Cu/litre
(800 µmol/litre), as copper-EDTA, showed systemic toxicity symptoms
probably reflecting iron deficiency as the primary toxic effect.
Leaves showed mild necrosis and symptoms of iron deficiency; root
growth, although depressed, was not as severely affected as with
copper sulfate, and lateral root initiation was unaffected.
Wong & Bradshaw (1982) grew perennial rye grass
(Lolium perenne) from seed in solutions of copper sulfate for 14
days. Copper concentrations of 0.02 mg Cu/litre (0.3 µmol/litre)
caused a 50% reduction in normal root growth.
Alva & Chen (1995) examined the effects of 6.35, 317.5, 635 and
1270 µg Cu/litre (0.1, 5, 10 or 20 µmol Cu/litre) in nutrient solution
at pH 5.5 on growth, uptake and partitioning of copper by seedlings of
mandarin Cleopatra and citrumelo Swingle rootstock. There was a
significant exposure-dependent decrease in both shoot and root dry
weight. The concentration of copper in both shoots and roots
increased with increasing exposure concentration. The increase in
tissue copper concentration was more marked in roots than in shoots.
The pronounced effect of copper on iron uptake could, in part, be
explained by the development of iron chlorosis symptoms.
Winter wheat plants (Triticum aestivum L cv. Starke II) were
grown for 7 days in split-root chambers containing nutrient solutions
with various copper chloride concentrations (32 controls) to 635 µg
CuCl2/litre; 0.5 to 10 µmol/litre). Average root length and dry
weight of the root parts exposed to 127-635 µg Cu/litre (2-10
µmol/litre) decreased, and lateral root initiation was delayed; dry
weight of root parts increased in control plants. Copper was not
exported from the roots to the other plant parts (Adalsteinsson,
1994).
Schmidt (1988) reported IC50s for inhibition of root growth from
germinated seeds at 1.8 mg Cu/litre for Lupinus albus and 0.274 mg
Cu/litre for Cicer arietinum.
Burton et al. (1986) studied the interactive effects of copper,
cadmium and nickel on seedlings of Sitka spruce (Picea sitchensis)
grown in nutrient solution for 42 days. Copper concentrations of 5
and 10 mg/litre significantly reduced seedling yield. There were no
significant interactive effects on yield even where copper and cadmium
individually affected yields, but nickel and copper did interact.
Huber et al. (1989) treated 3-year-old white, Scots and Austrian
pine seedlings with copper (80 mg/litre, 500 µmol/litre) for up to 90
days. Copper significantly affected energy homoeostasis and oleoresin
production, and induced a loss of tolerance in Scots pine and loss of
resistance to nematodes in Austrian pine.
Sela et al. (1988) exposed roots and shoots of
Azolla filiculoides to copper (10 mg/litre) for 1 day. Copper
exposure caused losses of potassium, chloride and magnesium from
Azolla roots.
Root growth of seedlings of the Agrostis capillaris cultivars
Parys (copper tolerant), Gognian (lead/zinc tolerant) and Highland
(non-tolerant) was measured after 14 days growth in solutions
containing 64-762 µg Cu/litre (1-12 µmol/litre). Highland cultivars
showed a sharp negative exponential decline in root growth at
concentrations > 64 µg Cu/litre (1 µmol/litre). Gognian and Parys
cultivars are unaffected by copper levels of 64 and 254 µg Cu/litre (1
and 4 µmol/litre); however, at higher concentrations Parys cultivars
are less affected by copper than Gognian (Symeonidis et al., 1985).
Wong et al. (1994) reported that a zinc/lead tolerant cultivar of
Festuca rubra was tolerant of copper. The cultivar showed a high
tolerance index (80.33%) at 50 mg Cu/litre. A treatment of 50 mg
Cu/litre appeared to cause little damage to root and shoot elongation.
Fresh weights of roots were significantly reduced at copper
concentrations of 10 mg/litre; there was no effect on fresh weight of
shoots. Metal transport to the shoot was minimal, indicating that the
root may play a major role in preventing transportation of copper to
the upper portion of the plant.
Toxicity to plants grown in soil
Toxicity of copper to terrestrial plants grown in soil is
summarized in Table 24.
Jarvis (1978) grew perennial ryegrass (Lolium perenne) in a
loam soil amended with copper at concentrations of 9.5, 95.3 and 953
mg/kg (dry weight). Significant reductions in dry weight of shoots
and roots over 4 harvests were observed only at the highest
concentration.
Graham et al. (1986) grew carrizo citrange seedlings in sandy
soil amended with copper at concentrations ranging from 25 to 300
mg/kg as basic copper sulfate. The growth of seedlings and the
colonization by the mycorrhizal fungus Glomus intraadices were
reduced logarithmically with copper exposure. Copper-induced
reductions in seedling phosphorus uptake were more closely related to
the inhibition of hyphal development outside the root than to the
development of vesicles and arbuscules in the root.
Walsh et al. (1972) applied copper sulfate and hydroxide to a
loamy sand at rates of 15-486 kg Cu/ha for 2 years. Rates of up to 54
kg Cu/ha had no adverse effect on the yield of snap beans
(Phaseolus vulgaris). Slight decreases were noted at copper
concentrations in excess of 130 kg/ha and marked reductions in yield
were observed at 405 kg/ha of the hydroxide and 486 kg/ha of the
sulfate. Soil copper concentrations and yield were highly correlated.
Significant reductions in the yield of snap beans were noted when more
than 20 mg Cu/kg was extracted from soil with HCl or DTPA and when
more than 15 mg Cu/kg was extracted with EDTA.
Table 24. Toxicity of copper to terrestrial plants grown in soil
Organism Parameter End-point Concentration Reference
Perennial 4 harvests significant 953 mg/kg Jarvis
grass reduction in et al.
(Lolium dry weight (1978)
perenne) of shoots
and roots
Snap beans 2 years yield significant decrease Walsh
(Phaseolus at concentrations et al.
vulgaris) > 20 mg/kg extracted (1972)
with HCl or DTPA
or at 15 mg/kg when
extracted with EDTA
Gettier et al. (1988) studied the response of corn (Zea mays)
grown in fields amended with six annual applications of
copper-enriched manure or copper sulfate at application rates ranging
from 48 to 198 kg Cu/ha. No significant effect on grain yield was
observed in a fine sandy loam and clay loam soils. However,
applications of copper sulfate (60 and 198 kg/ha) caused significant
increases in grain yield on silt loam soil. There was no significant
accumulation of copper by corn plants during the experiment.
Cineraria maritima L and Centauria moschata L were tested for
their tolerance/sensitivity in metal-rich soils, which contained high
levels of copper and were derived from iron ore from Lalitpur, Girar,
India. The two plant species growing in the mineralized soil showed
higher accumulations of copper than those grown in non-mineralized
soils. The rate of photosynthesis and chlorophyll content were
reduced in C. maritima but not in C. moschata, indicating that
C. maritima is more sensitive to mineralized soil (Farooqui et al.,
1995).
9.3.3.2 Invertebrates
Neuhauser et al. (1985) exposed earthworms (Eisenia fetida) to
copper in both contact and artificial soil toxicity tests. In 48-h
contact tests LC50s were 6.7 µg/cm2 for copper acetate, 4.9 µg/cm2
for copper chloride, 7.4 µg/cm2 for copper nitrate and 6.3 µg/cm2
for copper sulfate. There was no significant difference between the
toxicity of the different copper salts. In an artificial soil test (2
weeks) the LC50 was found to be 643 mg Cu/kg. Spurgeon et al.
(1994), using the OECD recommended protocol, reported the 14-day LC50
for E. fetida to be 683 mg Cu/kg. The 56-day LC50 and NOEC were
555 and 210 mg Cu/kg, respectively; the EC50 and NOEC, based on
cocoon production, were 53.3 and 32 mg Cu/kg, respectively. Ma (1984)
estimated that the 6-week LC50 for the earthworm Lumbricus rubellus
was 1000 mg Cu/kg (dry weight soil).
Martin (1986) maintained earthworms (Allolobophora calignosa)
in soil containing copper concentrations ranging from 5 to 1000 mg/kg
for 14 days. All worms died at 1000 mg Cu/kg; copper significantly
reduced growth at 500 mg/kg and reduced the number of egg capsules per
worm at 100 mg/kg.
Van Gestel et al. (1989) exposed earthworms
(Eisenia fetida andrei) to copper for a 1-week preconditioning
period followed by a further 3 weeks. EC50s, based on cocoon
production, were 62 mg Cu/kg for the pre-conditioning period (1 week)
and 191 mg Cu/kg for the following 3-week exposure. A NOEL was
derived for the whole of the exposure period of 60-120 mg Cu/kg.
Cocoon hatchability was not affected by copper exposure. In 12-week
exposures copper concentrations of 10 and 18 mg/kg stimulated growth;
the EC50 and NOEC for growth reduction were > 100 and 56 mg Cu/kg,
respectively (Van Gestel et al., 1991).
Neuhauser et al. (1984) exposed earthworms (Eisenia fetida) to
500, 1000, 2000 and 4000 mg Cu/kg of manure (dry weight) for 6 weeks.
Copper significantly reduced growth and cocoon production. Similar
results were obtained with four different copper salts (acetate,
chloride, nitrate and sulfate). The growth rate and reproduction had
returned to normal after a 6-week period without copper.
Ma (1984) studied the effects of copper on growth, reproduction
and litter breakdown in earthworms (Lumbricus rubellus) during
6-week exposure periods in sandy or loam soils. Copper concentrations
of up to 373 mg/kg did not cause significant mortality. In sandy soil
the number of cocoons and litter breakdown were significantly reduced
at 131 mg Cu/kg; body weight gain was significantly reduced at 372 mg
Cu/kg. In loam soil the number of cocoons were significantly reduced
at 63 mg Cu/kg, litter breakdown at 136 mg Cu/kg and body weight gain
was unaffected at concentrations up to 373 mg Cu/kg. Ma (1988)
calculated 4-week EC50s, based on cocoon production, to be 122, 68
and 51 mg Cu/kg for the earthworms Lumbricus rubellus,
Aporrectodea caliginosa and Allolobophora chlorotica,
respectively.
Malecki et al. (1982) exposed earthworms (Eisenia fetida) to
six different copper salts for 8 weeks. Significant reductions in
growth and reproduction (cocoon production) were observed at copper
nitrate concentrations of 100 mg/kg (dry weight). Copper sulfate
caused significant reductions in reproduction at 100 mg/kg and copper
chloride reduced growth at 500 mg/kg. The other salts tested affected
growth and reproduction at copper concentrations of > 1000 mg/kg.
The least toxic salt was copper oxide which significantly affected
growth and reproduction at > 20 000 mg/kg. Long-term studies (20
weeks) with copper acetate revealed significant reductions in cocoon
production at 5000 mg Cu/kg.
Bengtsson et al. (1986) exposed earthworms (Dendrobaena rubida)
to copper concentrations of 10, 100 and 500 mg/kg in soil at varying
levels of acidity over a 3-month period. Survival of adults, cocoon
production and hatching success decreased with increasing acidity; the
reduction was even greater when low pH (pH 4.5) was combined with
copper. Irrespective of pH, 500 mg Cu/kg in the soil rapidly caused a
collapse of the worm population; survival and cocoon production were
significantly lower than in controls and hatching failed entirely.
Streit (1984) exposed orbatid mites and earthworms
(Octolasium cyaneum) to copper in soil-filled plastic containers for
6 weeks. Copper concentrations of up to 200 mg/kg had no significant
effect on the numbers of the seven predominating orbatid mite species.
However, at copper concentrations of 40 mg/kg the earthworms either
had been killed or had migrated to the noncontaminated half of the
container. The authors state that the toxicity of copper to
earthworms depends on the particular soil type and in particular the
organic carbon content of the soil. For example, 4-day LC50s were
reported at 181 mg Cu/kg in poor organic soil (3.2% carbon) and 2760
mg Cu/kg in peat soil (42.6% carbon).
Denneman & Van Straalen (1991) exposed the oribatid mite
(Platynothrus peltifer) to dietary copper in 3-month reproduction
tests. Copper concentrations of up to 2000 mg/kg (dry weight) had no
significant effect on survival. The NOECs for growth and reproduction
were found to be 9.42 and 2.65 µmol Cu/g, respectively.
Donkin & Dusenbery (1993) exposed nematodes
(Caernorhabditis elegans) to copper in different soil types in 24-h
toxicity tests. LC50s were 70, 534, 413, 1061 and 629 mg Cu/kg for
sand, sandy loam (66% sand), sandy loam (55% sand), loam and clay
loam, respectively. An LC50 for nematodes exposed in water only was
105 mg Cu/litre.
Parmelee et al. (1993) incubated forest soil treated with copper
(100, 200, 400 and 600 mg/kg) for 7 days. Omnivore-predator nematodes
and mesostigmatid and orbatid mites were the groups most sensitive to
copper and were significantly reduced at copper levels of 100 mg/kg.
Total nematode and microarthropod numbers declined significantly at
copper concentrations above 200 mg/kg. Trophic structure analysis
revealed that the high sensitivity of nematode predators reduced
predation and resulted in significantly increased numbers of nematodes
at 200 mg Cu/kg.
Marigomez et al. (1986) fed terrestrial slugs (Arion ater) on a
diet containing copper concentrations ranging from 10 to 1000 mg/kg
for 27 days. No treatment-related effect on mortality was observed.
Copper concentrations of 100 mg Cu/kg or more showed an exponential
change in feeding with treated slugs eating less than controls.
Initially the feeding behaviour of slugs on a diet of 50 mg Cu/kg was
unaffected, but by the end of the 278-day treatment they showed the
same reduction in feeding as the higher exposures.
Bayley et al. (1995) exposed larvae of the carabid beetle
(Pterostichus cupreus) to copper in both the soil (500 mg Cu/kg) and
in their food (500 mg Cu/kg fresh weight; 1357 mg Cu/kg dry weight).
Larval mortality due to copper exposure was 69% when adjusted for
control mortality and mainly occurred during larval metamorphosis and
pupation. The locomotor behaviour of male and female adult beetles
surviving the exposure to elevated copper during larval development
was significantly impaired.
Gintenreiter et al. (1993) reared gypsy moth (Lymantria dispar)
larvae on an artificial medium contaminated with copper (10, 50, 250
and 1250 mg/kg) from hatching or the fourth instar stage to pupation.
All larvae died at 1250 mg Cu/kg and larval survival was significantly
reduced at 250 mg Cu/kg. Contamination from hatching generally
resulted in a decrease in headcapsule width and this was significant
at a copper concentration of 50 mg/kg. The number of larvae hatched
per egg cluster was significantly reduced at 50 mg Cu/kg. NOECs were
10 mg Cu/kg for development rate, growth and reproduction, and 50 mg
Cu/kg for mortality in larvae exposed from the first instar. NOECs
were 10 mg Cu/kg for reproduction, and 50 mg Cu/kg for development
rate, mortality and growth in larvae exposed from the fourth instar
stage. Ortel et al. (1993) reared moth larvae on diets containing
copper at 10 or 50 mg/kg. No correlation was found between the extent
of copper contamination and parasitization success by the braconid
wasp (Glyptapanteles liparidis).
Nectoux & Bounias (1988) dosed honeybees (Apis mellifera) with
sucrose solutions containing copper at concentrations ranging from 250
to 2000 mg/litre. Controls gave an LT50 of 27 days with a daily
percentage mortality at 3%. LT50s for dosed bees ranged from 5.1 to
14.2 days with the daily percentage mortality ranging from 5.78% per
day to 30.22% per day.
9.3.3.3 Vertebrates
Dodds-Smith et al. (1992a,b) maintained shrews (Sorex araneus)
on a diet containing copper at an intake of 2.13 mg/day for 12 weeks.
There was no significant effect on growth rate during the feeding
trial and no relationship between copper intake and mortality.
Aulerich et al. (1982) fed young mink on a diet containing 0, 20,
50, 100 or 200 mg Cu/kg for 153 or 357 days. The shorter exposure did
not significantly affect haemoglobin or haematocrit levels.
Reproduction performance was not adversely affected, although greater
mortality in young mink and reduced litter mass were a result of the
higher copper exposures. Intraperitoneal LD50s for adult mink were
7.5 mg/kg for copper sulfate and 5.0 mg/kg for copper acetate.
A summary of the toxicity of copper in domestic animals was
published by the committee on animal nutrition of the National
Research Council (1980). The information presented indicates that
sheep are more sensitive to copper than other domestic animals, and
horses appear to be more tolerant than cattle, pigs, sheep or poultry.
This is in agreement with the results presented by Smith et al. (1975)
who fed yearling ponies a pelleted diet up to 791 mg Cu/kg with no
visible effects after 6 months.
The results of Hill & Williams (1965) showed that a dietary
concentration of 266 µg Cu/g (dry weight) slightly reduced the
live-weight gain in lamb. At 40.7 µg Cu/g the reduction in the rate
of live-weight gain was statistically significant.
The use of copper as a feed additive for growth stimulation has
attracted interest in its toxic effects. Combs et al. (1966) studied
the effect of the level of dietary protein in pigs fed high copper
rations. Their results indicated that pigs fed a diet containing 250
ppm (mg/kg) copper and either 14 or 22% protein had daily gains of
0.80 and 0.78 kg, respectively, while those given diets containing 500
ppm (mg/kg) copper and either 14 or 22% protein gained 0.48 and 0.55
kg daily, respectively.
9.4 Field observations
9.4.1 Microorganisms
Mathur et al. (1979) studied a 2-ha field comprising an organic
muck soil which had been cultivated for 45 years, having residual
fertilizer copper applied to a distinct site for the last 15 years.
The soil copper content ranged from 150 to 260 mg/kg (dry weight).
The rate of carbon dioxide evolution was significantly negatively
correlated with both the total and extractable copper contents of the
soil. Acid phosphatase activity significantly decreased as copper
content increased. Dumontet et al. (1992) reported a significant
negative correlation between both copper and cadmium, and soil
respiration in the 0-15-cm layer of contaminated soil from the
vicinity of a copper-zinc smelter. However, the authors did not find
a significant correlation between soil copper and acid phosphatase
activity.
Minnich & McBride (1986) studied five soils which had received
anthropogenic copper inputs for many years: recent sludge, aged
sludge, spillsite, vineyard and muck. The copper concentrations in
the soils ranged from 33 to 1445 mg/kg soil (dry weight). No
significant effects due to copper on carbon mineralization were
detected. Nitrogen metabolism was significantly increased only in the
soil which had received recent sludge additions.
Burton (1987) surveyed river water and sediment samples and one
soil sample for bacterial resistance to metals. Between 0 and 2.4% of
bacterial populations sampled were resistant to 1 mmol Cu/litre. The
highest resistance was found at Crater Lake, Colorado, USA. However,
sediment copper concentrations were much higher at several other
sites.
9.4.2 Aquatic organisms
Wood (1983) found that naturally occurring marine phytoplankton
populations show a tolerance to added cupric ions which far exceeds
the physiological limits of phytoplankton cultures grown in chemically
defined media. The tolerance appears to be due to regulation of
bioavailability of added copper by an abundance of copper-complexing
agents. Coastal phytoplankton were less sensitive than continental
shelf or oceanic communities. The toxicity of copper correlated more
with copper-complexing capacity than with biotic species composition
or community structure.
Effler et al. (1980) monitored the impact of low-level copper
applications to Cazenovia Lake, New York, USA. The application caused
only small increases (up to 5 µg Cu/litre) for 2-5-day periods. The
treatment did not achieve the desired algicidal action on the target
phytoplankton. There were short-term alterations in the seasonal
succession processes within phytoplankton populations. No significant
effects on zooplankton or submerged macrophytes were observed.
Hanson & Stefan (1984) summarized the effects of nearly 60 years
of copper use as an algicide on some lakes in Minnesota, USA. Copper
treatments have been as high as 250 µg Cu/litre averaged over the
entire lake. Algal mortality has led to hypolimnetic oxygen depletion
and affected nutrient dynamics. Phytoplankton populations have
shifted to greater dominance of blue-green algae. Several major fish
kills related to transiently high copper concentrations have been
documented, and fish populations have shifted to less desired species.
Sediment concentrations as high as 5600 mg Cu/kg have developed,
affecting development of macrophytes and benthic invertebrate
populations.
Carlson et al. (1986) investigated the effects of copper on the
Naugatuck River, Connecticut, USA, which received multiple discharges
from domestic and industrial sources. Downstream from the major
effluents, there were severe effects on fish, periphyton, and benthic
invertebrates. Average total copper concentrations at sampling
stations in the affected area ranged from 50 µg Cu/litre to over 400
µg Cu/litre, whereas stations with little or no impact had average
concentrations < 20 µg Cu/litre. Toxicity tests using river water
showed reduced survival of Ceriodaphnia dubia in samples from
affected areas, but little or no effects from samples from unimpacted
areas. The US EPA water quality criteria for the river varied from 5
to 12 µg Cu/litre for 4-day average concentrations and from 7 to 18 µg
Cu/litre for 1-h average concentrations. These concentrations were
exceeded even in the unaffected area. However, toxicity tests using
dilution water from the river showed copper to be 3-8-fold less toxic
than did dilution water typical of laboratory tests used to establish
the criteria. Therefore, site-specific criteria were estimated to be
24-43 µg Cu/litre for the 4-day average and 34-61 µg Cu/litre for the
1-h average. These concentrations were rarely exceeded upstream from
the major discharges, but were routinely exceeded downstream,
consistent with the observed biological impact.
Grant et al. (1989) studied the tolerance of polychaete worms
(Nereis diversicolor) to copper. Polychaete worms collected from a
site with surface sediment levels of 1733 mg Cu/kg were more tolerant
when exposed to 500 µg Cu/litre in acute tests than those from a
low-metal site (19 mg Cu/kg). LT50 values were 70 h for worms from a
low-metal site and 1407 h for those from the contaminated site.
Laboratory-bred worms still retained the tolerance. Worms showed a
graded level of tolerance depending on field exposure.
Han & Hung (1990) reported the case of green oysters
(Crassostrea gigas) in the Charting mariculture area of southwestern
Taiwan in January 1986. The green colouration was found to be due to
high copper content of the oyster tissue. A survey of the area
revealed total dissolved copper levels ranging from 5 to 23.6
µg/litre, particulate copper levels ranging from 1 to 5.5 µg/litre and
oyster tissue levels with a mean of 4401 mg Cu/kg (dry weight). Green
oysters have occasionally been observed in other areas.
Copper-rich granules have been reported to occur in a wide
variety of invertebrates inhabiting copper-polluted habitats. Weeks
(1992) observed copper-rich granules in the ventral caeca of talitrid
amphipods (Orchestia gammarellus) revealed by transmission electron
microscopy. In addition, copper deposits also appear in the physodes
of Fucus vesiculosis and F. serratus (Smith et al., 1986). The
occurrence of intracellular deposits containing copper were reported
in a copper-tolerant isolate of the green alga Scenedesmus
(Silverberg et al., 1976). In the latter case the metal appeared
mainly in the nucleus, although similar structures were observed in
the cytoplasm. Silverberg and co-workers concluded that the
occurrence of these inclusions could be regarded as a detoxifying
mechanism because they were absent in the non-tolerant strains.
Copper has been detected in polyphosphate bodies in the green alga
Chlorella furca (Wong et al., 1994) and in the fouling diatoms
Amphora and Navicula (Daniel & Chamberlain, 1981).
9.4.3 Terrestrial organisms
9.4.3.1 Tolerance
Duvigneau & Denaeyer-De Smet (1963) studying the copper content
in leaves of plant species growing on soils containing 500 mg Cu/kg
(dry soil) emphasize that there is more than one tolerance mechanism
operating. They found that some species avoid copper toxicity by
excluding the metal, some species accumulate the metal to very high
concentrations and other species occupy an intermediate position.
They conclude that there may be both exclusion and accumulation
mechanisms evolving in different species of the same genus.
Wu & Kruckeberg (1985) found that two legume plants
Lupinus bicolor and Lotus purshianus growing on copper mine waste
in northern California, USA, with a mean soil copper content of 460
mg/kg exhibited considerably greater copper tolerance at 0.2 mg/litre
in nutrient solution than plants from an adjacent meadow where copper
levels were 0.1-1.5 mg/kg. The tolerance index of the field-collected
plants was positively correlated with the copper concentration of the
soil from which the plants were collected. Wu & Lin (1990) isolated
the nitrogen-fixing bacterium Rhizobium loti from root nodules of
L. purshianus growing on the copper mine and found it to have
greater copper tolerance than rhizobium isolated from plants in a
nearby field. No difference was detected in uptake pattern or
concentration of copper in tolerant and nontolerant L. purshianus.
However, a copper accumulation mechanism associated with tolerance was
found in the symbiotic rhizobium. Effective nitrogen fixation was
seen in copper-enriched soils.
Kruckeberg & Wu (1992) investigated the tolerance of herbaceous
plants colonizing copper mine waste sites in northern California, USA.
Five of the seven species tested showed elevated copper tolerance.
The copper-tolerant species were found at more than one copper mine.
The mines were geographically isolated, so tolerance in these plant
species probably evolved independently. In Arenaria douglasii,
Bromous mollis and Vulpia microstachya the exclusion of copper
from the shoots partly by immobilization at the roots may be a
mechanism of tolerance. However, in some species there were no
differences between the uptake of copper into tissues of tolerant and
nontolerant species. Therefore, it would appear that different
mechanisms of copper tolerance have evolved among the plant species
colonizing California copper mine waste sites.
Dickinson et al. (1991) studied the survival of sycamore
(Acer pseudoplatanus) trees at a metal-contaminated site (copper
refinery) in northwest England where populations of the herbaceous
flora have evolved metal tolerance. Cell culture growth experiments
on explant material from shoot meristems of mature trees showed
increased tolerance to copper. Some of these trees predated the
establishment of the refinery. However, tolerance tests on tree
seedlings showed no evidence that the trees produce tolerant
offspring. The tolerance of the mature trees is ascribed to
phenotypic adaptation induced during the life of the tree as site
contamination occurred.
Taylor & Crowder (1984) did not find copper tolerance in the
cattail rush (Typha latifolia) collected from the vicinity of a
copper smelter near Sudbury, Ontario, Canada, with soils contaminated
with 3738 mg Cu/kg and 9372 mg Ni/kg. Growth of both contaminated and
non-contaminated plants was inhibited by 100 mg/kg copper-EDTA. No
particular in vivo copper tolerance was found in the clones from the
heavily contaminated site. The metals at this site are believed not
to be bioavailable owing to the strongly anaerobic waterlogged
conditions or to the presence of high sulfide levels in the mud.
Rauser & Winterhalder (1985) collected several grass species from
the vicinity of the Sudbury copper smelter (Ontario, Canada). They
found clones of the grass species Deschampsia caespitosa,
Agrostis gigantea and Poa compressa to be tolerant to copper.
Hordeum jubatum plants showed no tolerance to copper exposure.
Frenckell-Insam & Hutchinson (1993) found copper tolerance in
populations of the grass Deschampsia cespitosa collected at seven
Canadian or German mine sites, with some Sudbury area plants
performing better in the presence of normally toxic levels of copper.
Schultz & Hutchinson (1988) showed that this copper tolerance in
D. cespitosa was not due to a metallothionein-like protein.
Wainwright & Woolhouse (1977) studied three clones of
Agrostis tenuis with respect to the effects of copper (64, 6.4 and
0.64 mg/litre; 10-1, 10-2 and 10-3 mmol/dm3) in nutrient solution on
growth of root segments excised from the zone of cell elongation.
Growth (24 h) of copper-tolerant and zinc-tolerant clones was less
inhibited by copper than was the growth of a non-tolerant clone.
Concentrations of copper ions which inhibited root growth also caused
leakage of potassium ions from cells. The authors suggest that the
loss of potassium ions from roots is due to the toxic effect of copper
ions on the plasmalemma.
9.4.3.2 Copper fungicides and fertilizers
During perennial tree production, amendments to soil of trace
elements essential for growth are often necessary. However,
application of such amendments results in the accumulation of elements
in topsoil. Copper can also build up as a result of routine
application of copper at relatively high rates with fertilizers. In
addition, the routine spraying of copper-based fungicides can result
in copper accumulation. Reuther & Smith (1953) reported an increasing
number of Florida, USA, citrus orchards on sandy, acid well-drained
soils affected with a chlorotic disorder of the foliage. The authors
linked this disorder with possible effects of high copper levels.
Paoletti et al. (1988) reported that spring/summer fungicide
(Bordeaux mixture) treatment of vineyards in Italy caused a decrease
in the local population of earthworms. In particular, a decrease in
the number of juvenile Allolobophora was recorded. Other macro
invertebrates were unaffected, both in terms of biomass and number of
species, by fungicide applications.
10. EVALUATION OF HUMAN HEALTH RISKS AND EFFECTS ON THE ENVIRONMENT
10.1 Concepts and principles to assess risk of adverse
effects of essential elements such as copper
10.1.1 Human health risks
There are risks associated with low intakes as well as high
intakes of essential elements. The relationship between
intake/exposure level and risk therefore has a U-shaped curve, with
risks from deficiency at low intakes and risk of toxicity at high
intakes (see Fig. 2). There is a need to define an intake range that
prevents both deficiency and toxicity for the general population. The
range of acceptable intakes to meet the biological requirement, as
well as prevent risk of toxicity, may be extremely narrow. A balanced
and comparable scientific approach to assess risk from deficit as well
as excess is needed when evaluating essential elements such as copper.
10.1.2 Homoeostatic model
The homoeostatic model describes an acceptable range of exposures
or intake (AROI, acceptable range of oral intake) for essential trace
elements that permits optimum health (Fig. 2). Environmental levels
of copper within the acceptable range of exposure do not produce
adverse health effects among members of the general population.
However, there are individuals or groups with disorders in
homoeostatic mechanisms that experience health effects, either
deficiency or toxicity, from exposures within the acceptable range.
These disorders may be of genetic origin or from acquired disease.
10.2 Evaluation of risks to human health
10.2.1 Exposure of general population
For healthy humans who are not occupationally exposed the major
route of exposure to copper is oral. The mean daily dietary intake of
copper in adults ranges between 0.9 and 2.2 mg (see section 5.4). A
majority of studies have found intakes to be at the lower end of that
range. The variation reflects different dietary habits, as well as
different agricultural and food-processing practices used throughout
the world. Drinking-water may make a substantial additional
contribution to the total daily intake of copper, particularly in
households where corrosive waters have stood in copper pipes. In
homes without copper piping, or with noncorrosive water, copper intake
from drinking-water seldom exceeds 0.1 mg/day, although intakes
greater than a few mg per day can result from corrosive water
distributed through copper pipes. In general, total daily oral
intakes are between 1 and 2 mg Cu/day, although they may occasionally
exceed 5 mg Cu/day. All other routes of copper exposure (inhalation
and dermal) are insignificant in comparison to the oral route.
Inhalation adds between 0.3 and 2.0 µg Cu/day from dusts and smoke.
Women using copper IUDs are exposed to only 80 µg Cu/day or less from
this source.
gastrointestinal secretions such as saliva, gastric and pancreatic
juice, bind copper and thereby maintain the metal in solution in the
alkaline milieu of the upper small intestine (Gollan & Dellor, 1973).
Moreover, it has been suggested that copper is primarily absorbed in
the form of amino acid complexes (Marceau et al., 1970). Limited
absorption of copper also occurs at the distal part of the small
intestine. Absorption of copper across the brush border into the cells
of the intestinal mucosa and its subsequent transfer across the
basolateral membrane into interstitial fluid and blood occur by
different mechanisms. Transfer across the mucosal barrier probably
occurs by non-energy-dependent diffusion. With the levels of copper
normally ingested, transfer of copper across the basolateral membrane
appears to be rate-limiting and is mediated by a saturable,
energy-dependent mechanism. At higher intakes, additional diffusional
or carrier-mediated systems in the basolateral membrane come into
play, and it seems likely that these are the sites where competition
for absorption between copper and other transition metal ions takes
place (Linder, 1991).
Turnlund et al. (1989) have used stable isotope methodology to
study copper absorption in adults. Diets were labelled extrinsically
with 65Cu and isotope mass ratios were analysed in the diets and
stools by thermal ionization mass spectrometry. Copper absorption was
dependent on the amount of copper in the diet; when a low copper diet
(0.78 mg Cu/day) was given, absorption was 55.6%, whereas it was 36.3%
from the same diet with copper added to an adequate level (1.68 mg
Cu/day) and 12.4% from the same diet but with high copper content
(7.53 mg Cu/day). Thus, it appears that copper absorption in adults is
saturable and that the percentage absorbed decreases with the level of
dietary copper. However, total retention of copper increased with the
level of dietary copper. Balances were positive even at the lower
copper level studied, suggesting that copper intakes of approximately
0.8 mg/day are adequate to sustain balance.
Early balance studies in preterm infants by Cavell & Widdowson
(1964) and Dauncey et al. (1977) showed negative balances of copper
for several months after birth. Most of the copper was found in the
stool, suggesting ineffective absorption or poor retention mechanisms.
Negative copper balance was also found in 40% of infants studied by
Tyrala (1986) despite feeding a formula with a copper concentration of
2.1 mg/litre. More recent studies in "healthy" preterm infants fed
modern artificial formula or unpasteurized human milk using combined
chemical balance and stable isotope tracer (65Cu) determinations
indicate that they absorb sufficient copper to meet the requirements
imposed by growth. Twelve infants fed preterm human milk absorbed
40-60% of intake while 33 receiving premature formula absorbed only
15%. The absolute retention of copper in infants fed human milk (40-50
µg/kg per day) approached the expected retention based on in utero
accretion data. This study demonstrates that infants respond to a
higher copper intake in a similar way to adults, by increasing fecal
losses and decreasing percentage absorption (Ehrenkrnaz et al., 1989).
A portion of the absorbed copper is lost during the turnover of
the intestinal cells and is subsequently lost in the faeces. Copper
absorbed into the intestinal endothelial cells can be sequestered by
metallothionein or may pass into the portal circulation.
Metallothionein may be an intermediate through which all or part of
the absorbed copper passes in route to the circulation (Felix et al.,
1990). Most of the copper transfer across the serosal membrane appears
to be done by the copper translocase. This mechanism operates in
animals and humans, and homologous proteins have been identified in
yeasts (Rad et al., 1994) and bacteria (Odermatt et al., 1993; Solioz
et al., 1994). Intestinal metallothionein may be acting as a
temporary metal-storage protein and be involved in the detoxification
of excess copper.
Pulmonary absorption occurs through the inhalation of dusts,
fumes, smoke and sprays. Persistent exposure to copper in sprays,
such as Bordeaux mixture, can lead to increased absorption and
accumulation (Pimentel & Marques, 1969; Pimentel & Menezes, 1975;
Viren & Silvers, 1994).
Topical use of copper compounds, as treatment for or prevention
of microbial infections, can lead to increased copper absorption
(Eldad et al., 1995).
6.2.3 Transport, distribution and storage
The liver is the major organ for the distribution of copper in
mammals. The liver sequesters the newly absorbed copper, routing it
through the blood to other tissues (Owen, 1965; Evans, 1973; Marceau &
Aspin, 1973a; Sternlieb, 1980). In blood, copper is distributed into
a nonexchangeable red cell pool, a plasma pool associated with
proteins, and a labile pool of low molecular weight complexes. In
humans, approximately 80-90% of the plasma copper is tightly bound
ceruloplasmin while the rest is bound to albumin and amino acids.
In rats, ingested copper (64Cu) appears first in the blood
complexed to albumin; a small portion of newly absorbed copper was
later shown to complex with amino acids in the serum (Neumann &
Sass-Kortsak, 1967). Albumin is a 68 kDa protein, found in serum and
in the interstitial spaces, which has copper binding sites.
Approximately 50% of the copper in whole blood is in erythrocyte SOD
and small peptide complexes. Erythrocyte copper does not play a role
in the transport of newly absorbed copper from the gut to the liver
(Gubler et al., 1953). Ceruloplasmin does not have a role in transport
of copper from gut to the liver, which is principally carried out by
albumin and amino acid complexes. Recently in vivo NMR analysis of
whole blood has confirmed in humans that copper in the portal
circulation is bound to albumin (Bligh et al., 1992) adding weight to
the earlier studies (Bearn & Kunkel, 1964).
Transport from the liver to peripheral tissues is one of the most
widely debated issues in the field of copper metabolism, but it is
thought to involve ceruloplasmin, albumin, transcuprien or amino
acids. Metallothionein has been suggested to play an important role
in the transport of copper in fetal blood. Its concentration is
elevated in the plasma and there appears to be little copper bound to
ceruloplasmin and albumin (Bremner, 1987). The proposal that
metallothionein is involved in the fetal copper transport has been
questioned, as mouse mutants lacking metallothionein develop normally
(Michalska & Choo, 1993; Masters et al., 1994).
Transport of copper from the liver to the peripheral tissues is
presumed to require either ceruloplasmin or serum albumin. The
available studies can neither exclude or prove the possibility that
one of these proteins is an obligatory copper transporter (Linder et
al., 1998). The peripheral tissues of humans with little or no
ceruloplasmin are not copper deficient (Frommer, 1981). Radioisotope
studies (Owen, 1965; Marceau & Aspin, 1973a,b), in which an isotope of
copper (64Cu or 67Cu) is used to trace the transfer of copper from
one metabolic pool to another, are more supportive of ceruloplasmin's
role in copper transport. Its role is also supported by nutritional
studies (DiSilvestro & Harris, 1981; Harris & DiSilvestro, 1981) and
combined isotopic and nutritional studies (Dameron & Harris, 1987a,b;
Percival & Harris, 1990, 1991; Steinkuhler et al., 1991). The
conflicting observations could be reconciled if there is redundancy in
the transport process, as might be expected for a critical process
like the delivery of copper.
Receptors for ceruloplasmin have been tentatively identified in
the plasma membrane fractions of chick aorta and heart (Stevens et
al., 1984), rat erythrocytes (Stern & Frieden, 1993), rat liver
(Kataoka & Tavassoli, 1984; Tavassoli et al., 1986; Omoto & Tavassoli,
1990) and rat brain (Mash et al., 1990). Membrane receptors for
ceruloplasmin have also been described in human erythrocytes (Barnes &
Frieden, 1984) and leukocytes (Kataoka & Tavassoli, 1985), and K562
cells (Percival & Harris, 1988, 1990). The studies by Percival &
Harris (1990) imply that the copper may be removed from ceruloplasmin
after reduction and that the protein may not be internalized.
A carrier-mediated facilitated diffusion system for uptake of
copper complexes, amino acids and small peptides, into rat
hypothalamus has been identified (Hartter & Barnea, 1988). The system
has a broad ligand specificity with respect to amino acids (histidine,
cysteine, threonine, glycine) and polypeptides (Gly-His-Lys,
glutathione) but will not transport albumin-bound copper.
Absorbed copper is primarily incorporated into the soluble
fraction of the liver and is associated with three main liver
fractions in the cytosol: a high molecular weight pool that has not
been completely identified, a 30 000 kDa pool which appears to be SOD
and a 10 000 kDa pool composed mostly of metallothionein. In chicks
and other animals, newly absorbed copper appears to be initially
incorporated into SOD and metallothionein (Balthrop et al., 1982), the
amount incorporated into each varying with the amount of copper
absorbed and the route of administration (Prins & van den Hamer,
1981). Some of the copper that enters the liver is not retained in or
does not enter the protein fractions and is instead excreted through
the bile. Copper bound to metallothionein may be targeted for
excretion through the bile, but may be used in the synthesis of other
copper proteins (Bremner, 1987). The role of metallothionein in the
cellular detoxification of copper, and possible roles for this protein
in the uptake, storage and transport of copper, have been reviewed by
Bremner (1987).
The liver synthesizes and regulates the plasma levels of
ceruloplasmin, the major copper-binding protein in serum and
cerebrospinal fluid. Some other tissues also synthesize
ceruloplasmin, or isoforms produced from alternative splice sites
(Yang et al., 1990).
Ceruloplasmin (ferroxidase) is a 160 kDa, blue, heavily
glycosylated, alpha2-globulin, with 6-8 tightly bound Cu(II) atoms
(Owen, 1982). It is an acute-phase plasma protein, increasing in
concentration in a variety of non-specific diseases. It also has
ferroxidase activity and facilitates the oxidation of Fe2+ to Fe3+
(Frieden & Hsieh, 1976).
Copper-deficient diets lower total liver copper, metallothionein
copper (Balthrop, 1982), and copper-zinc SOD activity (Dreosti &
Record, 1978; Bettger et al., 1978). Synthesis of fully active
ceruloplasmin by the liver is decreased or eliminated in
copper-deficient animals (Owen, 1965; Harris & DiSilvestro, 1981) and
in humans with Wilson disease. In contrast, deficient diets can lower
the copper enzyme levels in some tissues even when the tissue copper
level is constant. Aortic lysyl oxidase, an extracellular enzyme,
decreases in chicks on a copper-deficient diet (Harris et al., 1974),
even though the tissue copper level does not decrease (Balthrop et
al., 1982).
Copper balance and tissue distribution in typical adult humans is
summarized in Fig. 1. Liver copper content accounts for close to 20%;
this is the only true storage site that can be mobilized in case of
negative copper balance. Muscle accounts for nearly 40% of total body
copper and brain close to 20%. Connective tissue, blood and kidney
each accounts for 8%.
The fetus is fully dependent on copper uptake from the maternal
circulation. The transport of copper through the placenta is mediated
by a specific carrier copper transport from ceruloplasmin (McArdle &
Erlich, 1991; Lee et al., 1993). Other copper-binding complexes such
as albumin, or histidine-bound copper, can also contribute to the
fetal supply (Wirth & Linder, 1985). The fetus accumulates copper at a
mean rate of close to 50 µg/kg per day, principally over the later
half of pregnancy; over half of the copper is stored in the liver,
mainly in the form of metallothionein (Widdowson et al., 1974). The
increase in fetal liver store is due to both increased liver size and
higher concentration per unit of liver weight. The brain is the second
site for copper in fetal life; by the end of gestation the fetus will
have accumulated close to 15 mg of copper, of which 9 mg will be in
the liver. After birth the concentration of copper in the liver drops
during the initial months of life, reaching adult levels by 6 months.
Copper saturation of metallothionein is high during the first 6 months
of life (up to 50%), dropping quickly thereafter (Klein et al., 1991).
Biliary secretion is extremely low in utero and rises progressively
postnatally.
Pregnancy is associated with increase copper retention: this may
be due in part to decreased biliary excretion induced by hormonal
changes typical of pregnancy. Serum copper and ceruloplasmin rise
significantly during the last trimester (McArdle, 1995). Maternal
plasma copper concentrations during the latter half of gestation are
5-7 times higher than levels measured in the cord blood.
6.2.4 Excretion
Bile constitutes the major route of excretion of liver copper in
mammals, and thus represents the most important homoeostatic mechanism
determining the hepatocellular levels of the metal (Cousins, 1985;
Winge & Mehra, 1990). Approximately 80% of the copper leaving the
liver is excreted via the bile (Winge & Mehra, 1990). The urinary
excretion of copper is quantitatively unimportant and only 30-60 µg of
copper is eliminated through this route per day in adult human
(Harris, 1991).
Several pathways have been proposed to explain copper transport
into the bile (Kressner et al., 1984). Kinetic studies using
radioisotopes of copper have revealed that the intracellular source of
copper to be excreted in the bile is in a different compartment from
the copper destined for incorporation into ceruloplasmin (Dunn et al.,
1991). The existence of at least two transcellular pathways via the
hepatocytes has been proposed. Copper transport into bile takes place
in association with the biliary excretion of glutathione (Freedman et
al., 1989). It has been suggested that glutathione is involved in the
final step of copper excretion from the hepatocyte into the bile
(Alexander & Aaseth, 1980). The coordinated release of copper and
lysosomal enzymes into the bile of normal and copper-loaded rats
suggests that biliary copper may be largely derived from lysosomes
(Gross et al., 1989) and thus biliary copper excretion may be related
also to the hepatocellular content of metallothionein.
Copper is found bound to a range of unidentified components of
both high and low molecular weight, which may consist of protein,
micelles, bile salts, peptides and amino acids, depending on the
species and on the degree of copper loading (Bremner, 1987). However,
none of the major forms can be related to copper complexes identified
in the liver, although small amounts of ceruloplasmin, metallothionein
and glutathione or their degradation products may be present (Sato &
Bremner, 1984; Bremner et al., 1987).
In rats, net biliary copper excretion is relatively low in the
first week of life and is independent of metallothionein and
glutathione secretion. Excretion increases significantly as
glutathione output increases (Mohan et al., 1995). Studies with human
hepatic and gallbladder bile have documented the presence of a major
high molecular weight glycoprotein, which avidly binds copper (Gollan
& Dellor, 1973). A low molecular weight component(s) is also present
in both rat and human bile (Gollan & Dellor, 1973). Both the high and
low molecular weight components await characterization. Copper bound
to the macromolecular component in bile undergoes minimal intestinal
reabsorption. Thus, biliary copper does not appear to undergo
significant enterohepatic circulation (Gollan & Dellor, 1973), with
most being recovered in the faeces (Winge & Mehra, 1990).
In sheep, biliary excretion of copper does not represent the
major elimination pathway. However, this route of copper excretion can
be enhanced by the administration of tetrathiomolybdate (Winge &
Mehra, 1990). In addition to an elevation in biliary excretion of
copper, the hepatic copper levels are also reduced in treated sheep
(Gooneratne et al., 1989). The limited biliary excretion of copper in
sheep may partly account for the susceptibility of sheep to
copper-associated toxicity (Winge & Mehra, 1990).
Animals that tolerate copper well exhibit an enhanced biliary
excretion of copper. Copper-loaded rats, with hepatic copper levels
up to 8-fold greater than controls, have shown a 10-fold increase in
biliary copper output (Gross et al., 1989). Biliary obstruction
induced by deliberate ligation or pathological lesions, or due to a
particular metabolic state of the animal, leads to significant hepatic
copper retention as well as some increase in urinary copper excretion
(Gross et al., 1989). Retention of hepatic copper also occurs in
pregnant rats correlating with diminishing biliary excretion (Winge &
Mehra, 1990).
At least three genetic disorders associated with defective
hepatobiliary copper transport and accumulation of copper in the liver
have been described: Wilson disease (hepatolenticular degeneration) in
human and copper toxicosis in Bedlington terriers and Long-Evans
cinnamon rats (Sternlieb, 1980; Schilsky & Sternlieb, 1993; Mori et
al., 1994). These disorders are characterized by a decreased biliary
copper excretion, but differ from each other in the hepatic
distribution of the retained copper.
Minimal amounts of copper are lost in human sweat. The loss is
not believed to be sufficient to disturb the normal copper balance
(Turnlund et al., 1990).
6.3 Methods of studying homoeostasis
The purpose of this section is to highlight appropriate clinical
and biochemical methods that can be used to assess the copper status
of laboratory animals and humans. The goal is not to provide a
compendium of methods and analytical techniques but to offer an
overview of how to conduct these studies.
6.3.1 Analytical methods
A detailed discussion of analytical methods for the determination
of copper in solids and dilute liquids is given in chapter 2 of this
monograph and in WHO (1996). In general, solid samples require an
acid digestion prior to flame AAS. Low concentration samples require
more sensitive methods such as GF-AAS. Radioactive copper isotopes
64Cu and 67Cu (chapter 2) have been widely used in experimental
animals and cell culture studies to follow the uptake and distribution
of the metal (Petris et al., 1996). The short half-lives of these
isotopes and safety considerations make them less suitable for human
studies. The stable isotope 65Cu is now widely available and
relatively inexpensive. Determination of the enrichment of the
65Cu/63Cu ratio in human body fluids and excreta after a bolus dose
of 65Cu can be measured either by thermal ionization mass
spectrometry (TIMS) (Turnlund et al., 1989) or by ICP-MS (Lyon & Fell,
1990; Lyon et al., 1995, 1996).
6.3.2 Intake
The principle purpose of dietary intake analysis is to determine
the adequacy of copper supply and bioavailability for the general
population or sub-populations. Dietary analysis requires the
determination of copper in food and liquids that are consumed.
6.3.3 Diet
The preferred procedure for assessment of copper intake is the
use of "duplicate diet studies" in which a duplicate portion of all
food normally consumed by the test subject is collected, and the total
copper content determined. A secondary method is to estimate the
copper intake through dietary surveys using food composition from
tables. Descriptions of methods for dietary assessment of the trace
elements have been published by WHO (1996).
There is a need for standardized sampling and analytical
procedures for the determination of dietary copper. There is also a
great need for standardized sampling and analytical procedures for the
analysis of copper in drinking-water. Where appropriate, the copper
content of foods such as infant formulae prepared using drinking-water
should also be measured.
6.3.4 Balance studies
The difference between the total copper input (diet and water)
and the total output (faeces and urine) is the copper balance.
Balance data provide an estimate of whether the body is losing or
gaining copper. Copper balance can be used to estimate the amount
required to prevent deficit, since a negative balance in the long run
will give rise to clinical signs of deficit; conversely, a positive
balance, except during growth, will give rise to potential problems
once reserves are replete. In order to achieve copper balance children
require 0.1-0.15 mg Cu/kg body weight per day; adults need 0.02-0.05
mg Cu/kg body weight (1-3 mg/day). In general the percentage of
copper absorbed from the intestinal tract decreases as copper intake
increases.
Estimation of copper excretion is primarily made by the
determination of fecal copper loss. Healthy subjects are in
equilibrium; that is, dietary intake equals fecal copper output (see
Fig. 1 on page 78). The duration of faecal collection should be at
least 3-5 days for children and appropriate inert markers should be
used to ensure completeness of collection. Longer periods may be
necessary for adequate balance studies in adult humans. Fecal output
represents both the copper that is not absorbed from the gut and also
any excreted through the bile.
Urinary copper is a minor pathway for excretion (see Fig. 1) but
should be measured to assure completeness of any balance study.
Urinary copper is increased when renal tubular function is
compromised. It can also be increased in copper overload (O'Donohue et
al., 1993). Sequential measurement of urinary copper excretion can be
used to monitor chelation therapy in Wilson disease.
The balance data from chemically defined diets are used to
develop an understanding of the bioavailability and percentage
retention using different copper intakes. Such data can be used to
estimate the amount of copper required to prevent deficit and give
some information on the functional and clinical effects of excess
intakes. Some balance studies are summarized in Table 8.
The use of copper tracers, radioisotopes and stable isotopes
provides kinetic information to complement the balance studies. The
results from such studies can be mathematically modelled to provide
estimates of whole body and specific tissue compartments, such as
liver stores. True absorption and endogenous losses can be directly
measured from the copper isotope ratios in stool and diet (Turnlund et
al., 1991).
The reference interval for serum copper for normal adult males is
in the range 800-1200 µg/litre (WHO, 1996). Values for women are
about 10% higher. Serum copper is reduced in moderate to severe
symptomatic copper deficiency. However, serum copper concentration is
not a sensitive marker of recent onset of deficiency (Milne et al.,
1990; Turnlund et al., 1990; Milne & Johnson, 1993). Other conditions
which modify these laboratory parameters include inflammation or
infection, neoplasms and anticonvulsant or oestrogen therapy
(Solomons, 1979; Fischer et al., 1990; Jain & Mohan, 1991; Nielsen et
al., 1992; Milne & Johnson, 1993).
In copper-deficient infants, it is mainly the ceruloplasmin-bound
fraction of serum copper that is decreased (Holtzman et al., 1970).
The non-ceruloplasmin fraction of serum copper is much less affected
and is more rapidly restored when copper supplementation is initiated.
Apo-ceruloplasmin cannot be detected in human serum during copper
deficiency, suggesting that even if the apo-form may accumulate in the
liver (Holtzman et al., 1970), ceruloplasmin is not released until the
holo-form can be formed. However, even if apo-ceruloplasmin cannot be
detected in its completely unsaturated form, low ceruloplasmin enzyme
activity, concomitant with normal immunoreactive ceruloplasmin levels,
has been observed in copper-deficient human adults. In fact, it has
been suggested that the ratio between ceruloplasmin oxidase activity
and its mass concentration determined by immunological methods may be
used as an indicator of copper status (Milne & Johnson, 1993). Recent
studies by one group, in which the enzymatic activity and
concentration of ceruloplasmin have been measured, show that in copper
deficiency there is a reduction of enzymatic activity of ceruloplasmin
and the ceruloplasmin protein concentration is conserved (Johnson &
Murphy, 1988). Therefore, the enzymatic activity/concentration
ceruloplasmin ratio may be a better indicator of copper status, with
the additional advantage that it is not influenced by factors such as
hormones and gender (Vohra et al., 1965).
Plasma copper will be elevated (up to three times the upper
reference value) in acute copper toxicity. In such circumstances,
signs of intravascular haemolysis may be present. However, in chronic
copper overload, plasma copper and ceruloplamin concentrations are not
elevated (O'Donohue et al., 1993).
Table 8. Daily copper intake and copper balance studies
Subjects Methods Results Reference
4 patients aged metabolic balances were mean copper total excretion and retention were 1.39 and 0.34 Thorn et
between 0.36 performed on subjects who µmol/kg per day at a mean copper intake of 1.73 µmol/kg per day al. (1978)
and 1.53 years had been on a comminuted (110 µg/kg body weight per day) increasing to 1.72 and 0.51 µmol/kg
chicken diet mixed with a per day, respectively, at a mean copper intake of 2.23 µmol/kg per
trace element supplement day (142 µg/kg body weight per day)
for at least 3 weeks
11 girls, the effect of feeding two copper excretion in the feces was significantly increased when Greger
12.5-14.2 years different levels of zinc subjects consumed the diet with the higher level of zinc. The copper et al.
(11.32 mg and 11.64 mg/day) fecal losses and apparent retention of the girls when fed 11.64 mg of (1978)
on copper balance was zinc daily were 30.60 ± 6.50 ng/day and -0.97 ± 6.09 mg/day,
determined during a 30-day respectively. The corresponding figures for girls when fed 11.32 mg/day
period of zinc were 27.99 ± 1.67 ng/day and 1.40 ± 1.56 mg/day, respectively
11 men aged subjects were confined to a absorption and retention averaged 36.3 ± 1.3% and 0.17 mg/day, Turnlund
22-35 years metabolic research unit for 90 respectively, with an adequate-copper diet (1.68 mg/day). Absorption et al.
days to determine the effect of averaged 55.6 ± 0.9% and retention averaged -0.316 mg/day for 6 days (1989)
the level of dietary copper on and 0.093 mg/day for the next 36 days of a low-copper diet
absorption and retention (0.785 mg/day).
Absorption averaged 12.4 ± 0.9% with a high-copper diet (7.53 mg/day)
and retention was strongly positive at first, decreasing linearly with
time. In conclusion: copper absorption is strongly dependent on dietary
copper level and copper balance can be achieved by most young men from
a diet of 0.8 mg of copper daily
10 obese men balance studies were the mean daily intakes of zinc and copper in the soy group were 6.81 Lowy et
conducted over 40 days. Two and 3.1 mg/day, respectively, and in the collagen group these figures al. (1986)
diets providing, 400 kcal were 0.32 and 0.54 mg/day, respectively. Copper balances were
(1.7 MJ) and 100 g of protein determined during eight 5-day periods. During each period copper
daily were administered; to balance was markedly positive in the soy-diet group and negative in
five subjects, a collagen diet the collagen-diet group
that was severely deficient
in both zinc and copper,
Table 8. (continued)
Subjects Methods Results Reference
10 obese and another five subjects,
men a soy diet that provided a
marginal intake of zinc and
an adequate intake of copper
24 men aged subjects received one of two apparent copper balance was significantly greater when the subjects Reiser
21-57 years diets low in copper (1.03 mg consumed the fructose diet (copper intake 1.11 ± 0.02 mg, balance et al.
per day and 2850 kcal, 12 MJ) 0.17 ± 0.08 mg) as compared to the starch diet (copper intake (1985)
and containing 20% of the 0.94 ± 0.04 mg, balance -0.08 ± 0.08 mg)
calories as either fructose or
cornstarch
SOD is a copper-containing enzyme found in the cytosol of
virtually all cells, including the erythrocyte. Reduced SOD activity
has been demonstrated in copper-deficient animals and in humans (Uauy
et al., 1985). This decrease is proportional to the magnitude of the
deficiency of this mineral (Harris & Percival, 1991). Studies in
humans have shown decreased activity of erythrocyte SOD in
copper-deficient patients or in subjects receiving a low copper intake
(Disilvestro & Harris, 1981; Van der Berg & Beynen, 1992). SOD
activity was restored to a normal level when the subjects' diet or
drinking-water was supplemented with copper (Vohra et al., 1965; Van
der Berg & Beynen, 1992).
It has also been shown in humans that cytochrome c oxidase
activity of leukocyte and platelets is reduced in copper deficiency
(Johnson & Murphy, 1988). This decrease occurs before the appearance
of a reduction of SOD activity (Johnson & Murphy, 1988). If
confirmed, this finding suggests that cytochrome c oxidase activity in
leukocytes or platelets could be a sensitive indicator of copper
status. Although there is no single specific indicator of copper
deficiency (WHO, 1996), evidence of deficiency can be based on
observing the rate of disappearance of copper-dependent enzymic
activities and their subsequent return to normal levels with copper
supplementation. Deficiency studies are very valuable because
specific proteins can be singled out and studied with little
interference from other cuproenzymes. For instance, extracellular
lysyl oxidase, intracellular SOD and mitochondrial cytochrome oxidase
can be assayed, and changes over time following copper repletion
experiments can be used to trace the movement of copper through the
cellular compartments. To be a sensitive tool in nutritional studies,
an enzyme must respond reversibly to a copper deficiency, be easily
quantitated and have a short half-life so the change in activity can
be measured rapidly. Unfortunately, the copper enzymes used in many
studies are difficult to quantitate, hard to purify and have long
half-lives. The sensitivity of deficiency studies can be enhanced by
using copper isotopes to label the target proteins, which can then be
identified and quantitated enzymatically, immunochemically or by both
procedures. The major requirement in such experiments is that the
turnover, synthesis or activation of the enzyme must be rapid so the
isotope can be incorporated into the target protein and measured in a
reasonably short period of time.
Excessive copper accumulation in the liver can be determined by
needle biopsy. This requires an adequate sample taken under controlled
conditions in order to avoid contamination. Analysis must be carried
out in a specialized laboratory. This is the preferred method for
measurement of copper excess and should be included in the evaluation
of children and adults with liver disease of unknown aetiology. The
reference value for liver copper is 20-40 µg/g (dry weight) but is
significantly higher in the newborn. Nonspecific copper accumulation
occurs in a variety of cholestatic liver disease without a specific
pathological effect. Liver copper in excess of 250 µg/g (dry weight)
in the presence of other biochemical and clinical evidence is
indicative of Wilson disease, ICC or ICT (see chapter 8). Copper
accumulation in other tissues can be assessed only by postmortem
analysis.
6.4 Biochemical basis of copper toxicity
The requirement for copper in various organs or systems within
the body is effectively regulated by homoeostatic control mechanisms.
Toxicity is likely to occur only when such homoeostatic control within
any particular compartment is overwhelmed and/or basic cellular
defence or repair mechanisms are impaired.
The essentiality and potential toxicity of copper in biological
systems relies basically on the specific electron configuration,
particularly of the outer electron shells. Accordingly, the cuprous
(Cu+) ion is highly polarizable and binds mainly to nitrogen- and
sulfur-containing ligands by sharing their electronic orbitals. Cupric
(Cu2+) ions, on the other hand, are able to form both coordination
complexes with oxygen-containing ligands and partly covalent bonds
with nitrogen- and sulfur-containing centres. Therefore, copper has to
be considered fairly reactive and able to bind strongly to many types
of electron-rich structures. The affinity of copper ions towards a
particular ligand, however, is also influenced by the polarizability
of the ligand itself (Nriagu, 1979).
Toxicity of copper may arise when excess copper provokes the
following adverse reactions:
* Structural impairment of essential metal binding sites by
displace ment of metals resulting, for example, in membrane
changes such as depolarization and impairment of receptors or
transporter molecules (Alt et al., 1990).
* Functional impairment by binding of copper to crucial sites in
such macromolecules as DNA or enzymes particularly containing
sulfhydryls, carboxylates or imidazoles (Alt et al., 1990). This
will lead to direct protein damage, or oxidative DNA changes
leading to various functional changes, because of the large
number of enzymes dependent upon copper and the possible
misreading of genetic codes.
* Cellular injury due to the production of oxyradicals by the
Fenton reaction (Goldstein & Czapsky, 1986):
Cu+ + H2O2 --> Cu2+ + OH* + OH-
The excessive production of such radicals will initiate a cascade
of oxidation-reduction reactions (oxidative stress) finally leading to
the loss of cellular integrity. The causes of injury considered
include increased cytosolic calcium levels, ATP depletion, thiol
oxidation, lipid peroxidation, DNA damage and critical damage to
organelles such as mitochondria and lysosomes.
Threshold levels for copper toxicity have not yet been
established, although the main intracellular binding site for copper,
metallothionein, appears to become saturated with copper before the
occurrence of any toxic effects. Metallothionein also has been
suggested to act as an intracellular antioxidant, thereby protecting
cells by the direct scavenging of reactive oxygen species. In vitro
metallothionein exhibits a very high reaction constant for hydroxyl
radicals (Thornalley & Vasak, 1985) and according to recent
experiments, mouse cells lacking metallothionein were more sensitive
to oxidative stress (Liu et al., 1995).
6.5 Interactions with other dietary components
The absorption of copper is inhibited by the presence of some
other essential and nonessential trace metals (e.g. zinc, iron,
molybdenum, lead and cadmium) (WHO, 1996). The absorption of copper
is also influenced by a number of other dietary and endogenous
factors. Easily digested proteins may enhance copper absorption; for
example, proteins in human milk are more easily digested than proteins
in cow's milk and lend to enhance copper absorption. Citrate,
phosphate and glutamate all form complexes with copper that facilitate
absorption. Phytate, dietary cellulose fibre and ascorbic acid
decrease copper absorption (Cousins, 1985).
6.5.1 Protein and amino acids
Animal protein enhances copper absorption (Turnlund et al.,
1983). Copper absorption was higher from an animal protein diet (41%)
than from a plant protein diet (34%). Different milk proteins have
been shown to have varying effects on copper status: whey protein had
a negative effect on copper absorption (Lynch & Strain, 1990). Soy
protein isolates, as used in infant formula, reduce copper
bioavailability (Lo et al., 1984; Greger & Mulvaney, 1985). Specific
amino acids are known to form complexes with divalent cations such as
copper. Histidine chelates copper with a greater affinity than it does
zinc (Ashmead et al., 1985). Copper accumulation in the mucosal tissue
was higher when an excess of histidine to copper and zinc was used
(Wapnir & Balkman, 1992). It is possible that a copper-histidine
complex may be an effective way to provide bioavailable copper. In
contrast, cysteine has an inhibitory effect on copper utilization
(Robbins & Baker, 1980; Baker & Czarnecki-Maulden, 1987). This effect
on copper absorption is evident at both deficient and excess copper
levels in the diet (Aoyagi & Baker, 1994).
6.5.2 Phytate and fibre
Turnlund et al. (1984) used stable isotopes to study the effect
of copper on the absorption of phytate and alpha-cellulose in young
men. They found no effect of either component in human subjects and
suggested that high levels of phytate or fibre do not decrease copper
absorption. The authors proposed that zinc-phytate complexes
precipitate at the pH of the gastrointestinal tract, whereas
copper-phytate complexes do not. Since phytate in the soluble
copper-phytate complex can easily be replaced by other chelators, such
as amino acids (Jacobsen & Slotfeldt-Ellingsen, 1983), there may be no
inhibitory effect of phytate on copper absorption. A study on cereal
products supports this hypothesis (Lyon, 1984); zinc solubilized from
cereal by the addition of acid precipitated completely when the pH was
raised to 7, whereas copper remained in solution.
6.5.3 Ascorbic acid
Van den Berg & Beynen (1992) suggested that the primary effect of
high dietary ascorbic acid was to reduce intestinal absorption of
copper, but that it also increased hepatic uptake and biliary
excretion of 64Cu. The effect of ascorbic acid on copper metabolism
was more pronounced in copper-deficient than in copper-adequate
animals.
Finley & Cerklewski (1983) found decreased ceruloplasmin oxidase
activity and lower serum copper in young adult men after 64 days of
1500 mg ascorbic acid/day (values were determined after the vitamin
was discontinued). However, this effect could be independent of lower
copper absorption, as Jacob et al. (1987) found no difference in
copper absorption in young men given different levels of ascorbic
acid. Ascorbic acid may promote the dissociation of copper from
ceruloplasmin, thus lowering its oxidase activity. This was supported
by the finding that immunological quantitation of ceruloplasmin showed
no change in apoprotein levels. A clinical study on low birth weight
(LBW) infants fed formula supplemented with ascorbic acid (50 mg/day)
did not show any negative effects on copper balance (Stack et al.,
1990). However, the LBW infants were largely in negative copper
balance and thus may have been copper deficient. It is possible that
ascorbic acid under these conditions may not exert overall negative
effects on copper utilization as observed in copper-deficient rats
(Van den Berg et al., 1994).
6.5.4 Zinc
High levels of dietary zinc have a negative effect on copper
absorption. Since supplemental zinc is often used in infants, children
and pregnant women in order to avoid possible zinc deficiency, the
possible interference with copper absorption needs to be considered.
High doses of zinc (40-50 mg/day) have been used successfully to treat
patients with Wilson disease (Brewer et al., 1983; Hoogenraad & van
den Hamer, 1983). Zinc limits the amount of copper absorbed (Lyons et
al., 1995), possibly by increasing intestinal metallothionein
concentrations and, therefore, slowing the progression of the disease
(Fischer et al., 1983; Oestreicher & Cousins, 1985). However, high
intakes of zinc should be viewed with some concern since copper
deficiency may be induced. Conversely, copper supplementation may
interfere with zinc absorption (Salim et al., 1986).
Human subjects fed diets with different zinc/copper ratios have
not exhibited a significant effect on copper absorption. August et al.
(1989) used a stable isotope of copper to study copper absorption in
young adults and elderly subjects. They used zinc/copper ratios of
2 : 1, 5 : 1 and 15 : 1, finding no significant effects of these
ratios on copper absorption.
6.5.5 Iron
Copper absorption may also be affected by high levels of dietary
iron. Haschke et al. (1986) studied the effect of two levels of iron
fortification of infant formula on copper balance in full-term
infants. They found that the higher level of iron (10.8 mg/litre)
resulted in lower copper balance than when the lower iron level was
used (1.8 mg/litre). Barclay et al. (1991) have shown reduced SOD
levels in premature infants given iron supplements. Earlier studies in
experimental animals had shown a reduction in liver copper
concentrations when dietary iron was increased 10-fold (Smith &
Bidlack, 1980). However, modest supplements of iron did not appear to
affect serum copper levels in older infants (Yip et al., 1985).
Several studies suggest that high dietary iron only affects copper
absorption when copper status is low or marginal (Cohen et al.,
1985a,b; Johnson & Murphy, 1988).
High intakes of iron and ascorbate may act together to adversely
affect copper status. Johnson & Murphy (1988) found that high iron
with ascorbic acid caused severe anaemia in copper-deficient rats and
decreased plasma ceruloplasmin by 44% in copper-adequate rats. Since
iron and ascorbate are commonly used together in nutritional
supplements for humans, the possibility of a negative effect on copper
metabolism should be considered.
6.5.6 Carbohydrates
In rats, dietary fructose worsens the effects of copper
deficiency (Fields et al., 1984; Reiser et al., 1985) in that fecal
and urinary excretion of copper are elevated when the rats are fed
fructose as compared to starch. Data from humans do not support these
findings (Reiser et al., 1985; Holbrook et al., 1989).
6.5.7 Infant diets
Studies on full term infants fed on breast or cow's milk formula
suggest that copper is better absorbed from human milk than from a
cow's milk formula (Dörner et al., 1989). Studies using stable
isotopes of copper support this finding (Ehrenkranz et al., 1989).
Studies in suckling rats have revealed slightly higher copper
bioavailability (estimated from uptake of 64Cu by 6 h post-dosing)
from human milk than from cow's milk formula (Lonnerdal et al., 1985).
A more recent study, using the same rat pup model, evaluated several
varieties of infant formula (Lonnerdal et al., 1994). In general,
copper absorption was relatively high from milk formulae but lower
from soy formulae. The lower copper bioavailability from cow's milk
combined with its low copper content most likely explains the copper
deficiency found in some premature infants fed cow's milk formulae.
6.5.8 Other interactions (molybdenum, manganese, selenium)
Dietary molybdenum, in the presence of sulfate, forms insoluble
complexes with copper thereby decreasing the availability of copper
for absorption. Thus, high levels of molybdenum in the diet may
induce or aggravate copper deficiency (Ladefoged & Sturup, 1995). The
addition of copper to diets of rats decreases tissue manganese levels,
suggesting that copper impairs manganese absorption. Manganese
absorption is greatest in animals that are deficient in copper and
manganese (Johnson & Korynta, 1992). Research efforts on
copper-selenium interactions have not been revealing, except for
showing the complementarity in antioxidant protection of copper SOD
and selenium-containing glutathione peroxidase (Fischer et al., 1992;
Olin et al., 1994).
7. EFFECTS ON LABORATORY MAMMALS AND IN VITRO TEST SYSTEMS
The effects of exposure of experimental animals to common
inorganic salts of copper have been summarized in Tables 9-12. These
studies represent the better-quality and better-documented studies in
each toxicological area. Studies in which the compound was
administered by injection have generally not been included, owing to
their uncertain relevance to environmental or occupational exposures.
The results of such studies have, however, been included in the table,
when no information was available for more relevant routes of
exposure.
In this section and the associated tables, information on dosage
with respect to body weight was obtained from the original papers
wherever possible. When doses were not expressed in this way by the
investigators and could not be calculated from the data provided,
approximate doses have been estimated based on data presented in
standard sources (IAT, 1963; FDO, 1965; Gold et al., 1984).
7.1 Single exposure
7.1.1 Oral
The acute oral toxicity of various copper salts is summarized in
Table 9. A wide range of LD50 values has been reported, with the
most soluble salts (e.g. copper(II) sulfate and copper(II) chloride)
generally being more acutely toxic than those with lower solubility
(e.g. copper(II) hydroxide and copper(I) oxide). From the available
information on copper(II) sulfate, rats appear to be less susceptible
to copper than domestic animals; this pattern is also evident in
studies involving repeated exposure (section 7.2). In the various
acute studies, as the lethal oral dose is approached, signs of copper
toxicity include excessive salivation, vomiting, diarrhoea, gastric
haemorrhage, increased heart rate, hypotension, haemolytic crisis,
convulsions and paralysis.
7.1.2 Dermal
In the only dermal studies identified, LD50 values of > 1124
and > 2058 mg Cu/kg body weight per day were reported, the first for
rats exposed to copper(II) oxysulfate (NIOSH, 1993) and the second for
rabbits exposed to copper(II) hydroxide (Tomlin, 1994).
7.1.3 Inhalation
The LC50 value for inhalation exposure of rabbits to copper(II)
hydroxide (physical form and duration unspecified) was > 1303 mg
Cu/m3 (Tomlin, 1994). Intratracheal instillation in rats of
copper(II) oxide at 222 mg Cu/kg body weight was lethal (NIOSH, 1993).
Table 9. Toxicity of copper compounds after a single oral exposure
Salt Species LD50 value Equivalent Reference
(mg/kg body copper dose
weight) (mg Cu/kg
body weight)
Copper(II) rat 595 208 NIOSH (1993)
acetate rat 710a 226 Smyth et al.
(1969)
mouse 1600a 509 Schafer &
(lethal dose) Bowles (1985)
Copper(II) rat 159 82 Lehman (1951)
carbonate mouse 320 165 Schafer &
(lethal dose) Bowles (1985)
Copper(II) rat (male) 1350 388 Hasegawa et
carbonate rat (female) 1495 430 al. (1989)
hydroxide rabbit 317 91 NIPHEP (1989)
Copper(II) rat 140 66 Lehman (1951)
chloride mouse 190 90 NIPHEP (1989)
guinea-pig 32 15 NIPHEP (1989)
Copper(II) rat 1000 651 Pesticide
hydroxide Manual (1991)
Copper(II) rat 940b 247 Smyth et al.
nitrate (1969)
Copper(I) rat 470 417 Smyth et al.
oxide (1969)
Copper(II) rat 700-800 417-476 Tomlin (1994)
oxychloride rat 1440 857 NIPHEP (1989)
Copper(II) rat 300 120 Lehman (1951)
sulfate rat 960c 244 Smyth et al.
(1969)
mouse 50 (LD100) 20 Venugopal &
Luckey (1978)
rabbit 125 50 Eden & Green
(1939)
a Monohydrate
b Trihydrate
c Pentahydrate
Guinea-pigs exposed to copper(II) oxide aerosol at 1.6 mg/m3
(1.3 mg Cu/m3, as particles with a count median diameter
approximately 0.03 µm) for 1 h showed significant reductions
( P <0.05) in tidal volume, minute volume and lung compliance, both
during and after exposure, while respiratory frequency was slightly
but not significantly increased (Chen et al., 1991).
In two studies involving the intratracheal instillation in rats
of copper(II) oxide (Hirano et al., 1993) or copper(II) sulfate
pentahydrate (Hirano et al., 1990) at doses of up to 0.1 or 0.05 mg
Cu/rat, respectively (roughly 0.36 or 0.18 mg Cu/kg body weight),
acute inflammatory changes were evident in the lungs from 0.018 mg
Cu/kg body weight with the soluble sulfate salt and from 0.073 mg
Cu/kg body weight with the insoluble oxide.
7.2 Short-term exposure
There have been numerous studies of the effects of short-term
exposure to copper compounds. In rats exposed by the oral route to
approximately 30-50 mg Cu/kg body weight per day as copper(II)
sulfate, the most common compound-related effects observed have
included those on the liver, kidney and lungs, as well as alterations
in haematology (particularly anaemia) and in blood biochemistry.
Effects are qualitatively similar with other copper compounds, and in
other species. However, pigs and especially sheep are more
susceptible to the toxic effects of copper compounds; exposure of
sheep to doses of 1.5-7.5 mg Cu/kg body weight per day in diet as
copper(II) sulfate or copper(II) acetate was associated with
progressive liver damage, followed by a haemolytic crisis and
ultimately death. In inhalation studies, morphological changes were
induced in the tracheal epithelium and in the alveoli by short-term
inhalation of 0.06 mg Cu/m3 copper(II) sulfate in mice, but not in
hamsters.
7.2.1 Oral
The most comprehensive studies of short-term toxicity in rats and
mice were conducted by Hébert et al. (1993). In a 15-day feeding
study in rats involving the administration of up to 16 000 mg/kg
copper(II) sulfate pentahydrate in the diet (estimated intakes up to
305 mg Cu/kg body weight per day), weight gain was reduced from 194 mg
Cu/kg body weight per day, but there were no other overt signs of
toxicity. Effects on the forestomach were evident from 45 mg Cu/kg
body weight per day, on the kidneys from 93 mg Cu/kg body weight per
day, and on the liver and bone marrow from 194 mg Cu/kg body weight
per day. The NOEL in this study was 23 mg Cu/kg body weight per day
(Hébert et al., 1993). When the same investigators administered
copper(II) sulfate to rats in the drinking-water for 15 days at up to
30 000 mg/kg (estimated intakes up to 97 mg Cu/kg body weight per
day), the various clinical signs of toxicity and deaths that were
evident from around 31 mg Cu/kg body weight per day were attributed to
dehydration, as a result of the poor palatability of the
drinking-water. The NOEL in females was 26 mg Cu/kg body weight per
day, while in males there was evidence of kidney damage from the
lowest dose tested of 10 mg Cu/kg body weight per day (Hébert et al.,
1993). (Effects on gastric mucosa have only been observed in rodent
studies in which copper(II) sulfate was administered in the diet, and
not in the drinking-water studies. It is likely that these effects
are due to irritation, particularly as copper(II) sulfate may
dissociate to form sulfuric acid in the stomach.)
From the evidence of one 15-day feeding study (Hébert et al.,
1993), mice appear to be less sensitive than rats to the toxic effects
of copper. When copper(II) sulfate pentahydrate was administered at
up to 16 000 mg/kg in the feed, weight gain was reduced only in
females at the top dose (estimated intake 781 mg Cu/kg body weight per
day), while the only effects observed on microscopic examination of
the liver, kidneys and forestomach were hyperplasia and hyperkeratosis
in the forestomach from 197 (males) or 216 (females) mg Cu/kg body
weight per day. The NOEL in this study was 92 mg Cu/kg body weight
per day in males and 104 mg Cu/kg body weight per day in females. In
the equivalent drinking-water study, the findings (reduced water
consumption, body weight, clinical signs at doses of 58-62 mg Cu/kg
body weight per day and higher) were again, as in the rats, thought to
be confounded by dehydration of the treated animals (Hébert et al.,
1993).
Other studies summarized in more extensive reviews on copper
(Slooff et al., 1989; ATSDR, 1990) have deficiencies in design and/or
level of experimental details and results, which make it impossible to
utilize in any dose-response evaluation. They are, therefore, not
considered here.
7.2.2 Inhalation
7.2.2.1 Copper(II) sulfate
When unspecified numbers of mice and hamsters were exposed by
inhalation to copper(II) sulfate aerosol at 0.06 mg Cu/m3 for 3
h/day, 5 days/week for 1 or 2 weeks, the tracheal epithelium and the
alveoli of mice were altered in appearance, whereas hamsters showed no
treatment-related effects on the tracheal epithelium or on ciliary
activity (Drummond et al., 1986).
7.2.2.2 Copper chloride
In an inhalation study, repeated exposure of rabbits (group sizes
not specified) to copper(II) chloride aerosol at 0.6 ± 0.3 mg Cu/m3
for 6 h/day, 5 days/week for 4-6 weeks did not produce any
histological lesions in the lungs, and alveolar macrophage activity
appeared to be unaffected despite some morphological changes
(Johansson et al., 1983, 1984; Lundborg & Camner, 1984).
7.3 Repeated exposure: subchronic toxicity
There are a limited number of studies of the subchronic toxicity
of copper compounds to animals. In comprehensive studies in rats,
there were histopathological effects on the forestomach and
indications of anaemia at 34 mg Cu/kg body weight per day as
copper(II) sulfate in diet. Higher doses elicited degenerative
changes in the liver and kidney in rats in this and several other
studies, with recovery observed in some of these. As was observed in
the short-term studies (section 7.2), mice are markedly less sensitive
than rats to the toxicity of copper(II) sulfate. Other copper
compounds have not been well studied, although exposure of rats to
approximately 10 mg Cu/kg body weight per day as copper(I) chloride
induced transient reductions in the activities of glutathione
S-transferases, and the same dose as copper(II) carbonate increased
systolic blood pressure and haemoglobin levels.
7.3.1 Oral
7.3.1.1 Copper(II) sulfate
The critical study is that of Hébert et al. (1993) which is
described here. Details of other experiments of repeated long-term
exposures of copper are given in Table 10.
In comprehensive 90-day studies in both rats and mice (Hébert et
al., 1993), in which copper(II) sulfate pentahydrate was administered
in the feed at up to 8000 mg/kg in rats (up to 138 mg Cu/kg body
weight per day) and up to 16 000 mg/kg in mice (up to around 1000 mg
Cu/kg body weight per day), there were no overt signs of toxicity
other than a dose-related reduction in growth (statistically
significant in male and female rats from 67 and 138 mg Cu/kg body
weight per day, respectively, and in male and female mice from 97 and
267 mg Cu/kg body weight per day). Microscopic examination of the
tissues revealed hyperplasia and hyperkeratosis in the forestomach in
both species (from 34 mg Cu/kg body weight per day in rats and from
187-267 mg Cu/kg body weight per day in mice), and liver and kidney
effects in the rats only (from 67 mg Cu/kg body weight per day). In
the rats, iron levels were reduced in the spleen, and haematological
changes indicative of microcytic anaemia were observed at 34 mg Cu/kg
body weight per day and higher. The NOEL was 17 mg Cu/kg body weight
per day in rats, and 44 and 126 mg Cu/kg body weight per day in male
and female mice, respectively. The liver and kidney effects observed
in the rats in this study included inflammation of the liver and
degeneration of the kidney tubule epithelium, and were similar to
those found at higher doses (> 100 mg Cu/kg body weight per day) in
more limited studies in rats (Haywood, 1980, 1985; Haywood & Loughran,
1985).
Table 10. Toxicity of copper after repeated oral doses
Species Protocol Results Effect level Reference
Copper(II) copper sulfate pentahydrate given Survival was unaffected. Body weight gain was significantly NOEL: 17 mg Hébert
sulfate in the feed for 92 days at levels of depressed in the males at 4000 mg copper sulfate/kg diet Cu/kg body et al.
Rats (F344/N, 0, 500, 1000, 2000, 4000 and 8000 (P < 0.05) and in both sexes at 8000 mg copper sulfate/kg weight per (1993)
groups of 10 mg/kg diet. Estimated intakes were diet (P < 0.01). Average feed consumption was reduced day
males and 10 0, 8, 17, 34, 67 or 138 mg Cu/kg in both sexes at 8000 mg copper sulfate/kg diet. There
females, body weight per day. were no other clinical signs of toxicity in the treated rats LOEL: 34 mg
additional Comprehensive microscopic Cu/kg body
groups of 10 examinations carried out at the Gross and microscopic lesions of the forestomach weight per
males & 10 top dose level, in the controls, (hyperplasia and hyperkeratosis of the limiting ridge) were day
females for and in the animals that died early. seen at 2000 mg copper sulfate/kg diet and above.
pathology Liver, kidney and forestomach Inflammation of the liver was seen in all rats at 8000 mg
studies at examinations were carried out to copper sulfate per kg diet, all males and 6/10 females at
intermediate establish a NOEL. Intermediate 4000 mg copper sulfate/kg diet and one male at 2000 mg
time points) haematology and clinical chemistry copper sulfate/kg diet. In the kidneys, cytoplasmic protein
evaluations carried out on droplets were evident, particularly at the top two doses,
days 5 and 21, and urinalysis and minimal nuclear enlargement of, and degeneration in, the
on day 19. These tests also tubule epithelium were seen at the top dose. From 2000 mg
carried out at termination copper sulfate per kg diet, iron levels were reduced in the
of the study spleen (both sexes) and haematological changes indicative of
microcytic anaemia were seen on day 21 and at the end of the
study. Significant increases in red bloodcells and
reticulocytes were seen in the high-dose males at the end of
the study. A number of other clinical chemistry and urinalysis
parameters were affected at the top two dose levels
Rats (Wistar, Rats fed diets containing 0 or 3000 In group not supplemented with copper for first 15 weeks only one dose Haywood
groups of 16 mg Cu/kg as copper sulfate for of experiment, clinical effects (lethargy, ruffled coats) tested &
males) 15 weeks (equivalent to 270 mg seen on administration of 6000 mg Cu/kg diet. No such effect (effects at Loughran
Cu/kg body weight/day). Four rats seen in 'copper-primed' group. Livers of rats given 3000 100mg Cu/kg (1985)
per group killed and livers removed mg Cu/kg diet for 15 weeks showed only mild effects body weight
for examination, remaining rats (believed to indicate ongoing recovery from damage that per day)
then fed diets containing 6000 mg was assumed to have occurred in the earlier weeks) at 15
Cu/kg as copper sulfate for a weeks, and feeding of 6000 mg Cu/kg diet for a further 3
further 3 weeks weeks had no significant hepatotoxic effects. The unprimed
Table 10. (continued)
Species Protocol Results Effect level Reference
group suffered hepatocellular necrosis and inflammation
after the 3-week exposure to 6000 mg/kg
Rats (strain Rats fed diet containing 2000 mg Inflammation and extensive necrosis of the liver and bile only one dose Haywood
unspecified, Cu/kg diet as copper sulfate duct hyperplasia were evident by week 6. By week 15 there tested (1980)
groups of 24 (equivalent to about 100 mg Cu/kg was considerable recovery, although some fibrosis and less (effects at
treated and body weight/day). Groups of 4 marked hyperplasia of the bile duct could still be seen 100 mg Cu/kg
12 control treated and 2 control rats killed body weight
males) after 1, 2, 3, 6, 9 and 15 weeks Greenish discolouration of the kidneys was seen in some per day)
and their liver and kidneys rats at week 6. Microscopic effects (eosinophilic droplets
examined histologically in the cytoplasm of cells in the proximal convoluted tubules
and desquamation of these cells into the lumen) first
appeared at week 3, and were more severe at 6 weeks.
Regeneration was almost complete at 15 weeks
The investigators concluded that repeated copper dosing
elicits a similar response in the kidneys and the liver, both
organs adapting to the excess copper, resulting in the
development of tolerance in the treated rats
Blood was taken from the above Alanine aminotransferase activity was significantly increased Haywood
rats prior to sacrifice and (P < 0.05) at week 1 (indicative of liver damage), rose to a &
analysed for enzyme activity maximum around weeks 6-9, and remained at that level to Comerford
the end of the study. Ceruloplasmin activity was elevated (1980)
(P < 0.05) from week 6 until the end of the study. Alkaline
phosphatase activity and bilirubin levels were unaffected
by copper treatment
Rats (Wistar, Rats fed diets containing 0, Rats receiving 6000 mg Cu/kg diet did not grow and were LOEL: 270 Haywood
groups of 28 3000, 4000, 5000 or 6000 mg in poor condition. Two died at 2 weeks. At 6 weeks the mg Cu/kg (1985);
males) Cu/kg diet as copper sulfate for survivors developed diarrhoea, began to lose weight and body weight Haywood
up to 15 weeks (equivalent to 0, were killed. At 3000-5000 mg/kg of copper sulfate, the per day &
270, 360, 450 and 540 mg Cu/kg animals showed clinical signs of toxicity (poor growth, Loughran
body weight per day based on ruffled fur) at around 3-5 weeks, but their condition (1985)
the mean final weight of the rats subsequently improved; by week 15 they appeared sleek
fed 3000 mg Cu/kg diet). Four and active, but were only half the weight of controls
Table 10. (continued)
Species Protocol Results Effect level Reference
rats at each dose level killed at
1, 2, 3, 4, 5, 6 and 15 weeks. Microscopic changes were evident in the liver (necrosis,
Liver and kidneys removed for inflammation, hepatocytic hypertrophy, nuclear
histological examination enlargement) within 1-2 weeks, depending on the dose, but
began to subside from week 6 onwards, with regeneration by
week 15 (except at 6000 mg Cu/kg diet where the effects
persisted). Microscopic effects on the kidneys (an increase
in eosinophilic cytoplasmic droplets in cells of the
proximal tubules followed by extrusion of the droplets and
exfoliation of the cells, degenerative changes to proximal
tubules) were seen at 2-5 weeks at all dose levels, with
recovery from weeks 6-15
Mice (B6C3F1, Copper sulfate pentahydrate given Survival was unaffected. A dose-related depression in NOEL: 44 Hébert
groups of 10 in the feed for 92 days at levels of body weight gain was observed in both sexes and 126 mg et al.
males and 0, 1000, 2000, 4000, 8000 and (statistically significant from 2000 mg copper sulfate/kg Cu/kg body (1993)
10 females) 16 000 mg/kg diet. Estimated diet in males and 4000 mg copper sulfate/kg diet in females, weight per
intakes were 0, 44, 97, 187, 398 P < 0.05), although average feed consumption was day in males
and 815 mg Cu/kg body weight similar in treated and control mice. No other clinical and females
per day in males and 0, 52, 126, signs of toxicity were observed respectively
267, 536 and 1058 mg Cu/kg
body weight per day in females. Gross and microscopic lesions of the forestomach LOEL: 97
Comprehensive microscopic (hyperplasia and hyperkeratosis of the limiting ridge) and 267 mg
examinations carried out at the were seen at 4000 mg copper sulfate/kg diet and above Cu/kg body
top dose level, in the controls, weight per
and in the animals that died early. There were no reported effects on the liver or kidneys, day in males
Liver, kidney and forestomach and iron levels in the spleen were normal and females
examined to establish a NOEL respectively
Copper(I) Rats given drinking-water Activity of glutathione S-epoxide transferase was only one Freundt
chloride containing 0 or 100 mg CuCl/litre significantly inhibited (P < 0.05) after treatment dose tested &
Rats (Sprague- (equivalent to 0 or 10 mg Cu/kg for 15 days (-29% compared with controls) but not (effects seen Ibrahim
Dawley, groups body weight per day). Livers after 30 or 90 days. Glutathione S-aryl transferase at 10 mg (1991)
of 5 females) removed after 15, 30 or 90 days activity was unaffected after 15 days, was Cu/kg body
of treatment for determination of significantly inhibited (P < 0.05) after 30 days weight per
activity of glutathione S-epoxide (-7%), and was still slightly but not significantly day)
Table 10. (continued)
Species Protocol Results Effect level Reference
transferase and glutathione reduced after 90 days (-6%). (These enzymes catalyse
S-aryl transferase the metabolic inactivation of reactive substances)
Copper(II) Rats given 18 or 100 mg Cu/kg Body weight, urine output and feed and water intakes did only one Liu &
carbonate diet as copper carbonate for not differ with copper intake. High-dose rats showed dose tested Medeiros
Rats (Wistar or 15 weeks (equivalent to about increased systolic blood pressure compared with low-dose (effects seen (1986)
spontaneously 1.7 and 9.6 mg Cu/kg body rats, particularly in the Wistar strain (Wistar P < 0.05, at 9.6 mg
hypertensive weight per day). Blood pressure SHR P < 0.01 at week 15). Haemoglobin levels were increased Cu/kg body
rats (SHR), measured 3 times/week at high copper intake (P < 0.05), while total cholesterol, weight per
groups of 10 triglycerides and glucose levels in the blood were day)
males of unaffected
each strain)
7.3.1.2 Copper chloride
The task group was aware of an ongoing study in guinea-pigs which
were orally dosed from their first day of life with milk formula
containing copper(II) chloride (10, 15, 30 mg Cu/kg body weight per
day) for 28 days in order to study the effect of exposure to copper in
early life on copper homoeostasis and toxicity (Summer & Dieter,
personal communication, 1996).
7.4 Long-term exposure chronic toxicity or carcinogenicity
The chronic toxicity/carcinogenicity of copper compounds has not
been well characterized (see Table 11). Increased mortality and
growth retardation or effects on the liver, kidneys or stomach have
been observed in rats following long-term ingestion of 27-150 mg Cu/kg
body weight per day as copper(II) sulfate, or 44-45 mg Cu/kg body
weight per day as copper(II) acetate, in several limited studies.
Long-term ingestion of copper(II) sulfate at 10 mg Cu/kg body weight
per day induced marked hepatotoxicity in rabbits. An oral study in
dogs did not show significant toxic effects at the highest dose of 8.4
mg Cu/kg per day, given as copper gluconate (Shanaman et al., 1972).
The available studies of the carcinogenicity of copper compounds
in rats and mice have given no indication that copper salts are
carcinogenic. However, the short duration or low level of exposure,
the small group sizes employed, the limited extent of
histopathological examination, or inadequate reporting limits the
conclusions which can be drawn from such studies. The studies
summarized in Table 11 are, therefore, inadequate to test the
carcinogenic potential of copper compounds with any degree of
certainty. In several studies, administration of copper compounds
inhibited the development of tumours induced by known carcinogens (see
Table 11).
7.5 Reproductive and developmental toxicity
As shown in Table 12, there is some limited evidence that
exposure to copper compounds can affect reproduction in animals. In
some studies of rats exposed by the oral route, the weights and/or
histology of the testes, seminal vesicles, uterus or ovaries have been
affected by chronic intakes of 27-120 mg Cu/kg body weight per day as
copper(II) sulfate, acetate, or gluconate, although the results are
inconsistent between studies and the reporting of some studies is
deficient. In mice, there were no effects on male or female
reproductive organs at 398-537 mg Cu/kg body weight per day as
copper(II) sulfate in the diet. In a single study of rats inhaling
copper(II) chloride aerosol, there were effects on sperm, testis
weight and circulating levels of reproductive hormones.
Table 11. Chronic toxicity or carcinogenicity after long-term exposure
Protocol Results Effect level Reference
Copper(II) Rats fed diets containing 0, 530 Body weight gain was retarded at 1600 mg Cu/kg LOEL (non-neoplastic Harrisson
sulfate or 1600 mg Cu/kg diet as copper diet in the males. Stomachs of the high-dose effects): et al.
Oral sulfate for 40-44 weeks (approx. females were enlarged. Other findings at the high 27 mg Cu/kg body (1954)
Rats 0, 27 or 80 mg Cu/kg body weight dose were 'bronzed' kidneys, 'bronzed' or yellowish weight per day in
(Sprague-Dawley, per day in males and 0, 40 or 120 livers, hypertrophied ridges between cardiac males, 40 mg
groups mg Cu/kg body weight per day in and peptic portions of stomach, and blood in the Cu/kg body weight
of 25 males females). (Reduced amounts fed intestinal tract. Microscopic effects (not further per day in females
and 25 for the first month of the described) were seen in the kidneys in the high-dose
females) experiment.) Microscopic group (presumably in both males and females), and
examination of limited number of effects on the liver were seen in both males and
organs Study inadequately described females, presumably in both dose groups
Rats Rats given diets containing Excess copper caused decreased body weight gain Toxic effects at Carlton
(Sprague-Dawley, deficient (1 mg Cu/kg diet) or and increased mortality with or without DMN or AAF 40 mg Cu/kg body & Price
groups of 50 excess (800 mg Cu/kg diet) levels treatment. The only effects reported in the rats not weight per day (1973)
or 58 males, of copper (as copper sulfate) for 9 exposed to these two carcinogens were liver
additional months (equivalent to about 0.05 necrosis and transitional nodules in the liver in Exposure too short
groups of or 40 mgCu/kg body weight per 3/32 and 1/32 animals, respectively at 800 mg Cu/kg and group size
55-102 males day). Within each treatment group, diet (none at 1 mg Cu/kg diet), and 1 kidney tumour inadequate to
also given separate groups given DMN in the low-copper group (42 rats) assess the
dimethyl the drinking-water (50 mg Cu/kg carcinogenic potential
nitrosamine diet) or AAF in the diet (0.06%), Both DMN and AAF exposure markedly increased of copper sulfate
(DMN) or in both cases for 4 days in every the incidence of liver necrosis and transitional itself, but the data
acetylamino- 8 for 6 months, or no further nodules and each induced a similar incidence of suggest it may
fluorene treatment. Five rats per group liver tumours in rats fed excess copper or have an inhibitory
(AAF) killed after 90 days, and an copper-deficient diets. There were no kidney effect on
additional 5/group killed every neoplasms in the AAF-treated groups, but 57% of DMN-induced kidney
30 days thereafter. Limited the rats in the DMN group on a copper-deficient tumours and
range of organs examined diet (17/30) had kidney neoplasms compared with AAF-induced
microscopically 0% (0/29) on the higher copper diet extra-hepatic tumours
Table 11. (continued)
Protocol Results Effect level Reference
The incidence of AAF-induced extrahepatic
neoplasms was apparently reduced by the excess
copper diet (5/30 vs 11/27 in the low copper group)
Mice Copper sulfate pentahydrate The numbers of mice with ovarian tumours were Exposure too short Burki &
(C57BL/6J, supplied in the drinking-water at 0/10, 0/12, 11/11 and 6/11 in the untreated and group size Okita
groups of 198 mg/litre for 46 weeks controls, copper-treated mice, DMBA-treated mice and inadequate to (1969)
10-12 (equivalent to about 10 mg Cu/kg DMBA + copper-treated mice respectively, assess the
females) body weight per day). One group suggesting that copper sulfate may inhibit tumour carcinogenic potential
received copper sulfate treatment development to some extent. The corresponding of copper sulfate
alone, a second was given an figures for lymphomas were 1/10, 2/12, 3/11 itself, but the data
intravenous injection of DMBA and 3/11 suggest it may
(a known carcinogen) 2 weeks inhibit the
after copper treatment began, and development of
two further groups were untreated DMBA-induced ovarian
or received DMBA treatment only. tumours
Mice killed at 46 weeks and a
limited range of organs studied
microscopically
Rabbits 10 ml of a 1% solution of copper Effects on the liver included degeneration and Only one dose Tachibana
(strain and sulfate (equivalent to about 10 mg vacuolation of the hepatocytes, granule formation tested (effects (1952)
numbers Cu/kg body weight) given to in the cytoplasm, morphological changes in the at 10 mg Cu/kg
unspecified) rabbits daily or on alternate days nuclei, and atrophy and compensatory hypertrophy body weight
"for up to 400 days and over". "in the late stage". Marked infiltration of round per day)
Rabbits evidently killed at cells (mainly lymphocytes) into "interhepatic
various time intervals, some tissues" was seen after 200 days (and to a lesser
as early as 33 days. Liver extent after shorter periods of administration).
examined macroscopically Proliferation of the interstitial connective
and histologically tissues was also evident after 200 days, and became
much more marked after 300 days, "with a resulting
picture of liver cirrhosis". Haemorrhage and
necrosis of the liver occurred in some animals
Table 11. (continued)
Protocol Results Effect level Reference
A dysfunction in sugar metabolism was evident after
30-60 days of copper administration, with temporary
recovery after 90 days but further impairment after
120-150 days. There were no effects on serum
bilirubin or total serum proteins.
Copper Rats fed diets containing 0 or Mortality was increased, and food intake and body Only one dose Harrisson
gluconate 1600 mg Cu/kg diet as copper weight gain were retarded by 1600 mg Cu/kg diet in tested (effects at et al.
Oral gluconate for 40-44 weeks both sexes. Stomachs enlarged in both sexes, while 80 mg Cu/kg (1954)
Rats (equivalent to about 0 or 80 mg hypertrophy of the uteri, ovaries, or seminal body weight per
(Sprague-Dawley, body weight per day in males, vesicles was observed. Other findings were "bronzed" day in males,
groups of 25 and 0 or 120 mg Cu/kg body kidneys, "bronzed" or yellowish livers, and 120 mg Cu/kg
males and weight per day in females). hypertrophied ridges between cardiac and peptic body weight per
25 females) (reduced amounts fed for the first portions of stomach, and blood in the intestinal day in females)
month of the experiment). tract. Microscopic effects (not further described)
Microscopic examination of a were seen in the kidneys of copper-exposed rats
limited number of organs. Study (presumably in both sexes), and effects on the liver
inadequately described were seen on both males and females. Levels of
copper in liver were nearly twice as high as in rats
receiving an equivalent dose of copper as
copper(II) sulfate, corresponding to their
relative toxicities
Dogs (Beagle, Dogs fed diet containing 0, No effect on mortality or body weight gain. Physical Elevated SGPT Shanaman
groups of 0.012%, 0.06% and 0.24% copper examinations, haematology, urinalysis and most in 2 of 12 dogs (1972)
6-8 males gluconate for 6-12 months blood biochemical analysis revealed no effect of the on 8.4 mg Cu/kg
and 6-8 (equivalent to 0, 0.42, 2.1 compound except in two of the 12 dogs on the body weight per
females) and 8.4 mg Cu/kg per day). Detailed highest dose which showed elevated levels of serum day evaluated by
study of haematological biochemical GPT; this was reversible. No compound related the Task Group
and urinalysis parameters, and gross on microscopic pathologic lesions or changes as not
tissue copper concentrations in in organ weight were seen. At 6 and 12 months, toxicologically
kidney, liver and spleen. Detailed there was a gross-dependent increase in copper significant
necropsy, histopathology and level in kidney, liver and spleen. Liver biopsy from
organ weight information provided 4 animals at 0, 4 and 12 weeks after withdrawal of
12 months dosing (0.24% copper gluconate) showed
some reversibility of liver copper level
Table 11. (continued)
Protocol Results Effect level Reference
Copper(II) Rats fed diets containing 0 or 0.5% Rats in all groups were reported to consume the Study inadequate Howell
acetate copper acetate (approximately 87 same amounts of food. In one experiment, of for assessing the (1958)
Oral mg Cu/kg body weight per day) animals treated with DMAB alone, 17/20 carcinogenic
Rats (various throughout their lifetimes. Second developed tumours, compared with 4/16 in those potential of copper
strains, set treated in the same way, exposed to both DMAB and copper acetate. acetate itself, but
groups of except 0.09% Comparable incidences for a subsequent the data suggest
5 males p-dimethylamino-benzene (DMAB), experiment were 7/8 and 0/8, respectively it has an inhibitory
and 5 a known liver carcinogen, included effect on
females) in the diet for the entire period. DMAB-induced tumours
Liver, spleen and grossly abnormal
tissues were examined
microscopically
Rats Control group fed meal containing Growth was reduced by 23% in the treated rats. Only one dose Llewellyn
(Holtzman, 18 mg Cu/kg diet, treated group Weights of the heart, spleen, lung and kidney were tested et al.
groups of fed meal supplemented with 2600 unchanged, while testis weights were increased. (non-neoplastic (1985)
10 males) mg Cu/kg diet copper acetate Effects on liver weight are unclear from the effects at 45 mg
(approximately 45 mg Cu/kg body information provided Cu/kg body weight per
weight per day) for 21 weeks. day)
Limited number of organs Examination of the bones revealed no qualitative
weighed. Long bones (osteoporosis, osteomalacia, modelling defects) or
radiographed and measured quantitative effects, although femur length was
decreased relative to controls (P < 0.05)
Intraperitoneal Injection of copper acetate 3 times Only 5/20 mice survived at the top dose. The Inadequate group Stoner
injection per week for 8 weeks at total numbers of mice with lung tumours were 4/15 (27%), size to determine et al.
Mice (Strain doses of 36, 90 or 180 mg/kg body 9/18 (50%) and 3/5 (60%) for the 36, 90 and 180 whether copper (1976)
A/strong, weight (roughly 12, 31 or 63 mg mg/kg body weight groups respectively, compared acetate increases
groups of 10 Cu/kg body weight). Control mice with 7/19 (37%) in the control group. The average the spontaneous
males and 10 received vehicle alone (0.85% number of lung tumours per mouse (0.40, 0.56 and lung tumour
females) NaCl). Mice sacrificed 22 weeks 2.00 tumours per mouse in the low-dose, mid-dose incidence in this
after the last injection. Microscopic and high-dose groups, respectively) increased susceptible strain
examination limited to the lungs dose-dependently but was not statistically of mice
Table 11. (continued)
Protocol Results Effect level Reference
and any tissues that appeared significantly different from the control incidence
abnormal on gross examination (0.42) at any dose level. No other tumours were
of a small number of organs identified in a limited range of tissues
Copper(II) Mice given 0 or 1000 mg copper Study results inadequately reported. Survival was The group sizes Bionetics
8-hydroxy- 8-hydroxyquinoline/kg body weight apparently unaffected by the treatment were too small Research
quinoline (roughly 0 or 180 mg Cu/kg body and an inadequate Labs.
Oral weight) by gavage (in 0.5% No statistically significant increases in tumour number of doses (1968)
Mice (B6C3F1 gelatine) on days 7-28 of age, incidences were observed in either strain of mice were tested to
and B6AKF1, and then fed diets containing compared with controls assess the
groups of 18 2800 mg compound/kg diet carcinogenic
males and 18 (providing about 60 mg Cu/kg potential of copper
females per body weight per day) for remainder 8-hydroxyquinoline
strain) of the 18-month study. Extent
of microscopic examination
unclear, but certainly very limited
Unspecified Rats maintained on diets No colonic tumours occurred in rats treated only Carcinogenic Greene
copper salts containing 0.6, 25 or 100 mg with copper, while all DMH-treated rats had tumours. potential of et al.
Oral Cu/kg diet copper (equivalent to There was a significant increase (P < 0.001) in copper cannot (1987)
Rats 0.03, 1.25 or 5 mg Cu/kg body colonic tumours (3.14 ± 0.39 tumours/cm colon) in be assessed
(Sprague-Dawley, weight per day) for 25 weeks and rats fed the copper-deficient diet (0.6 mg Cu/kg from this
groups of then killed. A second series also diet) and treated with DMH, compared with rats fed study
10 males) received 16 weekly doses of a diets containing normal or high copper levels and
carcinogen (1,2-dimethylhydrazine, treated with DMH (0.74 ± 0.07 and 0.76 ± 0.08
DMH, 20 mg/kg body weight) tumours per cm colon, respectively). A greater
proportion of these tumours were malignant
(P < 0.01) in the copper-deficient group (92%
compared with 70 and 76% in the normal and high
copper groups)
Table 12. Reproductive and developmental toxicity of copper
Species Protocol Results Effect level Reference
Copper(II) Copper sulfate pentahydrate given No effects were seen on testis, epididymis or cauda No effects Hébert
sulfate in the diet for 92 days at epididymis weight, spermatid counts or sperm motility observed at 67 et al.
Oral concentrations of 0, 500, 2000 or 4000 in males of either species, at any tested dose. The mg Cu/kg body (1993)
Rats (F344/N, mg/kg. Estimated intakes 0, 8, 34 length of the oestrous cycle in females was weight per day
groups of 10 or 67 mg Cu/kg body weight per unaffected. A slight dose-related decrease was seen
males and day. Sperm morphology and in the percentage of the oestrous cycle spent in
10 females) vaginal cytology evaluated oestrus but this effect did not achieve statistical
significance (P > 0.05)
Mice Males and females given 0, 0.5, 1, Developmental malformations (including NOEL: 53 mg Lecyk
(C57BL and 1.5, 2, 3 or 4 g copper sulfate/kg hydrocephalus, encephalocoeles, and abnormalities of Cu/kg body (1980)
DBA, groups feed (approximately 0, 27, 53, 80, the ribs and vertebrae) occurred in groups of both weight per
of 7-22 106, 159 or 213 mg Cu/kg body strains given > 3 g/kg feed. C57BL stock had day
females, weight per day) for 1 month prior abnormalities in 1/55 and 3/35 live fetuses and DBA
unspecified to mating. Treatment presumably stock in 2/56 and 4/45, in the 3 and 4 g/kg feed LOEL: 80 mg
number of continued in females until sacrifice groups respectively. No abnormalities were found Cu/kg body
males) on day 19 of pregnancy in controls (65 live C57BL fetuses, 76 live DBA weight per
fetuses). Mean values for litter size, live fetuses day
and mean fetal weight were reduced in groups of both
strains given > 1.5 g/kg feed. Statistical
significance not reported, but reductions appear to
have been dose-related in some cases
Mice Mice given 0 or 6 mg Cu/kg per litre No data were presented on litter size or the incidence One dose group Kasama
(C3H/HeN as copper sulfate in drinking-water of abnormalities. Copper administration during only (effects & Tanaka
and C3H/HeJ, from day 13 of pregnancy to delivery pregnancy alone did not affect body weight or organ observed at (1988)
females, (approximately 1.6 mg Cu/kg body weights (cerebrum, liver and kidney) of the offspring 1.3-1.6 mg
numbers weight per day). Half of the within 24 h after birth, but continued copper Cu/kg body
unspecified) copper-treated animals then received administration during lactation resulted in significant weight per
5 mg Cu/kg per litre as copper sulfate reductions in neonatal body weight at 7-13 days of day)
in the drinking-water during lactation age (P < 0.05) and in the weight and protein content
(approximately 1.3 mg Cu/kg body of the cerebrum, liver and kidney of neonates at
weight per day) while the remainder 13 days of age (P < 0.05). The offspring of the
received tap water alone. Neonates copper-treated animals showed various changes
sacrificed and examined at 13 days in enzyme activity in these organs
of age
Table 12. (continued)
Species Protocol Results Effect level Reference
Mice Copper sulfate pentahydrate given No effects were seen on testis, epididymis or cauda No effects Hébert
(B6C3F1, in the diet for 92 days at epididymis weight, spermatid counts or sperm observed at (1993);
groups of 10 concentrations of 0, 1000, 4000 or motility in males at any tested dose. The length of 398 mg Cu/kg Hébert
males and 8000 mg/kg diet. Estimated intakes the oestrous cycle in females was unaffected body weight per et al.
10 females) 0, 44, 187 or 398 mg Cu/kg body weight day in males, (1993)
per day in males and 0, 52, 267 or 537 mg Cu/kg
537 mg Cu/kg body weight per day body weight per
in females. Sperm morphology and day in females
vaginal cytology evaluated
Mink Males and females given 0, 25, 50, There were no overt toxic effects in the NOEL: 6 mg Aulerich
(standard 100, 200 mg Cu/kg diet as copper copper-treated adults. No information was provided on Cu/kg body et al.
dark, groups sulfate pentahydrate developmental malformations. Kit weight at 4 weeks weight per (1982)
of 4 males (approximately 3, 6, 12 or 24 mg Cu/kg (but not at birth) was significantly reduced in the 100 day
and 12 body weight per day), for mg/kg group (P < 0.05). No such effect was evident
females) 9 months before mating and for at 200 mg/kg. Kit mortality (birth to 4 weeks) in the LOEL: 12 mg
3 months after mating 100 and 200 mg/kg groups appeared to be increased Cu/kg body
(38% and 32% compared to 12% in controls weight per
(statistical significance not reported), and in all day
treated groups litter mass (at weaning) was
reduced (statistical significance not reported), with
some evidence of a dose-related effect. An adverse
effect of copper on lactation was suggested
Copper(II) Rats given 0 or 2600 mg/kg copper An increase in relative testis weight was seen One dose group Llewellyn
acetate acetate in the diet (approximately in treated rats. No data were presented to support only (effect et al.
Oral 45 mg Cu/kg body weight per day) this statement observed at 45 (1985)
Rats for 21 weeks followed by sacrifice. mg Cu/kg body
(Holtzman, The control diet contained 18 weight per day)
groups of mg/kg copper (roughly 1 mg Cu/kg
10 males) body weight per day). Testis
weights examined at termination
Table 12. (continued)
Species Protocol Results Effect level Reference
Rats An increasing concentration (up to There were no overt signs of toxicity in the treated Only one dose Haddad
(Wistar albino, 0.185%) of copper acetate females. In the groups that continued to normal group (effects et al.
groups of 14 administered in the drinking-water delivery or were sacrificed at 21.5 days of pregnancy, observed at (1991)
treated and 6 for 7 weeks immediately prior to the number of offspring per litter and the mean fetal 65 mg Cu/kg
or 7 control mating (up to approximately 65 mg weight were similar to the values in the control groups. body weight
females for Cu/kg body weight per day). Groups External examination and serial sectioning revealed per day)
each of the sacrificed at 11.5 or 21.5 days of no malformations. Examination of the 11.5 day old
three times pregnancy, or after delivery. (It is embryos revealed significant reductions (P < 0.005)
of sacrifice) not clear whether copper acetate in mean yolk sac diameter, crown to rump length and
exposure continued during mean somite number. In the 21.5 day old fetuses
pregnancy) there was a significant reduction in ossification in 6
of the 7 ossification centres examined, while in
newborn rats only 3 centres (cervical vertebrae,
caudal vertebrae and hindlimb phalanges) showed
a similar reduction (P < 0.025)
Copper(II) 0, 1600 mg Cu/kg as copper The authors reported hypertrophy of the uteri, ovaries One dose group Harrisson
gluconate gluconate in the diet (approximately and seminal vesicles. However, in the tabled data, it only (effects et al.
Oral 0 or 82 mg Cu/kg body weight per appears that the weight of the uterus and ovaries is observed at 82 (1954)
Rats day in males and 0 or 120 mg Cu/kg reduced in females, and that the weight of the testes mg Cu/kg body
(Sprague-Dawley, body weight per day in females) for is reduced, while that of the seminal vesicles is weight per day
40-44 weeks. (Reduced amount unaffected in males. The histopathology of these in males, 120
groups of 25 fed for the first month of the tissues was evidently unremarkable. Levels of copper mg Cu/kg body
males and experiment.) Microscopic examination in liver were nearly twice as high as in rats receiving weight per day
25 females) of a limited number of organs. an equivalent dose of copper as copper(II) sulfate in females)
Study inadequately described
Copper(II) Exposure to aerosols containing The rats exposed at 19.6 mg Cu/m3 showed overt LOEL: 2.5 mg Gabuchyan
chloride 5.2 or 41.4 mg copper chloride/m3 signs of toxicity (not further described). Both Cu/m3 (1987)
Inhalation (approximately 2.5 or 19.6 mg concentrations significantly increased the incidence
Rats (white, Cu/m3) for 4 months. Functional of dead and abnormal sperm (P < 0.05) in comparison
groups of 11 state and morphology of gonads with untreated controls. Sperm motility, testis weight
or 12 exposed assessed after 2.5 and 4 months and testosterone and oestradiol levels were all
and 12 of exposure reduced in a dose-related manner, although statistical
control significance (P < 0.05) was reached only at the
males) higher concentration. Significant reductions in the
Table 12. (continued)
Species Protocol Results Effect level Reference
levels of luteinizing hormone, follicle-stimulating
hormone and prolactin were evident at the lower
concentration (P < 0.05), but no dose-response
relationship was apparent
In a limited number of studies, oral exposure of rodents to
copper compounds during gestation induced embryo/fetotoxic effects and
(at higher doses) developmental effects. Exposure to copper(II)
sulfate induced effects on neonatal body weight, and on organ weights
and biochemistry in mice at 1.3-1.6 mg Cu/kg body weight per day,
while higher doses were embryolethal to mice (at 80 mg Cu/kg body
weight per day) and to mink (at 12 mg/kg body weight per day).
Developmental effects, including delayed ossification, were induced in
rats exposed to 65 mg Cu/kg body weight per day as copper(II) acetate,
and terata were induced in mice at 159 mg Cu/kg body weight per day as
copper(II) sulfate.
7.6 Mutagenicity and related end-points
7.6.1 Copper sulfate
7.6.1.1 In vitro
The genotoxicity of most copper compounds has not been
extensively studied.
Copper (II) sulfate, when studied in strains T98, T100 and TA102
of Salmonella typhimurium with and without metabolic activity, even
at cytotoxic concentrations or the limit of solubility, did not
exhibit mutagenic activity (Moriya et al., 1983; Marzin & Phi, 1985).
A similar lack of activity was reported, at up to cytotoxic
concentrations, in the absence of a metabolic activation system in the
SOS Chromotest with Escherichia coli PQ37 (Olivier & Marzin, 1987),
in a test for reversion to streptomycin independence in E. coli
Sd4-73 (Iyer & Szybalski, 1958), in the rec-assay with
Bacillus subtilis H17 and M45 (Matsui, 1980) and in tests for
penicillin and/or streptomycin resistance in Micrococcus aureus
FDA209 (Clark, 1953).
When rat hepatocytes were incubated for 20 h with 7.9, 15.7, 31.4
or 78.5 µmol/litre copper(II) sulfate solution (the highest
concentration being moderately cytotoxic), there was a significant
increase in unscheduled DNA synthesis at each concentration in a
roughly dose-related manner. Copper was shown to have accumulated in
the nucleus at these dose levels (Denizeau & Marion, 1989).
7.6.1.2 In vivo
A single intraperitoneal injection of copper(II) sulfate
pentahydrate in mice induced a dose-related increase in the incidence
of chromatid type chromosome aberrations in the bone marrow 6 h after
dosing between 0.28 and 1.7 mg Cu/kg body weight (Agarwal et al.,
1990). Only at the highest dose tested (1.7 mg Cu/kg body weight)
were chromosomal breaks enhanced significantly. In the micronucleus
test no evidence of genotoxic activity was found in mice given a
single injection of copper(II) sulfate pentahydrate at 1.7, 3.4 and
5.1 mg Cu/kg body weight (Tinwell & Ashby, 1990). Bhunya & Pati (1987)
reported a significant dose-related increase in the incidence of
micronuclei after two injections at doses between 1.3 and 5 mg Cu/kg
body weight per injection; however, this study did not utilize a
positive control and is thus difficult to interpret.
7.6.2 Other copper compounds
7.6.2.1 In vitro
Copper(II) chloride also showed no evidence of mutagenic activity
in Salmonella typhimurium strains TA98, TA102, TA1535 and TA1537 in
the presence or absence of a metabolic activation system when studied
at concentrations up to those causing cytotoxicity (Wong, 1988). It
was similarly inactive in the rec-assay with Bacillus subtilis H17
and M45, as was copper(I) chloride (Nishioka, 1975; Kanematsu et al.,
1980).
Copper(II) 8-hydroxyquinoline showed evidence of weak mutagenic
activity in one strain (TA100) of S. typhimurium in the presence,
but not in the absence, of a metabolic activation system. No activity
was evident in four other Salmonella strains, nor in
Escherichia coli WP2 hcr, in either the presence or the absence of a
metabolizing system (Moriya et al., 1983). An earlier study reported
negative results in strains TA98, TA100, TA1535 and TA1537, with or
without metabolic activation, but the maximum concentration tested was
very low (Räsänen et al., 1977).
In Chinese hamster V79 cells, copper(II) nitrate produced
dose-related increases in the mutation frequency (resistance to
8-azaguanine) at 0.01 and 0.1 mmol/litre and in the frequency of
sister chromatid exchanges at 0.01-0.5 mmol/litre (Sideris et al.,
1988). The investigators reported an increase in the molecular weight
of DNA isolated from the cells, which was attributed to binding of the
copper ions to the DNA.
7.7 Other studies
7.7.1 Neurotoxicity
There are few studies of the neurological effects of copper
compounds. In rats, oral exposure to copper(II) sulfate in two
studies did not affect the results of behavioural tests, but did alter
brain neurochemistry. Injection of copper(II) chloride altered levels
of neurotransmitters in the brain of rats.
7.7.1.1 Copper sulfate
Dietary administration of 250 mg/kg Cu (as copper(II) sulfate
pentahydrate) to groups of six male rats for 30 days, providing 5 mg
Cu/rat per day (equivalent to about 20 mg Cu/kg body weight per day)
did not affect their locomotor activity, learning ability or
relearning capacity and memory (Murthy et al., 1981). Analysis of
biogenic amines in the brain revealed a significant increase in
dopamine and norepinephrine (noradrenaline) levels (P < 0.02).
In another study using rats loaded with copper through
administration of 0.125% copper(II) sulfate in the drinking-water for
11 months (equivalent to about 46 mg Cu/kg body weight per day), there
were no overt effects on the behaviour of the eight treated females
(de Vries et al., 1986). Neurological effects in the brain included a
disturbance in striatal dopamine metabolism (reduced levels of the
dopamine metabolite, 3,4-dihydroxyphenylacetic acid), a three-fold
increase in the affinity of D2-dopamine receptors and a 50% reduction
in the number of these receptors. Brain levels of dopamine and
noradrenaline, and that of the noradrenaline metabolite,
3,4-dihydroxyphenylethylene glycol, were unaffected in copper-loaded
animals (de Vries et al., 1986).
7.7.1.2 Copper chloride
Daily intraperitoneal injections of copper(II) chloride to 12
male rats at a dose of 2 mg Cu/kg body weight per day for 21 days
resulted in significant increases in dopamine and norepinephrine
(noradrenaline) levels in the brain (P < 0.05), while the level of
5-hydroxytryptamine in the brain was similar to that in saline-treated
controls (Malhotra et al., 1982).
7.7.2 Immunotoxicity
Only copper(II) sulfate has been tested for its immunomodulatory
effect. In studies summarized in this section, oral exposure of mice
to this compound affected measures of both humoral and cell-mediated
immune function, while inhalation adversely affected host resistance
and pulmonary macrophage activity.
7.7.2.1 Copper(II) sulfate
The administration of copper(II) sulfate in the drinking-water of
mice at 50, 100 and 200 mg Cu/litre for up to 10 weeks resulted in the
dose-related inhibition of a number of immune system parameters in two
studies. (These levels would normally be equivalent to 10, 20 or 40
mg Cu/kg body weight per day, but water consumption decreased with
increasing copper concentrations. It was reported that total copper
intake increased with increasing level, though no further detail was
provided.) At 50 mg Cu/litre, the lymphoproliferative response to
lipopolysaccharide from E. coli was depressed, while the production
of autoantibodies against bromelain-treated mouse red blood cells was
increased (Pocino et al., 1991). These parameters were also affected
at 100 and 200 mg Cu/litre, along with decreased lymphoproliferative
response to concanavalin A, and decreased antibody response and
delayed-type hypersensitivity response to sheep erythrocytes (Pocino
et al., 1990, 1991). A NOEL could not be established in these two
studies.
In an inhalation study in mice, single or repeated 3 h exposures
to copper(II) sulfate aerosol resulted in significant
immunosuppressive effects, including reduced bactericidal activity of
the alveolar macrophages to Klebsiella pneumoniae and reduced
resistance to infection by Streptococcus zooepidemicus. These
effects were evident after a single exposure at 0.28 mg Cu/m3 and
above and after 5 or 10 daily exposures at 0.06-0.07 mg Cu/m3. A
NOEL was not established in these studies (Drummond et al., 1986).
In hamsters, a single 4 h exposure to copper(II) sulfate
pentahydrate aerosol at 0.3-7.1 mg Cu/m3 resulted in reduced
pulmonary macrophage activity and volume from 3.2 mg Cu/m3 within 1 h
after exposure; no effect was observed at 0.3 mg Cu/m3 (Skornik &
Brain, 1983).
7.8 Biochemical mechanisms of toxicity
The mechanism(s) by which copper may lead to cell injury are
discussed in section 6.
8. EFFECTS ON HUMANS
8.1 General population: copper deficiency and toxicity
Copper is an essential element. Most tissues therefore have
measurable amounts of copper associated with them and, in general,
cells, tissues and organisms have mechanisms to maintain its
availability while limiting its toxicity (homoeostasis).
In most situations, if we explore the indices of function
affected by copper excess or deficit we will find altered indicators
prior to the onset of clinical signs or symptoms. In some situations
we can use the functional indicators instead of clinical signs, since
they are closely associated. The least significant manifestations in
terms of human health are the physiological changes that occur in
response to high or low copper intakes. Most of the changes observed
in these situations represent adaptive or homoeostatic mechanisms to
prevent deficit in response to low intake or prevent toxicity in
response to high intake.
8.2 Copper deficiency
Characteristic clinical features of copper deficiencies in
infants are anaemia refractory to iron, and low copper plasma levels
(Sturgeon & Brubaker, 1956). Copper deficiency has been considered the
likely cause of the anaemia, but it was not until the completion of a
series of controlled case studies of copper deficit in infants
recovering from malnutrition (Cordano et al., 1964) that the full
spectrum of copper deficiency was demonstrated. Subsequent reports
during the 1970s of acquired copper deficiency in low-birth-weight
neonates and in infants and children receiving copper-free total
parenteral nutrition, clarified the indispensable nature of copper as
an essential nutrient for humans (Widdowson et al., 1974; Shaw, 1992).
8.2.1 Clinical manifestations of copper deficiency
Clinically evident copper deficiency occurs relatively
infrequently in humans. The most consistent clinical manifestations of
copper deficiency are anaemia, neutropenia and bone abnormalities
including fractures. The haematological changes are characterized by
the existence of a hypochromic, normocytic or macrocytic anaemia,
accompanied by a reduced reticulocyte count, hypoferraemia,
neutropenia and thrombocytopenia. In a small proportion of cases there
is microcytic anaemia (Williams, 1983). Bone marrow cytological
examination reveals megaloblastic changes and vacuolization of the
erythroid and myeloid progenitors. There is also an arrest of the
maturation of myeloid precursors and the appearance of ringed
fibroblasts. These alterations are unresponsive to iron therapy but
are readily corrected by copper supplementation (Schubert & Lahey,
1959; Prohaska et al., 1985). The current prevailing view is that
anaemia in copper deficiency is due to defective iron mobilization
resulting from reduced ceruloplasmin (ferroxidase l) activity.
A summary of some reports of clinical manifestations of copper
deficiency in humans is given in Table 13. As seen clearly from the
table, many of the reports of deficiency originate in infants and
young children, particularly those with low birth weight or
malnourished after birth. Healthy infants receiving less than 0.1 mg
Cu/kg body weight per day are at risk of deficit. For those with low
birth weight or affected by protein energy malnutrition the figure is
close to 0.2 mg/kg per day. These latter conditions affect a sizeable
proportion of children at a global level. It has been estimated that
about 16% of live births or some 20 million infants per year are of
low birth weight (< 2500 g) (WHO, 1990). The presence of bone
abnormalities is very common in copper deficiency in low-birth-weight
infants and in young children (Heller et al., 1978; Danks, 1988; Shaw,
1992). These abnormalities, which mimic the changes observed in
scurvy, include osteoporosis, fractures of the long bones and ribs,
epiphyseal separation, fraying and cupping of the metaphyses with spur
formation, and subperiosteal new bone formation (Danks, 1988; Shaw,
1992). Less frequent manifestations of copper deficiency are
hypopigmentation of the hair and hypotonia (Danks, 1988; Shaw, 1992),
impaired growth (Castillo-Duran & Uauy, 1988), increased incidence of
infections (Castillo-Duran et al., 1983), and alterations of
phagocytic capacity of the neutrophils (Heresi et al., 1985). In
addition, abnormalities of cholesterol and glucose metabolism have
been reported, but are not so well established (Klevay et al., 1984,
1986; Reiser et al., 1987). Prevalence of cardiovascular disease has
been linked to high zinc and low copper in the diet but this
hypothesis has not been validated (Lukaski et al., 1988).
It has been shown that copper deficiency is associated with
increased incidence of infection and impaired weight gain in infants
recovering from malnutrition (Castillo-Duran et al., 1983;
Castillo-Duran & Uauy, 1988). The initial randomized controlled trial
included 27 infants recovering from protein energy malnutrition: 13
received 80 µg/kg per day of copper supplement for 3 months while 14
matched infants received a placebo. Plasma copper and ceruloplasmin
dropped in the placebo group, 30% of whom had low copper plasma
levels, while values rose in the supplemented group during the rapid
growth phase of recovery. The mean number of upper respiratory
infections, febrile days, and number of febrile episodes per child per
month were similar in both groups. However, seven infants presented
clinical evidence of severe lower respiratory infection (mainly
pneumonia) in the placebo group versus only one subject in the copper
supplemented group ( P < 0.025) (Castillo-Duran et al., 1983). In a
separate case control study, 11 infants identified as
copper-deficient, based on low plasma copper and low ceruloplasmin,
and 10 matched copper-sufficient infants at a similar stage of their
nutritional recovery, were supplemented with 80 µg Cu/kg, as copper
sulfate, daily for 30 days. The daily weight gain and daily energy
intake were significantly higher relative to controls in the
copper-deficient group shortly after supplementation (Castillo-Duran &
Uauy, 1988).
Table 13. Clinical copper deficiency
Subjects Study and results Reference
11 copper-deficient In a prospective case control, growth was evaluated 1 month before and 1 month after copper Castillo
infants (plasma supplementation with 80 mg/kg body weight. Weight/age and weight/length indices increased -Duran et
copper < 70 µg/litre significantly after supplementation in the copper-deficient group. Daily energy intake was al. (1988)
and ceruloplasmin significantly higher in the copper-deficient group after supplementation than it was in the control
< 200 mg/litre) and group. Daily weight gain after supplementation increased significantly in the copper-deficient group
10 control infants and the value for daily weight gain after supplementation was significantly higher than that of the
control group for the equivalent amount of time
24 males aged The subjects received diets low in copper (1.03 mg/day per 2850 kcal [12 MJ]) and containing either Reiser
21-57 years 20% of the calories as fructose or cornstarch. During the course of feeding the diets for 11 weeks, et al.
four of the subjects exhibited heart-related abnormalities and were removed from the study (1985)
(1 myocardial infarction, 2 severe tachycardia and 1 a type II second-degree heart block). There
were no changes in serum copper and ceruloplasmin. However, fructose ingestion significantly
reduced erythrocytic SOD. Repletion of the subjects with 3 mg Cu/day for 3 weeks significantly
increased SOD levels in subjects previously fed fructose but not starch. These results suggest that
the type of dietary carbohydrate fed can differentially affect indices of copper status in humans.
Copper deficiency could play a role in human heart disease
24 males aged The subjects were fed an experimental diet inadequate in copper (0.36 mg/day per 1000 kcal Reiser
21-57 years [4.18 MJ]) for 11 weeks showed significant increase in LDL cholesterol and significant decrease et al.
in HDL cholesterol when compared to either their pretest self-selected diets (0.57 mg Cu/day per (1987)
1000 kcal) or a repletion diet (1.41 mg Cu/day per 1000 kcal [4.18 MJ])
8 men aged The subjects were fed diets low in copper (0.89 ± 0.10 mg/day), for periods ranging from 105 to Milne
18-36 years 120 days. One man who was in a negative balance showed a significantly reduction in plasma et al.
copper, immunoreactive ceruloplasmin and erythrocyte SOD. Serum cholesterol was (1990)
significantly elevated by the end of the 15 week depletion. Another two men presented a slightly
negative balance and a trend to lower plasma copper and SOD. Two of four subjects tested
had impaired glucose clearance during depletion. Conclusion: intakes of below 0.9 mg/day
apparently result in signs of copper depletion in healthy adults
Table 13. (continued)
Subjects Study and results Reference
11 men aged The effects of low-copper diets on indexes of immune response were examined in 11 subjects Kelley
21-32 years during a 90 day metabolic study. Daily copper intake for the first 24 days, the next 42 days and the et al.
last 24 days of the study was 0.66, 0.38 and 2.49 mg, respectively. Feeding the diet with (1995)
0.38 mg/day was associated with a significant decrease in the proliferation of peripheral blood
mononuclear cells cultured with phytohemagglutinin, concavalin A, or pokeweed, and an increase
in the percentage of circulating B cells (CD 19+)
3 month old infant An infant with a birth weight of 1140 g fed an infant formula low in copper developed low plasma Al-Rashid
copper and ceruloplasmin, anaemia, neutropenia, apnea, metaphyseal flaring and cupping. & Spangler
These changes were reversed after copper supplementation (1971)
6 month old infant An infant with a birthweight of 1140 g fed exclusively with cow's milk presented hypocupraemia, Ashkenazi
low ceruloplasmin, sideroblastic anaemia, neutropenia, osteoporosis with blurring and cupping et al.
of the metaphyses, depigmentation of skin, enlarged and distended blood vessels of the scalp, (1973)
and hypotonia. Treatment with 3 mg Cu/day reversed these abnormalities
7 month old infant An infant receiving total parenteral nutrition (TPN) from birth to 7 months showed osteoporosis Heller
and soft tissue calcifications. Plasma copper and ceruloplasmin levels were markedly reduced. et al.
The infant died and postmortem examination showed a reduced liver copper content. (1978)
A 10 month preterm infant required TPN during the first 4 months of life because of bowel
resection at age 10 days presented hypocupraemia, anaemia, neutropenia, osteoporosis,
irregularity of the metaphyses and subperiosteal new bone formation. These changes were
reversed by the feeding of a formula containing 1 mg Cu/litre
7 month old infant A preterm infant (birth weight 2050 g) fed only powdered milk who presented a persistent Tanaka
diarrhoea, developed hypocupraemia, neutropenia, and severe anaemia. Bone radiography showed et al.
generalized osteoporosis, flaring and cupping of the metaphyses of the long bones and a fracture (1980)
of the right fibula. All these abnormalities were alleviated after treatment with copper sulfate
Two 6 month old One infant fed only cow's milk since birth presented decreased serum copper and ceruloplasmin, Levy
infants microcytic anaemia and neutropenia. Another infant fed a diet predominantly mainly of cow's milk, et al.
presented reduced concentration of serum copper and ceruloplasmin, and microcytic anaemia. (1985)
A radiological study showed increased density of the preparatory calcification areas with spur
formation at the proximal parts of the femurs. In both cases the abnormalities were recovered
after the addition of chicken, meat and vegetables
Table 13. (continued)
Subjects Study and results Reference
30 year old woman Following extensive bowel resection, a woman received parenteral nutrition not supplemented Zidar
with copper. The patient developed hypocupraemia, subnormal ceruloplasmin levels, anaemia et al.
and severe neutropenia. Following supplementation of the parenteral solution with 4 mg Cu/day (1977)
an increase in reticulocyte count, haemoglobin and neutrophils was observed
Copper deficiency is associated with altered immunity in humans
(Prohaska & Failla, 1993). Heresi et al. (1985) studied 19
hypocupraemic infants before and after 1 month of copper
supplementation. The phagocytic activity of polymorphonuclear
leukocytes increased by 30% after copper supplementation while
immunoglobulins remained unchanged. Kelley et al. (1995) described a
decrease in the proliferation of peripheral blood mononuclear cells
cultured with different mitogens in 11 men receiving a low-copper
diet.
An increased concentration of total cholesterol and low density
lipoprotein (LDL) cholesterol and a reduction of high density
lipoprotein (HDL) cholesterol concentration have been observed in
subjects fed an experimental diet low in copper (Klevay et al., 1984).
Low copper intake has also been demonstrated to diminish glucose
tolerance (Klevay et al., 1986), alter cardiac rhythm and
electrocardiogram, and modify the hypertensive response to a hand-grip
test (Lukaski et al., 1988). However, other studies have not validated
the results of changes in cholesterol and glucose metabolism.
The role of copper deficit in altered neurodevelopment has been
postulated on the basis of the high copper content of the brain,
especially of the basal ganglia. The existence of a prenatal critical
phase in central nervous system (CNS) development during which copper
deficiency can cause CNS damage has been suggested (Danks, 1988). This
could explain the severe mental deficiency associated to prenatal
tissue deficit found in Menkes disease while postnatally acquired
nutritional copper deficiency is not accompanied by neurological
abnormalities.
8.2.2 Biological indicators of copper deficiency: balance studies
The determination of the levels of copper intake which will
prevent deficiency without resulting in toxicity (homoeostasis) has
been discussed fully in section 6.3. Several of the most promising
biological indicators for copper deficiency as well as toxicity, for
example, cytochrome c oxidase, levels of LDL, ceruloplasmin and serum
copper are also discussed in section 6.3.
In view of the importance of this subject for the determination
of human health risks (deficit and excess) from exposure to copper, it
is repeated here for emphasis.
8.3 Toxicity of copper in humans
8.3.1 Single exposure
Acute toxicity due to ingestion of copper is infrequent in humans
and is usually a consequence of the contamination of beverages
(including drinking-water) or from accidental or deliberate ingestion
of high quantities of copper salts.
Numerous case reports of single oral exposures to high levels of
copper have been reported. Such exposures, including suicide attempts
with copper sulfate, have occurred in youths and adults at doses
ranging from 0.4 to 100 g Cu (Chuttani et al., 1965; Mittal, 1972;
Stein et al., 1976; Walsh et al., 1977; Chugh et al., 1977; Williams,
1982; Jantsch et al., 1985). Symptoms including vomiting, lethargy,
acute haemolytic anaemia, renal and liver damage, neurotoxicity,
increased blood pressure and respiratory rates. In some cases, coma
and death followed. There are also a number of reports of high dose
copper ingestion in beverages (35-200 mg/litre; Hopper & Adams 1958;
Semple et al., 1960).
8.3.2 Repeated oral exposures
8.3.2.1 Gastrointestinal and hepatic effects
In case reports and cross-section studies, consumption of
drinking-water contaminated with copper has been associated with
nausea, abdominal pain, vomiting and diarrhoea (Table 14). In none of
these studies have the doses of copper ingested been well
characterized. In addition, microbiological quality of the water
supplies or other contributing factors were not assessed. Also,
symptoms may have been over-reported owing to lack of blinding of
subjects.
An often cited report is that of Wyllie (1957) in which acute
gastrointestinal symptoms were reported in 10 people consuming a
cocktail contaminated with copper from the cocktail shaker. Owing to
limitations in reporting and confounding, this study is considered
inadequate to serve as a basis for characterization of concentrations
of copper which results in adverse health effects.
In a family in Vermont, USA, living at the end of a copper main,
there were recurrent episodes of gastrointestinal illness. There were
no symptoms in two other families of similar age and sex distribution
on the same street exposed to lower levels (Spitalny et al., 1984).
Symptoms ceased with a change of water source.
Knobeloch et al. (1994) reported on five investigations of
gastrointestinal upset associated with ingestion of
copper-contaminated water. Data were obtained from questionnaires on
age, weight, water use habits, duration of exposure and symptoms.
There was generally a higher incidence of intermittent or constant
symptoms of diarrhoea, abdominal cramps or nausea in those who
consumed first-draw water, in infants and young children and among
residents of newly constructed or renovated houses. In one study,
gastrointestinal symptoms occurred in 8 of 14 people ingesting 0.6-3.8
mg Cu/day from drinking-fountains (1.6-7.7 mg Cu/litre) compared with
3/26 people ingesting < 0.55 mg Cu/day from drinking-water.
Table 14. Gastrointestinal effects associated with copper in potable water or beverages
Observations Comments Reference
10 of 13 nurses experienced nausea, vomiting, diarrhoea, weakness, abdominal owing to limitations in reporting Wyllie
cramps and headache following ingestion of an alcohol lemon cocktail from and confounding (alcohol, fasted (1957)
cocktail shakers containing copper; reconstruction of the episode suggested state); unknown whether 5.3 mg
that copper ingestion varied between 5.3 and 32 mg is a LOAEL or NOAEL; study
considered inadequate to establish
effect levels
In three of four family members residing in Vermont at the end of a copper main, well-conducted study that provides Spitalny
there were recurrent episodes over 1.5 years of gastrointestinal illness 5-20 min useful information on levels of et al.
after drinking tap water in the morning (median level of copper in incoming copper in water which induce (1984)
water, 3.1 mg/litre; single maximum level 7.8 mg/litre); no symptoms in two acute effects
other families of similar age and sex distribution on the same street exposed to
lower levels (medians, 1.58 and 0.02 mg/litre); copper levels in hair significantly
higher in symptomatic family; symptoms ceased with change of water source
Three children (1-2.5 years old) with prolonged diarrhoea and weight loss limited usefulness for risk Stenhammar
exposed to tap water containing 0.22-1 mg/litre. Symptoms disappeared when assessment (1979)
water replaced with that of lower copper content
Association between the copper content in drinking water (0.35-6.5 mg/litre viral or other microbiological Berg &
in first-draw water) at 7 new Swedish kindergartens and diarrhoea in attending causes of diarrhoea were not Lundh
children < 3 years old. The symptoms disappeared when the children went studied. Limited usefulness for (1981)
home for a few days but reappeared when they returned to the kindergarten risk assessment
Five different case reports of gastrointestinal illness in individuals, families or data inadequate to establish Knobeloch
residents completing questionnaires. Higher incidence of gastrointestinal effects effect levels et al.
with first-draw water compared with flushed water (1994)
Micronodular cirrhosis and acute liver failure was described in a
case report (O'Donohue et al., 1993). A 26-year-old male consumed
copper tablets at 30 mg/day (tablet formulation unspecified) for 2
years, followed by 60 mg/day for an unspecified period, before
presenting with symptoms of liver failure. The patient had
Kayser-Fleisher rings; laboratory investigations revealed normal serum
copper (22.6 mmol/litre) and serum ceruloplasmin (0.27 mmol/litre) but
very high urinary excretion of copper (207 mmol/24 h) compared to the
normal (< 1.2 µmol/24 h). An emergency liver transplant was
performed and the patient made a good recovery. The mean copper
content of the removed liver was 3230 µg/g (normal 20-50 µg/g).
Histology resembled that of Indian childhood cirrhosis and Wilson
disease (see section 8.4).
8.3.2.2 Reproduction and development
After adjusting for confounding variables, there was no
association between the risk of spontaneous abortion in a population
of Massachusetts women exposed to copper in drinking-water (> 1
mg/litre) during 1976-1978 (Aschengrau et al., 1989). In a small
study of trace element status, there was a significant positive
relationship between placental copper and birth weight, and a negative
correlation between the copper/zinc ratio and birth weight (Mbofung &
Subbarau, 1990). These data are inadequate to assess the
reproductive/developmental effects of copper in humans.
8.3.2.3 Cancer
Epidemiological studies in which the association between copper
intake and/or levels of copper in serum and cancer has been
investigated are presented in Table 15.
In geographical/ecological studies in China (Chen et al., 1992)
and the USA (Schrauzer et al., 1977), associations between serum
copper or copper intake and some cancers were reported. However, owing
to the lack of consideration of individual exposure and confounding
factors in such studies, they contribute little to assessment of the
weight of evidence for carcinogenicity.
Interpretation of the available analytical epidemiological
(case-control or cohort) studies is complicated by the fact that
increased serum concentrations of copper could be related to
alterations in copper handling resulting from the disease state.
Available analytical epidemiological studies in which concentrations
of copper in serum were determined only following diagnosis of cancer
(Çetinkaya et al., 1988; Cavallo et al., 1991; Prasad et al., 1992;
Dabek et al., 1992) are uninformative, therefore, with respect to the
possible aetiological role of cancer in the disease. In prospective
studies where concentrations of copper in serum have been determined
prior to disease development, associations between serum copper levels
generally greater than 1.25 mg/litre and either total or breast cancer
have been observed, though there is no convincing evidence of a
Table 15. Epidemiological studies on cancer in the general population
Study protocol Results Comments Reference
A nested, matched case-control study The mean serum copper level in the When adjusted for other Coates
was conducted to compare the serum control group was 115 ± 36 µg/dl, factors which might influence et al.
copper levels of 133 cancer cases whereas the case group mean was both the serum copper levels (1989)
identified between 1974 and 1984 123 ± 37 µg/dl. The groups were split and the risk of all cancer
among 5000 members of a North into quartiles with copper serum levels sites combined (i.e.
West Washington State employee corresponding to 43-92, 93-107, occupational status, family
cohort, with 241 controls selected at 108-125 and 126-276 µg/dl. The history of cancer, cigarette
random from the same initial cohort. relative risk estimates of cancer, all smoking, alcohol consumption
Cases and controls were matched for sites combined, by quartile levels of and use of exogenous
age (in 5-year groupings), sex, race serum copper, increased steadily, with oestrogens), the relative risk
(white/nonwhite) and year and season that in the upper quartile reaching estimates did not differ
of blood sampling. 48% of the study statistical significance (RR=1.0, 1.1, 1.3 appreciably from the
population was male and 97% was and 2.4 for the quartiles and 95% unadjusted risk estimates
white. Blood had been collected in the CI=0.6-2.2, 0.7-2.7 and 1.1-5.1 for
initial study in 1972-1974 (before the 2nd-4th quartiles, respectively)
diagnosis)
A case-control study of 35 There was no difference in the serum Numbers in the individual Prasad
early-diagnosed oesophageal cancer copper levels of the cases compared tertiles were small; limited et al.
patients who had not received treatment with the controls (1.29 ± 0.03 and control for confounders; (1992)
and were attending, for the first time, 1.24 ± 0.04 mg/litre, respectively). serum analyses for copper
a cancer hospital in India. Dietary When the cohorts were analysed after diagnosis; though
habits over the preceding 6 months according to blood copper levels more cases in highest
and blood biochemical parameters corresponding to 0.75-0.99, tertile based on serum
were assessed and compared with 1.00-1.25 and > 1.25 mg/litre, copper, no difference
35 control subjects matched for age, more cases occurred in the highest between daily copper
sex, socioeconomic status, rural/urban group compared with the controls intake for cases and
residence, and chewing, smoking (20 and 13, respectively; P < 0.025). controls
and drinking habits (minimal control There was no difference between the
for confounders) daily copper intake values for cases
and controls (3.6 ± 0.64 and
3.4 ± 0.43 mg)
Table 15. (continued)
Study protocol Results Comments Reference
A 6-9 year prospective follow-up The mean levels of serum copper Kok et al.
study of an initial cohort of a Dutch were not significantly increased in (1988)
population of 10 532, aged 5 years the cancer death patients over
or more, was conducted to the end of those in the controls (1.33 mg/litre
December 1983. The serum copper compared with 1.25 mg/litre; P=0.08).
concentrations (sampled on initial For subjects in the highest serum
entry into the study) of 64 cancer quintile (> 1.43 mg/litre), the relative
death patients and 62 cardiovascular risk, adjusted for various factors,
death patients were compared with of death from cancer, was 3.7
those from randomly selected, (95% CI=1.5-9.1) compared with
sex- and age- (in 5 year intervals) the adjusted relative risk pooled
matched members of the original cohort, from quintiles 2-4 (serum copper
still alive on 31 December 1983. Each range 1.05-1.43 mg/litre). For the
case was matched with two controls. lowest serum quintile (< 1.05 mg/litre),
Cancer cases and their controls the adjusted relative risk of death
were matched for smoking status from cancer was 1.8 (95% CI=0.7-4.7)
A case-control study was conducted The mean dietary intakes of copper Results essentially negative Cavallo
on 214 patients, first diagnosed for in the control and case cohorts were but serum copper et al.
primary carcinoma of the breast and estimated to be 2.8 ± 1.1 and concentrations determined (1991)
not previously undergoing therapy, 2.7 ± 1.1 mg/day, respectively. The after admission
randomly selected among consecutive correlation between copper intake
admissions to a cancer institute in and copper blood level was examined
Milan, Italy, from May 1982 to June and was found not to be significant.
1985. Controls (N=215) were patients Both groups were split into quartiles
with a variety of diagnoses other than of dietary copper intake for
breast cancer. Dietary copper intakes comparison. No significant trend in
were estimated from dietary the OR estimates for breast cancer
questionnaires. Blood samples were were found
taken the day after admission and the
serum copper levels determined
Table 15. (continued)
Study protocol Results Comments Reference
A second set of 47 cases and 46 Mean serum copper levels were
age-matched controls from Montpellier, significantly decreased in the cases
France, which represented a when compared with the controls.
sub-sample of a larger study concerning The mean serum copper level was
diet and breast cancer, was found to be significantly higher in
investigated. Controls consisted of the cases than the controls
patients admitted, for the first time,
to neurology or neurosurgery wards.
Blood samples were taken the day after
admission and the serum copper levels
determined
When the results of the mean blood
copper levels in the two areas were
pooled, the difference between the
cases and controls was found to be
substantially less, but the mean level
was still statistically higher in controls.
When the groups were split into
quartiles of serum copper level, the
pooled ORs were not significantly
different from each other nor was there
any significant trend in values.
Adjustment for dietary zinc, which
competes in the absorption of copper,
and other elements, in particular iron,
vitamin C and raw fibre, did not allow
the correlation between copper intake
and blood level to reach significance
Table 15. (continued)
Study protocol Results Comments Reference
Serum copper and zinc levels were Mean serum copper levels increased Serum levels measured Çetinkaya
measured in 20 healthy women and from control to benign to malignant after diagnosis. No control et al.
100 women with gynaecological groups for potential confounders (1988)
tumours. 70 patients had benign and
30 had malignant genital tumours
The plasma copper The breast cancer cases were diagnosed an Adjustments were made Overvad
concentrations of a group of 46 women average of 11 years (range 1-17 years) after for possible confounding et al.
who developed breast cancer entry into the study cohort. The mean initial by known indicators of (1993)
between 1968 and 1985 were copper levels were 1.26 mg/litre in the control breast cancer, i.e. family
compared with an age-stratified group and 1.31 mg/litre in the cases (95% Cl history of breast cancer,
random sample of 138 women. for overall difference=-0.07-0.17). The groups age, age at first live birth,
Both groups were taken from an were split into quartiles corresponding to parity, weight and oral
initial cohort of 5100 ostensibly initial copper concentrations of < 1.03, contraceptive use
healthy women studied between 1.04-1.19, 1.20-1.33 and > 1.34 mg/litre,
1968 and 1975, aged 28-75 and the adjusted odds ratio for the 1.04-1.19 The authors suggest a
years and living on the island mg/litre quartile set at 1.0. The adjusted odds U-shaped risk response
of Guernsey, United Kingdom. ratios were: 1.8 (95% CI=0.6-5.4), 1.6 (95% although this is not
Plasma samples were CI=0.5-5.4) and 3.2 (95% CI=1.1-9.4) for supported by the reported
collected at the start of the the < 1.03, 1.20-1.33 and > 1.34 mg/litre results
study and on development of quartiles, respectively, with only the last
breast cancer, and the levels group reaching statistical significance
of copper analysed
Total serum copper and The serum copper concentrations did not alter The average estimated Dabek
cerulo-plasmin levels were determined significantly with time during the study year. A daily dietary copper intakes et al.
in 13 pre- and 10 significantly higher serum copper level was noted were apparently lower in (1992)
postmenopausal breast cancer patients in the premenopausal breast cancer patients the patients (1.46 mg/day)
aged 39 ± 7 and 66 ± 6 years, (mean = 18.7 ± 0.62 µmol/litre) when compared than in the normal control
respectively. The levels were with the two premenopausal control groups subjects (1.63 mg/day;
compared with those in a group (means = 16.5 ± 0.30 and 16.7 ± 0.43 µmol/litre, difference P = 0.05) and
of 14 pre- and 11 postmenopausal respectively; P < 0.03). No such difference was this could not, therefore,
omnivorous women noted in the postmenopausal patients. directly explain the results
aged 33 ± 6 and 57 ± 5 years, Postmenopausal patients showed significantly lower
Table 15. (continued)
Study protocol Results Comments Reference
respectively and with those in ceruloplasmin levels (mean = 0.309 ± 0.011 g/litre) No control for smoking
a group of 12 pre- and 11 than the corresponding control groups (means =
postmenopausal vegetarian 0.387 ± 0.013 and 0.355 ± 0.11 g/litre, The investigators concluded
women aged 34 ± 7 and respectively, P < 0.01), this being more pronounced that the high serum
59 ± 5 years, respectively who when the control groups were pooled (P < 0.001). copper/ceruloplasmin ratio
were all free of breast cancer. Again, there was no overall significant in the breast cancer patients
Fasting serum samples were change with time during the study year. may reflect disordered
collected on three consecutive The copper/ceruloplasmin ratios were higher in copper metabolism in this
days, typically four times in a year both groups of patients, these increases being disease (serum levels
significant in the premenopausal group when determined after diagnosis)
compared with the corresponding omnivorous
controls (P <0.05) and in the postmenopausal
patients when compared with both the omnivorous
(P < 0.001) and vegetarian (P < 0.01) control
groups. The ratio in the postmenopausal patients
(mean = 3.94 ± 0.096 µg/g) was significantly higher
than in the premenopausal patients (mean = 3.44 ±
0.061 µg/g; P < 0.001)
dose-response trend in this regard (Kok et al., 1988; Coates et al.,
1989; Overvad et al., 1993). Moreover, there has been no association
between intake of copper and cancer, in those few analytical
epidemiological studies in which it has been investigated (Cavallo et
al., 1991; Dabek et al., 1992; Prasad et al., 1992).
There is therefore little convincing evidence that copper plays
an aetiological role in the development of cancer in humans.
8.3.3 Dermal exposure
Sources of topical exposure to copper have come from its use in
pigments, ornaments, jewellery, dental amalgams, and IUDs, and as an
antifungal agent and an algicide. Though copper algicides are used in
the treatment of water in swimming pools and reservoirs, there are no
reports of toxicity from these applications.
Copper or copper salts may induce allergic contact dermatitis in
susceptible individuals. Signs and symptoms include itching, redness,
swelling, vesicle formation and pustulation. Patch-testing to
identify the sensitized state generally involved using covered 24-48 h
contact with 0.5-5.0% copper sulfate in water or petrolatum. Numerous
reports have been published on the allergic response to unintentional
and defined dermal exposure to copper or preparations containing
copper (Hackel et al., 1991; Nordlend & Linden, 1991; Klapheck et al.,
1994; Krolczyk et al., 1995), however, the exposure concentrations
leading to any effect are poorly characterized in most cases.
Routine patch testing of 1190 eczema patients found that only 13
(1.1%) cross-reacted to 2% copper sulfate in petrolatum. The
investigators warned of the possibility that contamination of copper
with nickel (a well-established contact allergen) might have been the
cause of the apparent reaction to copper (Karlberg et al., 1983). In
an investigation of copper and zinc status in 22 asthmatic, 21
eczematous and 19 healthy Italian children (age-matched), the
asthmatic group had higher mean values for serum and hair copper
concentrations, and the eczematous group had higher mean hair copper
concentrations, than did healthy controls. Estimated dietary copper
intakes were said to be similar for the three groups and ranged from
90 to 111% of the "safe and adequate" intakes (Di Toro et al., 1987).
8.4 Disorders of copper homoeostasis: populations at risk
Because copper is an essential metal, there are homoeostatic
mechanisms to maintain copper levels within defined limits. However,
there are a number of disorders in homoeostatic mechanisms which can
result in deficiency or toxicity from exposure to copper at levels
which are tolerated by the general population. In addition to this,
gross overexposure to copper can overwhelm the homoeostasis mechanisms
in the normal individual. The hereditary copper metabolic disorders
are Menkes disease and Wilson disease.
8.4.1 Menkes disease
Menkes disease is an X-linked recessive disorder of copper
metabolism that occurs in approximately 1 in 200 000 live births.
Clinically the condition resembles a copper deficiency state and is
characterized by skeletal abnormalities, severe mental retardation,
neurological degeneration and death in early childhood. The symptoms
of Menkes disease result from a deficiency of copper and its effects
on the function of copper-dependent enzymes.
The gene for the condition has been isolated (Chelly et al.,
1993; Mercer et al., 1993; Vulpe et al., 1993) and designated MNK.
The gene codes for a 1500-amino-acid P-type cation transporting
ATPase, with strong homology to the bacterial and yeast cation
transporting ATPases. The MNK gene also has strong homology to the
gene that is defective in Wilson disease (see section 8.4.2) (Bull et
al., 1993; Thomas et al., 1995).
Although the gene involved is widely expressed (except in liver),
and copper actually accumulates in some cells (such as fibroblasts,
kidney and placenta), the primary defect is a marked reduction in the
first phase of copper transport. Most of the copper entering mucosal
cells from the diet does not enter the portal circulation and travel
to the liver and elsewhere. As a result, in most tissues, enzymes that
depend upon copper for their functions will be inactive or have
reduced activity. This may be the reason for the diverse clinical
symptoms observed in Menkes patients. The MNK protein has structural
similarities to Mg(II), Na(I), K(I), and Ca(II) transporters from
various organisms. P-type ATPases have a conserved aspartate residue
which is phosphorylated in the course of cation transport and have
specific metal-binding sequences. The metal binding sequences are
similar to those of P-type ATPases of bacteria, characterized by a
G-M-T-C-XX-C motif. The Menkes disease and Wilson disease genes both
encode proteins with six of these metal-binding sequences in the
N-terminal half of the molecules, and multiple hydrophobic (probably
membrane spanning) sequences nearer the C-terminal. They share a 59%
amino-acid sequence identity with each other, and, respectively, share
43% and 33% identities with the bacterial transporter CopA (Solioz et
al., 1994). In Menkes disease the liver is not overtly affected,
whereas in Wilson disease the liver is the primary site of damage. The
gene for Menkes disease (also called Mc1) has been mapped to band
q13 on chromosome X (Mercer et al., 1993), and cloned, again by three
independent research groups (Mercer et al., 1993; Vulpe et al., 1993;
Chelly et al., 1993).
The primary defect appears to involve defective expression of a
transporter that transfers copper across the basolateral membrane of
intestinal mucosal cells. The transporter also may play a role in
other cells, because it is widely expressed. It seems possible that
its function might be to aid in copper efflux from cells, since Menkes
fibroblasts accumulate the metal and fail to express the MNK gene.
This may not be the case in other tissues where accumulation has not
been observed. In Menkes disease, intestinal absorption of copper, or
its transfer across the placenta to the fetus, does not totally
exclude copper from the body, since this is incompatible with life.
Some cell types in tissues such as the intestine accumulate copper
(Waldrop & Ettinger, 1990) which is subsequently lost as the
intestinal cells are sloughed. The bulk of the metal is believed to
accumulate in the Menkes-affected cell in metallothionein complexes.
The lack of copper transport across the gut is one factor in
production of a copper deficiency in most tissues. Most likely,
transporters for other metal ions can be used, at least to some
extent, for copper transfer. Nevertheless, there is a still a serious
copper deprivation in most tissues of the body, with the consequence
that copper-dependent enzymes in all areas are affected and have a
diminished function.
Lysyl oxidase has been shown to be important in cross-linking
collagen and elastin and its lack of activity may explain the
connective tissue lesions. Low levels of cytochrome c oxidase may
contribute to poor thermal regulation. Tyrosinase deficiency would be
expected to lead to hypopigmentation of the skin and hair. The pili
torti (twisted or "kinky" hair) observed in Menkes patients is related
to the cross-linking failure of keratin which is dependent on copper.
Deficiency of cytochrome c oxidase, SOD and dopamine betahydroxylase
may result in neurological degeneration, mainly by oxygen free
radicals (Bankier, 1995).
The clinical features observed in Menkes patients are a direct
result of the failure of copper to be incorporated into specific
copper-dependent enzymes (Kodama, 1993). Hence, Menkes disease mimics
a deficiency in copper. Babies with Menkes disease are often born
prematurely; and although they appear to have fine, normal-looking
hair they often have problems associated with temperature instability,
jaundice and feeding (Bankier, 1995). Many pass the developmental
milestones of head control and responsive smile, but by the age of 3
months they develop loss of head control and begin to have seizures.
They have truncal hypotonia (a condition of diminished tone of the
skeletal muscles and diminished resistance of muscles to passive
stretching) and progressive spasticity of the limbs. The hair becomes
fragile, lustreless and hypopigmented. The hair feels to the touch
like steel wool, owing to pili torti. The skin becomes hypopigmented
and hyperextensible (cutis laxa) and the joints become hypermobile
(Martin et al., 1994).
The bones are osteoporotic with flared metaphyses of the long
bones, rib fractures and possible wormian bones (small irregular bones
in the sutures between the bones of the skull) visible by cranial
radiography. In the case of severe occipital horn syndrome the main
effect is bone spurs, perhaps because of disordered connective tissue
function and neurological problems (Kaler et al., 1994). The
vasculature is tangled and elongated owing to numerous splits and
fragmentations in arterial elastic fibres and thickened intima.
Alterations in the central nervous system include severe mental
retardation, seizures and ataxia which are due to intense degenerative
changes of the brain and the cerebellum with a pronounced alterations
of the Purkinje cells (Iwata et al., 1979). Subdural and cerebral
haematoma may occur. There is progressive deterioration until death
occurs, usually by the age of 5. Urinary tract diverticulum (a pouch
or sac produced by herniation of the mucous membrane through a defect
of the lining of the urinary tract) is common.
The majority of patients with Menkes disease present with severe,
classical symptoms although individuals with milder symptoms and/or
longer survival have been observed (Haas et al., 1981; Gerdes et al.,
1988). A spectrum of mutations adversely affecting protein expression
has been observed in severely affected Menkes patients. The diseases
X-linked cutis laxa (Levinson et al., 1993; Yeowell et al., 1994),
occipital horn syndrome (Kaler et al., 1994) and milder Menkes
phenotypes result from mutations that only diminish or alter MNK
expression.
8.4.2 Wilson disease
Samuel A.K. Wilson described a disorder of the nervous system
associated with liver cirrhosis. Wilson wrote that the disease, "...is
familial, invariably fatal (and caused by) a toxin generated in
connection (with) the hepatic cirrhosis that is always found after
death" (Wilson, 1912). Following this lead in 1920, Hall concluded
that Wilson disease occurred only in individuals who inherited a
defective gene (Hall, 1921) which Bearn later showed to be recessive
(Bearn, 1960). It was not until 1948 that Cumings identified that
copper was indeed the toxin in Wilson disease, finding that the liver
and brain of patients had an extremely high content of the metal
(Cumings, 1948).
Wilson disease is the most extensively described inherited
disorder of copper metabolism. The gene is distributed worldwide,
having been demonstrated in virtually all races. Current global
estimates indicate that the incidence rate of the disease is
approximately 1 in 30 000 live births, with prevalency ranging from 15
to 30 per million. The gene frequency varies between 0.3 and 0.7%,
corresponding to a heterozygote carrier rate of slightly greater than
1 in 100.
Genetic studies from a large Israeli-Arab kindred identified a
linkage between the Wilson disease locus and the erythrocyte enzyme
esterase D, thereby establishing that the gene mutation responsible
for Wilson disease was located on chromosome 13 (Frydman et al.,
1985). Using multipoint linkage techniques, the abnormal gene for
Wilson disease was localized more specifically to 13q14-q21. In 1993,
a candidate gene for Wilson disease (WND) was reported independently
by several different groups of investigators, using slightly different
strategies for positional cloning (Bull et al., 1993; Petrukhin et
al., 1993; Tanzi et al., 1993). The WND gene consists of a
transcript of approximately 7.5 kilobases, which is expressed
primarily in liver, kidney and placenta; it has also been detected in
heart, brain, lung, muscle and pancreas, albeit at much lower levels.
The full-length cDNA sequence of the WND gene (Bull et al., 1993;
Tanzi et al., 1993) predicts a protein of 1411 amino acids which is a
member of the cation-transporting P-type ATPase subfamily, highly
homologous to the Menkes disease gene product and the
copper-transporting ATPase (CopA) found in copper-resistant strains of
Enterococcus hirae.
From sequence analysis of the cDNA, the WND protein is predicted
to possess a metal-binding domain (containing five specific binding
sites), an ATP-binding domain, a cation channel and phosphorylation
region, and a transduction domain responsible for the conversion of
the energy of ATP hydrolysis to cation transport. To date, more than
30 disease-specific mutations in the Wilson disease gene have been
identified, and it has been postulated that different mutations at
that locus may explain the clinical variability. Moreover, the
variety of mutations identified in the Wilson disease gene potentially
may affect copper transport to varying degrees, and at different
cellular sites (Schilsky, 1994). However, detailed genetic and
epidemiological studies suggest that the variability in clinical
expression observed in Wilson disease patients may not be solely a
consequence of allelic heterogeneity, since marked differences in
presentation, age of onset and disease course have been observed in
family members who have inherited two identical mutant alleles
(Walshe, 1995).
Developments in the molecular genetics of Wilson disease have
provided a means for carrier detection and early diagnosis (Sternlieb,
1993). In fact, several studies using haplotype analysis of relatives
with closely linked markers have permitted precise carrier detection
with less than 1-2% error. There also is a report of prenatal
exclusion of Wilson disease by analysis of DNA polymorphism in a
chorionic villus biopsy performed at 9 weeks gestation (Cossu et al.,
1992). Unfortunately, the use of genetic techniques in the diagnosis
of Wilson disease has significant limitations. Currently, DNA marker
studies can be performed only within families, and under circumstances
where the diagnosis has already been established definitely in at
least one family member by standard biochemical methods. The index
patient's DNA is then used as a reference to recognize the
disease-carrying chromosomes in other members of the family. However,
spontaneous chromosomal rearrangements can cause such markers to be
uninformative, thereby limiting the diagnostic reliability. These
findings indicate considerable potential difficulties for DNA-based
genetic screening, since most patients will possess alleles with two
different mutations of the Wilson disease gene (Schilsky, 1994).
Given the rapidity and accuracy of biochemical analyses in
establishing the diagnosis of Wilson disease, as well as the
aforementioned limitations of genetic testing, standard biochemical
methods should continue to be utilized in the evaluation of most
suspected cases. In addition, genetic screening of young family
members of patients afflicted with the disorder would facilitate early
diagnosis and permit initiation of therapy in the presymptomatic
state.
It is postulated that the harmful effects of excess copper are
mediated by the generation of free radicals, which deplete cellular
stores of glutathione and oxidize lipids, enzymes and cytoskeletal
proteins. Indeed, it has been shown that a number of intracellular
systems are disrupted by elevated copper concentrations, including
organellar membranes, DNA, microtubules, and various enzymes and
proteins, although the principal cellular target of copper toxicity is
unknown. In the earliest stages of hepatocellular injury,
ultrastructural abnormalities involving the endoplasmic reticulum,
mitochondria, peroxisomes and nuclei have all been identified
(Sternlieb, 1990). These changes, in conjunction with diminished
mitochondrial enzyme activities, may be important steps in the
pathophysiological events leading to lipid peroxidation and
triglyceride accumulation in the hepatocyte.
Wilson disease patients exhibit impaired biliary excretion of
copper, which is believed to be the fundamental cause of copper
overload. The prompt reversal of abnormal copper metabolism in Wilson
disease patients following orthoptic liver transplantation confirms
that the primary defect resides in the liver. It has been proposed
that the Wilson disease gene product is responsible for copper
secretion from the liver cell, either across the canalicular (apical)
membrane of the hepatocyte or into a subcellular compartment that
communicates with the bile canaliculus (Tanzi et al., 1993). The
latter is consistent with a putative lysosomal defect underlying the
diminished biliary excretion and systemic accumulation of copper
observed in patients with Wilson disease. In addition, in an animal
model of Wilson disease, the Long-Evans Cinnamon (LEC) rat, excessive
hepatic copper accumulation occurs in the setting of diminished
biliary excretion. These rodents exhibit impaired entry of copper
into the lysosomes, with normal delivery of lysosomal copper to the
bile (Schilsky et al., 1994). The LEC rat is a mutant strain of the
Long-Evans rat which spontaneously develops fulminant hepatitis at 3-4
months of age, resulting in a 40% mortality rate. Surviving animals
manifest chronic hepatic disease, low serum ceruloplasmin levels and
increased copper concentrations in the liver. Thus, the LEC rat
shares many important clinical, biochemical and histological features
with Wilson disease, and the recent availability of this animal model
will probably provide new insight into the pathogenesis of the human
disorder.
The biochemical defect which leads to the accumulation of copper
in Wilson disease is present at birth; however, clinical symptoms
rarely are observed before the age of 5 years. The initial signs of
Wilson disease are generally detected in older children, adolescents
and young adults, although case reports have documented the clinical
onset as early as 4 years. Wilson disease patients typically present
with hepatic and/or neurologic dysfunction. Less commonly, patients
present with skeletal, cardiac, ophthalmologic, endocrinologic or
dermatologic symptoms. Approximately 25% of patients have involvement
of two or more organ systems at initial evaluation, although, with the
advent of aggressive screening, there has been a significant increase
in the number of asymptomatic patients diagnosed. The clinical
manifestations of Wilson disease are summarized in Table 16.
Table 16. Clinical manifestations of Wilson disease
(hepatolenticular degeneration)
Organ system Symptoms
Hepatic cirrhosis, chronic active hepatitis, fulminant failure
Neurologic bradykinesia, rigidity, tremor, ataxia, dyskinesia,
dysarthria, seizures
Psychiatric behavioural disturbances, cognitive impairment, affective
disorders, psychosis
Ophthalmologic Kayser-Fleischer rings, sunflower cataracts
Haematologic haemolysis, coagulopathy
Renal renal tubular defects, diminished glomerular filtration,
nephrolithiasis
Cardiovascular cardiomyopathy, arrhythmias, conduction disturbances,
autonomic dysfunction
Musculoskeletal osteomalacia, osteoporosis, degenerative joint disease
Gastrointestinal cholelithiasis, pancreatitis, spontaneous bacterial
peritonitis
Endocrine amenorrhoea, spontaneous abortion, delayed puberty,
gynaecomastia
Dermatologic azure lunulae, hyperpigmentation, acanthosis nigricans
Hepatic involvement in Wilson disease tends to manifest at a
younger age (mean 8-12 years) than does neurological dysfunction, and
is nonspecific, mimicking the features of a variety of acute and
chronic liver diseases. Three major clinical patterns of liver
disease are observed: cirrhosis, chronic active hepatitis and
fulminant hepatic failure. In the early asymptomatic phase of Wilson
disease, or in the presence of inactive cirrhosis, liver tests may be
normal or only minimally elevated. In the majority of cases, hepatic
injury develops insidiously and, if untreated, pursues a chronic and
relentless course to cirrhosis. Hepatocellular carcinoma is uncommonly
associated with Wilson disease, in contrast to haemochromatosis.
An estimated 5-30% of patients with Wilson disease exhibit
clinical, biochemical and histological features similar to those
observed in chronic active hepatitis (Scott et al., 1978; Schilsky et
al., 1991). The diagnosis may be overlooked in these patients, since
a significant number, almost 50% in one series (Scott et al., 1978),
have no evidence of neurologic dysfunction or Kayser-Fleischer rings
on ophthalmologic examination. Serum ceruloplasmin levels also may be
normal in the setting of severe hepatic inflammation. It has been
estimated that Wilson disease represents the underlying aetiology in
5% of patients with idiopathic chronic active hepatitis who are under
35 years of age (Schilsky et al., 1991). A distinctive feature of
wilsonian chronic active hepatitis is the relatively modest elevations
of serum aminotransferase levels in the presence of severe
hepatocellular necrosis and inflammation.
More dramatically, Wilson disease occasionally manifests as
fulminant hepatic failure. These patients may be indistinguishable
from individuals with viral-induced hepatic necrosis, and many of the
biochemical tests used to establish the diagnosis of Wilson disease
are abnormal in patients with other forms of fulminant hepatic failure
(McCullough et al., 1983). The clinical features most suggestive of
fulminant wilsonian hepatitis include the presence of intravascular
haemolysis, splenomegaly, and Kayser-Fleischer rings. Biochemical
markers indicative of Wilson disease include relatively mild
elevations in serum transaminases despite massive hepatic necrosis,
hyperbilirubinaemia with normal or low alkaline phosphatase levels,
and a markedly elevated serum copper concentration. The serum level
of aspartate aminotransferase (ASAT) typically is higher than that of
alanine aminotransferase (ALAT), as a result of the associated
haemolysis. Although uncommonly observed in wilsonian fulminant
hepatic failure, Kayser-Fleischer rings are not pathognomonic, since
they are occasionally seen in patients with other cholestatic hepatic
disease. Liver biopsy with measurement of quantitative copper may be
helpful, although deranged clotting function may preclude this
procedure, or necessitate the transjugular approach. If a biopsy
specimen is obtained, histological evidence of cirrhosis
(predominantly micronodular) in a young patient with fulminant
hepatitis is suggestive of Wilson disease, as is an elevated hepatic
copper content. Wilson disease patients with acute hepatic failure
tend to be young and to have a fulminant clinical course, with
survival generally no longer than days to weeks unless liver
transplantation is performed. Even when transplantation is
unavailable for patients, it remains imperative to make the diagnosis
of Wilson disease for the purpose of aggressive medical therapy and
family screening.
The simplest screening procedure includes a slit-lamp examination
of the eyes, and measurement of serum ceruloplasmin and transaminase
(ALAT, ASAT) levels. If Kayser-Fleischer rings are present on
ophthalmologic examination and ceruloplasmin levels are below 200
mg/litre in a patient with neurologic signs or symptoms, the diagnosis
of Wilson disease is established. If a patient is asymptomatic,
exhibits isolated liver disease, or lacks corneal rings, the
coexistence of a hepatic copper concentration above 250 µg/g (dry
weight) and a low serum ceruloplasmin level also is sufficient to make
the diagnosis.
The normal serum concentration of ceruloplasmin is 200-400
mg/litre. Although a decreased ceruloplasmin level per se is not
diagnostic of Wilson disease, approximately 90% of all patients, and
85% of individuals presenting with hepatic manifestations of the
disease, have levels that are below the normal range.
The 10% of heterozygous carriers of the gene for Wilson disease
who manifest diminished serum levels of ceruloplasmin, yet never
develop clinical symptoms or signs of the disease, may cause
diagnostic confusion. These individuals, who represent approximately
1 in 2000 of the general population, may present a difficult
diagnostic dilemma if they fortuitously develop chronic active
hepatitis or cirrhosis (of another aetiology), thereby mimicking the
clinical, biochemical and histological features of Wilson disease.
Normal ceruloplasmin concentrations are found in up to 15% of patients
with Wilson disease and active liver involvement (Scott et al., 1978).
The urinary excretion of copper is greater than 100 µg/24 h
(normal < 40 µg/24 h) in most patients with symptomatic Wilson
disease, reflecting increased serum levels of the readily filterable
fraction of nonceruloplasmin copper.
If Kayser-Fleischer rings or neurological abnormalities are
absent, a liver biopsy for quantitative copper determination is
essential to establish the diagnosis of Wilson disease. Care must be
taken to ensure that the biopsy needle and specimen container are free
from copper contamination. The normal hepatic copper concentration
varies from 15 to 55 µg/g (0.24-0.87 µmol/g) dry liver. Virtually all
untreated patients with Wilson disease have elevated hepatic copper
levels, ranging from 250 to as high as 3000 µg/g dry liver. Values
below 250 µg/g are usually attributable to the irregular distribution
of copper in the liver, particularly in the presence of cirrhosis,
when small fragmented biopsy samples are obtained. The finding of a
normal hepatic copper concentration effectively excludes the diagnosis
of untreated Wilson disease. However, an elevated liver copper level
alone is insufficient to establish the diagnosis of Wilson disease,
since concentrations above 250 µg/g may be found in other chronic
hepatic disorders (most cholestatic conditions). In the great
majority of individuals with prolonged cholestasis, serum
ceruloplasmin concentrations are either normal or increased. The
histochemical staining of liver biopsy specimens for copper is of
little diagnostic value in patients with Wilson disease.
8.4.3 Hereditary aceruloplasminaemia
Although no defect in copper metabolism has been identified in
cases of aceruloplasminaemia, this condition is included here because
ceruloplasmin is a genetically regulated, copper-binding protein with
a role in iron metabolism (Harris & Gitlin, 1996) (see chapter 6).
Recent evidence indicates that genetic abnormalities of
ceruloplasmin synthesis occur as an autosomal recessive condition
(Logan et al., 1994). Clinical signs and symptoms in these patients
include mental confusion, memory loss, dementia, cerebellar ataxia,
altered motor function, retinal degeneration and diabetes (Miyajima et
al., 1987; Logan et al., 1994; Harris, 1995; Morita et al., 1995).
Biochemical signs are decreased serum copper levels and absent or
nonfunctional ceruloplasmin in plasma and impaired copper absorption
(Harris, 1995). Isotopic tracer studies demonstrate enhanced copper
incorporation into liver with limited release into plasma since
ceruloplasmin synthesis is absent, yet copper delivery to tissues is
preserved (Miyajima et al., 1987; Harris, 1995). In fact, copper
homoeostasis appears to be minimally affected while striking
abnormalities in iron metabolism are found.
There is a significant decrease in serum iron, normal
iron-binding capacity, markedly elevated serum ferritin and low
urinary iron excretion. Iron deposition in liver, brain, pancreas and
other tissues is markedly increased. The alterations in iron
homoeostasis are correctable by the intravenous administration of
ceruloplasmin (Ragan et al., 1969). On the basis of this evidence the
clinical symptoms are most like the result of iron overload in brain,
pancreas and other critical organs, rather than induced by a copper
deficit.
8.4.4 Indian childhood cirrhosis
Indian childhood cirrhosis (ICC) was once a major cause of infant
mortality on the Indian subcontinent (Kumar, 1984). The peculiar
epidemiological, clinical and histopathological features, the
enigmatic aetiology and the uniformly fatal outcome have baffled many
for over a century now (Achar et al., 1960; Chawla et al., 1973;
Bhagwat & Walia, 1980; Sethi et al., 1993).
Epidemiologically, the illness normally strikes between the ages
of 6 months and 3 years (Bhave et al., 1992) although it can occur up
to 5 years of age (Nayak & Ramalingaswamy, 1975). There is a male
predominance and high rates of parental consanguinity, and up to 22%
of siblings are affected.
Clinically, the onset is generally insidious (86%). In the early
stage of the disease the complaints are nonspecific such as abdominal
distention, irregular fever, excessive crying and altered appetite. In
a few children, the disease begins with jaundice, but commonly
jaundice is a late feature. In the second clinical stage of the
disease, the liver is characteristically firm with a "leafy" edge.
The progress is relentless and within a few months, the patient
progresses on to the terminal stages with jaundice,
hepatosplenomegaly, oedema and ascites. Death is usually due to
intercurrent infections or terminal hepatocellular failure leading to
haemorrhagic complications or hepatic coma.
The standard liver function tests are usually deranged but not
specific for the differentiation of early ICC from other childhood
liver disorders. Serum copper is raised significantly in ICC. The mean
serum copper values increase with the clinical progression of the
disease (Tanner et al., 1979; Sharda & Bhandari, 1984; Sethi et al.,
1993). Serum ceruloplasmin levels, however, are normal or elevated,
in contrast to Wilson disease. Hepatic copper is increased. A
hepatic copper level > 800 µg/g dry weight helps distinguish ICC from
other liver disorders occurring at this age.
Histopathology remains the cornerstone of definitive diagnosis.
(Parekh & Patel, 1972; Bhave et al., 1982, 1983). The two most
discriminatory features of ICC now recognized are typical widespread
coarse dark brown orcein staining and intralobular pericellular
fibrosis (Pradhan et al., 1983). Hepatocytic necrosis (seen in 97%)
and hyaline (66%) are also diagnostic though late features. Portal
fibrosis, inflammation and disruption of the limiting plate are seen
in most cases, but also are seen in other liver disorders and hence
are not of discriminatory value. Parenchymal fat is usually absent and
cholestasis is a late feature (Pandit & Bhave, 1983). Raised hepatic
copper, indicated by orcein staining, is seen consistently in ICC.
Intensity of orcein staining correlates significantly with the
histopathological grade of the disease (Sethi et al., 1993).
Various aetiological agents have been implicated in ICC, but none
has so far been confirmed. Tanner et al. (1983) stated that "early
introduction of copper-contaminated animal milk is of aetiological
importance", based on the observation that ICC was predominantly seen
in children who were bottle-fed rather than breast-fed, and that milk
stored in brass vessels prior to feeding became contaminated with high
levels of copper. Experimentally, boiling and storing of milk in
untinned brass vessels raises its copper concentration more than 60
times, and copper and brass vessels have been used traditionally in
some parts of India to boil and store milk and water. Although
ingestion of large amounts of copper in early infancy may be a factor
in the aetiology, it cannot fully explain the disease. Approximately
half of the patients presenting with ICC had received milk which had
been previously stored in brass vessels (Sharda & Bhandari, 1984).
In a study in India, a group of 32 children who developed
cirrhosis had a significantly higher mean value of serum copper
measured after diagnosis than a control group of 10 healthy
age-matched children. The use of brass utensils to carry, boil and
store milk occurred in only 14 (44%) of the cases, and increased serum
copper levels were not limited to these. In another 82 children
suffering from cirrhosis, liver biopsies revealed raised liver
concentrations of copper in all cases, and levels increased with the
severity of the disease (Sethi et al., 1993).
In some cases, other family members and siblings had received
milk from the same source as the ICC cases but were found to have
normal serum and urinary copper levels (Sharda & Bhandari, 1984).
Furthermore, that ICC has been seen in children who have been
breast-fed suggests that copper is unlikely to be the sole cause of
the illness (Sethi et al., 1993).
Because of the familial occurrence and high consanguinity, a
genetic aetiology of ICC has been suspected (Agrawal et al., 1979;
Sethi et al., 1993). Chandra (1976) reported a pedigree analysis
compatible with autosomal recessive inheritance. Although both serum
and hepatic concentrations increased with the severity of the disease,
the copper content is variable at the same stage of the disease.
Thus, genetic heterogeneity in ICC has been postulated (Sethi et al.,
1993).
The copper chelator d-penicillamine has been given to early ICC
patients, and histological improvement and remission in up to 65% of
patients has been claimed (Tanner et al., 1987). This is a single
study on only 29 patients; therefore, more work needs to be done to
definitely determine the role of d-penicillamine in the treatment of
ICC.
There has been a reduction of ICC in India (Bhave et al., 1992).
Whether this reduction is due to the reduction of the use of brass
vessels, or due to increasing intercaste marriages leading to genetic
dilution, or both, is yet unclear.
A similar reduction in fatal infantile liver cirrhosis in a
region of Austria has been reported (Müller et al., 1996). An
ecogenetic aetiology proposed in these conditions requiring a
convergence of a genetic predisposition with a high copper intake
could also be a prerequisite for the development of ICC. However,
whether ICC represents a specific form of infantile copper toxicosis
(ICT) or is an unrelated infantile cirrhosis is yet to be determined.
The relative importance of the role of environmental exposure to
copper and the genetic predisposition to copper accumulation have not
yet been determined.
8.4.5 Idiopathic copper toxicosis, or non-lndian childhood
cirrhosis
Scattered reports of early childhood cirrhosis similar to ICC,
referred to as copper-associated idiopathic copper toxicosis (ICT)
have appeared from some Western countries (Walker-Smith & Blomfield,
1973; Müller-Höcker et al., 1987; Adamson et al., 1992; Gormally et
al., 1994). It is unclear whether the aetiology of this disease is
the same as that of ICC as seen in India (section 8.4.4).
Müller-Höcker et al. (1987, 1988) described the first three cases in
Germany with histological and clinical features of ICC, including very
high liver copper levels. Eife et al. (1991) reported a total of 22
such cases (13 fatal) in Germany up to 1990 and attributed them to
ICT. All the families involved from Germany and elsewhere, lived in
rural areas and were supplied with soft and acidic water from private
wells using copper pipes. The exposed children were breast-fed only
briefly or not at all and their formula had been made up with well
water, presumably contaminated with copper. Details on three of the
aforementioned German cases were given by Müller-Höcker et al. (1987,
1988), Schramel et al. (1988) and Weiss et al. (1989). The water
copper levels (non-representative single values) varied from 0.4 to
15.5 mg Cu/litre. These values were not measured during the time of
exposure, but several months later. The authors attributed the
illness to copper toxicosis, possibly in connection with an unproven
genetic predisposition and/or unusual high copper exposure of the
babies via the formulas.
Müller et al. (1996) reported on the largest non-Indian series of
cases of a disease they regarded as identical to ICC or ICT.
Unfortunately they were unable to obtain liver samples to confirm high
copper values, and relied on photographs for histology to demonstrate
the similarity with ICC. In the Tyrol region of Austria between 1900
and 1974, 138 fatal cases of this cirrhosis were found. Detailed
family pedigree analysis suggested that susceptibility to the disease
was inherited in an autosomal recessive fashion and that the
copper-rich diet of the region induced the symptoms (experiments
duplicating methods of milk preparation using copper vessels suggested
copper levels of up to 60 µg/litre). Many similarly fed infants did
not develop cirrhosis. There have been no cases since 1974. The
authors speculated that this could be due to the replacement of copper
and brass vessels, although increased mobility of the population and
fewer consanguineous marriages may have diluted the gene pool reducing
the number of homozygous children. This report provides a likely
explanation for the causation and natural history of copper-associated
ICT in Austria and possibly elsewhere.
A number of case reports on childhood cirrhosis associated in
most cases with only intermediate hepatic copper levels (< 400 µg/g
dry weight) have been described worldwide, but no environmental copper
exposure was evident (Lim & Choo, 1979; Maggiore et al., 1987; Aljajeh
et al., 1994; Baker et al., 1995).
In order to test the hypothesis that ICT is an entirely
environmental condition, Scheinberg & Sternlieb (1994) reported on
three Massachusetts, USA, towns where drinking-water was known to
contain high levels of copper (8.5-8.8 mg Cu/litre on first-draw
samples after 6 h of stagnation). Between 1969 and 1991, mortality of
3000 children under the age of 6 years with liver and other diseases
were studied. During that period there were 135 deaths among the
study population but none from cirrhosis or any form of liver disease.
The sample size of this study was insufficient to fully test the
proposed hypothesis.
Fewtrell et al. (1996) reported 220 patients aged up to 7 years
with liver disease in the United Kingdom in 1991-1993. Copper
exposure in tap water was mostly below 3 mg/litre, but in 15 cases
higher levels may have occurred. In this series of patients too no
cases of ICT were detected.
A retrospective, multicentre study (Schimmelpfennig et al., 1996)
detected a total of 103 cases of early childhood cirrhosis of
different causes for the years 1982-1994 in Germany. The three cases
described in detail by Müller-Höcker et al. (1987, 1988) were not
included in this study. In only two cases were the exact conditions
of increased copper exposure reliably reconstructed and other
aetiologies of cirrhosis excluded. The concentrations of copper in
the tap water in these two cases were 9-26 mg/litre owing to specific
conditions of the individual water supplies. These concentrations may
have been the cause of one fatal case and may have led to severe liver
disease in the other. Recently a case of adult liver cirrhosis
associated with a daily copper intake of 0.5-1.0 mg Cu/kg body weight
was described (see section 8.3.2) (O'Donohue et al., 1993). Based on
these collective data, a purely environmental basis for ICT cannot be
confirmed or excluded; thus, the cause of liver injury remains
uncertain.
8.4.6 Chronic liver diseases
Copper retention occurs as a result of impaired biliary
excretion. As reviewed recently by Zucker & Gollan (1996), conditions
such as primary biliary cirrhosis, primary sclerosing cholangitis,
extrahepatic biliary obstruction or atresia, intrahepatic cholestasis
of childhood and chronic active hepatitis can lead to liver copper
levels above 250 µg Cu/g dry weight. These patients can be
distinguished from those with Wilson disease on the basis of history,
physical findings and elevated or normal serum ceruloplasmin levels.
The presence of hepatic disease requires caution in the provision of
dietary copper. Correction of biliary output in the cholestatic
condition may lead to decrease in liver copper levels (Ohi & Lilly,
1980).
8.4.7 Copper in infancy
Fetal copper metabolism is different from that in children or
adults. Neonates have high levels of copper in the liver and low
levels of serum copper and ceruloplasmin (Epstein, 1983) and elevated
levels of metallothionein that decrease after birth. After the age of
about 6 months both liver copper and serum copper levels come within
the adult range. The ratio of hepatic concentration of copper in
newborns to that of an adult human is 15 : 4 (Goyer, 1991).
Acquired copper deficiency is a clinical syndrome that occurs
mainly in infants (Shaw, 1992), although it has also been described in
children and in adults. Copper deficiency is usually the consequence
of decreased copper stores at birth (see chapter 6), inadequate
dietary copper intake, poor absorption, elevated requirements induced
by rapid growth or increased copper losses. Excretion of copper is
usually via the bile, but if renal tubular reabsorption is impaired
urinary losses may be quite high. The multiple factors that may lead
to deficiency commonly coexist in copper-deficient subjects. Copper
deficiency is more frequent in preterm infants, especially of very low
birth weight, owing to their reduced copper stores at birth given the
smaller relative size of the liver and higher requirements determined
by their high growth rate (Widdowson & Dikerson, 1964; Widdowson et
al., 1974; Dauncey et al., 1977; Sutton et al., 1985; Hurley & Keen,
1988).
Infants fed exclusively diets based on cow's milk are more prone
to develop copper deficiency because of the low copper content of milk
and limited absorption of this mineral in cow's milk. In contrast,
breast-fed infants absorb more copper; this may be due to the lower
casein content of human milk or to factors present in human milk which
enhance copper absorption (Naveh et al., 1981; Lönnerdal et al.,
1985). In developing countries, where infant feeding is often based on
cow's milk enriched with a high concentration of refined
carbohydrates, copper deficit may be more prevalent because fructose
and other refined sugars lower copper absorption.
On the basis of published information, the most common cause of
copper deficiency is insufficient copper supply during the nutritional
recovery of malnourished children (Shaw, 1992). These infants present
several factors which are frequently associated to copper deficiency:
history of low birth weight, short duration of breast-feeding, a diet
based on cow's milk and a highly refined carbohydrate, or increased
losses of nutrients due to diarrhoeal disease and frequent infections.
During nutritional recovery they grow 5-10 times as fast as normal for
their age group, thus increasing the nutrient requirement.
8.4.8 Malabsorption syndromes
Copper deficiency has been reported in subjects with
malabsorption syndromes such as coeliac disease, tropical sprue,
cystic fibrosis, partial gastrectomy or short bowel syndrome due to
intestinal resection (Williams, 1983; Rodriguez et al., 1985; Hayton
et al., 1995). Copper deficit should be suspected in infants with
prolonged or recurrent diarrhoeal episodes, abnormal bile loss,
intestinal resections, or loss of intestinal contents from intestinal
fistula (Williams, 1983; Castillo-Duran et al., 1988). Castillo-Duran
et al. (1988) evaluated the magnitude of copper loss in 14 infants
during acute diarrhoeal episodes requiring hospitalization. The
results were compared with those obtained in 15 matched control
infants. Faecal losses of copper were twice as high in the diarrhoea
group as in the control subjects. This group presented a negative
copper balance up to 7 days after hospital admission. Copper losses
were directly related to faecal weight. Furthermore, Rodriguez et al.
(1985) compared the copper status of 19 children exhibiting chronic
diarrhoea with two control groups (19 healthy and 11 malnourished
children). Plasma copper levels were 30% lower and hair copper content
decreased 3-4-fold in the group with chronic diarrhoea relative to the
control groups.
High oral intakes of zinc and iron decrease copper absorption and
may lead to copper deficiency (Prasad et al., 1978; Williams, 1983).
This phenomenon is used as a therapeutic strategy in Wilson disease
where high zinc intake (40-50 mg/day) has been demonstrated to lower
copper absorption. Copper deficiency has been also documented in
subjects receiving penicillamine or other cation chelating agents, or
high doses of oral alkali therapy which enhance copper losses
(Williams, 1983).
8.4.9 Parenteral nutrition
Patients fed with intravenous nutrient mixtures lacking
sufficient copper will develop symptomatic deficiencies after 3-12
months (Shike et al., 1981). In adults, this presents as an
iron-resistant anaemia, with a mark fall in neutrophils. In children,
as well as the haematological abnormality, there are marked effects in
bone: characteristic radiological changes, greater ease of fracture
and reduced bone age (Shaw, 1992).
It has been shown that infusion of 0.3 mg Cu/day will maintain a
70 kg adult in copper balance (Shike et al., 1981). However, in
patients with high volume fistula or diarrhoeal losses additional
copper may be needed. The adult normative requirements of 1.3 mg
Cu/day will maintain plasma copper within the reference interval and
prevent the development of deficiency disease (Shenkin et al., 1987).
An increased amount of copper may be required in patients who have
high volume fistula fluid or diarrhoeal losses.
The neonatal requirements for copper will vary according to such
factors as premature delivery and low birth weight. It has been
suggested that approximately twice as much copper is required by the
pre-term infant compared to the term infant (Shaw, 1992; WHO, 1996).
Where there is evidence of choleostasis, copper supplements in
both adults and children should be reduced or withheld and the patient
monitored for any signs of developing copper toxicity.
8.4.10 Haemodialysis patients
Copper homoeostasis mechanisms available for regulating
gastrointestinal absorption of copper are bypassed by parenteral
administration. Copper toxicity in patients on haemodialysis is not
common. In two studies of four patients exposed to poorly defined
concentrations of copper in the dialysis fluid (0.056 to > 0.11
mg/litre) headache, sweating, nausea, hypotension, stupor and coma
were reported (Klein et al., 1972; Lyle et al., 1976). Similar signs
and symptoms were reported in three patients exposed to copper
concentrations between 5.1 and 8.8 mg/litre of dialysate (Manzler &
Schreiner, 1970).
8.4.11 Cardiovascular diseases
Changes in copper concentrations have been associated with
ischaemia (Kinsman et al., 1990), as well as various cardiovascular
and cerebrovascular related problems (Peterson et al., 1990).
Reviewing the relationship between ischaemic heart disease and copper
deficiency, Sorenson (1989) found evidence that copper deficiency can
elevate blood pressure. Impaired tissue formation has been associated
with copper deficiency, particularly with the cardiovascular system
(Farquharson et al., 1989; McCormick et al., 1989; Saari & Johnson,
1990; Tinker et al., 1990). Variation in copper intake may cause
significant changes in the SOD level in certain cardiac tissue (Askari
et al., 1990).
There are some reports concluding that elevated serum copper
levels (nondietary copper exposure) are implicated in the onset of
cardiovascular disease. In two double-blind studies, groups of 7 or 8
males took a supplement of copper gluconate providing 2 or 3 mg
Cu/day, respectively, for 6 weeks. Groups of 6 males formed control
groups in each case. The data suggested that 2 and 3 mg Cu/day could
increase LDL cholesterol and total serum cholesterol, respectively.
However, the control groups showed a variability in levels that made
these findings questionable. At 3 mg Cu/day, there was an increase in
the haemoglobin level after 6 weeks (Medeiros et al., 1991). An
earlier study found no significant changes in the serum levels of
copper, zinc, magnesium, triglyceride, serum glutamic-oxaloacetic
transaminase (SGOT), gamma-glutamyl transpeptidase (GGT), lactate
dehydrogenase (LDH) or alkaline phosphatase, in a group of 7 subjects
ingesting 10 mg Cu/day for 12 weeks as copper gluconate. Both treated
and placebo groups reported nausea, diarrhoea, heartburn and back
pain. The small group sizes should be noted (Pratt et al., 1985).
In England a correlation study, with measurements made after
diagnosis of coronary heart disease, has shown higher serum copper
levels in cardiovascular disease patients (Punsar et al., 1975). A
follow-up study in the Netherlands compared the copper and zinc intake
in cardiovascular mortality; the adjusted risk of death from
cardiovascular disease showed a U-shaped pattern which was four times
higher in subjects in the highest quartile for serum copper (> 1.43
mg/litre), but a twofold excess mortality was also observed in
subjects with low serum copper (< 1.05 mg/litre) (Kok et al., 1988).
It is noteworthy that causal interpretation of these data is difficult
because the disease might have affected serum copper levels.
Furthermore, the possibility that elevated serum copper levels are the
result of preclinical disease could not be ruled out. Also,
information on vitamin C, iron status and other nutrients that are
associated with copper is not available. In another prospective
study, baseline serum copper levels were measured in 1666 randomly
selected Finnish males aged 42-60 years in 1984-1988, and the cohort
followed until December 1989. When divided into tertiles of initial
serum copper, the highest tertile experienced acute myocardial
infarction in 4.6% of the subjects, compared with 3.6% in the medium
tertile and only 0.9% in the lowest tertile. After adjustments, the
relative risks for the three groups were 4.0, 3.5 and 1.0,
respectively (Salonen et al., 1991). It should be stressed that
elevated serum copper could be a consequence rather than a causal
factor for acute myocardial infarction.
The same group of authors reported that the mean increase in the
maximal common carotid intima media thickness after 2 years was
greater in men with high serum copper concentrations, those with low
serum selenium concentrations and those with raised serum LDL
cholesterol concentrations. They concluded that there was a
synergistic effect of copper, a low serum concentration of selenium,
and LDL cholesterol concentration in atherogenesis (Salonen et al.,
1991).
The association between serum ceruloplasmin level and the
subsequent incidence of myocardial infarction and stroke were studied
in a nested case-control study in Finland. High serum ceruloplasmin
levels were significantly associated with higher future odds of
myocardial infarction but not of stroke, which support the hypothesis
that a high serum ceruloplasmin level is a risk factor for myocardial
infarction (Reunanen et al., 1992). This was consistent with the
described positive relationship between high serum copper and the
aggregation of classical risk factors (McMaster et al., 1992). Several
investigators (Taggart et al., 1986; Fraser et al., 1989) reported
that ceruloplasmin is a positive acute-phase reactant and increases in
response to injury and infection in parallel with other plasma protein
markers such as C-reactive protein.
All these observations may seem incongruous when juxtaposed with
the copper-deficiency theory (Klevay, 1975), but they are not in
conflict with the theory because high serum copper does not prove high
copper absorption. Experiments with animals reveal that the opposite
may be true (Klevay, 1988, 1992). Thus, the role of elevated serum
copper (unrelated to dietary copper exposure) in the aetiology of
cardiovascular disease remains a matter of controversy and
conjuncture.
8.5 Occupational exposure
It has been reported that occupational exposure to copper fume
results in metal fume fever (Armstrong et al., 1983) and a similar
condition has been reported from inhalation of finely ground
copper-oxide dust (Schiatz, 1949). Air concentrations capable of
producing these effects are not well defined. Schiatz (1949) reported
on conditions in a postwar factory in which ventilation systems were
inoperative. In this case, exposures were likely to be unusually high
compared to plants with adequate industrial hygiene.
Most industrial exposures are to a mixture of copper and other
contaminants, and assessing the effects of copper alone from such
studies is extremely difficult. This restricts the usefulness of much
of the data on Bordeaux mixture sprayers (Pimentel & Menezes, 1977;
Plamenac et al., 1985), from the mining and smelting of copper
(Ruoling & Mengxuan, 1990; Chen et al., 1993) and from the maintenance
of moulds in a paper mill (Srivastava et al., 1992). Copper refinery
studies are less likely to be confounded by mixed exposures. Studies
where effects could reasonably be attributed to copper are discussed
below.
A large historical prospective study of 3550 men working for at
least 1 year in the tank house of nine copper refineries in the USA
(Logue et al., 1982) provided no statistically significant evidence of
an increased risk of cancer.
Suciu et al. (1981) reported on a clinical study of workers
exposed to copper dust during the sieving and electrolysis processes.
Exposures at the time of the clinical examinations were very high,
ranging from 464 mg Cu/m3 in 1971 to 111 mg Cu/m3 in 1973 [present
widely recognized exposure limits are typically 1 mg Cu/m3 (ILO,
1991)]. Signs and symptoms studied and their occurrence included
hepatomegaly in 55.6%, digestive disorders in 10-15%, and a range of
respiratory signs and symptoms. Normal serum copper values in
unexposed workers were reported as 0.76-1.17 mg/litre. In 1970-1973,
the proportion of workers with serum copper above the normal range
increased from 40% to 92%. Using a number of assumptions, absorption
of copper can be estimated as being in the range of 200 mg/day. The
absence of control data and information on methods used for measuring
exposure severely limit the usefulness of this study (Suciu et al.,
1981).
In another study, Gleason (1968) reported symptoms similar to the
common cold with sensations of warmth and stuffiness of the head in
workers polishing copper plates using an aluminium oxide abrasive on
buffing wheels. Air samples in front of the buffing wheel were
reported at 0.12 mg Cu/m3 but at times estimated to be a factor of
2-3 times higher. Microscopic examination indicated the particulates
to be metallic copper rather than copper-oxide dust.
No adequate studies were found on the effects of occupational
exposures to copper on fertility or fetal development.
9. EFFECTS ON OTHER ORGANISMS IN THE LABORATORY AND FIELD
9.1 Bioavailability
Copper usually has limited bioavailability in environmental
media, and this needs to be carefully considered in all assessments of
its environmental impacts. Bioavailability refers to the degree to
which total chemical in the environment (e.g. water, sediment, food
items) can actually be taken up by organisms (Rand & Petrocelli,
1985). The more bioavailable a chemical is, the greater the potential
for toxicity or bioaccumulation. Bioavailability can be affected by
the speciation of a chemical (i.e. certain species will be more or
less able to interact with and pass through the absorptive surfaces of
organisms), but can also be affected by other physicochemical
properties of the media which regulate uptake of chemicals.
9.1.1 Bioavailability in water
A large body of environmental literature demonstrates that
bioavailability is generally poorly related to the concentration of
total metal in water. Major factors reported to limit copper
bioavailability are adsorption to suspended particles, complexation by
dissolved organic matter and complexation by some inorganic ligands
such as carbonate (Sunda & Guillard, 1976; Brungs et al., 1976; Allen
& Brisben, 1980; Giesy et al., 1983; Borgmann & Ralph, 1983, 1984;
Borgmann & Charlton, 1984; Meador, 1991; Verweij, 1992; Erickson et
al., 1996). Copper toxicity is usually found to decrease with
increasing water hardness, possibly because calcium and copper compete
for adsorption sites on biological surfaces, so that greater calcium
concentrations will limit copper adsorption (Zitko & Carson, 1976;
Howarth & Sprague, 1978; Chakoumakos et al., 1979; Miller & Mackay,
1980; Pagenkopf, 1983). Copper toxicity has also been reported to be
affected by pH, which may be due either to hydrogen ion affecting
copper speciation or to the interactions of copper with biological
surfaces (Howarth & Sprague, 1978; Miller & Mackay, 1980; Borgmann,
1983; Meador, 1991; Erickson et al., 1996).
Particular attention has been paid to the possibility that the
principal bioavailable species is the free copper (cupric) ion.
Several studies have shown a close correlation of copper toxicity to
cupric ion activity as the concentrations of organic ligands vary
(Sunda & Guillard, 1976; Allen & Brisbin, 1980; Meador, 1991; Verweij
et al., 1992). However, other studies have shown that this
correlation is not always good for some organic ligands and organisms
(Giesy et al., 1983; Borgmann & Charlton, 1984; Borgmann & Ralph,
1983, 1984; Erickson et al., 1996). In fact, certain hydrophobic
copper complexes appear to have high bioavailability (Ahsanullah &
Florence, 1984). Studies which evaluated the effect of pH on copper
toxicity also do not show a close correlation of toxicity with cupric
ion activity (Borgmann 1983; Meador, 1991). Toxicity on the basis of
cupric ion will also vary with varying water hardness, although if
this is due to competitive interactions it does not contradict the
notion that cupric ion is the principal bioavailable species. More
information and analysis regarding the "free ion activity model" for
metal toxicity and metal bioavailability is provided in a review by
Campbell (1995).
The bioavailability of Cu(I) has been largely ignored since
soluble or complexed forms of Cu(I) have not been thought to occur in
significant amounts in aerobic environments. However, studies by
Moffett & Zika (1987) speculate that Cu(II) can be directly or
indirectly reduced to Cu(I) by photochemical processes. If this
should occur in seawater, chloride ions might stabilize the Cu(I)
through complex formation.
Whatever the mechanisms, bioavailability can vary widely and must
be considered in any interpretation and application of toxicity data
such as those presented later in this chapter. Additional
consideration must be given to the condition of organisms and any
physicochemical exposure conditions which affect organism
susceptibility without affecting bioavailability, such as temperature
and sodium concentrations (Erickson et al., 1987, 1996). Some
empirical strategies exist for doing this. The US EPA water quality
criteria for copper (US EPA, 1984) are adjusted for hardness, based on
regression analysis of studies in which toxicity was evaluated at
various hardness levels. This addresses only some aspects of
bioavailability, and EPA procedures allow for criteria to be modified
based on toxicity tests in site water which evaluate bioavailability.
Welsh et al. (1993) provide empirical equations for the effects of pH
and organic carbon on the acute toxicity of copper to fathead minnows.
Erickson et al. (1987) proposed similar equations for several
physicochemical factors affecting acute copper toxicity. Such
empirical approaches have considerable utility, but can be expensive
to develop. Some recent research has introduced predictive models
which are more mechanistically based and have a potential for
providing better extrapolations.
9.1.1.1 Predicting effects of copper on fish gill function
Gills of freshwater fish have two important physiological
functions; transport of gas (oxygen, carbon dioxide, ammonia) and
uptake of active ions (sodium, calcium) (Wood, 1992; Playle, 1997). At
environmentally realistic levels for anthropogenically contaminated
waters, metals exert their toxic effects by binding to these sodium
and calcium pump-associated ligands in a highly specific fashion,
thereby inhibiting the inward transport of the essential nutritive
ions. These ligands are, therefore, the proximate receptors for the
metals; the free cationic forms of the metals are the most potent in
binding to these receptors. For cupric and cadmium ions, strong
relationships between the gill metal burden and mortality have been
determined experimentally (MacRae et al., in press). Thus, it may be
possible to predict toxicity from gill metal burden for these two
metals and potentially other cationic metals.
Viewed in the above context, the specific receptor ligands on the
gill are entirely analogous to other anionic ligands in the water
column which may also bind the cationic metal - for example chloride,
hydrogen carbonate and dissolved organic carbon (DOC) - and indeed the
gill ligands will compete with these natural ligands for the metal
(Playle et al., 1993a,b). The final metal partitioning will depend in
part on the affinities and numbers of natural ligands relative to gill
ligands. Naturally occurring cations in the water column (e.g.
sodium, calcium, hydrogen) will compete with the metal for both the
natural anionic ligands and gill receptor ligands. Aquatic
geochemical speciation programs such as MINEQL+ and MINTEQA2
(Allison et al., 1991; Schecher & McAvoy, 1992) are specifically
designed to deal with these competitive interactions and can be used
to produce accurate equilibrium models of the metal partitioning among
the various ligands in the water, provided the water chemistry is
known. At present, these programs do not contain binding constants
for the gill receptor ligands and therefore deal only with
partitioning within the water column. However, they allow the user to
add constants for other ligands at will. A problem with these
modelling approaches is that the biomembrane-water interaction is
treated as an equilibrium situation, whereas it is, in fact, a dynamic
reaction and kinetic factors (rate constants) should also be taken
into account.
Recently, methods have been developed to determine conditional
equilibrium binding constants of copper and other metals to the gill
receptor ligands (Janes & Playle, 1995). In brief, these involve
experimental determination of equilibrium gill metal burden after
exposure of the fish (3 h) to environmentally relevant levels of the
metal in the presence of various concentrations of natural and/or
synthetic ligands with known metal-binding constants. Analogous
competition experiments can be run in the presence of various
concentrations of natural cations to determine the conditional binding
constants of the gill receptors for such cations. These constants can
then be added into chemical speciation calculation programs to make a
prediction of gill receptor loading with metal, and therefore
toxicity, in any water with known chemistry.
The advantages of this predictive modelling approach include the
following:
* it is mechanistically based
* for the first time in aquatic toxicology it allows estimation of
metal dose at the receptor surface directly associated with
toxicity
* it takes all important water chemistry factors into account (not
just hardness, for example)
* it can deal with multiple metals simultaneously.
This approach to modelling toxicity allows for flexible,
site-specific criteria based on the known chemistry of the receiving
water and the known chemistry of the gill surface. This approach is
also currently being investigated for freshwater invertebrates.
9.1.2 Bioavailability of metals in sediments
Determining the bioavailability of metals sorbed to sediments is
a key to understanding their potential to accumulate in aquatic
organisms and to induce toxic effects. Considerable published data
indicate that total metal concentrations on sediments are not a good
estimator of the bioavailable fraction of the total chemical present
(Ruiz et al., 1991; DeVevey et al., 1993; Allen & Hansen, 1996).
Total metal concentrations in sediments which produce toxic effects
can differ by a factor of 10-100 for different sediments. In order to
assess the potential for toxicity based on chemical measurements, the
bioavailable fraction of the total metal present needs to be
estimated. A number of approaches to determining metal
bioavailability associated with sediments have been evaluated,
including carbon normalization and sorption of metals in oxic
freshwater sediments to particulate carbon and the oxides of iron and
manganese (Jenne, 1987).
Recently, the dominant role of the sediment sulfides in
controlling metal bioavailability has been demonstrated (DiToro et
al., 1990, 1991; Ankley et al., 1991). Sulfides are common in many
freshwater and marine sediments and are the predominant form of sulfur
in anaerobic sediments (usually found as iron sulfide). The ability
of sulfide and metal ions to form insoluble precipitates with water
solubilities well below the toxic threshold of dissolved metal is well
known (DiToro et al., 1990). This accounts for the lack of toxicity
from sediments and sediment pore waters even when high metal
concentrations are present (Ankley et al., 1991). The same authors
have shown that the solid-phase sediment sulfides that are soluble in
weak cold acid, termed acid volatile sulfides (AVS), are a key factor
in controlling the toxicity of heavy metals (copper, cadmium, nickel,
lead, zinc). Toxicity due to these metals is not observed when they
are bound to sediment and when, on a molar basis, the concentration of
AVS is greater than the sum of the molar concentrations of metals.
When the ratio of the sum of the simultaneously extracted metals to
AVS concentration exceeds 1.0 on a molar basis, toxic effects due to
metals may be expressed, if the metal(s) are not complexed by other
ligands. The key concept here is that the metal : AVS ratio can be
used to predict the fraction of the total copper concentration present
in sediment that is bioavailable.
Limitations to the AVS : metal ratio approach occur when the AVS
concentration is low. This could occur in fully oxidized sediments.
Most sediments have at least a small zone where the sediments are oxic
near the sediment-water interface. The importance of this zone has
been demonstrated for copper relative to AVS and accumulation of
copper in midge (Chironomus tentans) (Besser et al., 1996). In
these situations, other phases (i.e. iron and manganese oxides,
dissolved organic carbon and particulate organic carbon) can play an
important and more dominant role in determining the bioavailability of
copper. The available data suggest that AVS concentrations may be
sufficient in both freshwater and marine ecosystems to be the dominant
sorbing phase for copper and other metals, except in fully aerobic
sediments.
9.2 Essentiality
Copper is an essential element for all biota. Copper was
identified in plant (Bucholtz, 1816; Meissner, 1817) and animal
(Sarzeau, 1830; Harless, 1847) systems in the nineteenth century and
postulated to be a biological catalyst in the early twentieth century
(Fleurent & Levi, 1920; Guerihault, 1920). Subsequent nutritional
studies demonstrated that copper and other metals were necessary for
optimal growth of plants and animals (McHargue, 1925, 1926, 1927a,b;
Arnon & Stout, 1939; Woolhouse, 1983). Copper was shown to be an
essential element for animals by Hart et al. (1928) who demonstrated
that copper, as well as iron, is necessary to prevent anaemia in rats.
Copper is also essential for the utilization of iron in the formation
of haemoglobin (Friberg et al., 1979); hence its involvement in
anaemia.
9.2.1 Animals
To satisfy their internal metabolic demands, all species in a
given habitat are adapted to the natural concentration range of
essential elements. Therefore, laboratory-generated no-observed-effect
concentrations (NOECs) substantially below the natural background
concentration of copper require further attention as they appear to
violate evolutionary principles. This may be explained by the concept
of the optimal concentration band of essential elements (OCEE). This
concept is well known in the field of ecotoxicology of essential
elements, but has not so far been accommodated in the regulatory
context. Thus although ecotoxic at high concentrations, copper may
also be limiting or cause symptoms of deficiency at low ambient
bioavailable concentrations.
Most crustaceans and molluscs possess the copper-containing
haemocyanin as their main oxygen-carrying blood protein. Haemocyanin
doubles their requirement for copper compared to other invertebrates
(Hopkin, 1993).
White & Rainbow (1985) calculated theoretical estimates for the
minimum metabolic requirements of copper in molluscs and crustaceans.
Enzymatic requirements for both groups were estimated to be 26.3 mg
Cu/kg (dry weight). The possession of haemocyanin as a respiratory
pigment adds a further nonenzymatic metabolic requirement of 125 mg
Cu/kg for certain gastropod molluscs and 57.4 mg Cu/kg for some
crustaceans such as decapods. However, Depledge (1989) recalculated
the amount of copper required by decapod crustaceans to be 82.8 mg/kg
(dry weight). Hopkin (1993) estimated that terrestrial isopods
require a minimum whole-body concentration of 50 mg Cu/kg. Evidence on
copper concentrations of certain decapod crustaceans in the deep sea
suggests that circumstances exist where there is insufficient
bioavailable copper for the decapods to meet all their metabolic
copper requirements (Rainbow, 1988). Small specimens of the
mesopelagic caridean Systellaspis debilis, for example, have low
copper concentrations (30 mg/kg dry weight), body concentrations
reaching only 100 mg/kg in large adults. According to the theoretical
calculations of Depledge (1989) the smaller S. debilis would only
have sufficient absorbed copper to match enzymatic needs, whereas
larger adults have sufficient copper for haemocyanin requirements as
well. This is indeed the case; Rainbow & Abdennour (1989) found that
small S. debilis contained little, if any haemocyanin, large animals
containing a more typical haemocyanin complement. Moreover, juvenile
S. debilis undertake limited vertical migrations. This may be
related to the shortage of haemocyanin in juveniles, indicating that
insufficient bioavailable copper in the mesopelagic environment may
limit activity levels until sufficient copper has been accumulated to
allow the synthesis of increased haemocyanin concentrations. Ambient
copper availability in the deep ocean is so low that levels of copper
in juvenile crustaceans are a reflection of copper deficiency. Any
such deficiency is only overcome in adults which have had sufficient
time to accumulate body copper concentrations meeting all metabolic
requirements.
Analysis of concentrations of copper in invertebrates from
uncontaminated sites suggests that some terrestrial invertebrate
species may be copper deficient (Hopkin, 1993). In mammals,
molybdenum has been shown to influence the tissue and blood levels of
copper. Copper deficiency may occur in mammals when the intake of
molybdenum is excessive (Friberg et al., 1979). This is thought to be
due to the formation of copper molybdate.
Problems related to copper and molybdenum metabolism have been
widely reported in grazing domestic livestock, and there are some
reports of concern for wildlife (Ward & Nagy, 1976; Flynn et al.,
1977; Robbins, 1983). The metabolism of copper, molybdenum and
inorganic sulfate is extremely complex and interrelated (Underwood,
1977). The interactions of copper and molybdenum can result in two
toxic scenarios; excess copper-deficient molybdenum, or deficient
copper-excess molybdenum. In the presence of inorganic sulfur it is
impossible to delineate between the toxicity of one and deficiency of
the other (Buck et al., 1976). Deficiency or excess of copper and
molybdenum are most prominent among ruminants and directly related to
copper-molybdenum balance in soil and forage.
King et al. (1984) examined copper and molybdenum levels in
white-tailed deer from a uranium-mining district of Texas, USA, where
molybdenosis was reported in cattle. Liver copper levels ranged from
0.47 to 0.94 µg/g in all samples, and there was no difference between
mined and unmined areas. Only 1 deer of 36 examined contained
detectable levels of molybdenum. The authors suggest that 6 deer with
liver copper levels < 1.0 µg/g were probably suffering from copper
deficiency that was not molybdenum-induced. Keinholz (1977) reported
that mean copper and molybdenum levels in liver of deer from a
molybdenum mining area were 40 and 1 µg/g, respectively, above control
levels.
Ward & Nagy (1977) demonstrated that mule deer were able to
withstand much higher dietary levels of molybdenum (1000 µg/g) than
domestic livestock. The authors point out, however, that the diet
used was a pelleted concentrate which may have affected availability
of molybdenum to the deer. They did observe that mule deer rejected
feed with excess molybdenum. The ability of wildlife to select feeds
low in molybdenum would reduce the chances of toxicity.
A copper deficiency in moose on the Alaskan Kenai peninsula
impaired hair and hoof keratinization, and reduced reproduction (Flynn
et al., 1977). Adult females in the Kenai moose population had a 53.5%
pregnancy rate compared with 91.6% for moose in another area of
Alaska. Copper levels in the moose browse (5.7 µg/g) are considered
marginal for domestic livestock. Examination of tissue molybdenum and
sulfur levels led the authors to believe that the copper deficiency
was not molybdenum induced (Flynn et al., 1976).
Aulerich & Ringer (1976) showed that addition of 25 or 50 µg Cu/g
to the diet stimulated growth of young mink (dark ranch phase). Up to
200 µg Cu/g in the diet had no effect on adult mink reproduction but
there was increased kit mortality at this level (Aulerich et al.,
1982). Liver copper levels increased in proportion to dietary levels,
but supplemental copper had no effect on the concentration of zinc or
iron in mink liver. The acute (21-day) LC50 (intraperitoneal
injection) of copper sulfate and copper acetate in adult mink was 7.5
and 5.0 mg/kg, respectively (Aulerich et al., 1982).
There is a marked difference between species in their ability to
tolerate high levels of copper. Levels that are toxic to ruminants
(30-50 µg Cu/g) are well tolerated by nonruminants. A difference in
the rate of copper absorption from the diet between ruminants and
nonruminants may partially explain the difference in sensitivity (Buck
et al., 1976). Rats, swine and mink can tolerate up to 200-250 µg
Cu/g in the diet (Aulerich et al., 1982).
There is also some indication that the source or quality of
dietary protein may be a factor in copper toxicity. Suttle & Mills
(1966) observed severe copper toxicosis in swine receiving whitefish
meal but not in those receiving soybean-oil meal, with both diets
containing up to 425 µg Cu/g. It is also possible that the effects of
dietary protein source on copper toxicity are related to their
concentrations of elements such as zinc and iron, both of which have
been shown to protect swine from the adverse effects of high (250-750
µg/g) levels of dietary copper (Ritchie et al., 1963).
9.2.2 Plants
9.2.2.1 Aquatic plants
Copper must be provided as a micronutrient (as copper chloride or
copper sulfate) in the culture media for growing algae (McLachlan,
1973). Copper participates, as part of the plastocyanin molecules, in
the electron transport during photosynthesis, and as co-factor in a
number of enzymatic reactions and metabolic pathways (Bidwell, 1979;
De Boer, 1981; Lobban et al., 1985).
9.2.2.2 Terrestrial plants
Copper is an essential micronutrient for normal plant nutrition
(Woolhouse, 1983; Marschner, 1986; Fernandes & Henriques, 1991;
Larcher, 1995), because this element is constituent of a number of
plant enzymes (Adriano, 1986; Fernandes & Henriques, 1991), some of
which are listed in Table 7. Copper is required in small amounts:
5-20 mg/kg in plant tissue is adequate for normal growth (Nriagu,
1979; Clarkson & Hanson, 1980; Howeler, 1983; Stevenson, 1986), less
than 4 mg/kg is considered deficient (Robson & Reuter, 1981; Howeler,
1983; Marschner, 1986) and more than 20 mg/kg is considered toxic
(Stevenson, 1986). However, depending on the plant species, plant
organ, developmental stage, and nitrogen supply, these ranges can be
larger (Thiel & Finck, 1973; Robson & Reuter, 1981). Adriano (1986)
reports a variety of soil types which are deficient in copper for
normal plant growth including peat and muck soils, alkaline and
calcareous soils, highly leached sandy and acid soils, and soils
heavily fertilized with nitrogen, phosphorus or zinc. Zinc is
expected to serve as an uptake competitor. Typical visible symptoms
of copper deficiency are stunted growth, distortion of young leaves,
necrosis of the apical meristem, and wilting and bleaching of young
leaves (Rahimi & Bussler, 1973). Copper deficiency results in
insufficient lignification of the cell walls of the xylem vessels
(Rahimi & Bussler, 1974; Pissarek, 1974) indicating that the degree of
lignification is a good indicator of nutritional copper status in
plants.
9.3 Toxic effects: laboratory experiments
Since copper is an essential metal for aquatic and terrestrial
organisms, care must be taken when interpreting toxicity test results.
For all organisms there will be an optimum concentration range, with
copper being toxic or deficient above or below this optimum range. A
wide variety of factors will influence this optimum range including
previous exposure, test conditions and species sensitivity.
9.3.1 Microorganisms
9.3.1.1 Water
Dutka & Kwan (1981) reported a 15-min Microtox EC50 at 3800 µg
Cu/litre. Microtox EC50 (15 min) values were reported at 1200
µg/litre for a copper chloride solution and at 600 µg/litre in sewage
(Codina et al., 1993). Blaise et al. (1994) calculated 5-, 15-,
30- and 60-min EC50s in Microtox tests to be 1100, 150, 70 and 60 µg
Cu/litre, respectively. Carlson-Ekvall & Morrison (1995) report that
the 30-min EC50 for Photobacterium phosphoreum was 136 µg Cu/litre.
The toxicity of copper in the presence of various organic substrates
identified in sewage sludge was found to vary from < 20 µg/litre for
ethyl xanthogenate to > 500 µg/litre for tannic acid.
Codina et al. (1993) calculated copper EC50 values for two
Pseudomonas fluorescens growth inhibition tests, a baker's yeast
(Saccharomyces cerevisiae) test, a respiratory inhibition test with
baker's yeast and a respiratory inhibition test with P. fluorescens.
The EC50 values were 51.7, 48.7, 73.2, 78.8 and 150.9 mg Cu/litre,
respectively.
Berk et al. (1985) calculated a 15-min EC50, based on inhibition
of ciliate chemotactic response, to be 150-160 µg Cu/litre for the
freshwater ciliate Tetrahymena sp. Copper concentrations of 5 and
50 µg/litre were found to be significantly inhibitory to chemotactic
responses of the marine ciliates Miamiensis avidus and Paranophrys
sp., respectively.
In a static test system Schafer et al. (1994) exposed the
freshwater ciliate Tetrahymena pyriformis to copper. They
calculated 48-h and 96-h EC50s, based on growth inhibition to be
8.017 and 10.18 mg Cu/litre, respectively; NOECs were 3.563 and 3.818
mg Cu/litre, respectively.
Madoni et al. (1992) isolated seven ciliate species from the
activated sludge of a sewage treatment works. The 24-h LC50s ranged
from 1.45 µg Cu/litre for Blepharisma americanum (free-swimming
form) to 64 µg Cu/litre for Euplotes affinis (a crawling form).
Madoni et al. (1994) isolated a further two ciliates
(Spirostomum teres and Drepanomonas revoluta) and found 24-h
LC50s to be 3.51 and 1.75 µg Cu/litre, respectively.
Tijero et al. (1991) studied the effect of copper on an anaerobic
digester system. A concentration threshold of 20 mg Cu/litre was
reported, and a 50% reduction in digester yields was found at a copper
concentration of 40 mg/litre.
Isolda & Hayasaka (1991) studied the effect of copper (20 and
1000 mg/litre) on the microbial processes in pond sediment for 4
weeks. Copper had no significant effect on glucose mineralization,
nitrogen fixation or dehydrogenase activity. Methanogenesis was
significantly reduced at both copper concentrations and the highest
exposure significantly reduced phosphatase activity.
Flemming & Trevors (1988) studied the effect of copper on nitrous
oxide (N2O) reduction in anaerobically incubated freshwater sediment
at 15°C. A concentration-dependent decrease in sediment pH and a
significant decrease in nitrous oxide reduction were observed at
copper concentrations ranging from 500 to 5000 mg/kg. However, when
copper-amended microcosms were pre-incubated to allow the sediment pH
to return naturally to pH 7.1, an inhibitory effect on nitrous oxide
reduction was only observed at 5000 mg Cu/kg.
Martínez et al. (1991) calculated the 60-min EC50, based on
3H-thymidine incorporation (a measure of bacterial heterotrophic
activity), to be 32 µg Cu2+/litre for naturally occurring bacteria
from the river Rhone (Mediterranean Sea) plume. Tubbing et al. (1995)
found EC50s, based on 3H-thymidine and 3H-leucine incorporation and
proteolytic activity, to be 28-100, 28-90 and 585-1997 µg Cu/litre,
respectively.
Schreiber et al. (1985) exposed the marine bacterium
Vibrio alginolyticus to copper under aerobic and anaerobic
conditions. The copper concentration at which there was a 50%
reduction in heat production (TC50) was used to compare the toxicity
under aerobic and anaerobic conditions. Copper was more toxic to the
bacterium in anaerobic culture (TC50 = 133 µg/litre (2.1 µmol/litre))
than in aerobic culture (TC50 = 406 µg/litre (6.4 µmol/litre)). The
addition of organic chelators (EDTA and nitrilotriacetic acid)
protected the anaerobic cultures from the toxic effects of copper,
indicating that copper-organic complexes are not toxic to the
bacterium.
9.3.1.2 Soil
Toxicity of copper to soil microorganisms is summarized in Table
17.
Chang & Broadbent (1981) calculated the threshold (EC10) and
EC50 concentrations, based on the inhibition of carbon dioxide
production in a silt loam soil amended with alfalfa and sewage sludge,
to be 4.2 and 22 mg/kg (65.6 and 347 nmol/g) for DTPA-extractable
copper (bioavailable copper).
Rogers & Li (1985) incubated soil for 6 days in the presence of
copper. EC50s, based on inhibition of soil dehydrogenase activity,
were 29 mg Cu/kg for soil enriched with 1% alfalfa and 53 mg Cu/kg for
soil that was not enriched.
Lighthart et al. (1983) measured soil microbial respiration in
five soil types after treatment with copper. After a 45-day
incubation at 20°C the lower level treatments (3.2 and 32 mg Cu/kg,
0.05 and 0.5 mmol/kg) had little effect, with mean inhibitions of less
than 20%. Higher levels of 320 and 3200 mg Cu/kg (5 and 50 mmol/kg)
inhibited respiration by up to 35% and 60%, respectively. Bremner &
Douglas (1971) report that copper concentrations of 50 mg/kg inhibited
soil urease activity by 13-16% following a 5-h incubation period.
Doelman & Haanstra (1984) found that short-term (2 weeks)
exposures to copper (150-8000 mg/kg) caused decreases in the rate of
soil respiration. Long-term (up to 18 months) exposure was less clear
cut. In sand there was a significant decrease at copper
concentrations of 400 mg/kg and in sandy peat there was a significant
decrease at 1000 mg/kg. The effect of copper in silty loam and clay
was less apparent with a significant decrease and increase at 8000
mg/kg for the two soil types, respectively. Doelman & Haanstra (1986)
calculated EC50s, based on inhibition of soil urease activity. After
6 weeks EC50s were 260, 570, 1370 and 4200 mg Cu/kg for sand, sandy
loam, clay and sandy peat, respectively, and after 18 months they were
680, 1990, 1080 and 1970 mg Cu/kg, respectively.
Table 17. Toxicity of copper to soil microorganisms
Organisms Parameter End-point Concentration Reference
Soil EC10 and EC50 inhibition of CO2 production 4.2 and 22 mg/kg for silt loam soil Chang &
microorganisms amended with alfalfa and sludge Broadbent (1981)
EC50 inhibition of soil 29 mg/kg for soil enriched with 1% Rogers & Li
dehydrogenase activity alfalfa; 53 mg/kg for soil not enriched (1985)
45-day EC50 soil respiration 320 and 3200 mg/kg resulted in Lighthart et
35 and 60% inhibition al. (1983)
5-h EC50 inhibition of soil urease inhibition between 13% and 16% Bremner &
activity Douglas (1971)
6-week EC50 inhibition of urease activity 260 mg/kg in sand to 4200 mg/kg Doelman &
in sandy peat Haanstra (1986)
18-month EC50 glutamic acid reduction 55 mg/kg in sand to 1000 mg/kg Haanstra &
(significant time in sandy peat Doelman (1984)
reduction)
18-month ED50 reduction of arylsulfatase 287 mg/kg in sand to 6991 mg/kg Haanstra &
activity in sandy peat Doelman (1991)
6-month EC50 microbial biomass 890 mg/kg in sandy loam; Frostegard et
4321 mg/kg in humus al. (1993)
15-week EC50 population growth up to 5000 mg/kg when exposed in El-Sharouny et
soil; 10 mg/kg when exposed in agar al. (1988)
Soil ciliate 7-day EC10 and population growth 331.5 and 971.6 µg/litre Janssen et al.
(Colpoda EC50 (1995)
cucculus)
Haanstra & Doelman (1984) report that copper significantly
reduced glutamic acid decomposition time, in an 18-month incubation,
at 55 mg/kg in sand, at 400 mg/kg in silty loam and clay and at 1000
mg/kg in sandy peat. Haanstra & Doelman (1991) calculated 18-month
ED50s, based on reduction of arylsulfatase activity, ranging from 287
mg Cu/kg (4.51 mmol/kg) in sand to 6991 mg Cu/kg (110 mmol/kg) in
sandy peat.
Frostegård et al. (1993) incubated forest humus and arable soil
(sandy loam) with copper for 6 months at 22°C. EC50s, based on a
decrease in the ATP content, were 4321 and 890 mg Cu/kg (68 and 14
mmol/kg) for the two soils, respectively. An EC50, based on a
reduction in respiration, was > 8134 mg Cu/kg (> 128 mmol/kg) for
forest humus. In both soil types, copper exposure caused gradual
changes in the phospholipid fatty acid composition.
El-Sharouny et al. (1988) studied the effects of copper (500,
2000 or 5000 mg/kg) on soil mycoflora. The application of copper
sulfate to the soil resulted in a significant increase in the count of
total fungi after 1 week. There was little further increase after 5
weeks but at the end of the 15-week exposure there were significant
increases. The increases were mainly due to Aspergillus niger,
A. sydowii, A. versicolor, Penicillium chrysogenum and
Rhizopus stolonifer. When similar species were exposed via agar
medium there were significant decreases at all copper exposures (10,
50 and 100 mg/kg), the highest exposure eliminating all but
Aspergillus niger which survived at very low levels.
Janssen et al. (1995) found the 7-day EC10 and EC50 for the soil
ciliate Colpoda cucculus, based on population growth, to be 331.5
and 971.6 µg Cu/litre (5.22 and 15.3 µmol/litre), respectively.
9.3.2 Aquatic organisms
9.3.2.1 Plants
Care should be taken in interpreting published algal assay
results for copper. Most of the algal assay EC50 results reported in
the literature refer to studies of cell division rate carried out in
full culture media. Culture media contain chemicals such as iron,
manganese, citrate, silicate and EDTA which bind copper and reduce its
toxicity. When the algal cells are removed from the culture medium,
washed, and the assay carried out in a natural water (seawater or
river water) the cell division rate is usually much more sensitive to
copper (Stauber & Florence, 1987; Stauber, 1995). Acute toxicity of
copper to freshwater and marine algae is summarized in Table 18.
Wurtsbaugh & Horne (1982) exposed a natural phytoplankton
association from Clear Lake, California, USA, to copper for a period
of 6 days. Chlorophyll a and nitrogen fixation were significantly
reduced at copper concentrations of > 20 µg/litre and carbon fixation
was significantly reduced at > 10 µg/litre. Biomass estimates
indicated that the blue-green alga Aphanizomenon flos-aquae was more
sensitive to copper than were diatoms.
Wong & Chang (1991) reported that copper concentrations of 250
µg/litre significantly reduced the growth rate of
Chlorella pyrenoidosa: the alga did not grow at copper
concentrations of 500 and 750 µg/litre. Photosynthetic rate and
chlorophyll a during the log phase were significantly reduced at 100
µg Cu/litre.
Metaxas & Lewis (1991) found that the marine diatoms
Skeletonema costatum and Nitzschia thermalis did not grow at total
copper concentrations above 32 µg/litre (0.5 µmol/litre) and 38
µg/litre (0.6 µmol/litre), respectively. At lower concentrations
Skeletonema showed increasing growth rate and lag phase with
increasing copper concentrations whereas Nitzschia showed decreasing
growth with increasing copper exposure.
Visviki & Rachlin (1994b) studied the effects of copper on the
algae Dunaliella salina and Chlamydomonas bullosa in acute (96 h)
and chronic (8 month) exposures. Acute exposures of 378 and 49.6 µg
Cu/litre (5.94 and 0.78 µmol/litre) for the two species, respectively,
had no significant effect on the ultrastructure of cells. However,
chronic exposure (0.03 µg Cu/litre (4.9 × 10⁻⁴ µmol/litre)) caused
significant increases in lipid number and relative volume of
Dunaliella and significant increases in cell volume, and decreases
in periplasmalemmal space and cell wall relative volumes in
Chlamydomonas.
A 50% reduction in the total algal cell volume of
Selenastrum capricornutum in standard algal assay medium (SAAM)
occurred at 85 µg Cu/litre after 14 days. For
Chlorella stigmatophora grown in 28% artificial seawater plus SAAM
for 21 days a value of 70 µg Cu/litre was found for the same parameter
(Christensen et al., 1979).
Winner & Owen (1991a) found that copper (20 and 40 µg/litre)
caused significant reductions in community richness of phytoplankton
exposed for 5 week periods during different seasons of the year.
Copper significantly changed the algal divisions (percentage
composition of total phytoplankton) during the spring and autumn but
not during the summer.
Winner & Owen (1991b) exposed the green alga
Chlamydomonas reinhardii to copper in 72-h tests. The NOECs based on
deflagellation and changes in cell density varied from 12.2 to 49.1 µg
Cu/litre and from 12.2 to 43.0 µg Cu/litre for the two parameters,
respectively.
Schäfer et al. (1993) found 7-day and 10-day EC50s, based on
growth inhibition, to be 31.5 µg Cu/litre for the green alga
Chlamydomonas reinhardii in flow-through tests with copper sulfate.
Table 18. Toxicity of copper to algae
Organism Conditionsa Temperature Copper salt Parameter End-point Concentration NOEC Reference
(°C) (µg/litre) (µg/litre)
Green alga stat 20 sulfate 72-h EC50 growth inhibition 79 5 Schafer et al.
(Chlamydomonas (1994)
reinhardii) flow 24 sulfate 96-h EC50 growth inhibition 47 ND Schafer et al.
(1993)
Green alga stat 24-26 sulfate 72-h EC50 growth inhibition 47 ND Nyholm (1990)
(Selenastrum capricornutum) stat 24-26 sulfate 72-h EC50 biomass 35 ND Nyholm (1990)
Marine alga 15 chloride 96-h EC50 growth inhibition 50 ND Visviki &
(Chlamydomonas bullosa) Rachlin (1994a)
Green alga stat 20 sulfate 72-h EC50 growth inhibition 120 5.6 Schafer et al.
(Scenedesmus subspicata) (1994)
Marine alga ND 15 chloride 96-h EC50 growth inhibition 481 ND Visviki &
(Dunaliella minuta) Rachlin (1991)
Marine alga ND 15 chloride 96-h EC50 growth inhibition 377 ND Visviki &
(Dunaliella salina) Rachlin (1994a)
a Stat = static conditions (water unchanged for duration of test); flow = flow-through conditions (copper concentration in water continuously
maintained); ND = no data available.
Shanmukhappa & Neelakantan (1990) exposed the unicellular algae
Synechosystis aquatilis to copper. They found 6-h EC50s, based on
chlorophyll reduction, were 650 µg Cu/litre. A slightly reduced EC50
(720 µg Cu/litre) was found when algae were exposed to copper in the
presence of humic acid (10 µg/litre).
There are several studies which have assessed the effects of
copper on various marine algae. Hall et al. (1979) found that the
growth rate (as measured by an increase in wet weight) of
Ectocarpus siliculosus (a tolerant strain) decreased from a mean
value of 756% in controls to 86% in algae exposed to 500 µg Cu/litre.
The nontolerant strain was unable to grow under the two experimental
copper exposures (250 and 500 µg/litre).
Reed & Moffat (1983) studied the responses of tolerant and
nontolerant isolates of the green alga Enteromorpha compressa to
copper concentrations of up to 610 µg/litre (9.6 µmol/litre). They
found that none of the physiological processes that were tested (cell
viability, net photosynthesis, intracellular potassium and
dimethylsulfoniopropionate content) were affected by the highest
exposure concentration with the tolerant isolate. However, the
nontolerant isolate showed symptoms of copper toxicity at all copper
exposures ranging from 114 to 610 µg/litre (1.8 to 9.6 µmol/litre).
The authors concluded that this copper tolerance was genetically
determined as the progeny retained the same pattern of response to
copper enrichments. On the other hand, Correa et al. (1996) found
that the progeny of copper-tolerant isolates of
Enteromorpha compressa from northern Chile responded in the same
manner as the progeny of non-tolerant isolates of the same species.
Chilean Enteromorpha compressa grew well at 100 µg Cu/litre (from a
copper-polluted site) and at 10 µg Cu/litre (from a nonpolluted site)
and it was concluded that physiological plasticity rather than
genotype was involved in tolerance to copper.
Stauber & Florence (1987) found that copper ions depressed both
cell division and photosynthesis in the marine diatom
Asterionella glacialis (101.6 µg Cu/litre; 1.6 × 10⁻⁶ mol/litre)
and the freshwater green alga Chlorella pyrenoidosa (63.5 µg
Cu/litre; 10 × 10-7 mol per litre). Ionic copper concentrations
(176.5 µg Cu/litre; 27.8 × 10⁻⁷ mol per litre) which were inhibitory
to cell division in the marine diatom Nitzchia closterium had no
effect on photosynthesis, respiration, ATP production, electron
transport or membrane ultrastructure. The authors suggest that the
main toxic effect of copper on N. closterium is to act within the
cytosol; a different toxic mechanism was apparently operating with
A. glacialis and C. pyrenoidosa because both cell division and
photosynthesis were affected by copper. Lipid-soluble organocopper
complexes were found to be much more toxic than ionic copper. Stauber
& Florence (1985a,b) showed that the toxicity of ionic copper to
Nitzchia closterium was reduced by the addition of manganese(III)
and iron(III) hydroxides to the culture medium. Stauber & Florence
(1987) demonstrated that the addition to the algal growth medium of
trivalent metal ions such as aluminium, iron, chromium, or divalent
metals such as manganese and cobalt (which can be oxidized by algae to
trivalent species) reduced the toxicity of copper ions. The trivalent
species form a layer of hydrated metal oxide around the cell which
adsorbs copper ions.
Chung & Brinkhuis (1986) assessed the effects of copper at 5, 10,
50, 100 and 500 µg/litre on the early stages of development in the
kelp Laminaria saccharina. It was found that the release of
meiospores from copper-tested sorus materials was reduced by
concentrations of 50 µg Cu/litre. Settlement and germination of
meiospores were not affected by concentrations of up to 500 µg
Cu/litre. Development of gametophytes and gametogenesis were delayed
at concentrations of > 50 µg Cu/litre. Growth of the sporophytes was
inhibited at concentrations > 10 µg Cu/litre. Hopkin & Kain (1978)
found that sporophyte growth and gametophyte germination of
Laminaria hyperborea were inhibited at 10 and 100 µg Cu/litre,
respectively.
Brown & Rattigan (1979) exposed the pondweeds Elodea canadensis
and Lemna minor to copper. A 24-h IC50 (photosynthetic oxygen
evolution) was calculated to be 150 µg Cu/litre for Elodea. In
28-day tests copper concentrations of 3100 and 130 µg/litre caused 50%
plant damage in Elodea and L. minor, respectively. Dirilgen &
Inel (1994) calculated a 7-day IC50, based on frond growth, to be
1540 µg Cu/litre for the duckweed Lemna minor.
9.3.2.2 Invertebrates
Acute and short-term toxicity
The acute toxicity of copper to freshwater and marine
invertebrates are summarized in Tables 19 and 20, respectively. For
freshwater invertebrates 48-h L(E)C50s range from 5 µg Cu/litre for a
daphnid species to 5300 µg Cu/litre for an ostracod; 96-h LC50s for
marine invertebrates range from 29 µg Cu/litre for the bay scallop to
9400 µg Cu/litre for the fiddler crab.
Kaitala (1988) reported an 8-day LC50 for mussels
(Mytilus edulis) at 127 µg Cu/litre and a 10-day LC50 for clams
(Macoma baltica) at 54 µg Cu/litre. Beaumont et al. (1987) exposed
veliger larvae of common mussel (M. edulis) and scallop
(Pecten maximus) to copper for 15 days. LC50s were calculated to
be 400 and 85 µg Cu/litre for the two species, respectively.
Centeno et al. (1993) studied the effect of temperature (10-30°C)
on the 24-h LC50 of copper on the third instar of the crustacean
Streptocephalus proboscideus. A significant increase in toxicity was
observed at the highest temperature tested. Zou & Bu (1994) observed
an increase in the acute toxicity of copper to the water flea
Moina irrasa with increasing temperature (20-30°C). Snell et al.
(1991) found that the acute toxicity of copper to the rotifer
Brachionus calyciflorus was significantly increased at 10, 25 and
30°C when compared with tests at both 15 and 20°C.
Table 19. Acute toxicity of copper to freshwater invertebrates (24-h to 96-h L(E)C50s)a
Organism Size/ age Conditionsb Temperature Hardness (mg pH Copper Parameter Concentration Reference
(°C) CaCO3/litre) salt (µg/litre)
Snails
Amnicola sp. eggs stat 17 50 7.6 ND 24-h LC50 4500 Rehwoldt et al.
eggs stat 17 50 7.6 ND 96-h LC50 9300 (1973)
adult stat 17 50 7.6 ND 24-h LC50 1500 Rehwoldt et al.
adult stat 17 50 7.6 ND 96-h LC50 900 (1973)
Goniobasis ND stat 15 154 8.5 sulfate 96-h LC50 390 Paulson et al.
livescens (1983)
Lithoglyphus ND flow 15 22 7.2 chloride 96-h LC50 8 Nebeker et
virens al. (1986)
Juga plecifera ND flow 15 22 7.2 chloride 96-h LC50 15 Nebeker et
al. (1986)
Physa integra ND flow 15 45 7.7 sulfate 96-h LC50 39 Arthur &
Leonard (1970)
Campeloma ND flow 15 45 7.7 sulfate 96-h LC50 1700 Arthur &
decisum Leonard (1970)
Gastropod
Potamopyrgus juvenile flow 15 298 8.0 sulfate 48-h LC50 58 Watton &
jenkinsi juvenile flow 15 298 8.0 sulfate 96-h LC50 54 Hawkes (1984)
prime adult flow 15 298 8.0 sulfate 48-h LC50 112 Watton &
prime adult flow 15 298 8.0 sulfate 96-h LC50 77 Hawkes (1984)
senescent flow 15 298 8.0 sulfate 48-h LC50 87 Watton &
adult Hawkes (1984)
senescent flow 15 298 8.0 sulfate 96-h LC50 79
adult
Table 19. (continued)
Organism Size/ age Conditionsb Temperature Hardness (mg pH Copper Parameter Concentration Reference
(°C) CaCO3/litre) salt (µg/litre)
Bristle worm
Nais sp. ND stat 17 50 7.6 ND 24-h LC50 2300 Rehwoldt et al.
ND stat 17 50 7.6 ND 96-h LC50 90 (1973)
Oligochaete
Lumbriculus ND stat 25 290 6.6 nitrate 96-h LC50 130 Shubauer-Berigan
variegatus ND stat 25 290 7.3 nitrate 96-h LC50 270 et al.
ND stat 25 290 8.3 nitrate 96-h LC50 500 (1993)
Water fleas
Daphnia magna 6-24 h stat 25 80-100 7.4-7.8 sulfate 24-h LC50 380 Ferrando et
al. (1992)
ND stat 17-19 44-53 7.4-8.2 chloride 48-h EC50 9.8 Biesinger &
ND stat 17-19 44-53 7.4-8.2 chloride 48-h EC50 60 with food Christensen
(1972)
< 24 h stat 21.6 143 7.1-7.9 oxide 48-h EC50 26 Lewis (1983)
ND stat ND 175 8.1 sulfate 48-h EC50 23-27c LeBlanc (1982)
< 24 h stat 20 ND 6.5 sulfate 48-h LC50 7 Oikari et al.
< 24 h stat 20 ND 6.5 sulfate 48-h LC50 45 humic (1992)
water
< 24 h stat ND 45 7.2-7.4 48-h LC50 54 Mount &
< 24 h stat ND 45 7.2-7.4 48-h LC50 53 Norberg (1984)
< 24 h stat 20 130-160 8.2-9.5 sulfate 72-h LC50 86.5 Winner &
Daphnia pulex < 24 h stat 20 130-160 8.2-9.5 sulfate 72-h LC50 86 Farrell (1976)
Daphnia parvula < 24 h stat 20 130-160 8.2-9.5 sulfate 72-h LC50 72 Winner &
Daphnia ambigua < 24 h stat 20 130-160 8.2-9.5 sulfate 72-h LC50 67.7 Farrell (1976)
ND stat$ 28.5 200 7.9 48-h LC50 54.6 Vardia et al.
Daphnia ND ND ND ND ND 96-h LC50 9.4 (1988)
lumholtzi
Daphnia hyalina 1.27 mm stat 10 ND 7.2 chloride 48-h LC50 5 Baudouin &
Scoppa (1974)
Table 19. (continued)
Organism Size/ age Conditionsb Temperature Hardness (mg pH Copper Parameter Concentration Reference
(°C) CaCO3/litre) salt (µg/litre)
Moina irrasa < 24 h stat 20 < 5 8.0 chloride 48-h LC50 5.9 Zou & Bu (1994)
Moina macrocopa ND stat$ 24-27 ND 6.5 sulfate 48-h LC50 80 Wong (1992)
Ceriodaphnia < 12 h stat 25 57 8.2 sulfate 48-h LC50 13.4 Oris et al. (1991)
dubia < 12 h stat 25 45 7.7 ND 48-h LC50 17-32d Belanger et al.
< 12 h stat 25 179 8.3 ND 48-h LC50 67e (1989)
< 12 h stat 25 94 8.15 ND 48-h LC50 34-37d Belanger et al.
< 12 h stat 25 179 8.3 ND 48-h LC50 78-81e (1989)
ND stat 25 290 6.2 nitrate 48-h LC50 9.5 Schubauer-Berigan
ND stat 25 290 7.1 nitrate 48-h LC50 28 et al.
ND stat 25 290 8.6 nitrate 48-h LC50 200 (1993)
Ceriodaphnia < 4 h stat ND 45 7.2-7.4 ND 48-h LC50 17 Mount &
reticulata Norberg (1984)
Simocephalus < 24 h stat ND 45 7.2-7.4 ND 48-h LC50 57 Mount &
vetulus Norberg (1984)
Copepods
Cyclops 1.27 mm stat 10 ND 7.2 chloride 48-h LC50 2500 Baudouin &
abyssorum Scoppa (1974)
Eudiaptomus 1.27 mm stat 10 ND 7.2 chloride 48-h LC50 500 Baudouin &
padanus Scoppa (1974)
Amphipods ND stat 17 50 7.6 ND 24-h LC50 1200 Rehwoldt et al.
Gammarus sp. ND stat 17 50 7.6 ND 96-h LC50 910 (1973)
Gammarus 3-5 mm stat$ 12 151 6.8-7.2 ND 48-h LC50 47 Taylor et al.
pulex 3-5 mm stat$ 12 151 6.8-7.2 ND 96-h LC50 37 (1991)
ND stat$ ND 104 8.33 ND 48-h LC50 41 Stephenson
ND stat$ ND 104 8.33 ND 96-h LC50 21 (1983)
Table 19. (continued)
Organism Size/ age Conditionsb Temperature Hardness (mg pH Copper Parameter Concentration Reference
(°C) CaCO3/litre) salt (µg/litre)
G. pulex ND stat$ ND 249 8.33 ND 48-h LC50 183 Stephenson
(contd). ND stat$ ND 249 8.33 ND 96-h LC50 109 (1983)
Gammarus ND stat 8 240 8.1 chloride 24-h LC50 179 Pantani et al.
italicus (1990)
Gammarus ND flow 15 45 7.7 sulfate 96-h LC50 20 Arthur &
pseudolimnaeus Leonard (1970)
Hyallela azteca ND stat 25 290 6.2 nitrate 96-h LC50 17 Scubauer-
ND stat 25 290 7.1 nitrate 96-h LC50 24 Berigan et al.
ND stat 25 290 8.4 nitrate 96-h LC50 87 (1993)
Echinogammarus ND stat 7.5-8.5 240 7.9 chloride 96-h LC50 720 Pantani et al.
tibaldii (1995)
Crangonyx 4 mm stat 13 50 6.75 sulfate 48-h LC50 2440 Martin &
pseudogracilis 4 mm stat 13 50 6.75 sulfate 96-h LC50 1290 Holdich (1986)
Isopod
Asellus 7 mm stat 13 50 6.75 sulfate 96-h LC50 9210 Martin &
aquaticus Holdich (1986)
Ostracod
Cypris ND stat$ 28.5 200 7.9 ND 48-h LC50 5363 Vardia et al.
subglobosa 96-h LC50 277.3 (1988)
Rotifers
Brachionus juvenile stat 20 36.2 7.3 sulfate 24-h LC50 200 Couillard et al.
calyciflorus (1989)
ND stat 25 24-h LC50 26 Snell et al.
(1991)
ND stat 25 80-100 7.4-7.8 sulfate 24-h LC50 76 Ferrando et al.
(1992)
Table 19. (continued)
Organism Size/ age Conditionsb Temperature Hardness (mg pH Copper Parameter Concentration Reference
(°C) CaCO3/litre) salt (µg/litre)
Brachionus neonate stat 25 80-100 7.4-7.8 sulfate 24-h LC50 19 Snell &
rubens Persoone
(1989b)
Keratella ND stat 20 ND 8.3 chloride 24-h LC50 101 Borgmann &
cochlearis Ralph (1984)
Anostracan
crustacean
Streptocephalus 2nd/3rd ND 20 8-10 6.4-6.6 sulfate 24-h LC50 120 Centeno et al.
proboscideus instar (1993)
2nd/3rd ND 20 71-110 7.6-7.8 sulfate 24-h LC50 210 Centeno et al.
instar (1993)
2nd/3rd ND 20 250-327 7.9-8.2 sulfate 24-h LC50 520 Centeno et al.
instar (1993)
Freshwater adult flow 15 17 6.96 sulfate 96-h LC50 34 (total Cu) Daly et al.
shrimp (1990a)
Paratya adult flow 15 17 6.96 sulfate 96-h LC50 16 (Cu ion) Daly et al.
australiensis (1990a)
Midges
Chironomus sp. ND stat 17 50 7.6 ND 24-h LC50 650 Rehwoldt et al.
ND stat 17 50 7.6 ND 96-h LC50 30 (1973)
Chironomus 3rd instar stat 13 25 6.3 sulfate 48-h EC50 327 Khangarot &
tentans Ray (1989)
1st instar stat 19-22 42.7 7.6 sulfate 96-h EC50 16.7 Gauss et al.
1st instar stat 19-22 109.6 7.8 sulfate 96-h EC50 36.5 (1985)
1st instar stat 19-22 172.3 8.1 sulfate 96-h EC50 98.2 Gauss et al.
4th instar stat 19-22 42.7 7.6 sulfate 96-h EC50 211 (1985)
4th instar stat 19-22 109.6 7.8 sulfate 96-h EC50 977 Gauss et al.
4th instar stat 19-22 172.3 8.1 sulfate 96-h EC50 1184 (1985)
Table 19. (continued)
Organism Size/ age Conditionsb Temperature Hardness (mg pH Copper Parameter Concentration Reference
(°C) CaCO3/litre) salt (µg/litre)
C. tentans 1st instar stat$ 20 71 ND chloride 96-h LC50 298 Nebeker et al.
(contd). 2nd instar flow 20 84 ND chloride 96-h LC50 773 (1984a)
3rd instar flow 20 84 ND chloride 96-h LC50 1446 Nebeker et al.
4th instar flow 20 84 ND chloride 96-h LC50 1690 (1984a)
Chironomus 4th instar stat 20 40-48 7.2-7.6 sulfate 48-h LC50 739 Kosalwat &
decorus Knight (1987a)
Chironomus 2nd instar stat$ 12 151 6.8-7.2 48-h LC50 1200 Taylor et al.
riparius 2nd instar stat$ 12 151 6.8-7.2 96-h LC50 700 (1991)
a EC50s based on immobilization; ND = no data available.
b Stat = static conditions (water unchanged for duration of test); stat$ = static renewal conditions
(water changed at regular intervals); flow = flow-through conditions (copper concentration in water
continuously maintained).
c Range of means for three duplicate tests.
d Range of tests from different culture sources; parental diet was synthetic.
e Range of tests from different culture sources; parental diet was algal.
Table 20. Acute toxicity of copper to marine invertebrates (24-h to 96-h L(E)C50S)a
Organism Size/age Conditionsb Temperature Salinity pH Salt Parameter Concentration Reference
(°C) (%) (µg/litre)
Bay scallop juvenile stat$ 20 25 ND chloride 96-h LC50 29 Nelson et al.
Argopecten (1988)
irradians
Surf clam juvenile stat$ 20 25 ND chloride 96-h LC50 51 Nelson et al.
Spisula (1988)
solidissima
Squid larvae stat 8.6 30 8.1 chloride 96-h LC50 309 Dinnell et al.
Loligo opalescens (1989)
Cabezon larvae stat 8.3 27 7.9 chloride 96-h LC50 95 Dinnell et al.
Scorpaenichthys (1989)
marmoratus
Amphipod 24 h stat 20 32 ND sulfate 96-h LC50 110 Ahsanullah &
Allorchestes adult stat 20 32 ND sulfate 96-h LC50 500 Florence (1984)
compressa
American lobster larvae stat 20 30.5 ND nitrate 96-h LC50 48 Johnson &
Homarus Gentile (1979)
americanus
Dungeness crab larvae stat 8.5 30 8.1 chloride 96-h LC50 96 Dinnell et al.
Cancer magister (1989)
Fiddler crab 24-29 mm stat 29 25 ND sulfate 96-h LC50 9420 Devi (1987)
Uca annulipes 24-29 mm stat 29 25 ND sulfate 96-h LC50 12 820c Devi (1987)
Fiddler crab 24-29 mm stat 29 25 ND sulfate 96-h LC50 8380 Devi (1987)
Uca triangularis 24-29 mm stat 29 25 ND sulfate 96-h LC50 14 810c Devi (1987)
Table 20. (continued)
Organism Size/age Conditionsb Temperature Salinity pH Salt Parameter Concentration Reference
(°C) (%) (µg/litre)
Ragworm 20 mm stat 12 7.3 ND nitrate 96-h LC50 357 Ozoh (1992a)
Hediste 20 mm stat 12 29.2 ND nitrate 96-h LC50 512 Ozoh (1992a)
diversicolor 20 mm stat 22 7.3 ND nitrate 96-h LC50 247 Ozoh (1992a)
20 mm stat 22 29.2 ND nitrate 96-h LC50 500 Ozoh (1992a)
Copepods
Tisbe battagliai nauplius stat$ 20 34-35 6.2-8.2 nitrate 96-h LC50 64Hutchinson et
adult stat$ 20 34-35 6.2-8.2 nitrate 96-h LC50 88al. (1994)
Tisbe holothuriae ND stat 22 38 ND sulfate 48-h LC50 370 Verriopoulos
& Dimas (1988)
Rotifer
Brachionus neonate stat 25 15 7.7 ND 24-h LC50 120 Snell &
plicatilis neonate stat 25 30 7.7 ND 24-h LC50 130 Persoone
(1989a)
Sand shrimp adult flow 13.7 30.1 7.9 chloride 96-h LC50 898 Dinnell et al.
Crangon sp. (1989)
Penaeid shrimp protozoeal stat 27 30-34 8.7 sulfate 48-h LC50 160 Wong
Metapenaeus mysid stat 27 30-34 8.7 sulfate 48-h LC50 1580 et al.
ensis postlarva stat 27 30-34 8.7 sulfate 48-h LC50 4760 (1993)
Mysid shrimp 3 days stat ND ND chloride 96-h LC50 17 Martin et al.
Holmesimysis (1989)
costata
Grass shrimp
Palaemonetes juvenile stat$ 20 10 ND ND 48-h LC50 2100 Burton &
pugio Fisher (1990)
ND stat 22 25 8.3-8.7 acetate 96-h LC50 3700Curtis et al.
(1979)
Table 20. (continued)
a EC50s based on immobilization; ND = no data available.
b Stat = static conditions (water unchanged for duration of test); stat$ = static renewal conditions (water changed at regular intervals);
flow = flow-through conditions (copper concentration in water continuously maintained).
c Animals collected from a polluted site (6.8-30.6 µg Cu/litre).
Ozoh (1992c) found that sediment affected the acute response of
both juvenile and adult ragworms (Hediste diversicolor) to copper.
Without sediment, increasing salinity (7.3 to 30.5%) and increasing
temperature (12 to 22°C) reduced the acute toxicity of copper, whereas
in the presence of sediment increasing temperature and increasing
salinity increased the acute toxicity of copper.
Snell & Persoone (1989a,b) exposed neonate rotifers to copper for
24 h; NOEC was 20 µg Cu/litre at a salinity of 15%, 50 µg Cu/litre at
30% for the marine rotifer Brachionus plicatilis and 9.4 µg/litre
for the freshwater rotifer Brachionus rubens. Ozoh & Jones (1990)
studied the effects of salinity and temperature on the toxicity of
copper to ragworm (Hediste diversicolor) in 96-h tests. Larvae at 1
day old were more susceptible to copper than at 7 days old.
Increasing salinity from 7.6 to 30.5% reduced copper toxicity.
Stephenson (1983) reported that copper was 4-6 times more toxic
to Gammarus pulex in soft water (100 mg CaCO3/litre) than in hard
water (250 mg CaCO3/litre). Similar findings were reported by Gauss
et al. (1985) for first and fourth instar midge Chironomus tentans
exposed to copper in acute toxicity tests. First instar larvae were
the most sensitive with 96-h EC50s, based on immobilization, at 16.7
µg Cu/litre in soft water (40 mg CaCO3/litre) and 98.2 µg Cu/litre in
hard water (170 mg CaCO3/litre). The 48-h LC50s of copper to
Ceriodaphnia dubia increased from 35 to 79 µg/litre when the water
hardness was increased from 94 to 170 mg CaCO3/litre (Belanger et
al., 1989). Increasing the hardness from 8-10 to 250-327 mg
CaCO3/litre decreased the 24-h LC50 of copper to the third instar of
the crustacean Streptocephalus proboscideus irrespective of the
temperature (Centeno et al., 1993). In similar tests a significant
increase in toxicity was noted at pH 6.0 when compared with tests
carried out at pHs ranging from 7.6 to 10.0.
Shaner & Knight (1985) found that alkalinity had a significant
effect on the acute toxicity of copper-bearing sediments to
Daphnia magna. The 24-h LC50s were 1332 and 1578 mg/kg at
alkalinities of 600 and 1000 mg bicarbonate/litre, respectively.
LC50s predicted by multiple regression models calculated levels
ranging from 1146 to 5966 mg/kg at alkalinities ranging from 571 to
2286 mg bicarbonate/litre.
The addition of humic acid reduced the acute toxicity of copper
to daphnids. The mean 72-h LC50 increased from 28.3 µg Cu/litre in
water containing no added humic acid to 53.2 µg Cu/litre in water to
which 1.5 mg humic acid/litre had been added (Winner, 1984). Giesy et
al. (1983) showed a positive correlation between LC50 values for
exposure of Simocephalus serrulatus to copper and total dissolved
carbon concentration. Pantani et al. (1995) reported similar results
for the amphipod Echinogammarus tibaldii with the acute toxicity of
copper being reduced by the addition of humic acid, fluvial sediment
or bentonite. Humic acid significantly reduced the acute toxicity of
copper to Daphnia pulex at all levels of water hardness tested (58,
115, and 230 mg CaCO3/litre) (Winner, 1985). Winner (1984) exposed
Daphnia pulex to 30 µg Cu/litre in the presence of varying amounts
of humic acid for up to 30 days. Daphnids showed significantly better
survival in water containing 0.38, 0.75 or 1.50 mg humic acid/litre
than in water to which no humic acid had been added. In the absence of
humic acid only one brood of young was produced because of premature
deaths of females. The addition of 0.38 mg humic acid/litre produced
49 broods but the mean brood size was significantly smaller than humic
acid controls. Daphnids maintained on 30 µg Cu/litre and 1.50 mg
humic acid/litre produced 101 broods with brood sizes significantly
larger than humic acid controls. Meador (1991) determined that humic
acid decreased the toxicity of Daphnia magna on the basis of total
copper, but toxicity was constant on the basis of cupric ion activity.
In contrast, Borgmann & Ralph (1983) and Borgmann & Charlton (1984)
found that free metal concentrations did not provide a constant
measure of copper toxicity to Daphnia magna as organic matter
concentrations changed.
McLeese & Ray (1986) found the toxicity of copper to the marine
shrimps Crangon septemspinosa and Pandalus montagui to be reduced
when complexed with EDTA. LC50s (144-h) were 1400 and 50 µg
CuCl2/litre for the two species, respectively, whereas LC50s for
copper-EDTA complexes were > 30 000 µg/litre. However, 144-h LC50s
for the clam Macoma balthica were 6000 µg/litre regardless of the
form of copper exposure. In solutions containing nitrilotriacetic
acid (NTA) or glycine, uncomplexed copper(II) ions were found to be
the most acutely toxic form of copper to the freshwater shrimp
Paratya australiensis. However, although the copper-NTA complex did
not contribute to the toxic effect, the copper-glycine complex appears
to be mildly toxic (Daly et al., 1990a). The acute toxicity of copper
to P. australiensis was shown to decrease in solutions of increasing
alkalinity. Additional experiments revealed that the tolerance to
copper at higher alkalinities was caused by a combination of
physiological effects associated with increased ionic strength of the
test waters and changes in metal speciation (Daly et al., 1990b). The
presence of natural organic matter significantly reduced the toxicity
of copper to P. australiensis (Daly et al., 1990c). Daly et al.
(1992) found that post-moult shrimps were more sensitive to acute
copper toxicity than individuals at other stages of the moult cycle.
Baird et al. (1991) found that the 48-h EC50 for different
clones of Daphnia magna ranged from 10.5 to 70.7 µg Cu/litre.
Pre-exposure of daphnids (Daphnia magna) to 10 µg Cu/litre resulted
in a significant reduction in the subsequent acute toxicity: 48-h
LC50s in pre-exposed animals ranged from 58 to 80 µg Cu/litre whereas
those of unexposed daphnids ranged from 23 to 27 µg Cu/litre (LeBlanc,
1982).
Collyard et al. (1994) found little effect of age class (0.2-22
days) on the acute (96-h) toxicity of copper to the amphipod
Hyallela azteca. With the exception of the 6-8-day age class, which
appeared to be the most sensitive to copper, the 95% confidence limits
overlapped for the different age groups. The 48-h LC50s for the
penaeid shrimp Metapenaeus ensis at different developmental stages
were 160 µg Cu/litre (protozoaeal), 1580 µg Cu/litre (mysid) and 4760
µg Cu/litre (post-larval), showing that tolerance to acute copper
toxicity increased with age (Wong et al., 1993).
Sosnowski et al. (1979) found that the sensitivity (72-h LC50)
of the copepod Acartia tonsa was strongly correlated with field
population density and food ration. The 72-h LC50s ranged from 9.0
to 78.0 µg Cu/litre. There was an inverse correlation between the log
LC50 and adult A. tonsa density at the time of collection. The log
LC50 increased with increasing food ration. Lewis (1983) exposed
Daphnia magna to copper in 48-h static toxicity tests at six
different loading densities. There was a trend of increasing toxicity
at the lower density levels. However, the differences in LC50 values
were not biologically significant, with the maximum difference being
approximately threefold.
Dave (1984) found the 48-h EC50, based on immobilization, for
unfed and fed daphnids (Daphnia magna) to be 6.5 and 18.5 µg
Cu/litre, respectively. Neonates of Ceriodaphnia dubia from mothers
reared on an algal diet were 1.4-1.5 times more resistant to copper in
acute toxicity tests than those reared on a synthetic diet (Belanger
et al., 1989).
Nell & Chvojka (1992) reported that copper concentrations of 8
µg/litre significantly reduced the growth of Sydney rock oysters
(Saccostrea commercialis) in 4-week studies. Exposure of oysters to
copper concentrations ranging from 8 to 64 µg/litre and 20 ng tributyl
tin oxide/litre showed an additive effect on growth.
Bodar et al. (1989) exposed parthenogenetic eggs of
Daphnia magna to copper concentrations of 1.0, 10 and 25 mg/litre.
Copper exposure at concentrations exceeding 1.0 mg/litre significantly
reduced the total development of daphnid eggs. However, stages 1 and
2 (which take about half of the development time from egg to juvenile)
showed only a slight decrease in the mean lifetime of individuals in
these stages at copper concentrations of 10 and 25 mg/litre.
Therefore the toxicity of copper, apparent in the total developmental
effect, is exerted at stages 3-6.
Hutchinson et al. (1994) exposed copepods (Tisbe battagliai) to
copper for 7 days. NOECs for nauplius survival, adult survival and
reproduction were 10, 18 and 6 µg Cu/litre, respectively; LOECs were
18, 32 and 10 µg Cu/litre, respectively. A subchronic value was
calculated as the geometric mean of the highest NOEC and the lowest
LOEC; these were 13 µg Cu/litre for nauplius survival, 24 µg Cu/litre
for adult survival and 8 µg Cu/litre for reproduction.
Long-term and reproductive toxicity
Ringwood (1992) exposed gametes and early life stages of sea
urchins (Echinometra mathaei) and the bivalve Isognomon
californicum to copper. EC50s, based on fertilization,
for sea urchins (1 h) and bivalves (2 h) were 14 and 55 µg Cu/litre,
respectively; NOECs were 5.0 and 20 µg Cu/litre, respectively. A 48-h
EC50 (embryo survival) was 7.0 µg Cu/litre with a NOEC of 1.0 µg
Cu/litre. A NOEC for bivalve growth (96 h) was 1.0 µg Cu/litre.
Stromgren & Nielsen (1991) studied the effect of copper on
spawning, growth and mortality in larval, juvenile and mature common
mussel (Mytilus edulis). EC50s, based on larval growth (10 days)
and adult spawning frequency (30 days), were 5-6 and 2 µg Cu/litre,
respectively. The larval 10-day LC50 was estimated to be
approximately 10 µg Cu/litre.
Macdonald et al. (1988) exposed yellow crab (Cancer anthonyi)
embryos to copper in 7-day tests. Copper concentrations > 1000
µg/litre significantly reduced survival. Hatching of embryos and
larval survival were significantly reduced at 10 µg Cu/litre; no
embryos hatched at copper concentrations of 100 µg/litre or more.
Biesinger & Christensen (1972) exposed Daphnia magna to copper
for 3 weeks. A 3-week LC50 of 44 µg Cu/litre was found; the 3-week
EC50, based on reproductive impairment, was 35 µg Cu/litre. Dave
(1984) reports a 21-day EC50 (immobilization) of 1.4 µg Cu/litre.
Cowgill & Milazzo (1991) carried out a three-brood toxicity test
on Ceriodaphnia dubia. EC50s based on total progeny, mean brood
number and mean brood size were found to be 357, 348 and 326 µg
Cu/litre for metallic copper, and 305, 341 and 304 µg Cu/litre for
copper nitrate.
Oris et al. (1991) studied the effects of copper on the
reproduction of the cladoceran Ceriodaphnia dubia. Chronic survival
values, which were calculated as the geometric mean between NOEC and
LOEC, were 34.6 and 24.5-34.6 µg Cu/litre for 4- and 7-day tests,
respectively. EC50s, based on mean total young per female, were
38.2-40.4 and 30.7-30.8 µg Cu/litre for the two tests, respectively.
In 21-day tests Daphnia magna showed 100% mortality at 110 µg
Cu/litre. No significant effect on the intrinsic rate of natural
increase was observed up to and including 36.8 µg Cu/litre. The
carapace length was significantly reduced at 36.8 µg Cu/litre (Van
Leeuwen et al., 1988).
LeBlanc (1985) studied the competitive interactions between
Daphnia magna and Daphnia pulex in 28 day exposures to copper (10
and 30 µg Cu/litre) . D. pulex populations consistently exceeded
D. magna populations when cocultured in the absence of copper or
temporary exposures to 10 µg Cu/litre. Exposure to 30 µg Cu/litre
severely reduced initial population growth of D. pulex without
affecting D. magna. By day 14 D. magna populations were dominant;
however, D. pulex population growth was not completely suppressed
and by the end of the experiment (28 days) D. pulex had gained
population dominance. The reduced size of D. magna suggested that
D. pulex was out-competing D. magna for available food.
Ingersoll & Winner (1982) carried out 70-day toxicity tests with
Daphnia pulex. There was no significant effect on reproduction but
survival was significantly reduced at 10 µg Cu/litre giving an NOEC of
5 µg Cu/litre. However, in pulse toxicity tests daphnids were exposed
to 20 µg Cu/litre for 360 min/day (an average water concentration of 5
µg Cu/litre). Pulse exposures resulting in significant decreases in
survival, brood size and body length, and delays in the age at which
young were first produced.
Winner & Farrell (1976) exposed four species of daphnid to copper
at concentrations ranging from 20 to 100 µg Cu/litre for up to 130
days. All four species exhibited reductions in survival at
concentrations > 40 µg Cu/litre. Daphnia magna exhibited a
decrease in the instantaneous rate of population growth at 60 µg
Cu/litre; whilst the same parameter was affected at > 40 µg Cu/litre
for D. pulex, D. parvula and D. ambigua. Daphnia ambigua produced
significantly smaller broods at concentrations > 40 µg Cu/litre
whereas mean brood size did not decrease in D. pulex and D. parvula
until the concentration exceeded 60 µg Cu/litre. Mean brood size in
D. magna was unaffected by copper exposure.
De Nicola Giudici & Migliore (1988) studied the long-term
toxicity of copper on the freshwater isopod Asellus aquaticus. In
30-day tests copper (5 µg Cu/litre) had no significant effect on
female survival or birth rate. There was no significant effect on
growth during embryonic development; however, copper treatment during
juvenile development reduced body growth in 90-day exposures.
The development and hatchability of midge (Chironomus decorus)
eggs were unaffected by copper (as copper sulfate) concentrations
ranging from 100 to 5000 µg/litre. All larvae survived a 72-h
exposure except those at 5000 µg Cu/litre which died after only
partial emergence. The growth of larvae was significantly reduced
when they were reared in copper-spiked food-substrate. An EC50 based
on growth was 1602 mg Cu/kg (Kosalwat & Knight, 1987b).
Hatakeyama (1988) studied the effects of copper on the
reproduction of chironomids (Polypedilum nubifer) through water
(10-40 µg Cu/litre) and food (22-5180 µg Cu/g dry weight). Emergence
success decreased to 74%, 38%, 16% and 2% of control values at 10, 20,
30 and 40 µg Cu/litre, respectively. The number of egg clusters
produced by adults also decreased in accordance with the increase in
copper concentration from 242 in controls to 31 at 30 µg Cu/litre; at
40 µg Cu/litre eggs were not oviposited. A significant decrease in
emergence success occurred with food contaminated with 1770 mg Cu/kg:
no emergence occurred at 5200 mg Cu/kg.
In flow-through life cycle tests with caddisfly
(Clistoronia magnifica) concentrations of > 17 µg Cu/litre
prevented completion of the life cycle, and a significant reduction in
adult emergence occurred at 13 µg Cu/litre. The NOEC was found to be
8.3 µg Cu/litre (Nebeker et al., 1984b).
Arthur & Leonard (1970) exposed the amphipod
Gammarus pseudolimnaeus and the snails Physa integra and
Campeloma decisum for 6 weeks to concentrations of 2.9-28.0 µg
Cu/litre. For all three species, reduced survival and other
significant adverse effects occurred at concentrations of 14.8 µg
Cu/litre and above, but no effects were noted at concentrations of 8.0
µg Cu/litre and below. In 100-day exposure to copper,
Gammarus pulex populations densities were not affected at
concentrations up to 11.0 µg Cu/litre, but were reduced at
concentrations of 14.6 µg Cu/litre and above (Maund et al., 1992).
Phipps et al. (1995) determined 10-day LC50s for the amphipod
Hyalella azteca, the dipteran larva Chironomus tentans, and the
oligochaete Lumbriculus variegatus to be 31, 54, and 35 µg Cu/litre,
respectively, in Lake Superior (Canada) water (21-24°C). Nebeker et
al. (1986) reported 30-day LC50s for the snails Juga plicifera and
Lithoglyphus virens to be less than 8 µg Cu/litre. The 11-week
LC50 for zebra mussel (Dreissena polymorpha) was reported to be
130 µg Cu/litre (Kraak et al., 1992). The marine copepod
(Tisbe furcata)was determined to have a 96-h LC50 of 178 µg
Cu/litre, but concentrations as low as 56 µg Cu/litre were estimated
to significantly reduce the intrinsic rate of population increase
(Bechmann, 1994).
Biochemical, physiological and behavioural effects
Lin et al. (1992) exposed Pacific oysters (Crassostrea gigas)
to copper; 8-16 mg Cu/litre caused a significant increase in
filtration rates whereas concentrations > 32 mg/litre reduced
filtration rates. Glycine uptake rate was inhibited and the volume
specific glycine transport declined in the presence of copper.
Krishnakumar et al. (1990) exposed green mussels
(Perna viridis) to 25 µg Cu/litre for 2 weeks. Copper decreased
ammonia-nitrogen excretion and significantly decreased filtration
rate, O : N ratio, the scope for growth and growth efficiency; there
was a nonsignificant increase in oxygen uptake. Microscopic
examination of digestive glands revealed a significant increase in
lysosomal lipofuscin content and percentage incidence of tubule
dilation. Digestive cells showed extensive vacuolation of the
cytoplasm. Copper exposure caused almost 100% cilia loss and tubule
dilation.
Kraak et al. (1992) studied the effect of copper on the
filtration rate in zebra mussel (Dreissena polymorpha) over a 9-11
week period. Filtration rate was unaffected at concentrations of 13
µg Cu/litre. Expressed as a percentage of the controls the average
filtration rates of mussels exposed to 53, 72 and 90 µg Cu/litre were
44%, 33% and 27%, respectively. The EC50, based on filtration rate,
did not differ significantly from the 48-h EC50 (41 µg Cu/litre;
Kraak et al., 1994) during 9 weeks (43 µg Cu/litre). The NOEC for the
same parameter over 48 h was 16 µg Cu/litre (Kraak et al., 1994).
Ferrando & Andreu (1993) calculated 24-h EC50s, based on
filtration and ingestion rates, to be 43 and 53 µg Cu/litre for
Brachionus calyciflorus and 59 and 90 µg Cu/litre for
Daphnia magna.
Redpath & Davenport (1988) studied the action of three metals on
pumping rate in the common mussel (Mytilus edulis); they found that
pumping was stopped by shell valve adduction at copper concentrations
in the range 20.8-25.6 µg Cu/litre.
Mussels (Mytilus galloprovincialis) exposed to 40 µg Cu/litre
showed a significant increase in the levels of malondialdehyde
(indicative of the peroxidative process) and a decrease in the
concentration of glutathione in gills and digestive gland. The
lipofuscin content in lysosome of the digestive gland was
significantly increased (Viarengo et al., 1990).
Gill and hepatopancreas glycogen levels were significantly
reduced in freshwater mussels (Lamellidens corrianus) exposed to
concen trations of 100, 200 or 400 µg Cu/litre for up to 168 h
(Rajalekshmi & Mohandas, 1993).
Ferrando et al. (1993) studied the feeding rates of rotifers
(Brachionus calyciflorus) fed on the microalgae. A 5-h EC50, based
on feeding rate, was calculated to be 32 µg Cu/litre.
Weeks (1993) found a significant reduction in the feeding rate of
the talitrid amphipod Orchestia gammarellus at dietary
concentrations of 688 mg Cu/kg during 48-h tests. However, no
significant effect was found at concentrations up to and including 817
mg Cu/kg in 20-day exposures.
Phelps et al. (1983) studied the effects of copper-enriched
sediment on the burrowing behaviour of littleneck clams
(Protothaca staminea). Above a threshold of 5.8 mg Cu/kg added to
dry sediment, the time for 50% of the clams to burrow (ET50)
increased logarithmically with increasing sediment copper
concentration. Clams exposed to sediment mixed with a strong
chelating agent and copper showed no significant change in burrowing
time.
Interactions with other chemicals
Konar & Mullick (1993) studied the toxicity of different metal
mixtures on zooplankton (Diaptomus forbesi) in 48-h acute tests.
Zinc and iron individually were found to behave antagonistically in
combination with copper but synergistically when all three metals were
in combination. Copper in combination with lead alone, zinc and lead,
iron and lead, and a combination of all four metals showed a
synergistic interaction.
Vranken et al. (1988) exposed free-living marine nematodes
(Monhystera disjuncta) to copper in metal mixtures (mercury, zinc
and nickel). In 96-h tests, based on survival, all paired metal
mixtures acted in a less than additive manner. However, in EC50
tests, based on developmental inhibition, the response was not as
clear cut: the joint effect of copper with zinc, and copper with
nickel was synergistic. Copper-mercury combinations did not reveal a
clear mode of interaction.
Kaitala (1988) found that the presence of copper ions stimulated
the accumulation of zinc and magnesium in mussels (Mytilus edulis).
Zinc concentrations were 25% higher and zinc 100% higher than in the
absence of copper. Copper did not influence the uptake of magnesium
in burrowing clams (Macoma baltica) and zinc was not accumulated at
all.
9.3.2.3 Vertebrates
Lethality and growth effects
The acute toxicity of copper to freshwater and marine fish is
summarized in Tables 21 and 22, respectively. The 96-h LC50s for
freshwater fish range from 2.58 µg Cu/litre (Arctic grayling) to 7340
µg Cu/litre (bluegill). For marine fish, 96-h LC50 values range from
60 µg Cu/litre for chinook salmon to 1690 µg Cu/litre for killifish.
However, a 48-h LC50 for killifish was calculated to be 19 000 µg
Cu/litre. The toxicity of copper to amphibia is summarized in Table
23. For larvae of Bufo melanostictus and Xenopus laevis,
respectively, 48-h LC50s of 446 and 1700 µg Cu/litre were found.
Erickson et al. (1996) found the acute toxicity of copper to
fathead minnow (Pimephales promelas) to vary widely depending on the
chemical characteristics of the water. Increased pH, hardness,
sodium, dissolved organic matter and suspended solids each caused
toxicity to decrease on the basis of total copper concentrations, and
96-h LC50s, based on total copper, ranged from 7 to 305 µg Cu/litre
(0.11 to 4.8 µmol/litre) over the whole range of conditions tested in
flow-through tests. The results did not show a particularly good
correlation of toxicity to cupric-ion-specific electrode measurements.
The authors concluded that the effects of the different test
conditions on copper speciation have an important role in determining
toxicity; however, factors unrelated to chemical speciation also
influenced toxicity.
Smith & Heath (1979) studied the effect of temperature on the
acute (24-h) toxicity of copper to five species of freshwater fish.
There was considerable variation between species. There was a tendency
for a higher sensitivity at higher temperatures in goldfish, channel
catfish and rainbow trout; the converse was found for bluegill.
However, the differences caused by temperature were a factor of 2 or
less whereas the interspecies differences were as much as sixfold.
Table 21. Acute toxicity of copper to freshwater fish (48-h and 96-h LC50S)
Organism Size/age Conditionsa Temperature Hardness (mg pH Copper Parameter Concentration Reference
(°C) CaCO3/litre)b salt (µg/litre)
Chinook salmon 0.66 g stat 11-13 211 7.4-8.3 sulfate (25.3%) 96-h LC50 58 Hamilton
&
Oncorhynchus 0.87 g stat 11-13 211 7.4-8.3 sulfate (25.3%) 96-h LC50 54 Buhl
(1990)
tshawytscha alevin flow 12 24 7.1 ND 96-h LC50 26 Chapman
swim-up flow 12 24 7.1 ND 96-h LC50 19 (1978)
parr flow 12 24 7.1 ND 96-h LC50 38 Chapman
smolt flow 12 24 7.1 ND 96-h LC50 26 (1978)
Coho salmon 0.41 g stat 12 41.3 7.1-8.0 sulfate 96-h LC50 15 Buhl &
Oncorhynchus Hamilton
kisutch (1990)
6 g stat$ 13.5 33 7.0-7.5 ND 96-h LC50 17 (Cu2+) Buckley
6 g stat$ 13.5 33 7.0-7.5 ND 96-h LC50 164 (1983)
(total Cu)
2.7 kg flow 9.4 20 7.29 chloride 96-h LC50 46 Chapman
&
Stevens
(1978)
Rainbow trout 0.60 g stat 12 41.3 7.1-8.0 sulfate 96-h LC50 13.8 Buhl &
Oncorhynchus Hamilton
mykiss (1990)
1 g stat 12 44 7.1 Count-N* 96-h LC50 20.4 Mayer &
1 g stat 12 44 7.1 Count-NS* 96-h LC50 121 Ellersieck
1.6 g stat 13 44 7.1 sulfate (98%) 96-h LC50 135 (1986)
alevin flow 12 24 7.1 ND 96-h LC50 28 Chapman
swim-up flow 12 24 7.1 ND 96-h LC50 17 (1978)
parr flow 12 24 7.1 ND 96-h LC50 18 Chapman
smolt flow 12 24 7.1 ND 96-h LC50 29 (1978)
adult flow 9.2 42 7.57 chloride 96-h LC50 57 Chapman
&
Stevens
(1978)
Table 21. (continued)
Organism Size/age Conditionsa Temperature Hardness (mg pH Copper Parameter Concentration Reference
(°C) CaCO3/litre)b salt (µg/litre)
Brook trout juvenile flow 12 ND ND sulfate 96-h LC50 110 McKim &
Salvelinus Benoit
fontinalis (1971)
Cutthroat trout 2.1 g flow 13 194 7.8 chloride 96-h LC50 83.3 Chakoumakos
Salmo clarki 9.4 g flow 13 194 7.8 chloride 96-h LC50 221 et al.
25.6 g flow 13 194 7.8 chloride 96-h LC50 243 (1979)
Arctic grayling alevin stat 12 41.3 7.1-8.0 sulfate 96-h LC50 23.9-131c Buhl &
Thymallus fry stat 12 41.3 7.1-8.0 sulfate 96-h LC50 9.6 Hamilton
arcticus 0.34 g stat 12 41.3 7.1-8.0 sulfate 96-h LC50 2.58 (1990)
Fathead minnow 1 g stat 17 44 7.1 Count-N* 96-h LC50 35.9 Mayer &
Pimephales 1.1 g stat 17 44 7.1 Count-NS* 96-h LC50 154 Ellersieck
promelas 1.2 g stat 18 272 7.4 sulfate (98%) 96-h LC50 838 (1986)
22 mm flow 20-26 202 7.5-8.2 sulfate 96-h LC50 490 Pickering
55 mm flow 20-26 202 7.5-8.2 sulfate 96-h LC50 460 et al.
(1977)
3.2-4.2 cm stat 22 40-48 7.2-7.9 acetate 96-h LC50 390 Curtis et
al.
(1979)
47 mm flow 24 200 (154) 8.0 ND 96-h LC50 490 Geckler
et al.
56 mm flow 24 200 (154) 8.0 ND 96-h LC50 440 (1976)
Bluntnose minnow 15-16 mm flow 25 200 7.9-8.3 sulfate 96-h LC50 230 Horning
&
Pimephales Neiheisel
notatus (1979)
84 mm flow 24 200 (154) 8.0 96-h LC50 340 Geckler
et al.
(1976)
Bluegill 1.2 g stat 17 44 7.1 Count-N* 96-h LC50 3280 Mayer &
Lepomis 1.2 g stat 17 44 7.1 Count-N* 96-h LC50 13 700 Ellersieck
macrochirus 1 g stat 24 44 7.4 oxychloride (99%) 96-h LC50 980 (1986)
Table 21. (continued)
Organism Size/age Conditionsa Temperature Hardness (mg pH Copper Parameter Concentration Reference
(°C) CaCO3/litre)b salt (µg/litre)
L. machrochirus 1.5 g stat 18 44 7.1 sulfate (98%) 96-h LC50 884 Mayer &
(contd). 1.5 g stat 18 272 7.4 sulfate (98%) 96-h LC50 7340 Ellersieck
(1986)
18.6 g flow 24 200 (154) 8.0 ND 96-h LC50 8300 Geckler
19.2 g flow 24 200 (154) 8.0 ND 96-h LC50 10 000 et al.
(1976)
Green sunfish 1.1 g stat 18 44 7.1 sulfate (98%) 96-h LC50 3510 Mayer &
Lepomis 1.1 g stat 18 272 7.4 sulfate (98%) 96-h LC50 3400 Ellersieck
cyanellus (1986)
Pumpkinseed ND stat 28 55 8.0 ND 96-h LC50 2700 Rehwoldt
et al.
Lepomis gibbosus (1972)
Goldfish 0.9 g stat 18 272 7.4 sulfate (98%) 96-h LC50 13 800 Mayer &
Carassius Ellersieck
auratus (1986)
Golden shiner ND flow ND 72.2 7.5 chloride 96-h LC50 8460 Hartwell
et al.
Notemigonus (1989)
crysoleucas
Banded killifish ND stat 28 55 8.0 ND 96-h LC50 840 Rehwoldt
et al.
Fundulus (1972)
diaphanus
Striped bass ND stat 28 55 8.0 ND 96-h LC50 4000 Rehwoldt
et al.
Roccus saxatilis (1972)
White perch ND stat 28 55 8.0 ND 96-h LC50 6400 Rehwoldt
et al.
Table 21. (continued)
Organism Size/age Conditionsa Temperature Hardness (mg pH Copper Parameter Concentration Reference
(°C) CaCO3/litre)b salt (µg/litre)
Roccus (1972)
americanus
American eel ND stat 28 55 8.0 ND 96-h LC50 6000 Rehwoldt
Aguilla et al.
rostrata (1972)
Carp stat 28 55 8.0 ND 96-h LC50 800 Rehwoldt
et al.
Cyprinus carpio (1972)
3.5-5.5 g stat 20 50 7.5 ND 48-h LC50 118 Peres &
3.5-5.5 g stat 20 100 7.5 ND 48-h LC50 289 Pihan
3.5-5.5 g stat 20 300 7.5 ND 48-h LC50 751 (1991a)
3.5 cm stat$ 20 ND 7.1 sulfate 96-h LC50 300 Alam &
6.5 cm stat$ 15 ND 7.1 sulfate 96-h LC50 1000 Maughan
(1992)
Fantail 36.8 mm stat 19-21 ND ND sulfate 96-h LC50 333d Lydy &
Etheostoma 36.8 mm stat 19-21 ND ND sulfate 96-h LC50 385e Wissing
flabellare (1988)
Johnny darter 39.2 mm stat 19-21 ND ND sulfate 96-h LC50 489d Lydy &
Etheostoma 39.2 mm stat 19-21 ND ND sulfate 96-h LC50 569e Wissing
nigrum (1988)
Rainbow darter 41 mm flow 24 200 (154) 8.0 ND 96-h LC50 320 Geckler
et al.
Etheostoma (1976)
caeruleum
Orangethroat 55 mm flow 24 200 (154) 8.0 ND 96-h LC50 850 Geckler
darter et al.
Etheostoma (1976)
spectabile
Table 21. (continued)
Organism Size/age Conditionsa Temperature Hardness (mg pH Copper Parameter Concentration Reference
(°C) CaCO3/litre)b salt (µg/litre)
Stoneroller 60 mm flow 24 200 (154) 8.0 ND 96-h LC50 290 Geckler
Campostoma et al.
anomalum (1976)
Creek chub 64 mm flow 24 200 (154) 8.0 ND 96 h LC50 310 Geckler
Semotilus et al.
atromachulatus (1976)
Blacknose dace 47 mm flow 24 200 (154) 8.0 ND 96-h LC50 320 Geckler
Rhinichthys et al.
atratulus (1976)
Brown bullhead 39 mm flow 24 200 (154) 8.0 ND 96-h LC50 540 Geckler
Ictalurus et al.
nebulosus (1976)
Striped shiner 55 mm flow 24 200 (154) 8.0 ND 96-h LC50 790 Geckler
Notropis 55 mm flow 24 200 (154) 8.0 ND 96-h LC50 1900 et al.
chrysocephalus (1.7 g) (1976)
Mudfish 27.1 g stat ND ND ND sulfate 96-h LC50 4301 Ebele et
Clarias al. (1990)
anguillaris
Cichlid 82 g stat 22 ND 7.24 ND 96-h LC50 1059 Al-Akel
Oreochromis (1987)
niloticus
a Stat = static conditions (water unchanged for duration of test); stat$ = static renewal
conditions (water changed at regular intervals); flow = flow-through conditions
(copper concentration in water continuously maintained); ND = no data available.
Table 21. (continued)
b Alkalinity in parentheses (mg/litre).
c Range of LC50s for fish from different sources.
d Fish collected in winter
e Fish collected in summer.
Table 22. Acute toxicity of copper to marine fisha
Organism Size/age Conditions Temperature Salinity pH Copper Parameter Concentration Reference
(°C) (%0) salt (µg/litre)
Chinook salmon 1.6 g stat 11-13 brackish 7.6-8.1 sulfate 96-h LC50 60 Hamilton &
Oncorhynchus (25.3%) Buhl (1990)
tshawytscha
Coho salmon smolt flow 13 28.6 8.1 chloride 96-h LC50 601 Dinnell et
Oncorhynchus al. (1989)
kisutch
Topsmelt larvae stat 21 33 ND chloride 96-h LC50 238 Anderson et
Atherinops affinis al. (1991)
Tidewater 19 days stat 25 20 ND nitrate 96-h LC50 140 Mayer (1987)
silverside (34%)
Menidia peninsulae
Spot adult stat 25 20 ND nitrate 96-h LC50 280 Mayer (1987)
Leiostomus (34%)
xanthurus
Sheepshead minnow larvae stat$ 25 34-35 6.2-8.2 nitrate 96-h LC50 > 220 fed Hutchinson
Cyprinodon et al. (1994)
variegatus
Rivulus marmoratus 0.03-0.1 g flow 26-27 14 ND ND 96-h LC50 1250-1610 Lin & Dunson
(1993)
Killifish 0.02-0.13 g flow 26-27 14 ND ND 96-h LC50 1690 Lin & Dunson
(1993)
Fundulus juvenile stat$ 20 10 ND ND 48-h LC50 19 000 Burton &
heteroclitus Fisher (1990)
Dab 16.9 g flow 12 34.6 7.7 nitrate 96-h LC50 300 Taylor et al.
Limanda limanda (1985)
Table 22. (continued)
Organism Size/age Conditions Temperature Salinity pH Copper Parameter Concentration Reference
(°C) (%0) salt (µg/litre)
Grey mullet 0.87 g flow 12 34.6 7.7 nitrate 96-h LC50 1400 Taylor et al.
Chelon labrosus (1985)
Shiner perch adult flow 13.2 29.5 7.8 chloride 96-h LC50 418 Dinnell et
Cymatogaster al. (1989)
aggregata
a Stat = static conditions (water unchanged for duration of test); stat$ = static renewal conditions (water changed at regular intervals);
Flow = flow-through conditions (copper concentration in water continuously maintained); ND = no data available.
Chakoumakos et al. (1979) found the acute toxicity of copper to
cutthroat trout (Salmo clarki) to be inversely correlated with both
water hardness and alkalinity. The 96-h LC50s ranged from 15.7 µg
Cu/litre at low alkalinity (20.1 mg CaCO3/litre) and hardness (26.4
mg/litre) to 367 µg Cu/litre at high alkalinity (178 mg/litre) and
hardness (205 mg/litre). The most important copper species causing
toxicity within the pH range tested were Cu2+, Cu(OH)+ and
Cu(OH)20. The concentration of each of these species varies with pH
and alkalinity. Lower pHs favour Cu2+; higher pHs favour Cu(OH)+
and Cu(OH)20. Lower alkalinities favour all three species.
Peres & Pihan (1991a) reported a similar relationship between
acute copper toxicity and hardness for both carp (Cyprinus carpio)
and rainbow trout (Oncorhynchus mykiss): 48-h LC50s for trout
ranged from 25 µg Cu/litre to 560 µg Cu/litre at a water hardness
ranging from 10 to 300 mg/litre. For carp, LC50s ranged from 118 to
751 µg/litre whilst the hardness ranged from 50 to 300 mg/litre. The
toxicity of copper to rainbow trout decreased with increasing
hardness. LC50s (15 days) ranged from 18 µg Cu/litre at a hardness
of 12 mg CaCO3/litre to 96 µg Cu/litre at a hardness of 97 mg/litre.
Miller & Mackay (1980) tested the effects of different hardness
(12-99 mg CaCO3/litre) and alkalinity (10-51 mg CaCO3/litre) on
acute toxicity of copper to rainbow trout. Toxicity was inversely
related to hardness at all alkalinities and to alkalinity at higher
hardness. Incipient median lethal concentrations ranged from 18 to 96
µg Cu/litre. Howarth & Sprague (1978) evaluated the acute toxicity of
copper to rainbow trout in waters of various hardness, alkalinity and
pH and reported 96-h LC50s to range from 20 to 516 µg Cu/litre.
Cusimano et al. (1986) reported the 96-h LC50 for rainbow trout to
vary from 66 µg Cu/litre at pH 4.7 (alkalinity -0.2 mg CaCO3/litre)
to 2.8 µg Cu/litre at pH 7.0 (alkalinity 11 mg CaCO3/litre).
Welsh et al. (1993) determined the acute toxicity of copper to
larval fathead minnows in waters of varying pH and dissolved organic
carbon (DOC). Toxicity was inversely related to both parameters, with
96-h LC50s ranging from 2.0 µg Cu/litre at pH 5.6 and 0.2 mg
DOC/litre to 182 µg/litre at pH 7 and 16 mg DOC/litre. Empirical
regression equations were derived that could be useful for predicting
toxicity in different waters and the slopes of these equations were
similar to those reported by Erickson et al. (1987, 1996).
Anderson et al. (1994) reported 7-day LC50s and NOECs from three
different laboratories for larval topsmelt. LC50s were 162 and 274
µg Cu/litre and NOECs were 100 µg Cu/litre at a salinity of 34%.
LC50s were 55.7 and 58.4 µg Cu/litre and NOECs were 32 µg Cu/litre at
a salinity of 20%. LC50s and NOECs were calculated for topsmelt
which were spawned at different times of the year over a 2-year period
(1990-1991). NOECs for copper were 100 µg Cu/litre except two 180 µg
Cu/litre (November 1990) and 56 µg Cu/litre (May 1991); LC50s for
these tests ranged from 131 to 240 µg Cu/litre.
Table 23. Acute toxicity of copper to amphibians
Organism Size/age Conditionsa Temperature Hardness (mg pH Copper Parameter Concentration Reference
(°C) CaCO3/litre) salt (µg/litre)
Clawed toad larvae stat 20 ND ND sulfate 48-h LC50 1700 DeZwart &
Xenopus laevis Sloof (1987)
Toad larvae stat 31 185 7.4 sulfate 48-h LC50 446 Khangarot
Bufo larvae stat 31 185 7.4 sulfate 96-h LC50 320 & Ray
melanostictus (1987)
a Stat = static conditions (water unchanged for duration of test); ND = no data available.
McNulty et al. (1994) carried out a series of 7-day growth and
survival experiments with larval topsmelt (Atherinops affinis) of
different ages. Fish aged 0, 3 and 5 days were less sensitive to
copper than fish > 7 days old. LC50s ranged from 365 µg Cu/litre
in 0-day larvae to 137 µg Cu/litre in 20-day larvae. NOECs were
constant for all age groups at 180 µg Cu/litre for fish 1 and 3 days
old and 100 µg Cu/litre for all other groups. Pickering & Lazorchak
(1995) exposed fathead minnow (Pimephales promelas) to copper in a
7-day larval survival and growth test. The NOEC and LOEC, based on
growth, were 25 and 50 µg Cu/litre, respectively, for larvae 1, 4 and
7 days old. For survival the NOEC and LOEC were 200 and 400 µg
Cu/litre, respectively, for 1-day-old and 4-day-old larvae; however,
for 7-day-old larvae the NOEC and LOEC were 100 and 200 µg Cu/litre.
The subchronic value (geometric mean of NOEC and LOEC) was 35 µg
Cu/litre. The authors found the test to be relatively insensitive to
changes in test conditions.
Hutchinson et al. (1994) exposed sheepshead minnow larvae
(Cyprinodon variegatus) to copper for 7 days. NOECs for survival
and growth were 120 and 220 µg Cu/litre, respectively; LOECs were 220
and > 220 µg Cu/litre, respectively. A subchronic value was
calculated as the geometric mean of the highest NOEC and the lowest
LOEC; these were 160 µg Cu/litre for survival and > 220 µg Cu/litre
for growth.
Seven-day survival tests with coho salmon
(Oncorhynchus kisutch) carried out following 16 weeks exposure
indicate that the exposed fish became significantly more tolerant of
copper. The 168-h LC50 for previously unexposed fish was 220 µg
Cu/litre whereas fish exposed to 140 µg Cu/litre were 2.5 times less
sensitive at 550 µg Cu/litre (Buckley et al., 1982).
Collvin (1985) studied the effect of copper (1-81 µg Cu/litre) on
the maximal growth rate of perch (Perca fluviatilis) over a 30-day
period. Copper reduced maximal growth rate at concentrations > 22 µg
Cu/litre. Reduced growth rate was mainly an effect of reduced food
conversion efficiency attributed to an increased metabolism caused by
detoxification.
Lanno et al. (1985) fed rainbow trout (Oncorhynchus mykiss) on
a diet containing copper at concentrations ranging from 9 to 3088 mg
Cu/kg for 8 weeks, and from 8.5 to 664 mg Cu/kg for up to 24 weeks.
After 8 weeks reduced weight gain and feed intake, increased
feed : gain ratios and mortalities were observed in trout reared on
test diets containing > 730 mg Cu/kg. Trout receiving 1585 or 3088
mg Cu/kg showed pronounced food refusal. After 16 weeks trout reared
on a diet containing 664 mg Cu/kg had significantly lower live body
weights, although there was no significant difference after 24 weeks.
Mount et al. (1994) fed rainbow trout (Oncorhynchus mykiss) on
a brine shrimp (Artemia sp.) diet containing 440, 830 or 1000 mg
Cu/kg (dry weight) for up to 60 days. Fish fed the 830 or 1000 mg
Cu/kg diets showed 30% mortality during the experiment. No
significant effect of copper on growth was observed. The authors
conclude that waterborne copper released from Artemia may have
contributed to the mortality.
Effects on reproduction and early life-stages
Stouthart et al (1996) exposed newly fertilized common carp
(Cyprinus carpio) eggs to copper (19.1 and 50.8 µg/litre; 0.3 and
0.8 µmol/litre) at pH 6.3 and 7.6. No significant effect of copper on
egg mortality, larval heart rate and tail movement or whole-body
potassium and magnesium content was observed at pH 7.6. However,
whole-body sodium and calcium were significantly decreased and larval
mortality and larval deformation were significantly increased at the
higher copper exposure. At pH 6.3, exposure to 50.8 µg Cu/litre (0.8
µmol/litre) significantly increased egg mortality and decreased heart
rate and tail movements; premature hatching and a
concentration-dependent increase in larval mortality and larval
deformation were also observed. The whole-body content of potassium,
sodium, magnesium, and calcium were all significantly decreased by
both copper exposures at pH 6.3.
Anderson et al. (1991) carried out both fertilization tests and
embryo development tests on topsmelt (Atherinops affinis). In
fertilization tests percentage fertilization was measured following
exposure of sperm to copper. The NOEC values for four fertilization
tests ranged from 32 to > 90 µg Cu/litre; EC50s ranged from 24 to
163 µg Cu/litre. In embryo tests embryos were checked for up to 12
days for viability, abnormalities, mortality and hatching success.
The NOEC for embryo abnormalities ranged from 55 to 123 µg Cu/litre;
EC50s ranged from 115 to 180 µg Cu/litre. The NOEC for larval
hatching success and for larval abnormalities ranged from 55 to 123 µg
Cu/litre, and from 55 to 68 µg Cu/litre for the two parameters,
respectively; EC50s ranged from 108 to 182 µg Cu/litre, and from 75
to 190 µg Cu/litre.
Pickering et al. (1977) exposed fathead minnow
(Pimephales promelas) to copper (8-100 µg Cu/litre) at 6, 3 and 0
months prior to spawning. The prespawning exposure time had no
significant effect on reproduction. However, egg production was
significantly lower at concentrations of 37 µg Cu/litre or more. The
maximum acceptable toxicant concentration (MATC) was estimated to be
32 µg Cu/litre.
Dave & Xiu (1991) monitored the effects of copper chloride on
hatching and survival of zebrafish (Brachydanio rerio) exposed from
post-fertilization for 16 days. Significant mortality of embryos
occurred at concentrations of 32 µg Cu/litre and above during the
first day of exposure. For exposures of 1-16 µg Cu/litre, hatch was
significantly delayed relative to the control value of 4 days and
embryo mortality exceeded 50%. Delayed hatching was also reported at
concentrations < 1 µg Cu/litre, but effect levels are very uncertain
because exposure concentrations were unmeasured and background
concentrations are unknown.
Scudder et al. (1988) exposed embryos of fathead minnow
(Pimephales promelas) to total copper concentrations ranging from
0.6 to 621 µg Cu/litre from 5 to 10 h post-fertilization to 2 days
post-hatch. Significant declines in percentage survival and
percentage total hatch were observed at 621 µg Cu/litre but not at 338
µg Cu/litre. A significant increase in the number of embryos with
abnormalities was observed at > 338 µg Cu/litre. Larval fish were
exposed to copper at the same concentrations for 28 days post-hatch.
Fish growth was significantly reduced and percentage abnormalities
increased at the lowest treatment concentration (61 µg Cu/litre) and
effects increased with increasing concentration. Percent survival was
significantly reduced at concentrations of 113 µg Cu/litre and above
and the 28-day LC50 was estimated to be 128 µg Cu/litre.
Mount (1968) conducted an 11-month, full-life-cycle exposure of
fathead minnows to copper in a hard water (hardness 200 mg
CaCO3/litre, alkalinity 160 mg CaCO3/litre, pH 7.9). Growth and
survival were significantly reduced at 95 µg Cu/litre and reproduction
was completely suppressed at 32-34 µg Cu/litre, but unaffected at
14-15 µg Cu/litre. In a softer water (hardness 31 mg CaCO3/litre,
alkalinity 30 mg CaCO3/litre, pH 7.0), Mount & Stephen (1969)
reported survival, growth, and reproduction to be significantly
affected at 18.4 µg Cu/litre, but not at 10.6 µg Cu/litre.
McKim et al. (1978) tested the effects of copper on the growth
and survival of embryos and larvae of eight fish species. The
standing crop of fish after 30-70 days post-hatch was significantly
reduced at exposure concentrations of 32 µg Cu/litre for rainbow
trout, 34 µg Cu/litre for white sucker, 44 µg Cu/litre for brook
trout, 42 µg Cu/litre for lake trout, 46 µg Cu/litre for brown trout,
103 µg Cu/litre for lake herring, 104 µg Cu/litre for northern pike,
and 104 µg Cu/litre for smallmouth bass.
Seim et al. (1984) contrasted the effects of continuous and
intermittent (4.5 h/day) exposure of steelhead trout to copper for 78
days. The EC50 for growth reduction on the basis of average copper
concentrations was 46 µg Cu/litre for continuous exposure, but only 27
µg Cu/litre for intermittent exposure.
Sayer et al. (1989) exposed yolk-sac fry of brown trout
(Salmo trutta) to copper concentrations of 1.2, 2.5 and 5.1 µg
Cu/litre (20, 40 and 80 nmol/litre) at pH 4.5 and at calcium
concentrations of 20 or 200 µmol for 30 days. Mortalities were high
(70-100%) at the lower calcium concentration for all three copper
concentrations. Only one death was observed for copper and high
calcium exposures. At high calcium levels, impaired sodium, potassium
and calcium uptake were observed for all three copper concentrations.
Horning & Neiheisel (1979) exposed bluntnose minnow
(Pimephales notatus) to copper concentrations ranging from 4.3
(control) to 119.4 µg Cu/litre. Minnows exposed to 119.4 µg Cu/litre
for 60 days were significantly smaller than the other groups.
Survival of parental bluntnose minnows was not affected by any copper
concentrations during the 60-day exposure. Copper
concentrations > 18 µg Cu/litre significantly reduced the number of
spawnings, the total number of eggs produced and the number of eggs
per female. Therefore, the MATC based on reproductive impairment was
between 4.3 and 18 µg Cu/litre. Minnows held in "clean" water for 9
months ceased to spawn on exposure to 119.4 µg Cu/litre. Fish exposed
to 119.4 µg Cu/litre for the same 9-month period began to spawn 60
days after being transferred to "clean" water.
McKim & Benoit (1971) exposed brook trout
(Salvelinus fontinalis) to copper(II) concentrations ranging from
1.9 to 32.5 µg Cu/litre for 22 months. The highest concentration
decreased survival and growth in adult fish, and reduced the number of
viable eggs produced and hatchability. No effects on adult survival,
growth or reproduction were observed at copper concentrations of 17.4
µg/litre or less. Concentrations of 17.4 and 32.5 µg Cu/litre had
marked adverse effects on survival and growth of alevins and juvenile
fish. Therefore, the MATC for brook trout exposed to copper (hardness
45 mg CaCO3/litre; pH 7.5) was between 9.5 and 17.4 µg Cu/litre.
Benoit (1975) exposed bluegills (Lepomis macrochirus) to copper
concentrations ranging from 12 to 162 µg Cu/litre for a period of 22
months. Adult bluegill survival and reproduction were significantly
affected only at the highest copper concentration of 162 µg Cu/litre.
A 90-day exposure of larvae transferred at hatch revealed a
significant reduction in survival at > 40 µg Cu/litre; larval
growth was not significantly reduced at 77 µg Cu/litre and below.
Metabolic, biochemical and physiological effects
Beckman & Zaugg (1988) exposed chinook salmon
(Oncorhynchus tshawtscha) to natural springwater with an elevated
copper concentration (48 µg/litre). In parr, gill Na+, K+-ATPase
activity was unaffected by an 18-h exposure, whereas in smolt there
was significant inhibition. In both parr and smolt there were
significant increases in haematocrit and plasma glucose.
Arillo et al. (1984) investigated the effect of copper at levels
of 30-100 µg Cu/litre on a wide variety of biochemical parameters in
the rainbow trout (Oncorhynchus mykiss). The exposure period was 4
months. Copper significantly reduced ALAD (aminolaevulinic acid
dehydratase) activity in liver, carbonic anhydrase activity in blood,
gill sialic acid content and the respiratory control ratio and oxygen
consumption in liver mitochondria.
Heath (1991) exposed bluegill (Lepomis macrochirus) to a free
copper concentration of 261 µg Cu/litre for 7 days. Copper caused an
elevation in plasma glucose of approximately 100% and a significant
reduction in liver ATP. Acute hypoxia stress responses such as
hyperglycaemia, lower plasma sodium, lower liver ATP and higher plasma
potassium were accentuated by prior exposure to copper.
Nemcsók & Hughes (1988) exposed rainbow trout to concentrations
of 200 or 2000 µg Cu/litre for up to 48 h. Activities of blood
glucose, ASAT and ALAT were significantly increased after 24 h at 2000
µg Cu/litre and after 48 h at the lower concentration. Significant
decreases in acetylcholinesterase activity were observed over the same
time periods at each of the copper concentrations. Copper sulfate
(200 µg/litre) had only a slight damaging effect on tissues after 24 h
as indicated by biochemical and haematological parameters. However,
the addition of sulfuric acid (pH 6.5) significantly increased blood
glucose, ASAT, ALAT and lactate dehydrogenase, and significantly
decreased acetyl cholinesterase activity.
Muñoz et al. (1991) exposed juvenile rainbow trout to copper (50
µg Cu/litre) for 21 days. Copper caused rapid and significant
elevations of plasma cortisol levels; plasma sodium showed a
significant decrease for 7-15 days.
Lydy & Wissing (1988) studied the thermal resistance of fantail
darters (Etheostoma flabellare) and johnny darters (E. nigrum)
exposed to copper at sublethal concentrations for 96 h. Thermal
resistance was determined using the critical thermal maxima (CTMAX)
with loss of equilibrium as the end-point. The mean CTMAX value for
fantail darters exposed to 149 µg Cu/litre was 7.6°C below that of the
control means. In johnny darters, a concentration of 292 µg Cu/litre
depressed the CTMAX value by 5.2°C. The NOEC for the fantail darter
was 42 µg Cu/litre and for the johnny darter 128 µg Cu/litre.
Structural effects and malformations
Benedetti et al. (1989) exposed brown bullhead
(Ictalurus nebulosus) to concentrations of 5000 µg Cu/litre for 24 h
and 300 µg Cu/litre for 40 days. All fish reared for more than 1
month in 300 µg Cu/litre showed epidermal changes such as an increase
in mucus cell numbers and a tendency for the cells to become
superficial. In fish most severely impaired by copper poisoning the
epidermis appeared thinner in patches compared with controls. The
gills of fish exposed to 5 mg Cu/litre were markedly damaged with
swollen and hyperaemic lamellae, necrosis and disaggregation of the
epithelium, whereas fish in the 300 µg Cu/litre group showed more
variable gill damage. Histomorphological analysis of livers from both
groups did not reveal diffuse changes in the hepatic parenchyma.
However, areas of patchy degeneration and isolated degenerated
elements located within areas of normal hepatocytes were observed.
Histochemical staining revealed that all treated fish had lower liver
glycogen content than controls.
Khangarot (1992) investigated ultrastructural alterations in the
liver of snake-headed fish (Channa punctatus) following exposure to
50 and 100 µg Cu/litre using transmission electron microscopy. After
4 days at 50 µg Cu/litre there is a marked proliferation of the smooth
endoplasmic reticulum (SER), complete degeneration of rough
endoplasmic reticulum (RER), loss of ribosomes from the surface of
RER, a random distribution of ribosomes throughout the cytoplasm and
an increase in the number and size of SER cisternae. Mitochondrial
swelling, and the loss of internal and external mitochondrial
membranes, were observed. A large number of vacuoles and lysosome
having dense bodies were observed after 7 days exposure. The
lysosomal matrix frequently displayed crystalline structures of
various sizes and the nuclear size was reduced with chromatin material
clumped within the nucleus. Prominent changes in nuclei of fish
hepatocytes were observed after exposure to 100 µg Cu/litre. Rupture
of nuclear membranes and clumping of chromatin in necrotic cell nuclei
with the aggregation of interchromatin material at the centre of the
nucleus were recorded. More dilation and vesiculation were observed
in RER after 7 days. Aggregation of SER and RER, rupturing of
mitochondrial membrane, a decrease in the number of mitochondria and
an increase in the number of Golgi complexes were also observed.
Kirk & Lewis (1993) studied copper-induced changes in gills of
rainbow trout (Oncorhynchus mykiss) by scanning electron microscopy.
Trout exposed to 500 µg Cu/litre for 2 h showed collapse of lamellae
and considerable secretory activity of mucous cells. Filament tips
were swollen and bent, and had an increase in the number of mucous
cells which extruded copious amounts of mucus. Exposure of fish to
1000 µg Cu/litre caused the gills to be covered in mucus and cellular
debris. There were many ruptured and exhausted mucous cells, lamellar
fusion occurred and epithelial cells were extremely swollen throwing
the gill surface into swellings and ridges. There was a greater
proliferation of chloride and mucous cells, and increased mucus
secretion compared with the lower copper exposure.
Behavioural effects
Pedder & Maly (1985) studied the attraction-avoidance response of
rainbow trout at concentrations ranging from 500 to 4000 µg Cu/litre.
There was an initial attraction response at all copper concentrations
which led to high mortality at 3000 and 4000 µg Cu/litre. Avoidance
of copper was observed, following the initial period of attraction, at
> 500 µg Cu/litre; maximum avoidance at 1.0 mg Cu/litre. The 96-h
EC50, based on avoidance, was between 500 and 750 µg Cu/litre.
Hartwell et al. (1989) found the avoidance threshold for golden shiner
(Notemigonus crysoleucas) to be 26 µg Cu/litre in flow-through
tests.
Ellgaard & Guillot (1988) observed that exposure to copper
elicited a hypoactive response in bluegill at all concentrations
tested (40, 80 and 400 µg Cu/litre) and that the effect was
concentration-dependent. At all concentrations, locomotor activity
appeared to fall rapidly during the first 4 days following exposure
and then tended to plateau for the rest of the 8-day exposure.
Steele (1989) studied the effect of sublethal exposures of copper
(50, 100 and 200 µg Cu/litre) on the daily activity of sea catfish
(Arius felis) after a 72-h static exposure. Fish exposed to 0.1 or
0.2 mg Cu/litre showed significant hyperactivity and a loss of the
normal daily activity pattern of this species; the same two exposure
groups showed significantly less variability in activity.
9.3.2.4 Model ecosystems and community effects
Havens (1994a) dosed mesocosms with copper concentrations ranging
from 2 to 200 µg Cu/litre for 5 days. There was a significant
negative relationship between total algal biovolume and copper dose.
The decline in algal biovolume at higher doses (> 50 µg Cu/litre)
reflected the loss of Rhodomonas, Aphanizomeron, Chlamydomonas and
Ceratium. The assemblage that survived was dominated by diatoms.
There was a significant negative exponential relationship between
zooplankton biomass and copper dose. The most sensitive species were
the calanoid copepods with a biomass reduction of > 50% at 20 µg
Cu/litre; the cyclopoids were the most tolerant with more than 50% of
the biomass of cyclopoid copepodids surviving the highest dose.
Havens (1994b) exposed a freshwater plankton community to copper
(140 µg Cu/litre) for 14 days. Copper significantly reduced the dry
weight biomass of zooplankton, ciliates, flagellates and autotrophic
phytoplankton. Bacterial biomass was significantly increased; however,
this resource went virtually unexploited because the most effective
bacterial grazers (large cladocerans and protozoans) were greatly
reduced by copper exposure.
Hedtke (1984) exposed an aquatic microcosm to copper for 32 weeks
under flow-through conditions. No significant effects on material
cycling and biological structure were observed at 4.0 µg Cu/litre. At
9.3 µg Cu/litre primary production levels were significantly reduced
by the end of the experiment and dissolved organic carbon production
was substantially lower than controls. Copper concentrations > 30
µg Cu/litre significantly lowered primary production and macroalgal
growth, and there were substantial structural changes increasingly
shifting from autotrophic to heterotrophic systems with increasing
copper levels.
Scanferlato & Cairns (1990) spiked sediment with copper
concentrations of 10, 100 or 1000 mg Cu/kg dry sediment in an aquatic
microcosm. Most of the added copper remained bound to sediment
particles during the 8-week experiment. The lowest concentration had
no effect on the structure or function of the microcosm. In
microcosms exposed to 100 mg Cu/kg (500 µg Cu/litre in overlying
water) both chlorophyll a content and respiration were significantly
decreased. Other structural and functional attributes were rather
variable. Significant decreases in production, respiration,
respiration/biomass ratio, ATP and chlorophyll a, and significant
increases in assimilation ratio and autotrophic index were observed at
1000 mg Cu/kg (overlying water concentration = 20 mg Cu/litre).
Hart et al. (1992) evaluated the effects of copper on
phytoplankton communities in 5-m diameter (40-m3 volume) enclosures
in Island billabong (floodplain on Magela Creek, northern Australia).
Copper (1.3 g) was added to the enclosure at a rate thought to be 10×
the normal wet season values for Island billabong. Concentrations of
total copper over the 10-week experiment ranged from 2.2 to 51 µg
Cu/litre in the treatment and 3.9 to 26 µg Cu/litre in the control.
The addition of copper had little effect on the phytoplankton
populations.
Winner et al. (1990) evaluated the seasonal responses of
planktonic and benthic communities exposed to copper concentrations of
20 or 40 µg Cu/litre in oligotrophic ponds for 5-week periods.
Phytoplankton and zooplankton were more sensitive to copper in the
spring than in the summer or autumn. Zooplankton exhibited a 43% and
an 86% reduction in density in the 20 and 40 µg Cu/litre enclosures,
respectively. The authors suggest that this is related to seasonal
changes in the dissolved organic carbon content of the ponds.
Winner & Owen (1991a) evaluated the toxicity of copper to
daphnids in 7-day chronic tests (Ceriodaphnia dubia) and algae in
4-day cell reproduction tests (Chlamydomonas reinhardii) using
filtered pond water from Brandenburg Pond, Ohio, USA. The studies
were performed numerous times over a 6-month period. C. reinhardii
NOECs were typically 20-40 µg Cu/litre whereas for C. dubia they
were 50-80 µg Cu/litre. For both species, NOECs increased with
increasing alkalinity and hardness. C. reinhardii NOECs based on
cell growth also declined with increasing dissolved organic carbon
values.
Winner & Owen (1991b) examined the sensitivity of freshwater
phytoplankton communities to chronic copper exposure in 100-litre
polyethylene enclosures in Brandenburg Pond, Ohio, USA. The studies
were conducted in four 5-week exposures over the course of 2 years.
Nominal exposure levels of 0, 20 and 40 µg Cu/litre were used and
verified analytically. Over the course of the experiment 82 taxa of
phototrophs were identified in the enclosures. Seasonal variation in
algal population density was observed with the largest depression of
the algal populations in the two spring exposures at both the 20 and
40 µg Cu/litre concentrations. Summer and fall population responses
to copper at the 20 and 40 µg Cu/litre level were minimal, although
individual taxa were effected. During the first spring exposure,
effects on zooplankton and benthos were also measured (Moore & Winner,
1989). Small mayflies and chironomids were effected at 40 µg Cu/litre
and no effects on benthos were observed at 20 µg Cu/litre. Rotifers
and copepods exhibited significant reduction in density at both 20 and
40 µg Cu/litre. Daphnids were not affected at either treatment level,
which was consistent with laboratory toxicity tests with
Ceriodaphnia dubia.
Moore & Winner (1989) studied the effect of copper (20 and 40 µg
Cu/litre) on zooplankton and benthos in enclosure experiments. During
5-week exposures copper caused significant decreases in the alga
Uroglena, rotifers, cyclopoids and calanoid copepods. The density of
small mayflies and chironomids was significantly decreased at the
higher copper exposure. Other benthic organisms such as fingernail
clams, larger midges and mayflies were not affected by copper but
rather by fish predation and/or adult emergence. Daphnia achieved
significantly higher densities at 20 µg Cu/litre than in the controls.
Clements et al. (1989) conducted experiments in artificial
streams to examine the influence of water quality on the
macroinvertebrate responses to copper. The effects of copper on the
reduction of macroinvertebrate abundance was greater in streams of low
hardness (53-60 mg/litre) and alkalinity (49-61 mg/litre) at a copper
concentration of 6 µg Cu/litre compared with streams of higher
hardness (150-157 mg/litre) and alkalinity (137-146 mg/litre), and a
copper concentration of 15 µg/litre. However, the responses to copper
were highly variable among taxa. Tanytarsini chironomids and the
mayflies Baetis brunneicolor and Isonychia bicolor were
particularly sensitive, whereas Orthocladiini chironomids and
net-spinning caddisflies were quite tolerant of copper in experimental
streams.
Clements et al. (1988, 1990) conducted a series of
macroinvertebrate community toxicity tests with copper in
laboratory- and field-constructed aquatic streams using water from the
New River in Giles County, Virginia, USA. Rock-filled trays were
colonized by macroinvertebrates in the New River for 30 days and then
placed in either the laboratory- or the field-constructed streams. The
results of the 1988 laboratory experiments indicated that 96-h
exposures to copper (low dose = 15-32 µg Cu/litre) resulted in a
reduction in the number of taxa present by 24-36%. In 1990, 10-day
exposures were performed with copper and laboratory and field results
compared. The field-constructed streams showed significantly less
response to copper than the macroinvertebrates in laboratory-housed
streams. The low dose (11.3 µg Cu/litre) resulted in a 10% reduction
of taxa and 44% reduction in species abundance in field constructed
streams as compared to 56 and 75% reduction in laboratory streams,
respectively. Species of the order Ephemeroptera (mayflies) were the
most sensitive in both studies.
A field study was conducted at Shayler Run, a natural stream near
Clermont County, Ohio, USA, to determine the effects of copper on
stream biota (Geckler et al., 1976). A single nominal concentration
of 120 µg Cu/litre was chosen as the test level. This value was
selected because it was thought that it would be high enough to affect
sensitive fish populations, based on laboratory chronic fish studies
performed earlier. This stream was also known to receive sewage from
a small waste treatment plant 6.5 km (4 miles) upstream from the test
area. Measured concentrations in the treated portion of the stream
during the study ranged from 44.1 to 96.3 µg Cu/litre. All but one
abundant fish species in the stream and four of the five abundant
macroinvertebrates were adversely affected by the exposure to copper.
Leland et al. (1989) exposed oligotrophic streams to copper
concentrations ranging from 2.5 to 15 µg total Cu/litre (12-75 ng
Cu2+ activity/litre calculated by computer modelling). Declines in
population density of species representing all major orders
(Ephemeroptera, Plecoptera, Coleoptera, Trichoptera and Diptera)
occurred at 5 and/or 10 µg total Cu/litre. Herbivores were more
sensitive to copper toxicity than predators.
Saward et al. (1975) exposed a marine food chain, comprised of
phytoplankton, bivalves (Tellina tenuis) and fish (plaice
Pleuronectes platessa), to copper at concentrations of 10, 30 and
100 µg Cu/litre for 100 days. All copper exposures reduced the
standing crop and the rate of photosynthesis per unit of chlorophyll
a in phytoplankton. Copper adversely affected bivalve condition by
means of a reduction in carbohydrate reserves and nitrogen levels.
Fish showed reduced growth; however, no significant change in
condition or biochemical composition was reported.
9.3.3 Terrestrial organisms
9.3.3.1 Plants
Generally visible symptoms of copper toxicity are small chlorotic
leaves and early leaf fall. Growth is stunted, and initiation of
roots and development of root laterals are poor. Reduced root
development may result in a lowered water and nutrient uptake which
leads to disturbances in the metabolism and growth retardation
(Balsberg Påhlsson, 1989).
Toxicity to plants grown hydroponically
Beckett & Davis (1977) stated that yield alone is a poor index of
toxicity since the height of the plateau depends on many other
factors. The toxic effects of a given concentration also depend on
many factors. However, the effect on yield of a potentially harmful
element depends mainly on its concentration in the tissue. Therefore,
the tissue concentration of the element at the upper critical level
should be relatively independent of other factors. Davis & Beckett
(1978) grew barley (Hordeum vulgare), lettuce (Lactuca sativa),
rape (Brassica napus) and wheat (Triticum aestivum) in a nutrient
solution containing copper. The dry matter yield of these plants was
independent of the copper concentrations in their photosynthesizing
tissues, up to a critical concentration (upper critical level). The
upper critical concentrations of copper for barley, lettuce, rape and
wheat were, respectively, 19, 16, 21 and 21 mg Cu/litre. Beckett &
Davis (1978) exposed young barley plants to combinations of copper,
zinc and nickel. At tissue concentrations in excess of their
respective upper critical levels the toxic effects of copper and
nickel appear to be additive, but the combination of copper and zinc
appears to be antagonistic.
Taylor & Foy (1985) observed that plants of Triticum aestivum
exposed to 3 mg Cu/litre (50 µmol/litre), as copper sulfate, showed
acute signs of copper toxicity, including mild necrosis and symptoms
of induced iron deficiency in the leaves, and inhibition of root
growth and lateral root initiation. Plants exposed to 50 mg Cu/litre
(800 µmol/litre), as copper-EDTA, showed systemic toxicity symptoms
probably reflecting iron deficiency as the primary toxic effect.
Leaves showed mild necrosis and symptoms of iron deficiency; root
growth, although depressed, was not as severely affected as with
copper sulfate, and lateral root initiation was unaffected.
Wong & Bradshaw (1982) grew perennial rye grass
(Lolium perenne) from seed in solutions of copper sulfate for 14
days. Copper concentrations of 0.02 mg Cu/litre (0.3 µmol/litre)
caused a 50% reduction in normal root growth.
Alva & Chen (1995) examined the effects of 6.35, 317.5, 635 and
1270 µg Cu/litre (0.1, 5, 10 or 20 µmol Cu/litre) in nutrient solution
at pH 5.5 on growth, uptake and partitioning of copper by seedlings of
mandarin Cleopatra and citrumelo Swingle rootstock. There was a
significant exposure-dependent decrease in both shoot and root dry
weight. The concentration of copper in both shoots and roots
increased with increasing exposure concentration. The increase in
tissue copper concentration was more marked in roots than in shoots.
The pronounced effect of copper on iron uptake could, in part, be
explained by the development of iron chlorosis symptoms.
Winter wheat plants (Triticum aestivum L cv. Starke II) were
grown for 7 days in split-root chambers containing nutrient solutions
with various copper chloride concentrations (32 controls) to 635 µg
CuCl2/litre; 0.5 to 10 µmol/litre). Average root length and dry
weight of the root parts exposed to 127-635 µg Cu/litre (2-10
µmol/litre) decreased, and lateral root initiation was delayed; dry
weight of root parts increased in control plants. Copper was not
exported from the roots to the other plant parts (Adalsteinsson,
1994).
Schmidt (1988) reported IC50s for inhibition of root growth from
germinated seeds at 1.8 mg Cu/litre for Lupinus albus and 0.274 mg
Cu/litre for Cicer arietinum.
Burton et al. (1986) studied the interactive effects of copper,
cadmium and nickel on seedlings of Sitka spruce (Picea sitchensis)
grown in nutrient solution for 42 days. Copper concentrations of 5
and 10 mg/litre significantly reduced seedling yield. There were no
significant interactive effects on yield even where copper and cadmium
individually affected yields, but nickel and copper did interact.
Huber et al. (1989) treated 3-year-old white, Scots and Austrian
pine seedlings with copper (80 mg/litre, 500 µmol/litre) for up to 90
days. Copper significantly affected energy homoeostasis and oleoresin
production, and induced a loss of tolerance in Scots pine and loss of
resistance to nematodes in Austrian pine.
Sela et al. (1988) exposed roots and shoots of
Azolla filiculoides to copper (10 mg/litre) for 1 day. Copper
exposure caused losses of potassium, chloride and magnesium from
Azolla roots.
Root growth of seedlings of the Agrostis capillaris cultivars
Parys (copper tolerant), Gognian (lead/zinc tolerant) and Highland
(non-tolerant) was measured after 14 days growth in solutions
containing 64-762 µg Cu/litre (1-12 µmol/litre). Highland cultivars
showed a sharp negative exponential decline in root growth at
concentrations > 64 µg Cu/litre (1 µmol/litre). Gognian and Parys
cultivars are unaffected by copper levels of 64 and 254 µg Cu/litre (1
and 4 µmol/litre); however, at higher concentrations Parys cultivars
are less affected by copper than Gognian (Symeonidis et al., 1985).
Wong et al. (1994) reported that a zinc/lead tolerant cultivar of
Festuca rubra was tolerant of copper. The cultivar showed a high
tolerance index (80.33%) at 50 mg Cu/litre. A treatment of 50 mg
Cu/litre appeared to cause little damage to root and shoot elongation.
Fresh weights of roots were significantly reduced at copper
concentrations of 10 mg/litre; there was no effect on fresh weight of
shoots. Metal transport to the shoot was minimal, indicating that the
root may play a major role in preventing transportation of copper to
the upper portion of the plant.
Toxicity to plants grown in soil
Toxicity of copper to terrestrial plants grown in soil is
summarized in Table 24.
Jarvis (1978) grew perennial ryegrass (Lolium perenne) in a
loam soil amended with copper at concentrations of 9.5, 95.3 and 953
mg/kg (dry weight). Significant reductions in dry weight of shoots
and roots over 4 harvests were observed only at the highest
concentration.
Graham et al. (1986) grew carrizo citrange seedlings in sandy
soil amended with copper at concentrations ranging from 25 to 300
mg/kg as basic copper sulfate. The growth of seedlings and the
colonization by the mycorrhizal fungus Glomus intraadices were
reduced logarithmically with copper exposure. Copper-induced
reductions in seedling phosphorus uptake were more closely related to
the inhibition of hyphal development outside the root than to the
development of vesicles and arbuscules in the root.
Walsh et al. (1972) applied copper sulfate and hydroxide to a
loamy sand at rates of 15-486 kg Cu/ha for 2 years. Rates of up to 54
kg Cu/ha had no adverse effect on the yield of snap beans
(Phaseolus vulgaris). Slight decreases were noted at copper
concentrations in excess of 130 kg/ha and marked reductions in yield
were observed at 405 kg/ha of the hydroxide and 486 kg/ha of the
sulfate. Soil copper concentrations and yield were highly correlated.
Significant reductions in the yield of snap beans were noted when more
than 20 mg Cu/kg was extracted from soil with HCl or DTPA and when
more than 15 mg Cu/kg was extracted with EDTA.
Table 24. Toxicity of copper to terrestrial plants grown in soil
Organism Parameter End-point Concentration Reference
Perennial 4 harvests significant 953 mg/kg Jarvis
grass reduction in et al.
(Lolium dry weight (1978)
perenne) of shoots
and roots
Snap beans 2 years yield significant decrease Walsh
(Phaseolus at concentrations et al.
vulgaris) > 20 mg/kg extracted (1972)
with HCl or DTPA
or at 15 mg/kg when
extracted with EDTA
Gettier et al. (1988) studied the response of corn (Zea mays)
grown in fields amended with six annual applications of
copper-enriched manure or copper sulfate at application rates ranging
from 48 to 198 kg Cu/ha. No significant effect on grain yield was
observed in a fine sandy loam and clay loam soils. However,
applications of copper sulfate (60 and 198 kg/ha) caused significant
increases in grain yield on silt loam soil. There was no significant
accumulation of copper by corn plants during the experiment.
Cineraria maritima L and Centauria moschata L were tested for
their tolerance/sensitivity in metal-rich soils, which contained high
levels of copper and were derived from iron ore from Lalitpur, Girar,
India. The two plant species growing in the mineralized soil showed
higher accumulations of copper than those grown in non-mineralized
soils. The rate of photosynthesis and chlorophyll content were
reduced in C. maritima but not in C. moschata, indicating that
C. maritima is more sensitive to mineralized soil (Farooqui et al.,
1995).
9.3.3.2 Invertebrates
Neuhauser et al. (1985) exposed earthworms (Eisenia fetida) to
copper in both contact and artificial soil toxicity tests. In 48-h
contact tests LC50s were 6.7 µg/cm2 for copper acetate, 4.9 µg/cm2
for copper chloride, 7.4 µg/cm2 for copper nitrate and 6.3 µg/cm2
for copper sulfate. There was no significant difference between the
toxicity of the different copper salts. In an artificial soil test (2
weeks) the LC50 was found to be 643 mg Cu/kg. Spurgeon et al.
(1994), using the OECD recommended protocol, reported the 14-day LC50
for E. fetida to be 683 mg Cu/kg. The 56-day LC50 and NOEC were
555 and 210 mg Cu/kg, respectively; the EC50 and NOEC, based on
cocoon production, were 53.3 and 32 mg Cu/kg, respectively. Ma (1984)
estimated that the 6-week LC50 for the earthworm Lumbricus rubellus
was 1000 mg Cu/kg (dry weight soil).
Martin (1986) maintained earthworms (Allolobophora calignosa)
in soil containing copper concentrations ranging from 5 to 1000 mg/kg
for 14 days. All worms died at 1000 mg Cu/kg; copper significantly
reduced growth at 500 mg/kg and reduced the number of egg capsules per
worm at 100 mg/kg.
Van Gestel et al. (1989) exposed earthworms
(Eisenia fetida andrei) to copper for a 1-week preconditioning
period followed by a further 3 weeks. EC50s, based on cocoon
production, were 62 mg Cu/kg for the pre-conditioning period (1 week)
and 191 mg Cu/kg for the following 3-week exposure. A NOEL was
derived for the whole of the exposure period of 60-120 mg Cu/kg.
Cocoon hatchability was not affected by copper exposure. In 12-week
exposures copper concentrations of 10 and 18 mg/kg stimulated growth;
the EC50 and NOEC for growth reduction were > 100 and 56 mg Cu/kg,
respectively (Van Gestel et al., 1991).
Neuhauser et al. (1984) exposed earthworms (Eisenia fetida) to
500, 1000, 2000 and 4000 mg Cu/kg of manure (dry weight) for 6 weeks.
Copper significantly reduced growth and cocoon production. Similar
results were obtained with four different copper salts (acetate,
chloride, nitrate and sulfate). The growth rate and reproduction had
returned to normal after a 6-week period without copper.
Ma (1984) studied the effects of copper on growth, reproduction
and litter breakdown in earthworms (Lumbricus rubellus) during
6-week exposure periods in sandy or loam soils. Copper concentrations
of up to 373 mg/kg did not cause significant mortality. In sandy soil
the number of cocoons and litter breakdown were significantly reduced
at 131 mg Cu/kg; body weight gain was significantly reduced at 372 mg
Cu/kg. In loam soil the number of cocoons were significantly reduced
at 63 mg Cu/kg, litter breakdown at 136 mg Cu/kg and body weight gain
was unaffected at concentrations up to 373 mg Cu/kg. Ma (1988)
calculated 4-week EC50s, based on cocoon production, to be 122, 68
and 51 mg Cu/kg for the earthworms Lumbricus rubellus,
Aporrectodea caliginosa and Allolobophora chlorotica,
respectively.
Malecki et al. (1982) exposed earthworms (Eisenia fetida) to
six different copper salts for 8 weeks. Significant reductions in
growth and reproduction (cocoon production) were observed at copper
nitrate concentrations of 100 mg/kg (dry weight). Copper sulfate
caused significant reductions in reproduction at 100 mg/kg and copper
chloride reduced growth at 500 mg/kg. The other salts tested affected
growth and reproduction at copper concentrations of > 1000 mg/kg.
The least toxic salt was copper oxide which significantly affected
growth and reproduction at > 20 000 mg/kg. Long-term studies (20
weeks) with copper acetate revealed significant reductions in cocoon
production at 5000 mg Cu/kg.
Bengtsson et al. (1986) exposed earthworms (Dendrobaena rubida)
to copper concentrations of 10, 100 and 500 mg/kg in soil at varying
levels of acidity over a 3-month period. Survival of adults, cocoon
production and hatching success decreased with increasing acidity; the
reduction was even greater when low pH (pH 4.5) was combined with
copper. Irrespective of pH, 500 mg Cu/kg in the soil rapidly caused a
collapse of the worm population; survival and cocoon production were
significantly lower than in controls and hatching failed entirely.
Streit (1984) exposed orbatid mites and earthworms
(Octolasium cyaneum) to copper in soil-filled plastic containers for
6 weeks. Copper concentrations of up to 200 mg/kg had no significant
effect on the numbers of the seven predominating orbatid mite species.
However, at copper concentrations of 40 mg/kg the earthworms either
had been killed or had migrated to the noncontaminated half of the
container. The authors state that the toxicity of copper to
earthworms depends on the particular soil type and in particular the
organic carbon content of the soil. For example, 4-day LC50s were
reported at 181 mg Cu/kg in poor organic soil (3.2% carbon) and 2760
mg Cu/kg in peat soil (42.6% carbon).
Denneman & Van Straalen (1991) exposed the oribatid mite
(Platynothrus peltifer) to dietary copper in 3-month reproduction
tests. Copper concentrations of up to 2000 mg/kg (dry weight) had no
significant effect on survival. The NOECs for growth and reproduction
were found to be 9.42 and 2.65 µmol Cu/g, respectively.
Donkin & Dusenbery (1993) exposed nematodes
(Caernorhabditis elegans) to copper in different soil types in 24-h
toxicity tests. LC50s were 70, 534, 413, 1061 and 629 mg Cu/kg for
sand, sandy loam (66% sand), sandy loam (55% sand), loam and clay
loam, respectively. An LC50 for nematodes exposed in water only was
105 mg Cu/litre.
Parmelee et al. (1993) incubated forest soil treated with copper
(100, 200, 400 and 600 mg/kg) for 7 days. Omnivore-predator nematodes
and mesostigmatid and orbatid mites were the groups most sensitive to
copper and were significantly reduced at copper levels of 100 mg/kg.
Total nematode and microarthropod numbers declined significantly at
copper concentrations above 200 mg/kg. Trophic structure analysis
revealed that the high sensitivity of nematode predators reduced
predation and resulted in significantly increased numbers of nematodes
at 200 mg Cu/kg.
Marigomez et al. (1986) fed terrestrial slugs (Arion ater) on a
diet containing copper concentrations ranging from 10 to 1000 mg/kg
for 27 days. No treatment-related effect on mortality was observed.
Copper concentrations of 100 mg Cu/kg or more showed an exponential
change in feeding with treated slugs eating less than controls.
Initially the feeding behaviour of slugs on a diet of 50 mg Cu/kg was
unaffected, but by the end of the 278-day treatment they showed the
same reduction in feeding as the higher exposures.
Bayley et al. (1995) exposed larvae of the carabid beetle
(Pterostichus cupreus) to copper in both the soil (500 mg Cu/kg) and
in their food (500 mg Cu/kg fresh weight; 1357 mg Cu/kg dry weight).
Larval mortality due to copper exposure was 69% when adjusted for
control mortality and mainly occurred during larval metamorphosis and
pupation. The locomotor behaviour of male and female adult beetles
surviving the exposure to elevated copper during larval development
was significantly impaired.
Gintenreiter et al. (1993) reared gypsy moth (Lymantria dispar)
larvae on an artificial medium contaminated with copper (10, 50, 250
and 1250 mg/kg) from hatching or the fourth instar stage to pupation.
All larvae died at 1250 mg Cu/kg and larval survival was significantly
reduced at 250 mg Cu/kg. Contamination from hatching generally
resulted in a decrease in headcapsule width and this was significant
at a copper concentration of 50 mg/kg. The number of larvae hatched
per egg cluster was significantly reduced at 50 mg Cu/kg. NOECs were
10 mg Cu/kg for development rate, growth and reproduction, and 50 mg
Cu/kg for mortality in larvae exposed from the first instar. NOECs
were 10 mg Cu/kg for reproduction, and 50 mg Cu/kg for development
rate, mortality and growth in larvae exposed from the fourth instar
stage. Ortel et al. (1993) reared moth larvae on diets containing
copper at 10 or 50 mg/kg. No correlation was found between the extent
of copper contamination and parasitization success by the braconid
wasp (Glyptapanteles liparidis).
Nectoux & Bounias (1988) dosed honeybees (Apis mellifera) with
sucrose solutions containing copper at concentrations ranging from 250
to 2000 mg/litre. Controls gave an LT50 of 27 days with a daily
percentage mortality at 3%. LT50s for dosed bees ranged from 5.1 to
14.2 days with the daily percentage mortality ranging from 5.78% per
day to 30.22% per day.
9.3.3.3 Vertebrates
Dodds-Smith et al. (1992a,b) maintained shrews (Sorex araneus)
on a diet containing copper at an intake of 2.13 mg/day for 12 weeks.
There was no significant effect on growth rate during the feeding
trial and no relationship between copper intake and mortality.
Aulerich et al. (1982) fed young mink on a diet containing 0, 20,
50, 100 or 200 mg Cu/kg for 153 or 357 days. The shorter exposure did
not significantly affect haemoglobin or haematocrit levels.
Reproduction performance was not adversely affected, although greater
mortality in young mink and reduced litter mass were a result of the
higher copper exposures. Intraperitoneal LD50s for adult mink were
7.5 mg/kg for copper sulfate and 5.0 mg/kg for copper acetate.
A summary of the toxicity of copper in domestic animals was
published by the committee on animal nutrition of the National
Research Council (1980). The information presented indicates that
sheep are more sensitive to copper than other domestic animals, and
horses appear to be more tolerant than cattle, pigs, sheep or poultry.
This is in agreement with the results presented by Smith et al. (1975)
who fed yearling ponies a pelleted diet up to 791 mg Cu/kg with no
visible effects after 6 months.
The results of Hill & Williams (1965) showed that a dietary
concentration of 266 µg Cu/g (dry weight) slightly reduced the
live-weight gain in lamb. At 40.7 µg Cu/g the reduction in the rate
of live-weight gain was statistically significant.
The use of copper as a feed additive for growth stimulation has
attracted interest in its toxic effects. Combs et al. (1966) studied
the effect of the level of dietary protein in pigs fed high copper
rations. Their results indicated that pigs fed a diet containing 250
ppm (mg/kg) copper and either 14 or 22% protein had daily gains of
0.80 and 0.78 kg, respectively, while those given diets containing 500
ppm (mg/kg) copper and either 14 or 22% protein gained 0.48 and 0.55
kg daily, respectively.
9.4 Field observations
9.4.1 Microorganisms
Mathur et al. (1979) studied a 2-ha field comprising an organic
muck soil which had been cultivated for 45 years, having residual
fertilizer copper applied to a distinct site for the last 15 years.
The soil copper content ranged from 150 to 260 mg/kg (dry weight).
The rate of carbon dioxide evolution was significantly negatively
correlated with both the total and extractable copper contents of the
soil. Acid phosphatase activity significantly decreased as copper
content increased. Dumontet et al. (1992) reported a significant
negative correlation between both copper and cadmium, and soil
respiration in the 0-15-cm layer of contaminated soil from the
vicinity of a copper-zinc smelter. However, the authors did not find
a significant correlation between soil copper and acid phosphatase
activity.
Minnich & McBride (1986) studied five soils which had received
anthropogenic copper inputs for many years: recent sludge, aged
sludge, spillsite, vineyard and muck. The copper concentrations in
the soils ranged from 33 to 1445 mg/kg soil (dry weight). No
significant effects due to copper on carbon mineralization were
detected. Nitrogen metabolism was significantly increased only in the
soil which had received recent sludge additions.
Burton (1987) surveyed river water and sediment samples and one
soil sample for bacterial resistance to metals. Between 0 and 2.4% of
bacterial populations sampled were resistant to 1 mmol Cu/litre. The
highest resistance was found at Crater Lake, Colorado, USA. However,
sediment copper concentrations were much higher at several other
sites.
9.4.2 Aquatic organisms
Wood (1983) found that naturally occurring marine phytoplankton
populations show a tolerance to added cupric ions which far exceeds
the physiological limits of phytoplankton cultures grown in chemically
defined media. The tolerance appears to be due to regulation of
bioavailability of added copper by an abundance of copper-complexing
agents. Coastal phytoplankton were less sensitive than continental
shelf or oceanic communities. The toxicity of copper correlated more
with copper-complexing capacity than with biotic species composition
or community structure.
Effler et al. (1980) monitored the impact of low-level copper
applications to Cazenovia Lake, New York, USA. The application caused
only small increases (up to 5 µg Cu/litre) for 2-5-day periods. The
treatment did not achieve the desired algicidal action on the target
phytoplankton. There were short-term alterations in the seasonal
succession processes within phytoplankton populations. No significant
effects on zooplankton or submerged macrophytes were observed.
Hanson & Stefan (1984) summarized the effects of nearly 60 years
of copper use as an algicide on some lakes in Minnesota, USA. Copper
treatments have been as high as 250 µg Cu/litre averaged over the
entire lake. Algal mortality has led to hypolimnetic oxygen depletion
and affected nutrient dynamics. Phytoplankton populations have
shifted to greater dominance of blue-green algae. Several major fish
kills related to transiently high copper concentrations have been
documented, and fish populations have shifted to less desired species.
Sediment concentrations as high as 5600 mg Cu/kg have developed,
affecting development of macrophytes and benthic invertebrate
populations.
Carlson et al. (1986) investigated the effects of copper on the
Naugatuck River, Connecticut, USA, which received multiple discharges
from domestic and industrial sources. Downstream from the major
effluents, there were severe effects on fish, periphyton, and benthic
invertebrates. Average total copper concentrations at sampling
stations in the affected area ranged from 50 µg Cu/litre to over 400
µg Cu/litre, whereas stations with little or no impact had average
concentrations < 20 µg Cu/litre. Toxicity tests using river water
showed reduced survival of Ceriodaphnia dubia in samples from
affected areas, but little or no effects from samples from unimpacted
areas. The US EPA water quality criteria for the river varied from 5
to 12 µg Cu/litre for 4-day average concentrations and from 7 to 18 µg
Cu/litre for 1-h average concentrations. These concentrations were
exceeded even in the unaffected area. However, toxicity tests using
dilution water from the river showed copper to be 3-8-fold less toxic
than did dilution water typical of laboratory tests used to establish
the criteria. Therefore, site-specific criteria were estimated to be
24-43 µg Cu/litre for the 4-day average and 34-61 µg Cu/litre for the
1-h average. These concentrations were rarely exceeded upstream from
the major discharges, but were routinely exceeded downstream,
consistent with the observed biological impact.
Grant et al. (1989) studied the tolerance of polychaete worms
(Nereis diversicolor) to copper. Polychaete worms collected from a
site with surface sediment levels of 1733 mg Cu/kg were more tolerant
when exposed to 500 µg Cu/litre in acute tests than those from a
low-metal site (19 mg Cu/kg). LT50 values were 70 h for worms from a
low-metal site and 1407 h for those from the contaminated site.
Laboratory-bred worms still retained the tolerance. Worms showed a
graded level of tolerance depending on field exposure.
Han & Hung (1990) reported the case of green oysters
(Crassostrea gigas) in the Charting mariculture area of southwestern
Taiwan in January 1986. The green colouration was found to be due to
high copper content of the oyster tissue. A survey of the area
revealed total dissolved copper levels ranging from 5 to 23.6
µg/litre, particulate copper levels ranging from 1 to 5.5 µg/litre and
oyster tissue levels with a mean of 4401 mg Cu/kg (dry weight). Green
oysters have occasionally been observed in other areas.
Copper-rich granules have been reported to occur in a wide
variety of invertebrates inhabiting copper-polluted habitats. Weeks
(1992) observed copper-rich granules in the ventral caeca of talitrid
amphipods (Orchestia gammarellus) revealed by transmission electron
microscopy. In addition, copper deposits also appear in the physodes
of Fucus vesiculosis and F. serratus (Smith et al., 1986). The
occurrence of intracellular deposits containing copper were reported
in a copper-tolerant isolate of the green alga Scenedesmus
(Silverberg et al., 1976). In the latter case the metal appeared
mainly in the nucleus, although similar structures were observed in
the cytoplasm. Silverberg and co-workers concluded that the
occurrence of these inclusions could be regarded as a detoxifying
mechanism because they were absent in the non-tolerant strains.
Copper has been detected in polyphosphate bodies in the green alga
Chlorella furca (Wong et al., 1994) and in the fouling diatoms
Amphora and Navicula (Daniel & Chamberlain, 1981).
9.4.3 Terrestrial organisms
9.4.3.1 Tolerance
Duvigneau & Denaeyer-De Smet (1963) studying the copper content
in leaves of plant species growing on soils containing 500 mg Cu/kg
(dry soil) emphasize that there is more than one tolerance mechanism
operating. They found that some species avoid copper toxicity by
excluding the metal, some species accumulate the metal to very high
concentrations and other species occupy an intermediate position.
They conclude that there may be both exclusion and accumulation
mechanisms evolving in different species of the same genus.
Wu & Kruckeberg (1985) found that two legume plants
Lupinus bicolor and Lotus purshianus growing on copper mine waste
in northern California, USA, with a mean soil copper content of 460
mg/kg exhibited considerably greater copper tolerance at 0.2 mg/litre
in nutrient solution than plants from an adjacent meadow where copper
levels were 0.1-1.5 mg/kg. The tolerance index of the field-collected
plants was positively correlated with the copper concentration of the
soil from which the plants were collected. Wu & Lin (1990) isolated
the nitrogen-fixing bacterium Rhizobium loti from root nodules of
L. purshianus growing on the copper mine and found it to have
greater copper tolerance than rhizobium isolated from plants in a
nearby field. No difference was detected in uptake pattern or
concentration of copper in tolerant and nontolerant L. purshianus.
However, a copper accumulation mechanism associated with tolerance was
found in the symbiotic rhizobium. Effective nitrogen fixation was
seen in copper-enriched soils.
Kruckeberg & Wu (1992) investigated the tolerance of herbaceous
plants colonizing copper mine waste sites in northern California, USA.
Five of the seven species tested showed elevated copper tolerance.
The copper-tolerant species were found at more than one copper mine.
The mines were geographically isolated, so tolerance in these plant
species probably evolved independently. In Arenaria douglasii,
Bromous mollis and Vulpia microstachya the exclusion of copper
from the shoots partly by immobilization at the roots may be a
mechanism of tolerance. However, in some species there were no
differences between the uptake of copper into tissues of tolerant and
nontolerant species. Therefore, it would appear that different
mechanisms of copper tolerance have evolved among the plant species
colonizing California copper mine waste sites.
Dickinson et al. (1991) studied the survival of sycamore
(Acer pseudoplatanus) trees at a metal-contaminated site (copper
refinery) in northwest England where populations of the herbaceous
flora have evolved metal tolerance. Cell culture growth experiments
on explant material from shoot meristems of mature trees showed
increased tolerance to copper. Some of these trees predated the
establishment of the refinery. However, tolerance tests on tree
seedlings showed no evidence that the trees produce tolerant
offspring. The tolerance of the mature trees is ascribed to
phenotypic adaptation induced during the life of the tree as site
contamination occurred.
Taylor & Crowder (1984) did not find copper tolerance in the
cattail rush (Typha latifolia) collected from the vicinity of a
copper smelter near Sudbury, Ontario, Canada, with soils contaminated
with 3738 mg Cu/kg and 9372 mg Ni/kg. Growth of both contaminated and
non-contaminated plants was inhibited by 100 mg/kg copper-EDTA. No
particular in vivo copper tolerance was found in the clones from the
heavily contaminated site. The metals at this site are believed not
to be bioavailable owing to the strongly anaerobic waterlogged
conditions or to the presence of high sulfide levels in the mud.
Rauser & Winterhalder (1985) collected several grass species from
the vicinity of the Sudbury copper smelter (Ontario, Canada). They
found clones of the grass species Deschampsia caespitosa,
Agrostis gigantea and Poa compressa to be tolerant to copper.
Hordeum jubatum plants showed no tolerance to copper exposure.
Frenckell-Insam & Hutchinson (1993) found copper tolerance in
populations of the grass Deschampsia cespitosa collected at seven
Canadian or German mine sites, with some Sudbury area plants
performing better in the presence of normally toxic levels of copper.
Schultz & Hutchinson (1988) showed that this copper tolerance in
D. cespitosa was not due to a metallothionein-like protein.
Wainwright & Woolhouse (1977) studied three clones of
Agrostis tenuis with respect to the effects of copper (64, 6.4 and
0.64 mg/litre; 10-1, 10-2 and 10-3 mmol/dm3) in nutrient solution on
growth of root segments excised from the zone of cell elongation.
Growth (24 h) of copper-tolerant and zinc-tolerant clones was less
inhibited by copper than was the growth of a non-tolerant clone.
Concentrations of copper ions which inhibited root growth also caused
leakage of potassium ions from cells. The authors suggest that the
loss of potassium ions from roots is due to the toxic effect of copper
ions on the plasmalemma.
9.4.3.2 Copper fungicides and fertilizers
During perennial tree production, amendments to soil of trace
elements essential for growth are often necessary. However,
application of such amendments results in the accumulation of elements
in topsoil. Copper can also build up as a result of routine
application of copper at relatively high rates with fertilizers. In
addition, the routine spraying of copper-based fungicides can result
in copper accumulation. Reuther & Smith (1953) reported an increasing
number of Florida, USA, citrus orchards on sandy, acid well-drained
soils affected with a chlorotic disorder of the foliage. The authors
linked this disorder with possible effects of high copper levels.
Paoletti et al. (1988) reported that spring/summer fungicide
(Bordeaux mixture) treatment of vineyards in Italy caused a decrease
in the local population of earthworms. In particular, a decrease in
the number of juvenile Allolobophora was recorded. Other macro
invertebrates were unaffected, both in terms of biomass and number of
species, by fungicide applications.
10. EVALUATION OF HUMAN HEALTH RISKS AND EFFECTS ON THE ENVIRONMENT
10.1 Concepts and principles to assess risk of adverse
effects of essential elements such as copper
10.1.1 Human health risks
There are risks associated with low intakes as well as high
intakes of essential elements. The relationship between
intake/exposure level and risk therefore has a U-shaped curve, with
risks from deficiency at low intakes and risk of toxicity at high
intakes (see Fig. 2). There is a need to define an intake range that
prevents both deficiency and toxicity for the general population. The
range of acceptable intakes to meet the biological requirement, as
well as prevent risk of toxicity, may be extremely narrow. A balanced
and comparable scientific approach to assess risk from deficit as well
as excess is needed when evaluating essential elements such as copper.
10.1.2 Homoeostatic model
The homoeostatic model describes an acceptable range of exposures
or intake (AROI, acceptable range of oral intake) for essential trace
elements that permits optimum health (Fig. 2). Environmental levels
of copper within the acceptable range of exposure do not produce
adverse health effects among members of the general population.
However, there are individuals or groups with disorders in
homoeostatic mechanisms that experience health effects, either
deficiency or toxicity, from exposures within the acceptable range.
These disorders may be of genetic origin or from acquired disease.
10.2 Evaluation of risks to human health
10.2.1 Exposure of general population
For healthy humans who are not occupationally exposed the major
route of exposure to copper is oral. The mean daily dietary intake of
copper in adults ranges between 0.9 and 2.2 mg (see section 5.4). A
majority of studies have found intakes to be at the lower end of that
range. The variation reflects different dietary habits, as well as
different agricultural and food-processing practices used throughout
the world. Drinking-water may make a substantial additional
contribution to the total daily intake of copper, particularly in
households where corrosive waters have stood in copper pipes. In
homes without copper piping, or with noncorrosive water, copper intake
from drinking-water seldom exceeds 0.1 mg/day, although intakes
greater than a few mg per day can result from corrosive water
distributed through copper pipes. In general, total daily oral
intakes are between 1 and 2 mg Cu/day, although they may occasionally
exceed 5 mg Cu/day. All other routes of copper exposure (inhalation
and dermal) are insignificant in comparison to the oral route.
Inhalation adds between 0.3 and 2.0 µg Cu/day from dusts and smoke.
Women using copper IUDs are exposed to only 80 µg Cu/day or less from
this source.
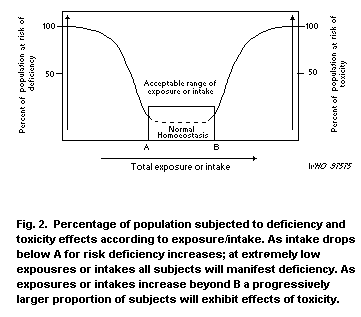 10.2.2 Occupational exposures
Under occupational conditions where exposure to airborne copper
is controlled at or below the widely accepted standard of 1 mg Cu/m3,
and assuming a shift inspiratory volume of 10 m3 and a usual
workplace distribution of particle sizes, an estimated intake of 8.5
mg Cu/day can be calculated for occupational sources. This may be an
important contribution to daily intake; however, this is a worst-case
estimate using default values and present occupational conditions
rarely lead to this level of exposure.
10.3 Essentiality versus toxicity in humans
10.3.1 Risk of copper deficiency
Clinically evident copper deficiency in adults is rarely found in
the general population. However, recent dietary surveys show that the
mean population intake is suboptimal. In some regions of the world,
such as Europe and the USA, intakes are about 20% below the
recommended levels. The health consequences of marginally adequate
intakes remain to be determined.
Infants with low birth weight (up to 15% of children worldwide)
are particularly at risk for deficiency. Frequent episodes of
diarrhoea are another risk factor leading to copper deficiency. Copper
deficiency commonly occurs during the recovery from protein energy
malnutrition, since these infants grow rapidly and are usually fed
diets that supply inadequate copper.
Based on dietary interactions, individuals taking supplements of
zinc and ascorbic acid are at risk of developing copper deficiency.
Malabsorption states associated with copper deficiency include
chronic diarrhoea, short bowel syndrome, partial gastrectomy, coeliac
disease, sprue and cystic fibrosis.
Patients receiving prolonged intravenous nutrient mixtures which
lack sufficient copper may develop symptomatic evidence of copper
deficiency.
Menkes disease (see chapter 8) is a rare (approx. 1 : 200 000)
X-linked recessive disorder which results in a defect in the
intestinal absorption of copper. This disorder leads to a severe,
symptomatic, fatal deficiency state even at copper intakes above the
AROI.
Copper deficiency has been implicated as a possible risk factor
in the pathogenesis of cardiovascular disease.
10.3.2 Risk from excess copper intake
10.3.2.1 General population
When copper homoeostatic control is defective and/or copper
intake is excessive, copper toxicity may occur. Ingestion of excess
copper is infrequent in humans and is usually a consequence of the
contamination of beverages (including drinking-water) or from
accidental or deliberate ingestion of high quantities of copper salts.
Effects which occur at lowest levels are those on the gastrointestinal
tract; for example, nausea, vomiting and diarrhoea. Doses which
induce such effects have not been well characterized and confounders
such as microbiological quality of water supplies or other potential
causes of the symptoms have not been adequately considered. On the
basis of available data, gastrointestinal illness appears to be
associated with consumption of drinking-water containing several
mg/litre of copper, but it is not possible to provide a precise
number. Symptoms disappear following a change of water supply.
Wilson disease (hepatolenticular degeneration; see chapter 8) is
the most common (approx. 1 : 30 000) inherited disorder of copper
metab olism. The mode of inheritance is an autosomal recessive trait
which results in decreased biliary excretion of copper and in hepatic
accumulation of the metal.
Other extremely rare conditions such as ICC and ICT are
characterized by copper accumulation in early childhood. The relative
contribution of genetic factors and/or elevated environmental exposure
to copper remains undefined.
A more common cause of copper accumulation in the liver is
chronic liver disease associated with chronic cholestasis. These
disorders include primary biliary cirrhosis, primary sclerosing
cholangitis, extrahepatic biliary obstruction or atresia and
intrahepatic cholestasis of childhood. In these conditions, copper
accumulation does not appear to be primarily responsible for hepatic
injury.
Copper or copper salts may induce allergic contact dermatitis in
susceptible individuals.
There is no convincing evidence of an association between
increased dietary copper intake and cardiovascular disease.
Available data in humans and animals are inadequate to assess the
reproductive/developmental effects of copper compounds.
There is no convincing evidence that copper plays an aetiological
role in the development of cancer in humans, on the basis of available
epidemiological data and limited experimental data in animals. The
weight of evidence from in vitro and in vivo assays indicates that
copper sulfate is not genotoxic.
10.3.2.2 Occupational risks
Studies of populations of copper workers have failed to
demonstrate systemic copper toxicity or significant excess of cancer.
No occupational studies were found to indicate that copper exposures
resulted in reproductive or developmental effects.
In occupational settings, acute effects are limited to metal fume
fever. This condition has been produced by inhalation of fresh copper
fume at air concentrations above 0.1 mg Cu/m3. Similar responses to
very finely divided copper metal and oxide dusts have been reported
where conditions probably resulted in unusually high dust
concentrations.
Chronic effects involving the liver have been reported in workers
whose exposures were uncontrolled and likely to have been high.
10.4 Evaluation of effects on the environment
10.4.1 Concept of environmental risk assessment
The science of performing environmetal risk assessments has
evolved rapidly in recent years, with standardized techniques being
adopted in both the USA and Europe (US EPA, 1992; OECD, 1995). The
key components of environmental risk assessment paradigms include
problem formulation, analysis (which includes both exposure and
effects analysis), and risk characterization.
Problem formulation consists of defining the risk problem,
assessing the population, community, or ecosystem at risk,
establishing the model for evaluating the potential for risk and
selecting the biological end-points and environmental media to
analyse. The analysis phase consists of performing detailed studies
designed to characterize the spatial and temporal concentrations of
the chemical of interest. Additionally, a series of standardized
laboratory and, in some cases field studies, are performed to evaluate
the toxicity dose-response curve for selected end-points and species
of interest. The risk characterization phase integrates the exposure
and effects data, determines the potential for co-occurrence between
organism and contaminant and comes to a conclusion about the potential
for risk. The risk statement can be made in terms of a probability
statement, frequency of time effects are expected to occur or number
of species to be affected. Risk is assessed by determination of the
adequacy of the margin of safety between effects and exposure
concentrations, and expert judgement is typically used to determine
the acceptability of the perceived margin of safety. There is a
general consensus that the larger the margin of safety the lower is
the environmental risk. Margins of safety less than 1.0 are usually
indicative of a higher potential for risk and may require further
evaluation.
10.4.2 Components of risk assessment process for copper
The principal components of risk assessment are exposure and
effects characterization. The environmental exposure has been
assessed by reviewing the fate (transport, distribution and behaviour)
from the point of release into and through the environmental
compartments of air, water soil/sediment and biota. Toxicity tests
with copper have been done on representative species of the trophic
levels in the ecological community of interest, including algae and
plants (primary producers), aquatic and terrestrial invertebrates
(secondary producers) and fish and terrestrial animals (consumers).
Since copper is an essential micronutrient, a lower limit exists
below which deficiency will occur (see section 10.1). Thus the use of
large safety factors in procedures to limit exposures to below toxic
levels might result in target concentrations below essential levels.
This potential problem has been addressed in the deficiency toxicity
optimum concentration band for essential elements (DT-OCEE) concept
(van Tilborg, 1996). Because copper is a ubiquitous trace metal in
the natural environment, it is unlikely except in some terrestrial
regions where copper concentrations are very low, or where
antagonistic molybdenum interactions occur, that deficiency will be a
significant issue in the environment. In view of these concepts, the
environmental risk assessment paradigm for essential elements such as
copper must (as for humans, see section 10.1.1) be expressed as a
deficiency-toxicity model which describes an acceptable concentration
range for copper in the environment.
One of the key questions in ecotoxicology is to what extent
laboratory tests in defined media under carefully controlled
conditions are predictive of effects that will be seen in the
environment. Traditional toxicity testing has in the past focused on
the acute (mortality) and chronic (e.g. growth and reproduction)
effects of chemicals on the life stages of representative aquatic and
terrestrial organisms. In recent years it has been realized that the
environmental chemistry, especially in relation to metal speciation
and complexation, will have a signficant influence on and be a
determinant of the outcome of laboratory toxicity tests as well as the
effects actually seen in the environment. Several papers cited in
chapter 9 report this circumstance (see section 9.1), which has been
generalized in an hypothesis which describes the bioavailability of
copper. This has led to the now accepted view that the total copper
in the environmental medium is not a good predictor of its
bioavailability. Acceptance of this concept also leads to the logical
conclusion that the risk assessment of copper should ideally be made
on a site-specific basis.
Organisms may also become adapted at a local scale by
physiological acclimation and possibly genetic changes. Because of
such adaptations the test-derived toxicity values will be elevated
compared to the values for the same species from a nonadapted
population. On this basis it is essential that the risk assessment of
copper should be made on a site-specific basis.
10.5 Environmental risk assessment for copper
For the purposes of characterizing the potential risk of copper
to the environment there are limited data available for perfoming a
detailed risk assessment for each environmental medium (air, water,
soil, sediment). The largest data set is available for the aquatic
environment. The intent of this section is to evaluate the available
biological effects and exposure data for various organisms and media
consistent with this risk paradigm, and describe ranges of
concentrations where the potential for risk increases.
10.5.1 Aquatic biota
10.5.1.1 Overview of exposure data
Natural freshwater streams normally have total dissolved copper
concentrations in the range of 1.0-20 µg/litre. Open ocean surface
waters contain 0.02-0.2 µg Cu/litre, although near-shore seawater may
have copper concentrations as high as 1.0 µg/litre. In the ocean,
copper concentration increases with depth. These natural copper
levels can be increased by anthropogenic input; for example, acid mine
drainage increased the copper concentration up to 600 µg/litre in
Restronquet creek, United Kingdom, and Chesapeake bay, USA, can have
copper levels as high as 80 µg/litre as a result of shipping activity.
The toxic effect of copper on aquatic biota is critically
dependent on the bioavailability of copper in water, which in turn
depends on the physicochemical form (i.e. speciation) of the copper.
The bioavailability is decreased by the complexation and adsorption of
copper by natural organic matter, iron and manganese hydrated oxides,
and chelating agents excreted by algae and other aquatic organisms.
Toxicity can also be affected by pH and hardness. For these reasons,
total copper is rarely useful as a predictor of toxicity. Studies
have shown that in natural seawater more than 98% of copper is bound
by organic matter and in rivers a high percentage is often organically
bound, but the actual percentage depends on the dissolved organic
concentration of the river water and its pH.
10.5.1.2 Overview of toxicity data
Copper exhibits significant toxicity to some aquatic organisms,
although the degree of toxicity is highly variable and the
bioavailability of copper dictates its toxicity to a large extent.
Some algal species are very sensitive to copper. EC50 values as
low as 47 µg/litre total dissolved copper have been reported for 96-h
growth rate experiments, but for other algal species EC50 values up
to 481 µg/litre have been found. However, it is possible that many of
the high EC50 values in the literature are the result of the growth
rate experiments being carried out in culture media containing
copper-complexing agents such as silicate, iron, manganese and EDTA,
which reduce the bioavailability of copper.
Acutely lethal copper concentrations to aquatic invertebrates
range from several µg/litre to several mg/litre. The 48-96-h LC50s
of copper ranged from 7 to 54 µg/litre for Daphnia magna, 37 to 183
µg/litre for amphipods, 58 to 112 µg/litre for gastropods and 50 to
100 µg/litre for crab larvae. Sublethal effects and effects on
longer-term survival have been reported in a variety of invertebrate
species for copper concentrations from about 1 µg/litre to a few
hundred µg/litre. For high bioavailability waters, effect
concentrations for several sensitive taxa can be < 10 µg Cu/litre.
Acutely lethal copper concentrations for fish range from a few
µg/litre to several mg/litre, depending greatly both on the test
species and exposure conditions. Acute LC50s less than 50 µg
Cu/litre for fish generally are associated with test waters with low
DOC, low hardness, and neutral to slightly acidic pH. Sublethal
effects and effects on longer-term survival have been reported from 1
µg/litre to a few hundred µg/litre, with effects less than 50 µg
Cu/litre being reported for several species. Again, lower effect
concentrations are generally associated with test waters of high
bioavailability.
Because of the variability of toxic effects concentrations among
different biological taxa and exposure conditions, the expected
response of aquatic communities will be highly site specific. Table
25 provides a general summary of the nature of response expected for
various concentration ranges at sites with moderate to high
bioavailability similar to water used in most toxicity tests.
10.5.2 Terrestrial biota
10.5.2.1 Overview of exposure data
Copper in uncontaminated soils in Europe, USA, Canada and
elsewhere has been measured as total and extractable and with depth in
soils. The range of copper concentrations in such soils varies
between 0.3 and 250 mg/kg (Bowen, 1985; Adriano, 1992) with soil type
being a factor in determining the levels found. Peaty and organic
soils are at the upper end of this range, as are loams; sandy soils
are at the low end.
Any anthropogenic addition to the surface of such soils, whether
by fertilizer or fungicide applications or from highway dust or
airborne deposition from urban and industrial sources, causes sharp
increases in the copper levels of such soils. Copper added to provide
adequate levels for citrus crops or in orchards and vineyards from
fungicide and insecticide application causes a buildup in soils
(150-400 mg Cu/kg).
Table 25. Responses expected for various concentration ranges of coppera
Total dissolved Effects of high bioavailability in water
Cu concentration
range (µg/litre)
1-10 significant effects are expected for diatoms and sensitive
invertebrates, notably cladocerans. Effects on fish could be
significant in freshwaters with low pH and hardness
10-100 significant effects are expected on various species of
microalgae, some species of macroalgae, and a range of
invertebrates, including crustaceans, gastropods and sea
urchins. Survival of sensitive fish will be affected and a variety
of fish should show sublethal effects
100-1000 most taxonomic groups of macroalgae and invertebrates will
be severely affected. Lethal levels for most fish species will
be reached
> 1000 lethal concentrations for the most tolerant organisms are
reached
a Sites chosen have moderate to high bioavailability similar to water used in
most toxicity tests.
Mining and smelting activities, especially from copper or
copper-zinc smelters, often cause surface soil levels to exceed 1000
mg Cu/kg.
10.5.2.2 Plant foliar levels
Generally, vegetation rooted in soils reflects the soil copper
levels in its foliage. This is dependent upon the bioavailability of
the copper, and the physiological requirements of species concerned.
On uncontaminated soils foliar levels vary broadly in the range 6.1-25
mg/kg. For grazing animals and for much of the food chain, plant
foliar levels are of concern.
On soil contaminated by copper additions (in the range of 150-450
mg Cu/kg), the foliar levels may reach 80 mg Cu/kg, and in mining and
smelting area the copper level in foliage can reach 300 mg/kg.
Specific hyperaccummulator species can have foliar levels to 17 000 mg
Cu/kg without adverse symptoms.
On normal forest soils the nonrooted plants can have higher
copper concentrations. These species include mosses and lichens. The
fruiting bodies and mycorrhizal sheaths of soil fungi associated with
higher plants in forests often accumulate copper to much higher levels
than the higher plants at the same site, e.g. Lepp (1992) reports
copper concentrations in fungi up 469 mg/kg while foliage levels of
5-20 mg Cu/kg were measured at the same site.
10.5.2.3 Assessment of toxicity of copper in soil
Leaving aside the question of copper surface mineralization, at
the normal soil concentrations reported (0.3-250 mg Cu/kg) plants
rarely if ever show symptoms of toxicity or of adverse growth effects.
Crops are often more sensitive to copper than the native flora, so
protection levels for agricultural crops range from 25 mg Cu/kg to
several hundred mg/kg, depending on the country. Chronic and or acute
effects on sensitive species do occur at copper levels occurring in
some soils as a result of human activities, e.g. copper fertilizer
addition, fungicide spraying, sludge additions (50-150 mg Cu/kg).
When soil levels rise above 150 mg Cu/kg we begin to find more
and more native and agricultural species showing chronic effects.
Soils in the range 500-1000 mg Cu/kg act in a strongly selective way,
allowing only survival of copper-tolerant species or strains. A
reduction in species diversity occurs. By the time soil levels reach
2000 mg Cu/kg a high number of species cannot survive. By 3500 mg
Cu/kg areas are largely devoid of vegetation cover. Exceptions again
are the old-established copper-tolerant flora on major
mineralizations, e.g. in Zaire, Zimbabwe and Borneo.
Effects of copper in soil on terrestrial biota are reported at
concentrations ranging from approximately 4 to 7000 mg Cu/kg (chapter
9). With the exception of one study reporting a decrease in yield for
snap beans at 15 mg/kg (copper extracted with EDTA) (Walsh et al.,
1972) the most sensitive end-points were related to soil microbial
metabolism, measured as enzymatic activity and soil respiration. On
the basis of the data reviewed in this assessment, the organic content
of the soil appears to be a key factor affecting the bioavailability
of copper, thus strongly influencing its toxicity.
11. CONCLUSIONS AND RECOMMENDATIONS FOR PROTECTION OF HUMAN HEALTH
AND THE ENVIRONMENT
11.1 Human health
The lower limit of the AROI is 20 µg Cu/kg per day. This figure
is arrived at from the adult basal requirement with an allowance for
variations in copper absorption, retention and storage (WHO, 1996).
In infancy, this figure is 50 µg Cu/kg per day.
The upper limit of the AROI in adults is uncertain, but it is
most likely in the range of several but not many mg per day in adults
(more than 2 or 3 mg/day). This evaluation is based solely on studies
of gastrointestinal effects of copper-contaminated drinking-water. A
more specific value for the upper AROI could not be confirmed for any
segment of the general population. We have limited information on the
level of ingestion of copper from food that would provoke adverse
health effects.
The available data on toxicity in animals were considered
unhelpful in establishing the upper limit of the AROI, owing to
uncertainty about an appropriate model for humans. Moreover,
traditional methodology for safety assessment, based on application of
uncertainty factor to data in animals, does not adequately address the
special attributes of essential elements such as copper.
From available data on human exposures worldwide, but
particularly in Europe and the Americas, there is greater risk of
health effects from deficiency of copper intake than from excess
copper intake.
To increase the level of public health protection worldwide, it
is recommended that:
1. National and international nutritional guidelines are adhered to
in order to address potential copper deficiency.
2. Increased monitoring of the concentration of copper in
drinking-water and food should be carried out.
3. There should be increased awareness of the possibility that high
copper exposure of newborns may result in adverse health effects.
4. The development of population-based liver disease registries for
infant and childhood disease should be encouraged.
11.2 Environmental protection
Protection of aquatic life in waters with high bioavailability
will require limiting total dissolved copper to some concentration
less than 10 µg/litre (see Table 25); however, the appropriate
concentration limit will depend on the biota and exposure conditions
at sites of concern and should be set based on further evaluation of
relevant data.
At many sites, physicochemical factors limiting bioavailability
will warrant higher copper limits. Regulatory criteria should take
into account the speciation of copper if dischargers can demonstrate
that the bioavailability of copper in the receiving water can be
measured reliably.
When sampling and analysing environmental media for copper, it is
essential that clean techiques be employed.
Because copper is an essential element, procedures to prevent
toxic levels of copper should not incorporate safety factors that
result in desired concentrations being below natural levels.
12. FURTHER RESEARCH
12.1 Health protection
1. Determine the bioavailability of dietary copper, particularly in
vegetarian diets.
2. In human populations develop the methodology for identifying
adverse effects of marginal copper deficiency and of intakes in
excess of recommended levels. This should include an evaluation
of stable isotope technology to define bioavailability and body
stores of copper.
3. Determine the concentrations of copper and the other quality
parameters of drinking-water that produce toxicity from single
and chronic exposures (e.g. gastrointestinal effects).
4. Characterize the mechanisms that influence copper homoeostasis
including placental transfer of copper.
5. Studies on ICC populations to determine:
a) genetic component
b) relationship to ICT
c) mechanisms related to basic defect
d) methods for early diagnosis of ICC and ICT
12.2 Environmental protection
1. More research is needed to validate existing physicochemical
speciation techniques for copper and to develop improved methods.
These methods should be calibrated against suitable bioassays.
There is also a need for the development of more sensitive, rapid
bioassays for copper.
2. Predictive models should be developed for relating
bioaccumulation and toxic response to copper speciation and other
physicochemical factors that affect bioavailability and toxicity.
3. Insufficient data are available on the toxicity of copper to
benthic organisms and more studies are needed in this area.
4. Considerations should be given to the development of more
realistic soil toxicity tests that utilize "real" soils; possibly
of national relevance. Alternative and more appropriate
invertebrate test species should be investigated. Studies
correlating measures of copper bioavailability to body burden
should be undertaken.
13. PREVIOUS EVALUATIONS BY INTERNATIONAL BODIES
The International Agency for Research on Cancer evaluated copper
8-hydroxyquinoline in 1977 (IARC, 1977) and re-evaluated it in 1987
(IARC, 1987). The conclusions were that there are no data on the
carcinogenicity of copper 8-hydroxyquinoline in humans and
insufficient data in animals. It was, therefore, put into Group
3 - cannot be classified as to its carcinogenic risk to humans.
At the twenty-sixth meeting of the Joint FAO/WHO Expert Committee
on Food Additives and Food Contaminants, the previous recommendation
of 0.5 mg/kg body weight as an acceptable daily load for copper was
tentatively reconfirmed (WHO, 1982). A provisional tolerable daily
intake (PTDI) from all sources was established as 0.5 mg Cu/kg body
weight.
During the revisions of the WHO Drinking-water Guidelines
(WHO, 1989), copper was re-evaluated. Using the PTDI for copper
developed by JECFA (WHO, 1982) a provisional guideline value of 2 mg
Cu/litre was proposed (WHO, 1993).
REFERENCES
Achar ST, Raju VB, & Shriramachari S (1960) Indian childhood
cirrhosis. Trop Pediatr, 57: 744-758.
Adalsteinsson S (1994) Compensatory root growth in winter
wheat -- effects of copper exposure on root geometry and nutrient
distribution. J Plant Nutr, 17(9): 1501-1512.
Adamson M, Reiner B, Olsen JL, Goodman Z, Plotnick L, Bernardini I,
& Gahl WA (1992) Indian childhood cirrhosis in an American child.
Gastroenterology, 102(5): 1771-1777.
Adriano DC (1986) Trace elements in the terrestrial environment.
New York, Springer-Verlag.
Adriano DC ed. (1992) Biogeochemistry of trace metals. Boca Raton,
Florida, Lewis Publishers.
Agarwal K, Lahori VC, Mehta SK, Smith DG, & Bayai PC (1979)
Inheritance of Indian childhood cirrhosis. Hum Hered, 29: 82-89.
Agarwal K, Sharma A, & Talukder G (1990) Clastogenic effects of
copper sulphate on the bone marrow chromosomes of mice in vivo.
Mutat Res, 243: 1-6.
Ahsanullah M & Florence TM (1984) Toxicity of copper to the marine
amphipod Allorchestes compressa in the presence of water- and
lipid-soluble ligands. Mar Biol, 84: 41-45.
Al-Akel AS (1987) Behavioural and the physiological changes in
Oreochromis niloticus due to contamination of copper. Z Angew
Zool, 74(4): 479-487.
Alam MK & Maughan OE (1992) The effect of malathion, diazinon, and
various concentrations of zinc, copper, nickel, lead, iron, and
mercury on fish. Biol Trace Elem Res, 34(3): 225-236.
Alam I & Sadiq M (1989) Metal contamination of drinking-water from
corrosion of distribution pipes. Environ Pollut, 57: 167-178.
Alexander J & Aaseth J (1980) Biliary excretion of copper and zinc
in the rat as influenced by diethylmaleate, selenite and
diethyldithiocarbamate. Biochem Pharmacol, 29: 2129-2133.
Alfaro B & Heaton FW (1973) Relationships between copper, zinc and
iron in the plasma, soft tissue and skeleton of the rats during
copper deficiency. Br J Nutr, 29: 73-85.
Alikhan MA (1993) Differentiation in copper and nickel accumulation
in adult female and juvenile Porcellio spinicornis from
contaminated and uncontaminated sites in northeaster Ontario. Bull
Environ Contam Toxicol, 50: 922-928.
Alikhan MA, Bagatto G, & Zia S (1990) The crayfish as a biological
indicator of aquatic contamination by heavy metals. Water Res,
24: 1069-1076.
Aljajeh IA, Mughal S, Al-Tahou B, Ajrawi T, Ismail EA, & Nayak NC
(1994) Indian childhood cirrhosis-like liver disease in an Arab
child: A brief report. Virchow Arch, A424: 225-227.
Allard B, Hakansson K, Karlsson S, & Sigas E (1991) A field study
of diffusion controlled migration of copper, zinc and cadmium in a
clay formation. Water Air Soil Pollut, 57/58: 259-268.
Allen HE & Brisbin TD (1980) Prediction of bioavailability of
copper in natural waters. Thalassia Jugosl, 16: 331-334.
Allen HE & Hansen DJ (1996) The importance of trace metal
speciation to water quality criteria. Water Environ Res, 68(1):
42-54.
Allison JD, Brown DS, & Novo-Gradac KJ (1991) MINTEQA2/PRODEFA2, a
geochemical assessment model for environmental systems: version 3.0
user's manual. Washington, DC, US Environmental Protection Agency
(EPA/600/3-91/021).
Al-Rashid RA & Spangler J (1971) Neonatal copper deficiency. N Engl
J Med, 285: 841-843.
Alt ER, Sternlieb I, & Goldfischer S (1990) The cytopathology of
metal overload. Int Rev Exp Pathol, 31: 165-188.
Alva AK & Chen EQ (1995) Effects of external copper concentrations
on uptake of trace elements by citrus seedlings. Soil Sci, 159(1):
59-64.
Anderson JR, Aggett FJ, Buseck PR, Germani MS, & Shattuck TW (1988)
Chemistry of individual aerosol particles from Chandler, Arizona,
an arid urban environment. Environ Sci Technol, 22: 811-888.
Anderson BS, Middaugh DP, Hunt JW, & Turpen SL (1991) Copper
toxicity to sperm, embryos and larvae of topsmelt Atherinops
affinis, with notes on induced spawning. Mar Environ Res, 31:
17-35.
Anderson BS, Hunt JW, McNulty HR, Turpen SL, & Martin M (1994)
Off-season spawning and factors influencing toxicity test
development with topsmelt Atherinops affinis. Environ Toxicol
Chem, 13: 479-485.
Angelone M & Bini C (1992) Trace element concentrations in soils
and plants of Western Europe. In: Adriano CD ed. Biogeochemistry of
trace metals. Boca Raton, Florida, Lewis Publishers, pp 19-60.
Anke M (1991) Trace element intake (zinc, manganese, copper,
molybdenum, codine, and nickel) of humans in Thuringia and
Brandenburg of the Federal Republic of Germany. J Trace Elem
Electrolytes Health Dis, 5: 69-74.
Ankley GT, Phipps GL, Leonard EN, Benoit DA, Mattson VR, Kosian PA,
Cotter AM, Dierkkes JR, Hansen DJ, & Mahony JD (1991) Acid-volatile
sulfide as a factor mediating cadmium and nickel bioavailability in
contaminated sediments. Environ Toxicol Chem, 10: 1299-1307.
Aoyagi S & Baker DH (1994) Copper-amino acid complexes are
partially protected against inhibitory effects of L-cysteine and
L-ascorbic acid on copper absorption in chicks. J Nutr, 124(3):
388-395.
Arillo A, Calamari D, Margiocco C, Melodia F, & Mensi P (1984)
Biochemical effects of long-term exposure to cadmium and copper on
rainbow trout (Salmo gairdneri): validation of water quality
criteria. Ecotoxicol Environ Saf, 8: 106-117.
Armstrong CW, Moore LW, Hackler RL, Miller GB, & Stroube RB (1983)
An outbreak of metal fume fever: Diagnostic use of urinary copper
and zinc determinations. J Occup Med, 25: 886-888.
Arnon DI & Stout PR (1939) The essentiality of certain elements in
minute quantity for plants with special reference to copper. Plant
Physiol, 14: 371-375.
Arthur JW & Leonard EN (1970) Effects of copper on
Gammarus pseudolimnaeus, Physa integra, and Campeloma decisum
in soft water. J Fish Res Board Can, 27: 1277-1283.
Aschengrau A, Zierler S, & Cohen A (1989) Quality of community
drinking water and the occurrence of spontaneous abortion. Arch
Environ Health, 44: 283-290.
Ash CPJ & Lee DL (1980) Lead, cadmium, copper and iron in
earthworms from roadside sites. Environ Pollut, A22: 59-67.
Ashkenazi A, Levin S, Djaldetti M, Fishel E, & Benvenisti D (1973)
The syndrome of neonatal copper deficiency. Pediatrics, 52:
525-533.
Ashmead HDW, Graff DJ, & Ashmead HH (1985) Intestinal absorption of
metal ions and Chelates. Springfield, Illinois, Charles C. Thomas,
p 68.
Askari A, Wang Y, Xie Z, Huang WH, Klauning JE, & Sakari A (1990)
Superoxide dismutase activity of copper deficient cardiac myocites.
FASEB J, 4: A392.
Assaad FF & Nielsen JD (1984) A thermodynamic approach for copper
adsorption on some Danish arable soils. Acta Agric Scand, 34:
377-385.
ATSDR (1990) Toxicological profile for copper. Atlanta, Georgia,
Agency for Toxic Substances and Disease Registry (TP-90-08).
August D, Janghorbani M, & Young VR (1989) Determination of zinc
and copper absorption at three dietary Zn-Cu ratios by using stable
isotope methods in young adult and elderly subjects. Am J Clin
Nutr, 50: 1457-1463.
Aulerich RJ & Ringer RK (1976) Feeding copper sulfate: Could it
have benefits in nutrition of mink? US Fur Rancher, 56(12): 4.
Aulerich RJ, Ringer RK, Bleavins MR, & Napolitano A (1982) Effects
of supplemental dietary copper on growth, reproductive performance
and kit survival of standard dark mink and the acute toxicity of
copper to mink. J Anim Sci, 55: 337-343.
Bagatto G, Crowder AA, & Shorthouse JD (1993) Concentrations of
metals in tissues of lowbush blueberry (Vaccinium angustifolium)
near a copper-nickel smelter at Sudbury, Ontario, Canada: a factor
analytic approach. Bull Environ Contam Toxicol, 51: 600-604.
Baird DJ, Barber I, Bradley M, Soares AMVM, & Calow P (1991) A
comparative study of genotype sensitivity to acute toxic stress
using clones of Daphnia magna Straus. Ecotoxicol Environ Saf, 21:
257-265.
Baker AJM & Brooks RR (1989) Terrestrial higher plants which
hyperaccumulate metallic elements. A review of their distribution,
ecology and phytochemistry. Biorecovery, 1: 81-126.
Baker DH & Czarnecki-Maulden GL (1987) Pharmacologic role of
cysteine in ameliorating or exacerbating mineral toxicities. J
Nutr, 117: 1003-1010.
Baker EK & Harris PT (1991) Copper, lead, and zinc distribution in
the sediments of the Fly River Delta and Torres Strait. Mar Pollut
Bull, 22(12): 614-618.
Baker EK, Harris PT, & Beck RW (1990) Cu and Cd associated with
suspended particulate matter in Torres Strait. Mar Pollut Bull,
21(10): 484-486.
Baker A, Gormally S, Saxena R, Baldwin D, Drumm B, Bonham J,
Portmann B, & Mowat AP (1995) Copper-associated liver disease in
childhood. J Hepatol, 23(5): 538-543.
Baldwin S, Deaker M, & Maher W (1994) Low-volume microwave
digestion of marine biological tissues for the measurement of trace
elements. Analyst, 119: 1701-1704.
Balsberg Påhlsson A-M (1989) Toxicity of heavy metals (Zn, Cu, Cd,
Pb) to vascular plants. Water Air Soil Pollut, 47: 287-319.
Balthrop JE, Dameron CT, & Harris ED (1982) Comparison of pathways
of copper metabolism in aorta and liver. Biochem J, 204: 541-548.
Bankier A (1995) Menkes disease. J Med Genet, 32(3): 213-215.
Baranowska I, Czernicki K, & Aleksandrowicz R (1995) The analysis
of lead, cadmium, zinc, copper and nickel content in human bones
from the upper Silesian industrial district. Sci Total Environ,
159: 155-162.
Barclay SM, Aggett PJ, Lloyd DJ, & Duffty P (1991) Reduced
erythrocyte superoxide dismutase activity in low birth weight
infants given iron supplements. Pediatr Res, 29: 297-301.
Barnes G & Frieden E (1984) Ceruloplasmin receptors of
erythrocytes. Biochem Biophys Res Commun, 125: 157-162.
Batley GE, Scammell MS, & Brockbank CI (1992) The impact of the
banning of tributyltin-based antifouling paints on the Sydney rock
oyster, Saccostrea commercialis. Sci Total Environ, 122: 301-314.
Baudouin MF & Scoppa P (1974) Acute toxicity of various metals to
freshwater zooplankton. Bull Environ Contam Toxicol, 12(6):
745-751.
Bayley M, Baatrup E, Heimbach U, & Bjerregaard P (1995) Elevated
copper levels during larval development cause altered locomotor
behavior in the adult carabid beetle Pterostichus cupreus L.
(Coleoptera: Carabidae). Ecotoxicol Environ Saf, 32: 166-170.
Bearn AG (1960) A genetical analysis of thirty families with
Wilson's disease (hepatolenticular degeneration). Ann Hum Genet,
24: 33-43.
Bearn AG & Kunkel HG (1964) Localization of Cu64 in serum fractions
following oral administration: An alteration in Wilson's disease.
Proc Soc Exp Biol Med, 85: 44-48.
Beary ES, Paulsen PJ, & Fassett JD (1994) Sample preparation
approaches for isotope dilution inductively coupled plasma mass
spectrometric certification of reference materials. J Anal At
Spectrosc, 9: 1363-1369.
Beaumont AR, Tserpes G, & Budd MD (1987) Some effects of copper on
the veliger larvae of the mussel Mytilus edulis and the scallop
Pecten maximus (Mollusca, Bivalvia). Mar Environ Res, 21:
299-309.
Bechmann RK (1994) Use of life tables and LC50 tests to evaluate
chronic and acute toxicity effects of copper on the matine copepod
Tisbe furcata (Baird). Environ Toxicol Chem, 13: 1509-1517.
Becker W & Kumpulainen J (1991) Contents of essential and toxic
mineral elements in Swedish market-basket diets in 1987. Br J Nutr,
66: 151-160.
Beckett PHT & Davis RD (1977) Upper critical levels of toxic
elements in plants. New Phytol, 79: 95-106.
Beckett PHT & Davis RD (1978) The additivity of the toxic effects
of Cu, Ni and Zn in young barley. New Phytol, 81: 155-173.
Beckman BR & Zaugg WS (1988) Copper intoxication in chinook salmon
(Oncorhynchus tshawytscha) induced by natural springwater:
effects on gill Na+, K+-ATPase, hematocrit, and plasma glucose. Can
J Fish Aquat Sci, 45: 1430-1435.
Béguin-Bruhin Y, Escher F, Solms J, & Roth HR (1983) [Threshold
concentration of copper in drinking-water.] Lebensm. Wiss Technol,
16: 22-26 (in German).
Belanger SE, Farris JL, & Cherry DS (1989) Effects of diet, water
hardness, and population source on acute and chronic copper
toxicity to Ceriodaphnia dubia. Arch Environ Contam Toxicol, 18:
601-611.
Bello MA, Callejon M, Jimenez JC, Pablos F, & Ternero M (1994)
Determination of heavy metals in estuarine sediments by acid
digestion and atomic absorption spectrometry. Toxicol Environ Chem,
44: 203-210.
Benedetti I, Albano AG, & Mola L (1989) Histomorphological changes
in some organs of the brown bullhead, Ictalurus nebulosus
LeSueur, following short- and long-term exposure to copper. J Fish
Biol, 34: 273-280.
Bengtsson G, Gunnarsson T, & Rundgren S (1983) Growth changes
caused by metal uptake in a population of Onychiurus armatus
(Collembola) feeding on metal polluted fungi. Oikos, 40: 216-225.
Bengtsson G, Gunnarsson T, & Rundgren S (1986) Effects of metal
pollution on the earthworm Dendrobaena rubida (Sav.) in acidified
soils. Water Air Soil Pollut, 28: 361-383.
Benoit DA (1975) Chronic effects of copper on survival, growth, and
reproduction of the bluegill (Lepomis macrochirus). Trans Am Fish
Soc, 104: 353-358.
Berg R & Lundh S (1981) Copper contamination of drinking-water as
a cause of diarrhea in children. Halsovardskontakt, 1: 6-10.
Berger B & Dallinger R (1989) Accumulation of cadmium and copper by
the terrestrial snail arianta arbustorum L.: Kinetics and
budgets. Oecologia, 79: 60-65.
Berggren D (1992) Speciation of copper in soil solutions from
podzols and cambisols of S. Sweden. Water Air Soil Pollut, 62:
111-123.
Berk SG, Gunderson JH, & Derk LA (1985) Effects of cadmium and
copper on chemotaxis of marine and freshwater ciliates. Bull
Environ Contam Toxicol, 34: 897-903.
Besser JM, Ingersol CG, & Giesy JP (1996) Effects of spatial and
temoral variation of acid-volatile sulfide on the bioavailability
of copper and zinc in freshwater sediments. Environ Toxicol Chem,
15: 286-293.
Bettger WJ, Fish TJ, & O'dell BL (1978) Effects of copper and zinc
status of rats on erythrocyte stability and superoxide dismutase
activity. Proc Soc Exp Biol Med, 158(2): 279-282.
Beyer WN, Pattee OH, Sileo L, Hoffman DJ, & Mulhern BM (1985) Metal
contamination in wildlife living near two zinc smelters. Environ
Pollut, A38: 63-86.
Bhagwat AG & Walia BNS (1980) Indian childhood cirrhosis: A
commentary. Indian J Pediatr, 48: 433-437.
Bhave S, Pandit AN, Pradhan AM, Sidhaye DG, Kantarjian A, Williams
A, Talbot IC, & Tanner MS (1982) Paediatric liver disease in India.
Arch Dis Child, 57(12): 922-928.
Bhave SA, Sidhaye DG, Pandit AN, & Tanner MS (1983) Incidence and
clinical features of Indian childhood cirrhosis. Indian Pediatr,
20: 741-746.
Bhave SA, Pandit AN, Singh S, Walia BNS, & Tanner MS (1992) The
prevention of Indian childhood cirrhosis Ann Trop Paediatr, 12:
23-30.
Bhunya SP & Pati PC (1987) Genotoxicity of an inorganic pesticide,
copper sulphate in mouse in vivo test system. Cytologia,
52: 801-808.
Bidwell RGS (1979) Plant physiology, 2nd ed. New York, MacMillan
Publishing Company, 726 pp.
Biesinger KE & Christensen GM (1972) Effects of various metals on
survival, growth, reproduction, and metabolism of Daphnia magna.
J Fish Res Board Can, 29: 1691-1700.
Bionetics Research Lab (1968) Evaluation of carcinogenic,
teratogenic and mutagenic activities of selected pesticides and
industrial chemicals -- Volume 1: Carcinogenic study. Bionetics
Research Laboratories (Prepared for the National Cancer Institute,
Bethesda, Maryland, USA) (PB-223-159).
Blaise C, Forghani R, Legault R, Guzzo J,& Dubow MS (1994) A
bacterial toxicity assay performed with microplates,
microluminometry and Microtox reagent. Biotechniques, 16: 932-937.
Blakley BR & Hamilton DL (1985) Ceruloplasmin as an indicator of
copper status in cattle and sheep. Can J Comp Med, 49: 405-408.
Bligh SW, Boyle HA, McEwen AB, Sadler PJ, & Woodham RH (1992) 1H
NMR studies of reactions of copper complexes with human blood
plasma and urine. Biochem Pharmacol, 43: 137-145.
Bloom NS & Crecelius EA (1984) Determination of silver in sea water
by coprecipitation with cobalt pyrrolidinedithio-carbamate and
zeeman graphite furnace atomic absorption spectrometry. Anal Chim
Acta, 156: 139-145.
Bodar CWM, Zee AVD, Voogt PA, Wynne H, & Zander DI (1989) Toxicity
of heavy metals to early life stages of Daphnia magna. Ecotoxicol
Environ Saf, 17: 333-338.
Bodek I, Lyman WJ, Reehl WF, & Rosenblatt DH (1988) Environmental
inorganic chemistry: Properties, processes and estimation methods.
New York, Pergamon Press, 9 pp (SETAC Special Publications Series).
Borgmann U & Ralph KM (1984) Copper complexation and toxicity to
freshwater zooplankton. Arch Environ Contam Toxicol, 13: 403-409.
Borgmann U (1983) Metal speciation and toxicity of free metal ions
to aquatic biota. In: Nriagu JO ed. Aquatic toxicology. New York,
John Wiley & Sons Ltd, pp 47-72.
Borgmann U & Charlton CC (1984) Copper complexation and toxicity to
Daphnia in natural waters. J Great Lakes Res, 10: 393-398.
Borgmann U & Ralph KM (1983) Complexation and toxicity of copper
and the free metal bioassay technique. Water Res, 17: 1697-1703.
Borszeki J, Halmos P, Gegus E, & Karpati P (1994) Application of
pressurized sample preparation methods for the analysis of steels
and copper alloys. Talanta, 41: 1089-1093.
Bowen HJM (1985) The natural environment and the biogeochemical
cycles. In: Hutzinger D ed. Handbook of environmental chemistry.
New York, Basel, Springer-Verlag, pp 1-26.
Boyle EA, Sclater FR, & Edmond JM (1977) The distribution of
dissolved copper in the pacific. Earth Planet Sci Lett, 37: 38-54.
Bradley SB & Cox JJ (1988) The potential availability of cadmium,
copper, iron, lead, manganese, nickel and zinc in standard river
sediment (NBS 1645). Environ Technol Lett, 9: 733-739.
Bremner I (1987) Involvement of metallothionein in the hepatic
metabolism of copper: Critical review. J Nutr, 117: 19-29.
Bremner JM & Douglas LA (1971) Inhibition of urease activity in
soils. Soil Biol Biochem, 3: 297-307.
Brenner A & Harris ED (1995) A quantitative test for copper using
bichinchioninc acid. Anal Biochem, 226: 80-84.
Brewer GJ, Hill GM, Prasad AS, Cossack ZT, & Rabbani P (1983) Oral
zinc therapy for Wilson's disease. Ann Intern Med, 99: 314-320.
Bro S, Sandstrom B, & Heydorn K (1990) Intake of essential and
toxic trace elements in a random sample of Danish men as determined
by duplicate portion sampling technique. J Trace Elem Electrolytes
Health Dis, 4: 147-155.
Brooks RR, McCleave JA, & Malaisse F (1977) Copper and cobalt in
African species of Crotalaria L. Proc R Soc Ser B, 197: 231-236.
Brooks RR, Reeves RD, Morrison RS, & Malaisse F (1980)
Hyperaccumulation of copper and cobalt. A review. Bull Soc R Bot
Belg, 113: 166-172.
Brooks RR, Baker AJM, & Malaisse F (1992) Copper flowers. Natl
Geogr Res Explor, 8: 338-351.
Brown BT & Rattigan BM (1979) Toxicity of soluble copper and other
metal ions to Elodea canadensis. Environ Pollut, 20: 303-314.
Brown KW, Thomas JC, & Slowey JF (1983) The movement of metals
applied to soils in sewage effluents. Water Air Soil Pollut, 19:
43-54.
Bruland KW (1980) Oceanographic distributions of cadmium, zinc,
nickel, and copper in the North Pacific. Earth Planet Sci Lett, 47:
176-198.
Bruland KW, Coale KH, & Mart L (1985) Analysis of seawater for
dissolved cadmium copper and lead: an intercomparison of
voltammetric and atomic absorption methods. Mar Chem, 17: 285-300.
Brungs WA, Geckler JR, & Gast M (1976) Acute and chronic toxicity
of copper to the fathead minnow in a surface water of variable
quality. Water Res, 10: 37-43.
Bryan GW & Hummerstone LG (1973) Brown seaweed as an indicator of
heavy metals in estuaries in South-West England. J Mar Biol Assoc
(UK), 53: 705-720.
Bryan GW & Langston WJ (1992) Bioavailability, accumulation and
effects of heavy metals in sediments with special reference to
United Kingdom estuaries: a review. Environ Pollut, 76: 89-131.
Bubb JM & Lester JN (1994) Anthropogenic heavy metal inputs to
lowland river systems, a case study. The River Stour, UK Water Air
Soil Pollut, 78: 279-296.
Bubb JM, Rudd T, & Lester JN (1991) Distribution of heavy metals in
the river Yare and its associated broads: II. Copper and cadmium.
Sci Total Environ, 102: 169-188.
Bucholtz CF (1816) [Chemical study of the vanilla shoot
(Siliqua vanillae).] Report Pharm, 2: 253 (in German).
Buck WB, Osweiler GD, & Van Gelder GA (1976) Clinical and
diagnostic veterinary toxicology, 2nd ed. Dubuque, Iowa,
Kendell/Hunt Publishing Co., 380 pp.
Buckley JA (1983) Complexation of copper in the effluent of a
sewage-treatment plant and an estimate of its influence on toxicity
to coho salmon. Water Res, 17(12): 1929-1934.
Buckley PJM & van den Berg CMG (1986) Copper complexation profiles
in the Atlantic Ocean: A comparative study using electrochemical
and ion exchange techniques. Mar Chem, 19: 281-296.
Buckley JT, Roch M, McCarter JA, Rendell CA, & Matheson AT (1982)
Chronic exposure of coho salmon to sublethal concentrations of
copper: I. Effect on growth, on accumulation and distribution of
copper, and on copper tolerance. Comp Biochem Physiol, 72C: 15-19.
Buhl KJ & Hamilton SJ (1990) Comparative toxicity of inorganic
contaminants released by placer mining to early life stages of
salmonids. Ecotoxicol Environ Saf, 20: 325-342.
Bull PC, Thomas GR, Rommens JM, Forbes JR, & Cox DW (1993) The
Wilson disease gene is a putative copper transporting P-type ATPase
similar to the Menkes gene. Nat Genet, 5: 327-337.
Burguera JL, Burguera M, & Brunetto MR (1993) In vivo sample
uptake and on-line measurement of zinc and copper in whole blood by
microwave-assisted mineralization and flow injection AAS. At
Spectrosc, 14: 90-94.
Burki HR & Okita GT (1969) Effect of oral copper sulfate on
7,12-dimethyl-benz(alpha)anthracene carcinogenesis in mice. Br J
Cancer, 23: 591-596.
Burns LV & Parker GH (1988) Metal burdens in two species of
fiddleheads growing near the nore smelters at Sudbury, Ontario,
Canada. Bull Environ Contam Toxicol, 40: 717-723.
Burton GA (1987) Occurrence of bacterial resistance to arsenite,
copper, and selenite in adverse habitats. Bull Environ Contam
Toxicol, 39: 990-997.
Burton DT & Fisher DJ (1990) Acute toxicity of cadmium, copper,
zinc, ammonia, 3,3'-dichlorobenzidine, 2,6-dichloro-4-nitroaniline,
methylene chloride, and 2,4,6-trichlorophenol to juvenile grass
shrimp and killifish. Bull Environ Contam Toxicol, 44: 776-783.
Burton KW, Morgan E, & Roig A (1986) Interactive effects of
cadmium, copper and nickel on the growth of Sitka spruce and
studies of metal uptake from nutrient solutions. New Phytol, 103:
549-557.
Cabrera F, Soldevilla M, Cordon R, & De Arambarri P (1987) Heavy
metal pollution in the Guadiamar river and Guadalquivir estuary
(South west Spain). Chemosphere, 16(2-3): 463-468.
Callahan M, Slimak M, Gabel N, May I, Fowler C, Freed R, Jennings
P, Durfee R, Whitmore F, Maestri B, Mabey W, Holt B, & Gould C
(1979) Copper. In: Water-related environmental fate of 129 priority
pollutants. Washington, DC, US Environmental Protection Agency,
Office of Water Planning and Standards.
Calmano W, Hong J, & Förstner U (1993) Binding and mobilization of
heavy metals in contaminated sediments affected by pH and redox
potential. Water Sci Technol, 28: 223-235.
Campanella L, Ferri T, & Petronio BM (1989) Effect of speciation in
sludges on the adsorption of leached metals from soil. Sci Total
Environ, 79: 223-231.
Campbell PGC (1995) Interactions between trace metals and aquatic
organisms: a critique of the free-ion activity model. In: Tessier
A & Turner DR ed. Metal speciation and bioavailability in aquatic
systems New York, John Wiley & Sons Ltd, pp 45-102.
Camusso M, Tartari G, & Cappelletti E (1989) Seasonal trends of
copper sedimentation in Lake Orta (Italy). Sci Total Environ,
87/88: 59-75.
Cannon HL, Connally GC, Epstein JB, Parker JG, Thornton I, & Wixson
G (1978) Rocks: geological sources of most trace elements. Report
to the workshop at South Seas plantation, Captiva Islands, FL, US.
Geochem Environ, 3: 17-31.
Carbon C (1996) Good chemistry goes to waste. Chem Aust, April:
187-188.
Carlson AR, Nelson H, & Hammermeister D (1986) Development and
validation of site-specific water quality criteria for copper.
Environ Toxicol Chem, 5: 997-1012.
Carlson-Ekvall CEA & Morrison GM (1995) Toxicity of copper in the
presence of organic substances in sewage sludge. Environ Technol,
16: 243-251.
Carlton WW & Price PS (1973) Dietary copper and the induction of
neoplasms in the rat by acetylaminofluorene and
dimethylnitrosamine. Food Cosmet Toxicol, 11: 827-840.
Carry MT, Galiazzo F, Ciriolo MR, & Rotilio G (1991) Evidence of
co-regulation of Cu, Zn superoxide dismutase and metallothionein
gene expression in yeast through transcriptional control by copper
via the ACE1 factor. FEBS Lett, 2278: 263-266.
Castillo-Duran C & Uauy R (1988) Copper deficiency impairs growth
of infants recovering from malnutrition. Am J Clin Nutr, 47:
710-714.
Castillo-Duran C, Fishberg M, Valenzuela A, Egaña JI, & Uauy R
(1983) Controlled trial of copper supplementation during the
recovery from marasmus. Am J Clin Nutr, 37: 898-903.
Castillo-Duran C, Vial P, & Uauy R (1988) Trace mineral balance
during acute diarrhea in infants. J Pediatr, 113: 452-457.
Cavallo F, Gerber M, Marubini E, Richardson S, Barbieri A, Costa A,
DeCarli H, & Pujol A (1991) Zinc and copper in breast cancer: A
joint study in Northern Italy and Southern France. Cancer, 67:
738-745.
Cavell PA & Widdowson EM (1964) Intakes and excretions of iron,
copper, and zinc in the neonatal period. Arch Dis Child, 39:
496-501.
Centeno MDF, Brendonck L, & Persoone G (1993) Acute toxicity tests
with Streptocephalus proboscideus (Crustacea: Branchiopoda:
Anostraca): influence of selected environmental conditions.
Chemosphere, 27: 2213-2224.
Çetinkaya N, Çetinkaya D, & Yüce M (1988) Serum copper, zinc
levels, and copper: Zinc ratio in healthy women and women with
gynecological tumors. Biol Trace Elem Res, 18: 29-38.
Chakoumakos C, Russo RC, & Thurston RV (1979) Toxicity of copper to
cutthroat trout (Salmo clarki) under different conditions of
alkalinity, pH, and hardness. Environ Sci Technol, 13(2): 213-219.
Chakrabarti CL, Lu Y, Cheng J, Back MH, & Schroeder WH (1993)
Studies on metal speciation in the natural environment. Anal Chim
Acta, 267: 47-64.
Chakrabarti CL, Lu YJ, Gregoire DC, Back MH, & Schroeder WH (1994)
Kinetic studies of metal speciation using chelex cation exchange
resin-application to cadmium, copper, and lead speciation in river
water and snow. Environ Sci Technol, 28: 1957-1967.
Chan WH, Tank AJS, Chung DHS, & Lusis MA (1986) Concentration and
deposition of trace metals in Ontario -- 1982. Water Air Soil
Pollut, 29: 373-389.
Chandra RK (1976) ICC geneologic data, alpha-foetoprotein MbsAg &
circulating immune complexes. Trans R Soc Trop Med Hyg, 70:
296-301.
Chang F-H & Broadbent FE (1981) Influence of trace metals on carbon
dioxide evolution from a Yolo soil. Soil Sci, 132: 416-421.
Chapman GA (1978) Toxicities of cadmium, copper, and zinc to four
juvenile stages of chinook salmon and steelhead. Trans Am Fish Soc,
107(6): 841-847.
Chapman GA & Stevens DG (1978) Acutely lethal levels of cadmium,
copper, and zinc to adult male coho salmon and steelhead. Trans Am
Fish Soc, 107(6): 837-840.
Chawla V, Chandra RK, Verma IC, & Ghai OP (1973) An epidemiological
approach to Indian Childhood cirrhosis. Indian Pediatr, 10: 73-79.
Chelly J, Tumer Z, Tonnesen T, Petterson A, Ishikawa-Brush Y,
Tommerup N, Horn N, & Monaco AP (1993) Isolation of a candidate
gene for Menkes disease that encodes a potential heavy metal
binding protein see comments. Nat Genet, 3: 14-19.
Chen L, Li G, & Ren Y (1990) Reoxygenation injured of cultured
neonatal rat myocardial cells and protective effects of selenium,
copper and zinc. Zhonghua Yixue Zashi, 70: 221-223.
Chen LC, Peoples SM, & Amdur MO (1991) Pulmonary effects of sulfur
oxides on the surface of copper oxide aerosol. Am Indl Hyg Assoc J,
52: 187-191.
Chen J, Geissler C, Parpia B, Li J, & Campbell TC (1992)
Antioxidant status and cancer mortality in China. Int J Epidemiol,
21: 625-635.
Chen R, Wei L, & Huang H (1993) Mortality from lung cancer among
copper miners. Br J Ind Med, 50: 505-509.
Cheng J, Chakrabarti CL, Back MH, & Schroeder WH (1994) Chemical
speciation of Cu, Zn, Pb and Cd in rain water. Anal Chim Acta, 288:
141-156.
Chester R & Murphy KJT (1986) Oceanic sources of copper to the
Atlantic aerosol. Sci Total Environ, 49: 325-338.
Christensen ER, Scherfig J, & Dixon PS (1979) Effects of manganese,
copper and lead on Selenastrum capricornutum and
Chlorella stigmatophora. Water Res, 13: 79-92.
Christie P & Beattie JAM (1989) Grassland soil microbial biomass
and accumulation of potentially toxic metals from long-term slurry
application. J Appl Ecol, 26: 597-612.
Chugh KS, Sharma BK, Singhal PC, Das KC, & Datta BN (1977) Acute
renal failure following copper sulphate intoxication. Postgrad Med
J, 53(615): 18-23.
Chung IK & Brinkhuis BH (1986) Copper effects in early stages of
the kelp, Laminaria saccharina. Mar Pollut Bull, 17(5): 213-218.
Chuttani HK, Gupta PS, Gulati S, & Gupta DN (1965) Acute copper
sulfate poisoning. Am J Med, 39: 849-854.
Claisse D & Alzieu C (1993) Copper contamination as a result of
antifouling paint regulations? Mar Pollut Bull, 26(7): 395-397.
Clark JB (1953) The mutagenic action of various chemicals on
Micrococcus aureus. Proc Okla Acad Sci, 34: 114-118.
Clarkson DT & Hanson JB (1980) The mineral nutrition of higher
plants. Annu Rev Plant Physiol, 31: 239-298.
Claveri B, Morhain E, & Mouvet C (1994) A methodology for the
assessment of accidental copper pollution using the aquatic moss
Rhynchostegium riparioides. Chemosphere, 28: 2001-2010.
Clements WH, Cherry DS, & Cairns J Jr (1988) Structural alterations
in aquatic insect communities exposed to copper in laboratory
streams. Environ Toxicol Chem, 7: 715-752.
Clements WH, Farris JL, Cherry DS, & Cairns J (1989) The influence
of water quality on macroinvertebrate community responses to copper
in outdoor experimental streams. Aquat Toxicol, 14: 249-262.
Clements WH, Cherry DS, & Cairns J Jr (1990) Macroinvertebrate
community responses to copper in laboratory and field experimental
streams. Arch Environ Contam Toxicol, 19: 361-365.
Coale KH & Bruland KW (1988) Copper complexation in the northeast
Pacific. Limnol Oceanogr, 33: 1084-1101.
Coates RJ, Weiss NS, Daling JR, Rettmer RL, & Warnick GR (1989)
Cancer risk in relation to serum copper levels. Cancer Res, 49:
4353-4356.
Codina JC, Pérez-García A, Romero P, & De Vicente A (1993) A
comparison of microbial bioassays for the detection of metal
toxicity. Arch Environ Contam Toxicol, 25: 250-254.
Cohen JM, Kamphake LJ, Harris EK, Woodward RL (1960) Taste
threshold concentrations of metals in drinking-water. J Am Water
Works Assoc, 52: 660-670.
Cohen NL, Keen CL, Lönnerdal B, &Hurley LS (1985a) Effects of
varying dietary iron on the expression of copper deficiency in the
growing rat: anemia, ferroxidase I and II, tissue trace elements,
ascorbic acid, and exanthine dehydrogenase. J Nutr, 115: 633-649.
Cohen N, Keen CL, Hurley LS, & Lönnerdal B (1985b) Determinants of
copper-deficiency anemia in rats. J Nutr, 115: 710-725.
Collvin L (1985) The effect of copper on growth, food consumption
and food conversion of perch Perca fluviatilis L. offered maximal
food rations. Aquat Toxicol, 6: 105-113.
Collyard SA, Ankley GT, Hoke RA, & Goldenstein T (1994) Influence
of age on the relative sensitivity of Hyalella azteca to
diazinon, alkylphenol ethoxylates, copper, cadmium, and zinc. Arch
Environ Contam Toxicol, 26: 110-113.
Combs GE, Ammerman CB, Shirley RL, & Wallace HD (1966) Effect of
source and level of dietary protein on pigs fed high copper
rations. J Anim Sci, 25(3): 613-616.
Cordano A, Baertl J, & Graham GG (1964) Copper deficiency in
infants. Pediatrics, 34: 324-336.
Correa JA, González P, Sánchez P, Muñoz J, & Orellana MC (1996)
Copper-algae interactions: inheritance or adaptation? Environ Monit
Assess, 40: 41-54.
Cossu P, Pirastu M, Nucaro A, Figus A, Balestrieri A, Borrone C,
Giacchino R, Devoto M, Monni G, & Cao A (1992) prenatal diagnosis
of Wilson's disease by analysis of DNA polymorphism. N Engl J Med,
326: 57.
Cotton FA & Wilkinson G (1989) Advanced inorganic chemistry. New
York, John Wiley & Sons Ltd, pp 755-775.
Couillard Y, Ross P, & Pinel-Alloul B (1989) Acute toxicity of six
metals to the rotifer Brachionus calyciflorus, with comparisons
to other freshwater organisms. Toxicol Assess, 4: 451-462.
Cousins RJ (1985) Absorption, transport, and hepatic metabolism of
copper and zinc: Special reference to metallothionein and
ceruloplasmin. Phys Rev, 65: 238-309.
Cowgill UM & Milazzo DP (1991) Comparison of the effect of metallic
copper and copper nitrate (CU(CNO-3)2.3H2O) on Ceriodaphnia
dubia utilizing the three-brood test. Bull Environ Contam Toxicol,
46: 141-145.
Cox DW (1995) Genes of the copper pathway. Am J Hum Genet, 56:
828-834.
Crecelius EA, Hardy JT, Gibson CI, Schmidt RL, Apts CW, Gurtisen
JM, & Joyce SP (1982) Copper bioavailability to marine bivalves and
shrimp: relationship to cupric ion activity. Mar Environ Res, 6:
13-26.
Cumings JN (1948) The copper and iron content of brain and liver in
the normal and in hepato-lenticular degeneration. Brain, 71:
410-415.
Curtis MW, Copeland TL, & Ward CH (1979) Acute toxicity of 12
industrial chemicals to freshwater and saltwater organisms. Water
Res, 13: 137-141.
Cusimano RF, Brakke DF, & Chapman GA (1986) Effects of pH on the
toxicities of cadmium, copper, and zinc to steelhead trout
(Salmo gairdneri). Can J Fish Aquat Sci, 43: 1497-1503.
Dabek JT, Hyvonen-Dabek M, Harkonen M, & Adlercreutz H (1992)
Evidence for increased non-ceruloplasmin copper in early-stage
human breast cancer serum. Nutr Cancer, 17: 195-201.
Dallinger R & Wieser W (1977) The flow of copper through a
terrestrial food chain: 1.Copper and nutrition in isopods.
Oecologia, 30: 253-264.
Dallinger R & Wieser W (1984) Patterns of accumulation,
distribution and liberation of Zn, Cu, Cd and Pb in different
organs of the land snail, Helix pomatia L. Comp Biochem Physiol,
79C(1): 117-124.
Daly HR, Campbell IC, & Hart BT (1990a) Copper toxicity to
Paratya australiensis: I. Influence of nitrilotriacetic acid and
glycine. Environ Toxicol Chem, 9: 997-1006.
Daly HR, Campbell IC, & Hart BT (1990b) Copper toxicity to
Paratya australiensis: II. Influence of bicarbonate and ionic
strength. Environ Toxicol Chem, 9: 1007-1011.
Daly HR, Jones MJ, Hart BT, & Campbell IC (1990c) Copper toxicity
to Paratya australiensis: III. Influence of dissolved organic
matter. Environ Toxicol Chem, 9: 1013-1018.
Daly HR, Hart BT, & Campbell IC (1992) Copper toxicity to
Paratya australiensis: IV. Relationship with ecdysis. Environ
Toxicol Chem, 11: 881-883.
Dameron CT & Harris ED (1987a) Regulation of aortic Cu
Zn-superoxide dismutase with copper: Effects in vivo. Biochem J,
248: 663-668.
Dameron CT & Harris ED (1987b) Regulation of aortic CuZn-superoxide
dismutase with copper: Caeruloplasmin and albumin reactivate and
transfer copper to the enzyme in culture. Biochem J, 248: 669-675.
Dameron CT, Winge DR, George GN, Sansone M, Hu S, & Hamer D (1991)
A copper-thiolate polynuclear cluster in the ACE1 transcription
factor. Proc Natl Acad Sci (USA), 88: 6127-6131.
Dangel RA (1975) Study of corrosion products in the Seattle Water
Department Tolt Distribution System. Washington, DC, US
Environmental Protection Agency (EPA-670/2-75-036).
Daniel GF & Chamberlain AH (1981) Copper immobilization in fouling
diatoms. Bot Mar, 24: 229-243.
Danks DM (1988) Copper deficiency in humans. Annu Rev Nutr, 8:
235-257.
Dann T (1994) Environment Canada -- PM10 and PM2.5: Concentrations
at Canadian sites, 1984 to 1993. Ottawa, Environment Canada,
Environmental Technology Centre, 28 pp (Report series No. PMD 94-3).
Daramola JA & Oladimeji AA (1989) Accumulation of copper in
Clarias anguillaris L. and Oreochromis niloticus L. Water Air
Soil Pollut, 48: 457-461.
Dauncey MJ, Shaw JLC, & Urman J (1977) The absorption and retention
of magnesium, zinc and copper by low birth weight infants fed
pasteurized human breast milk. Pediatr Res, 11: 991-997.
Dave G (1984) Effects of copper on growth, reproduction, survival
and haemoglobin in Daphnia magna. Comp Biochem Physiol, 78C(2):
439-443.
Dave G & Xiu RQ (1991) Toxicity of mercury, copper, nickel, lead,
and cobalt to embryos and larvae of zebrafish, Brachydanio rerio.
Arch Environ Contam Toxicol, 21: 126-134.
Davidson LA, McOrmond SL, & Harris ED (1994) Characterization of a
particulate pathway for copper in K562 cells. Biochim Biophys Acta,
1221: 1-6.
Davis RD & Beckett PHT (1978) Upper critical levels of toxic
elements in plants: II. Critical levels of copper in young barley,
wheat, rape, lettuce and ryegrass, and of nickel and zinc in young
barley and ryegrass. New Phytol, 80: 23-32.
De Boer JA (1981) Nutrients. In: Lobban CS & Wynne MJ ed. The
biology of seaweeds. Oxford, London, Blackwell Scientific
Publications, pp 356-391.
Delaguardia M, Carbonell V, Moralesrubio A, & Salvador A (1993)
On-line microwave-assisted digestion of solid samples for their
flame atomic spectrometric analysis. Talanta, 40: 1609-1617.
De Nicola Giudici M & Migliore L (1988) Long term effect of cadmium
or copper on Asellus aquaticus (L.) (Crustacea, Isopoda). Vehr.
Int Verein Limnol, 23: 1660-1662.
Denizeau F & Marion M (1989) Genotoxic effects of heavy metals in
rat hepatocytes. Cell Biol Toxicol, 5: 15-25.
Denneman CAJ & Van Straalen NM (1991) The toxicity of lead and
copper in reproduction tests using the oribatid mite Platynothrus
peltifer. Pedobiologia, 35: 305-311.
Depledge MH (1989) Re-evaluation of metabolic requirements for
copper and zinc in crustaceans. Mar Environ Res, 27: 115-126.
DeVevey E, Bitton G, Rossel D, Ramos LD, & Guerrero SM (1993)
Concentration and bioavailability of heavy metals in sediments in
Lake Yojoa (Honduras). Bull Environ Contam Toxicol, 50: 253-259.
Devi VU (1987) Heavy metal toxicity to fiddler crabs, Uca
annulipes Latreille and Uca triangularis (Milne Edwards):
tolerance to copper, mercury, cadmium, and zinc. Bull Environ
Contam Toxicol, 39: 1020-1027.
de Vries DJ, Sewell RB, & Beart PM (1986) Effects of copper on
dopaminergic function in the rat corpus striatum. Exp Neurol, 91:
546-558.
De Zwart D & Sloof W (1987) Toxicity of mixtures of heavy metals
and petrochemicals to Xenopus laevis. Bull Environ Contam
Toxicol, 38: 345-351.
Dickinson NM, Turner AP, & Lepp NW (1991) Survival of trees in a
metal-contaminated environment. Water Air Soil Pollut, 57/58:
627-633.
Dieter von HH, Meyer E, & Möller R (1991) [Copper occurrence,
relevance and detection -- The drinking-water directive:
introduction and explanations for water supply services and control
authorities], 3rd ed., pp 472-491 (in German).
Dinnell PA, Link JM, Stober QJ, Letourneau MW, & Roberts WE (1989)
Comparative sensitivity of sea urchin sperm bioassays to metals and
pesticides. Arch Environ Contam Toxicol, 18: 748-755.
Dirilgen N & Inel Y (1994) Cobalt-copper and cobalt-zinc effects on
duckweed growth and metal accumulation. J Environ Sci Health, A29:
63-81.
Disilvestro RA & Harris ED (1981) A post absorption effect of
L-ascorbic acid on copper metabolism in chicks. J Nutr, 111:
1964-1968.
Di Toro R, Capotorti MG, Gialanella G, del Giudice MM, Moro R, &
Perrone L (1987) Zinc and copper status of allergic children. Acta
Paediatr Scand, 76: 612-617.
Di Toro DM, Mahony JD, Hansen DJ, Scott KJ, Hicks MB, Mayr SM, &
Redmond MS (1990) Toxicity of cadmium in sediments: the role of
acid volatile sulfide. Environ Toxicol Chem, 9: 1487-1502.
Di Toro DM, Zarba CS, Hansen DJ, Berry WJ, Swartz RC, Cowan CE,
Pavlou SP, Allen HE, Thomas NA, & Paquin PR (1991) Technical basis
for establishing sediment quality criteria for nonionic organic
chemicals by using equilibrium partitioning. Environ Toxicol Chem,
10: 1541-1583
Dodds-Smith ME, Johnson MS, & Thompson DJ (1992a) Trace metal
accumulation by the shrew Sorex araneus: I. Total body burden,
growth, and mortality. Ecotoxicol Environ Saf, 24: 102-117.
Dodds-Smith ME, Johnson MS, & Thompson DJ (1992b) Trace metal
accumulation by the shrew Sorex araneus: II. Tissue distribution in
kidney and liver. Ecotoxicol Environ Saf, 24: 118-130.
Dodge EE & Theis TL (1979) Effect of chemical speciation on the
uptake of copper by Chironomus tentans. Environ Sci Technol, 13:
1287-1288.
Doelman P & Haanstra L (1984) Short-term and long-term effects of
cadmium, chromium, copper, nickel, lead and zinc on soil microbial
respiration in relation to abiotic soil factors. Plant Soil, 79:
317-327.
Doelman P & Haanstra L (1986) Short- and long-term effects of heavy
metals on urease activity in soils. Biol Fertil Soils, 2: 213-218.
Donat JR, Lao KA, & Bruland KW (1994) Speciation of dissolved
copper and nickel in South San Francisco Bay: a multi-method
approach. Anal Chim Acta, 284: 547-571.
Donkin SG & Dusenbery DB (1993) A soil toxicity test using the
nematode Caenorhabditis elegans and an effective method of
recovery. Arch Environ Contam Toxicol, 25: 145-151.
Dörner K, Dziadzka S, Hohn A, Sievers E, Oldigs HD, Schulz-Lell G,
& Schaub J (1989) Longitudinal manganese and copper balances in
young infants and preterm infants fed on breast-milk and adapted
cow's milk formulas. Br J Nutr, 61(3): 559-572.
Dreosti IE & Record IR (1978) Lysosomal stability, superoxide
dismutase and zinc deficiency in regenerating rat liver. Br J Nutr,
40(1): 133-137.
Drummond JG, Aranyi C, Schiff LJ, Fenters JD, & Graham JA (1986)
Comparative study of various methods used for determining health
effects of inhaled sulfates. Environ Res, 41: 514-528.
Duby P (1980) Extractive metallurgy. In: Kirk-Othmer encyclopedia
of chemical technology, 3rd ed. New York, John Wiley & Sons Ltd, pp
739, 767.
Dumontet S, Dinel H, & Lévesque PEN (1992) The distribution of
pollutant heavy metals and their effect on soil respiration and
acid phosphatase activity in mineral soils of the Rouyn-Noranda
region, Québec. Sci Total Environ, 121: 231-245.
Dumontet S, Levesque M, & Mathur SP (1990) Limited downward
migration of polluted metals (Cu, Zn, Ni and Pb) in acidic virgin
peat soils near a smelter. Water Air Soil Pollut, 49: 329-342.
Dunn MA, Green MH, & Leach RM (1991) Kinetics of copper metabolism
in rats: A compartmental model. Am J Physiol, 261: E115-E125.
Dutka BJ & Kwan KK (1981) Comparison of three microbial toxicity
screening tests with the Microtox test. Bull Environ Contam
Toxicol, 27: 753-757.
Duvigneau P & Denaeyer-De Smet S (1963) Cuivre et végétation au
Katanga. Bull Soc R Bot Belg, 96: 93-231.
Ebele S, Oladimeji AA & Daramola JA (1990) Molluscicidal and
piscisidal properties of copper(II) tetraoxosulfate(VI) on
Bulinus globosus (Morelet) and Clarias anguillaris (L.). Aquat
Toxicol, 17: 231-238.
Eden A & Green HH (1939) The fate of copper in the blood stream. J
Comp Pathol Ther, 52: 301-315.
Effler SW, Litten S, Field SD, Tong-Ngork T, Hale F, Meyer M, &
Quirk M (1980) Whole lake response to low level copper sulfate
treatment. Water Res, 14: 1489-1499.
Ehrenkranz RA, Gettner PA, Nelli CM, Sherwonit EA, Williams JE,
Ting BTG, Janghorbani M (1989) Zinc and copper nutritional studies
in very low birth weight infants: comparison of stable isotopic
extrinsic tag and chemical balance methods. Pediatr Res, 26:
298-307.
Eife R, Reiter K, Sigmund B, Schramel P, Dieter HH, & Müller-Hocker
J (1991) [Childhood liver cirrhosis as a result of copper
intoxication]. Bundesgesundh. bl, 32: 327-329 (in German).
Eldad A, Wisoki M, Cohen H, Breiterman S, Chaouat M, Wexler MR, &
Ben-Bassat H (1995) Phosphorous burns: evaluation of various
modalities for primary treatment. J Burn Care Rehabil, 16: 49-55.
Ellgaard EG & Guillot JL (1988) Kinetic analysis of the swimming
behaviour of bluegill sunfish, Lepomis macrochirus Rafinesque,
exposed to copper: hypoactivity induced by sublethal
concentrations. J Fish Biol, 33: 601-608.
Elliott NG, Swain R, & Ritz DA (1985) The influence of cyclic
exposure on the accumulation of heavy metals by Mytilus edulis
planulatus (Lamarck). Mar Environ Res, 15: 17-30.
Elliott HA, Leberati MR, & Huang CP (1986) Competitive adsorption
of heavy metals by soil. J Environ Qual, 15: 214-219.
El-Sharouny HMM, Bagy MM, & El-Shanawany AA (1988) Toxicity of
heavy metals to Egyptian soil fungi. Int Biodeterior, 24: 49-64.
Epstein O (1983) Liver copper in health and disease. Postgrad Med
J, 59(suppl 4): 88-94.
Erickson RJ, Benoit DA, & Mattson VR (1987) A prototype toxicity
factors model for site-specific copper water quality criteria.
Duluth, Minnesota, US Environmental Protection Agency.
Erickson RJ, Benoit DA, Mattson VR, Nelson HP, & Leonard EN (1996)
The effects of water chemistry on the toxicity of copper to fathead
minnows. Environ Toxicol Chem, 15(2): 181-193.
Evans GW (1973) Copper homeostasis in the mammalian system. Physiol
Rev, 53: 535-569.
Evans EG, Evans GF, & Ray DB (1984) Air quality data for metals
1977 through 1979 from the Naito Air Surveillance Networks.
Research Triangle Park, North Carolina, US Environmental Protection
Agency,
Office of Research and Development Monitoring Laboratory (EPA
600/84-83-053).
Fabiano M, Baffi F, Povero P, & Frache R (1988) Particulate organic
matter and heavy metals in Lingurian open sea. Chem Ecol, 3:
313-323.
Farooqui A, Kulshreshtha K, Srivastava K, Farooqui SA, Pandey V, &
Ahmad KJ (1995) Photosynthesis, stomatal response and metal
accumulation in Cineraria maritima L. and Centauria moschata L.
grown in metal-rich soil. Sci Total Environ, 164(3): 203-207.
Farquharson C, Duncan A, & Robins SP (1989) The effects of copper
deficiency on the pyridinium crosslinks of mature collagen in the
rat skeleton and cardiovascular system. Proc Soc Exp Biol Med, 192:
166-171.
FDO (1965) Appraisal of the safety of chemicals in foods, drugs and
cosmetics. Washington, DC, Editorial Committee of the Association
of Food and Drug Officials of the United States.
Felix K, Nagel W, Hartmann HJ, & Weser U (1990) Copper transfer
through the intestinal wall. Serosal release of metallothionein.
Biol Metab, 3: 141-145.
Fergusson JE & Stewart C (1992) The transport of airborne trace
elements copper, lead, cadmium, zinc and manganese from a city into
rural areas. Sci Total Environ, 121: 247-269.
Fernandes JC & Henriques FS (1991) Biochemical, physiological, and
structural effects of excess copper in plants. Bot Rev, 57(3):
246-273.
Ferrando MD & Andreu E (1993) Feeding behavior as an index of
copper stress in Daphnia magna and Brachionus calyciflorus.
Comp Biochem Physiol, 106C(2): 327-331.
Ferrando MD, Andreu-Moliner E, & Fernández-Casalderrey A (1992)
Relative sensitivity of Daphnia magna and Brachionus
calyciflorus to five pesticides. J Environ Sci Health, B27(5):
511-522.
Ferrando MD, Janssen CR, Andreu E, & Persoone G (1993)
Ecotoxicological studies with the freshwater rotifer
Brachionus calyciflorus: III. The effects of chemicals on the
feeding behavior. Ecotoxicol Environ Saf, 26(1): 1-9.
Fewtrell L, Kay D, Jones F, Baker A, & Mowat A (1996) Copper in
drinking water -- an investigation into possible health effects.
Public Health, 110: 175-177.
Fields M, Ferreti RJ, Smith JC Jr & Reiser S (1984) The interaction
of type of dietary carbohydrates with copper deficiency. Am J Clin
Nutr, 39: 289-295.
Filipek LH, Nordstrom DK, & Ficklin WH (1987) Interaction of acid
mine drainage with waters and sediments of West Squaw Creek in the
West Shasta mining district, California. Environ Sci Technol, 21:
388-396.
Finley EB & Cerklewski FL (1983) Influence of ascorbic acid
supplementation on copper status in young adult men. Am J Clin
Nutr, 37: 553-556.
Fischer PW, Giroux A, & L'Abbé MR (1983) Effects of zinc on mucosal
copper binding and on the kinetics of copper absorption. J Nutr,
113: 462-469.
Fischer PW, L'Abbé MR, & Giroux A (1990) Effects of age, smoking,
drinking, exercise and estrogen use on indices of copper status in
healthy adults. Nutr Res, 10: 1081-1090.
Fischer JG, Tackett RL, Howerth EW, & Johnson MA (1992) Copper and
selenium deficiencies do not enhance the cardiotoxicity in rats due
to chronic doxorubicin treatment. J Nutr, 122: 2128-2137.
Fisher D (1992) Copper. In: Sullivan JB & Krieger GR ed. Hazardous
materials toxicology: Clinical principles of environmental health.
Baltimore, Maryland, Williams & Wilkins, pp 860-864.
Fjeldstad H, Hvatum OO, & Bjorndalen JE (1988) Heavy metal
pollution of ombrotrophic bogs in the Kristiansand area,
Vest-Agder, Norway. Nor J Agric Sci, 2(2): 161-177.
Flemming CA & Trevors JT (1988) Effect of copper on nitrous oxide
reduction in freshwater sediment. Water Air Soil Pollut, 40:
391-397.
Fleurent E & Levi L (1920) Sur la présence du cuivre dans
l'organisme végétal et animal. Bull Soc Chim France, 27: 440.
Florence TM (1989) Electrochemical techniques for trace element
speciation in waters. In: Batley GE ed. Trace element speciation:
Analytical methods and problems. Boca Raton, Florida, CRC Press, pp
77-116.
Florence TM, Morrison GM, & Stauber JL (1992) Determination of
trace element speciation and the role of speciation in aquatic
toxicity. Sci Total Environ, 125: 1-13.
Flynn A, Franzmann AW, & Arneson PD (1976) Molybdenum-sulfur
interactions in the utilization of marginal dietary copper in
Alaskan moose (Alces alces gigas). In: Chappel WR & Petersen KK
ed. Molybdenum in the environment -- Volume 1: The biology of
molybdenum. New York, Marcel Dekker, Inc., pp 115-124.
Flynn A, Franzmann AW, Arneson PD, & Oldemeyer JL (1977)
Indications of copper deficiency in a subpopulation of Alaskan
moose. J Nutr, 107(7): 1182-1189.
Förstner U & Wittmann GTW (1979) Metal pollution in the aquatic
environment. Berlin, Springer-Verlag.
Förstner U & Wittmann GTW (1981) Metal pollution in the aquatic
environment, 2nd ed. New York, Basel, Springer-Verlag.
Fraser WD, Taggart DP, Fell GS, Lyon TDB, Wheatley D, Garden OJ, &
Shenken A (1989) Changes in iron, zinc, and copper concentrations
in serum and in their binding to transport proteins after
cholecystectomy and cardiac surgery. Clin Chem, 35(11): 2243-2247.
Freedman JH, Ciriolo MR, & Peisach J (1989) The role of glutathione
in copper metabolism and toxicity. J Biol Chem, 264: 5598-5605.
Frenckell-Insam BAK & Hutchinson TC (1993) Occurrence of heavy
metal tolerance and co-tolerance in Deschampsia cespitosa (L.)
Beauv. from European and Canadian populations. New Phytol, 125:
555-564
Freundt KJ & Ibrahim HA (1991) Influence of Pb, Cd, Zn, Mn, Cu, Hg,
or Be salts on the glutathione S-transferases of the rat liver.
Bull Environ Contam Toxicol, 46: 618-624.
Friberg L, Nordberg GF, & Vouk VB (1979) Handbook on the toxicology
of metals. Amsterdam, Elsevier/North Holland Biomedical Press.
Frieden E & Hsieh HS (1976) The biological role of ceruloplasmin
and its oxidase activity. Adv Exp Med Biol, 74: 505-529.
Frommer DJ (1981) Urinary copper excretion and hepatic copper
concentrations in liver disease. Digestion, 21: 169-178.
Frostegård Å, Tunlid A, & Bååth E (1993) Phospholipid fatty acid
composition, biomass, and activity of microbial communities from
two soil types experimentally exposed to different heavy metals.
Appl Environ Microbiol, 59: 3605-3617.
Frydman M, Bonne-Tamir B, Farrer LA, Conneally PM, Magazanik A,
Ashbel S, & Goldwitch Z (1985) Assignment of the gene for Wilson's
disease to chromosome 13: linkage to the esterase D locus. Proc
Natl Acad Sci (USA), 82(6): 1819-1821.
Gabuchyan VV (1987) Impairment mechanism of the reproductive
function ni cuprum chloride-exposed white male rats. Gig Tr Prof
Zabol, 31(9): 28-31.
Gadh R, Tandon SN, Mathur RP, & Singh OV (1993) Speciation of
metals in Yamuna river sediments. Sci Total Environ, 136: 229-242.
Ganezer KS, Hjart ML, & Carnes WH (1976) Tensile properties of
tendon in copper deficient swine. Proc Soc Exp Biol Med, 153:
396-399.
Garcia-Sanchez F, Navas-Diaz A, & Medinilla J (1990) Mineralization
procedure for determination of copper in aerosols using photometric
method based on copper-BPKQH complex. J Assoc Off Anal Chem, 73:
764-770.
Gardner M & Ravenscroft J (1991) The behaviour of copper
complexation in rivers and estuaries: two studies in North-East
England. Chemosphere, 23: 695-713.
Gauss JD, Woods PE, Winner RW, & Skillings JH (1985) Acute toxicity
of copper to three life stages of Chironomus tentans as affected by
water hardness-alkalinity. Environ Pollut, A37: 149-157.
Geckler JR, Horning WB, Neiheisel TM, Pickering QH, Robinson EL, &
Stephan CE (1976) Validity of laboratory tests for predicting
copper toxicity in streams. Duluth, Minnesota, US Environmental
Protection Agency (EPA-600/3-76-116).
Gerdes AM, Tonnesen T, Pergament E, Sander C, Baerlocher KE, Wartha
R, Guttler F, & Horn N (1988) Variability in clinical expression of
Menkes syndrome. Eur J Pediatr, 148(2): 132-135.
Germani MS, Small M, Zoller WH, & Moyers JL (1981) Fractionation of
elements during copper smelting. Environ Sci Technol, 15: 299-305.
Gettier SW, Martens DC, & Kornegay ET (1988) Corn response to six
annual Cu-enriched pig manure applications to three soils. Water
Air Soil Pollut, 40: 409-418.
Giesy JP, Alberts JJ, & Evans DW (1986) Conditional stability
constants and binding capacities for copper (II) by dissolved
organic carbon isolated from surface waters of the southeastern
United States. Environ Toxicol Chem, 5: 139-154.
Giesy JP, Newell A, & Leversee GJ (1983) Copper speciation in soft
acid humic water: effect on copper bioaccumulation by and toxicity
to Simocephalus serrulatus. Sci Total Environ, 28: 23-36.
Gintenreiter S, Ortel J, & Nopp HJ (1993) Effects of different
dietary levels of cadmium, lead, copper, and zinc on the vitality
of the forest pest insect Lymantria dispar L. (Lymantriidae,
Lepid.). Arch Environ Contam Toxicol, 25: 62-66.
Gleason RP (1968) Exposure to copper dust. Am Ind Hyg Assoc J, 29:
461-462.
Gold LS, Sawyer CB, Magaw R, Backman GM, de Veciana M, Levinson R,
Hooper NK, Havender WR, Bernstein L, Peto R, Pike MC, & Ames BN
(1984) A carcinogenic potency database of the standardized results
of animal bioassays. Environ Health Perspect, 58: 9-319.
Goldstein S & Czapski G (1986) The role and mechanism of metal ions
and their complexes in enhancing damage in biological systems or in
protecting these systems from the toxicity of O2-. J Free Radic
Biol Med, 2(1): 3-11.
Gollan JL & Deller DJ (1973) Studies on the nature and excretion of
biliary copper in man. Clin Sci, 44: 9-15.
Gooneratne SR, Chaplin RK, Trent AM, & Christensen DA (1989) Effect
of tetrathiomolybdate administration on the excretion of copper,
zinc, iron and molybdenum in sheep bile. Br Vet J, 145: 62-72.
Gormally SM, Baker A, Portmann B, Mowat A, & Drumm B (1994) High
water copper content associated with Indian childhood cirrhosis in
European children. Gastroenterology, 106: A900 (abstract).
Gorzelska K (1989) Locally generated atmospheric trace metal
pollution in Canadian Arctic as reflected by chemistry of snowpack
samples from the Mackenzie delta region. Atmos Environ, 22:
2729-2737.
Goyer RA (1991) Toxic effects of metals. In: Andur MO, Doull J, &
Klaassen CD ed. Casarett and Doull's toxicology: The basic science
of poisons, 4th ed. Oxford, New York, Pergamon Press, chapter 10,
pp 623-680.
Graham JH, Timmer LW, & Fardelmann D (1986) Toxicity of fungicidal
copper in soil to citrus seedlings and vesicular-arbuscular
mycorrhizal fungi. Phytopathology, 76: 66-70.
Gralla EB, Thiele DJ, Silar P, & Valentine JS (1991) ACE1, a copper
dependent transcription factor, activates expression of the yeast
copper, zinc superoxide dismutase gene. Proc Natl Acad Sci (USA),
88: 8558-8562.
Grant A, Hateley JG, & Jones NV (1989) Mapping the ecological
impact of heavy metals on the estuarine polychaete Nereis
diversicolor using inherited metal tolerance. Mar Pollut Bull,
20(5): 235-238.
Grant LD, Elias R, Nicholson W, Goyer R, & Olem H (1990) Indirect
health effects associated with acidic deposition. In: State of
science and technology. National Acid Precipitation Assessment
Program (NAPAP), pp 23-33 (Report No. 23).
Greene FL, Lamb LS, Barwick M, & Pappas NJ (1987) Effect of dietary
copper on colonic tumor production and aortic integrity in the rat.
J Surg Res, 42: 503-512.
Greger JL & Mulvaney J (1985) Absorption and tissue distribution of
zinc, iron and copper by rats fed diets containing lactalbumin, soy
and supplemental sulfur-containing amino acids. J Nutr, 115:
200-210.
Greger JL, Zaikis SC, Abernathy RP, Bennett OA, & Huffman J (1978)
Zinc, nitrogen, copper, iron, and manganese balance in adolescent
females fed two levels of zinc. J Nutr, 108(9): 1449-1456.
Gregory JR, Collins DL, Davies PSW, Hughes JM, & Clarke PC (1995)
National diet and nutrition survey: children aged 1 ´ to 4 ´ years
-- Volume 1: Report of the diet and nutrition survey. London, Her
Majesty's Stationary Office (HMSO), pp 177-201.
Gross JB Jr, Miers BM, Kost LJ, Kuntz SM, & La Russo NF (1989)
Biliary copper excretion by hepatocyte lysosomes in the rat. Mayor
excretory pathway in experimental copper overload. J Clin Invest,
83: 30-39.
Groudev SN & Groudeva VI (1993) Microbial communities in four
industrial copper dump leaching operations in Bulgaria. FEMS
Microbiol Rev, 11: 261-267.
Guerihault B (1920) Sur la présence du cuivre dans les plantes et
particulièrement dans les matières alimentaires d'origine végétale.
C R Soc Biol, 171: 196.
Haanstra L & Doelman P (1984) Glutamic acid decomposition as a
sensitive measure of heavy metal pollution in soil. Soil Biol
Biochem, 16: 595-600.
Haanstra L & Doelman P (1991) An ecological dose-response model
approach to short- and long-term effects of heavy metals on
arylsulphatase activity in soil. Biol Fertil Soils, 11: 18-23.
Haas RH, Robinson A, Evans K, Lascelles PT, & Dubowitz V (1981) An
X-linked disease of the nervous system with disordered copper
metabolism and features differing from Menkes disease. Neurology,
31(7): 852-859.
Hackel H, Miller K, Elsner P, & Burg G (1991) Unusual combined
sensitization to palladium and other metals. Contact Dermatitis,
24: 131-132.
Haddad DS, Al-Alousi LA, & Kantarjian AH (1991) The effect of
copper loading on pregnant rats and their offspring. Funct Dev
Morphol, 1: 17-22.
Håkansson K, Karlsson S, & Allard B (1989) Effects of pH on the
accumulation and redistribution of metals in a polluted stream bed
sediment. Sci Total Environ, 87/88: 43-57.
Hall HC (1921) La dégénérescence hépato-lenticulaire: Maladie de
Wilson-pseudosclérose. Paris, Editions Masson, pp 190-192.
Hall A (1981) Copper accumulation in copper-tolerant and
non-tolerant populations of the marine fouling alga Ectocarpus
siliculosus (Dillw.) Lyngbze. Bot Mar 24: 223-228.
Hall A, Fielding AH, & Butler M (1979) Mechanism of copper
tolerance in the marine fouling alga Ectocarpus siliculosus:
Evidence for an exclusion mechanism. Mar. Biol., 54: 195-199
Hall WS, Bushong SJ, Hall LW, Lenkevich MJ, & Pinkney AE (1988)
Monitoring dissolved copper concentrations in Chesapeake Bay, USA.
Environ Monit Assess, 11(1): 33-42.
Hall LW, Unger MA, Ziegenfuss MC, Sullivan JA, & Bushong SJ (1992)
Butyltin and copper monitoring in a northern Chesapeake Bay marina
and river system in 1989: an assessment of tributyltin legislation.
Environ Monit Assess, 22(1) 15-38.
Hamer DH (1986) Metallothionein. Annu Rev Biochem, 55: 913-951.
Hamilton SJ & Buhl KJ (1990) Safety assessment of selected
inorganic elements to fry of chinook salmon (Oncorhynchus
tshawytscha). Ecotoxicol Environ Saf, 20: 307-324.
Hamilton EI, Minski MJ, & Cleary JJ (1972) The concentration and
distribution of some stable elements in healthy human tissues from
the United Kingdom. Sci Total Environ, 1: 341-361.
Han B-C & Hung T-C (1990) Green oysters caused by copper pollution
on the Taiwan coast. Environ Pollut, 65: 347-362.
Han B-C, Jeng W-L, Tsai Y-N, & Jeng M-S (1993) Depuration of copper
and zinc by green oysters and blue mussels of Taiwan. Environ
Pollut, 82: 93-97.
Hansen IV, Weeks JM, & Depledge MH (1995) Accumulation of copper,
zinc, cadmium and chromium by the marine sponge Halichondria
panicea Pallas and the implications for biomonitoring. Mar Pollut
Bull, 31(1-3): 133-138.
Hanson MJ & Stefan HG (1984) Side effects of 58 years of copper
sulfate treatment of the Fairmont Lakes, Minnesota. Water Resour
Bull, 20(6): 889-900.
Haraldsson C & Westerlund S (1988) Trace metals in the water
columns of the Black Sea and Framvaren Fjord. Mar Chem, 23(3-4):
417-424.
Harless E (1847) [About the blue blood of some non-vertebrate
animals and its copper content.] Muller's Arch Anat Physiol, 1847:
148 (in German).
Harris ED (1991) Copper transport: An overview. Proc Soc Exp Biol
Med, 196: 130-140.
Harris ED (1995) The iron-copper connection: the link to
ceruloplasmin grows stronger. Nutr Rev, 53: 170-173.
Harris ED & DiSilvestro RA (1981) Correlation of lysyl oxidase
activation with the p-phenylenediamine oxidase activity
(ceruloplasmin) in serum. Proc Soc Exp Biol Med, 166(4): 528-531.
Harris ZL & Gitlin JD (1996) Genetic and molecular basis for copper
toxicity. Am J Clin Nutr, 63(suppl): 836S-841S.
Harris ED & Percival SS (1991) A role for ascorbic acid in copper
transport. Am J Clin Nutr, 54: 1193S-1197S.
Harris ED, Gonnerman WA, Savage JE, & O'Dell BL (1974) Connective
tissue amine oxidase. II. Purification and partial characterization
of lysyl oxidase from chick aorta. Biochim Biophys Acta, 341(2):
332-344.
Harris ED, Blount JE, & Leach RM (1980) Localization of
lysyloxidase in hen oviduct: implications in egg shell membrane
formation and composition. Science, 208: 55-56.
Harrisson JWE, Levin SE, & Trabin B (1954) The safety and fate of
potassium sodium copper chlorophyllin and other copper compounds.
J Am Pharm Assoc, 43: 722-737.
Hart EB, Steenbock H, Waddell J, & Elvehjem CA (1928) Iron in
nutrition: VII. Copper as a supplement to iron for hemoglobin
building in the rat. J Biol Chem, 77: 797-812.
Hart BT, Currey NA, & Jones MJ (1992) Biogeochemistry and effects
of copper, manganese and zinc added to enclosures in Island
Billabong, Magela Creek, northern Australia. Hydrobiologia, 230:
93-134.
Hartmann HA & Evenson MA (1992) Deficiency of copper can cause
neuronal degeneration. Med Hypotheses, 38: 75-85.
Hartter DE & Barnea A (1988) Brain tissue accumulates 67 copper by
two ligand-dependent saturable processes. A high affinity, low
capacity and a low affinity, high capacity process. J Biol Chem,
263(2): 799-805.
Hartwell SI, Jin JH, Cherry DS, & Cairns J (1989) Toxicity versus
avoidance response of golden shiner, Notemigonus crysoleucas, to
five metals. J Fish Biol, 35: 447-456.
Haschke F, Ziegler EE, Edwards BB, & Fomon SJ (1986) Effect of iron
fortification of infant formula on trace mineral absorption. J
Pediatr Gastroenterol Nutr, 5: 768-773.
Hasegawa R, Nakaji Y, Kurokawa Y, & Tobe M (1989) Acute toxicity
tests on 113 environmental chemicals. Research Institute of the
Tohoku University, pp 10-16 (Scientific Report No. 36).
Hatakeyama S (1988) Chronic effects of Cu on reproduction of
Polypedilumium nubifer (Chironomidae) through water and food.
Ecotoxicol Environ Saf, 16: 1-10.
Havens KE (1994a) An experimental comparison of the effects of two
chemical stressors on a freshwater zooplankton assemblage. Environ
Pollut, 84: 245-251.
Havens KE (1994b) Structural and functional responses of a
freshwater plankton community to acute copper stress. Environ
Pollut, 86: 259-266.
Hayton BA, Broome HE, & Lilenbaum RC (1995) Copper
deficiency-induced anemia and neutropenia secondary to intestinal
malabsorption. Am J Hematol, 48(1): 45-47.
Haywood S (1980) The effect of excess dietary copper on the liver
and kidney of the male rat. J Comp Pathol, 90: 217-232.
Haywood S (1985) Copper toxicosis and tolerance in the rat: I.
Changes in copper content of the liver and kidney. J Pathol, 145:
149-158.
Haywood S & Comerford B (1980) The effect of excess dietary copper
on plasma enzyme activity and on the copper content of the blood of
the male rat. J Comp Pathol, 90: 233-238.
Haywood S & Loughran M (1985) Copper toxicosis and tolerance in the
rat: II. Tolerance -- a liver protective adaptation. Liver, 5:
267-275.
Heath AG (1991) Effect of water-borne copper on physiological
responses of bluegill (Lepomis macrochirus) to acute hypoxic stress
and subsequent recovery. Comp Biochem Physiol, 100C: 559-564.
Hébert CD (1993) NTP technical report on toxicity studies of cupric
sulfate (CAS No. 7758-99-8) administered in drinking water and feed
to F344/N rats and B6C3F1 mice. Research Triangle Park, North
Carolina, United States Department of Health and Human Services,
National Toxicology Program, 94 pp (NTP Toxicity Report Series No.
29; NIH Publication 93-3352).
Hébert CD, Elwell MR, Travlos GS, Fitz CJ, & Bucher JR (1993)
Subchronic toxicity of cupric sulfate administered in drinking
water and feed to rats and mice. Fundam Appl Toxicol, 21: 461-475.
Hedberg T, Vik AE, & Ferguson J ed. (1996) Report from the
International Seminar and Workshop on Internal Corrosion in Water
Distribution Systems, Göteborg, 22-27 May 1995. Göteborg, Sweden,
Göteborg University.
Hedtke SF (1984) Structure and function of copper-stressed aquatic
microcosms. Aquat Toxicol, 5: 227-244.
Helios Rybicka E, Wilson MJ, & Mchard WJ (1994) Chemical and
mineralogical forms and mobilization of copper and lead in soils
from a Cu-smelting area in Poland. J Environ Sci Health, A29(3):
531-546.
Heller RM, Kirchner SG, O'Neill JA Jr, Hough AJ Jr, Howard L,
Kramer SS, & Green HL (1978) Skeletal changes of copper deficiency
in infants receiving prolonged total parenteral nutrition. J
Pediatr, 92(6): 947-949.
Helz GR, Hugget RJ, & Hill JM (1975) Behavior of Mn, Fe, Cu, Cd,
and Pb discharged from a wastewater treatment plant into an
estuarine environment. Water Res, 9: 631-636.
Henry CL & Harrison RB (1992) Fate of trace metals in sewage sludge
compost. In: Domy CA ed. Biogeochemistry of trace metals. Boca
Raton, Florida, Lewis Publishers, pp 195-216.
Heresi G, Castillo-Durán C, Muñoz C, Arevalo M, & Schlesinger L
(1985) Phagocytosis and immunoglobulins levels in hypocupremic
infants. Nutr Res, 5: 1327-1334.
Hill R & Williams HL (1965) The effects on intensively reared lambs
of diets containing excess copper. Vet Rec, 77(36): 1043-1045.
Hirano S, Ebihara H, Sakai S, Kodama N, & Suzuki KT (1993)
Pulmonary clearance and toxicity of intratracheally instilled
cupric oxide in rats. Arch Toxicol, 67: 312-317.
Hirano S, Sakai S, Ebihara H, Kodama N, & Suzuki KT (1990)
Metabolism and pulmonary toxicity of intratracheally instilled
cupric sulfate in rats. Toxicology, 64(3): 223-233.
Holak W (1983) Determination of copper, nickel, and chromium in
foods. J Assoc Off Anal Chem, 66: 620-624.
Holdbrook JT, Smith JC Jr, & Reiser S (1989) Dietary fructose or
starch: effects on copper, zinc, iron, manganese, calcium, and
magnesium balances in humans. Am J Clin Nutr, 49: 1290-1294.
Holmgren GGS, Meyer MW, Chaney RL, & Daniels RB (1993) Cadmium,
lead, zinc, copper, and nickel in agricultural soils of the United
States of America. J Environ Qual, 22: 335-348.
Holtzman NA, Charache P, Cordano A, & Graham GG (1970) Distribution
of serum copper in copper deficiency. John Hopkins Med J, 126:
34-42.
Holwerda DA (1991)Cadmium kinetics in freshwater clams: V.
Cadmium-copper interactions in metal accumulation by Anadonta
cygnea and characterization of the metal-binding protein. Arch
Environ Contam Toxicol, 21: 432-437.
Hong S, Candelone J-P, Patterson CC, & Boultron CF (1996) History
of ancient copper smelting pollution during Roman and Medieval
times recorded in Greenland ice. Science, 272: 246-247.
Hoogenraad TU & van den Hamer CJA (1983) Three years of continuous
oral zinc therapy in tour patients with Wilson's disease. Acta
Neurol Scand, 67: 356-364.
Hopkin SP (1993) Deficiency and excess of copper in terrestrial
isopods. In: Dallinger R & Rainbow PS ed. Ecotoxicology of metals
in invertebrates. Boca Raton, Florida, Lewis Publishers, pp
359-382.
Hopkin R & Kain JM (1978) The effects of some pollutants on the
survival, growth and respiration of Laminaria hyperborea. Estuar
Coast Mar Sci, 7(6): 531-554.
Hopkin SP, Hardisty GN, & Martin MH (1986) The woodlouse
Porcellio scaber as a 'biological indicator' of zinc, cadmium,
lead and copper pollution. Environ Pollut, B11: 271-290.
Hopkin SP, Jones DT, & Dietrich D (1993) The isopod Porcellio
scaber as a monitor of the bioavailability of metals in terrestrial
ecosystems: towards a global "woodlouse watch" scheme. Sci Total
Environ, 1(suppl): 357-365.
Hopper SH & Adams HS (1958) Copper poisoning from vending machines.
Public Health Rep, 73: 910-914.
Horning WB & Neiheisel TW (1979) Chronic effect of copper on the
bluntnose minnow, Pimephales notatus (Rafinesque). Arch Environ
Contam Toxicol, 8: 545-552.
Howarth RS & Sprague JB (1978) Copper lethality to rainbow trout in
waters of various hardness and pH. Water Res, 12: 455-462.
Howeler RH (1983) [Study of some tropical plants for the diagnosis
of nutritional problems.] Cali, Colombia, International Centre for
Tropical Agriculture, 28 pp (in Spanish).
Howell JS (1958) The effect of copper acetate on
p-dimethylaminoazobenzene carcinogenesis in the rat. Br J Cancer,
12: 594-610.
Huber MC, Winter REK, & Bolla RI (1989) Effect of copper sulfate
and lead acetate on infection of pines with Bursaphelenchus
xylophilus. J Nematol, 21: 1-9.
Hunt CE & Carlton WW (1965) Cardiovascular lesions associated with
experimental copper deficiency in the rabbit. J Nutr, 87: 385-393.
Hunt CE, Carlton WW, & Newberne PM (1970) Interrelationships
between copper deficiency and dietary ascorbic acid in the rabbit.
Br J Nutr, 24: 61-69.
Hunter BA & Johnson MS (1982) Food chain relationships of copper
and cadmium in contaminated grassland ecosystems. Oikos, 38:
108-117.
Hunter BA, Johnson MS, & Thompson DJ (1987a) Ecotoxicology of
copper and cadmium in a contaminated grassland ecosystem: I. Soil
and vegetation contamination. J Appl Ecol, 24: 573-586.
Hunter BA, Johnson MS, & Thompson DJ (1987b) Ecotoxicology of
copper and cadmium in a contaminated grassland ecosystem: II.
Invertebrates. J Appl Ecol, 24: 587-599.
Hunter BA, Johnson MS, & Thompson DJ (1987c) Dynamics of metal
accumulation in the grasshopper Chorthippus brunneus in
contaminated grasslands. Arch Environ Contam Toxicol, 16: 711-716.
Hurley LS & Keen CL (1988) Fetal and neonatal development in
relation to maternal trace element nutrition: manganese, zinc, and
copper. In: Berger H ed. Vitamins and minerals in pregnancy and
lactation. New York, Raven Press Ltd, pp 215-230 (Nestle Nutrition
Workshop Series, Volume 16).
Hutchinson TH, Williams TD, & Eales GJ (1994) Toxicity of cadmium,
hexavalent chromium and copper to marine fish larvae
(Cyprinodon variegatus) and copepods (Tisbe battagliai). Mar
Environ Res, 38: 275-290.
IARC (1977) Copper 8-hydroxygquinoline. In: Some fumigants, the
herbicides 2,4-D and 2,4,5-T chlorinated dibenzodioxins and
miscellaneous industrial chemicals. Lyon, International Agency for
Research on Cancer, pp 103-110 (IARC Monographs on the Evaluation
of the Carcinogenic Risk of Chemicals to Humans, Volume 15).
IARC (1987) Overall evaluations of carcinogenicity: an updating of
IARC monographs volumes 1 to 42. Lyon, International Agency for
Research on Cancer, p 61 (IARC Monographs on the Evaluation of the
Carcinogenic Risk of Chemicals to Humans, Supplement 7).
IAT (Institute of Animal Technicians) (1963) In: Short DJ &
Woodnott DP ed. Manual of laboratory animal practice techniques.
London, Crosby Lockwood & Son Ltd.
ICME (1995) Persistence, bis-accumulation and toxicity of metals
and metal compounds. Ottawa, Canada, International Council on
Metals and the Environment, 93 pp.
ICSG (1996) World refinery production of copper. Lisbon, Portugal,
The International Copper Study Group, pp 13-15 (table 5) (Copper
Bulletin, Volume 3).
ILO (1991) Occupational exposure limits for airborne toxic
substances, 3rd ed. Geneva, International Labour Organisation
(Occupational Safety and Health Series, No. 37).
Ingersoll CG & Winner RW (1982) Effect on Daphnia pulex (De Geer)
of daily pulse exposures to copper or cadmium. Environ Toxicol
Chem, 1: 321-327.
IPCS (1994) Environmental health criteria 170: Assessing human
health risks of chemicals: Derivation of guidance values for
health-based exposure limits. Geneva, World Health Organization,
International Programme on Chemical Safety, 73 pp.
ISO (1986) Water quality -- determination of cobalt, nickel,
copper, zinc, cadmium and lead -- flame atomic absorption
spectrometric methods, 1st ed. Geneva, International Standards
Organization, 11 pp.
Isolda A & Hayasaka SS (1991) Effect of herbicide residues on
microbial processes in pond sediment. Arch Environ Contam Toxicol,
20: 81-86.
Iwata M, Hirano A, & French JH (1979) Degeneration of the
cerebellar system in X-chromosome-linked copper malabsorption. Ann
Neurol, 5(6): 542-549.
Iyer VN & Szybalski W (1958) Two simple methods for the detection
of chemical mutagens. App Microbiol, 6: 23-29.
Jacob RA, Skala JR, Omaye ST, & Turnlund JR (1987) Effect of
varying ascorbic acid intakes on copper absorption and
ceruloplasmin levels of young men. J Nutr, 117: 2109-2115.
Jacobsen T & Slotfeldt-Ellingsen D (1983) Phytic acid and metal
availability: A study of Ca and Cu binding. Cereal Chem, 60:
392-395.
Jain VK & Mohan G (1991) Serum zinc and copper in myocardial
infarction with particular reference to prognosis. Biol Trace Elem
Res, 31: 317-322.
Jain SK, Vasudevan P, & Jha NK (1989) Removal of some heavy metals
from polluted water by aquatic plants: studies on duckweed and
water velvet. Biol Wastes, 28: 115-126.
Janes N & Playle RC (1995) Modeling silver binding to the gill of
rainbow trout (Oncorhynchus mykiss). Environ Toxicol Chem, 14:
1847-1858.
Janssen MPM, Ooszrthoff C, Heijmans GJSM, & van der Voet H (1995)
The toxicity of metal salts and the population growth of the
ciliate Colpoda cucculus. Bull Environ Contam Toxicol, 54:
597-605.
Jantsch W, Kulig K, & Rumack BH (1985) Massive copper sulfate
ingestion resulting in hepatotoxicity. J Toxicol Clin Toxicol,
22: 585-588.
Jarvis SC (1978) Copper uptake and accumulation by perennial
ryegrass grown in soil and solution culture. J Sci Food Agric, 29:
12-18.
Jeng SL & Yang CP (1995) Determination of lead, cadmium, mercury
and copper concentrations in duck. Poultry Sci, 74: 187-193.
Jenne EA (1987) Sediment quality criteria for metals: IV. Surface
complexation and acidity constants for modeling cadmium and zinc
adsorption onto iron oxides. Prepared for the US Environmental
Protection Agency, Office of Water Regulations and Standards,
Criteria and Standards Division, Washington, DC.
Johansson C & Moberg LE (1991) Area ratio effects on metal ion
release from amalgam in contact with gold. Scand J Dent Res, 99:
246-253.
Johansson A, Camner P, Jarstrand C, & Wiernik A (1983) Rabbit
alveolar macrophages after inhalation of soluble cadmium, cobalt,
and copper: A comparison with the effects of soluble nickel.
Environ Res, 31: 340-354.
Johansson A, Curstedt T, Robertson B, & Camner P (1984) Lung
morphology and phospholipids after experimental inhalation of
soluble cadmium, copper, and cobalt. Environ Res, 34(2): 295-309.
Johnson MW & Gentile JH (1979) Acute toxicity of cadmium, copper,
and mercury to larval American lobster Homarus americanus. Bull
Environ Contam Toxicol, 22: 258-264.
Johnson PE & Korynta ED (1992) Effects of copper, iron, and
ascorbic acid on manganese availability to rats. Proc Soc Exp Biol
Med, 199: 470-480.
Johnson MA & Murphy CL (1988) Adverse effects of high dietary iron
and ascorbic acid on copper status in copper-deficient and
copper-adequate rats. Am J Clin Nutr, 47: 96-101.
Johnson CA, Sigg L, & Zobrist J (1987) Case studies on the chemical
composition of fogwater: Influence of local gaseous emissions.
Atmos Environ, 21: 2365-2374.
Johnson RK, Ericsson L, & Wiederholm T (1992) Ordination of
profundal zoobenthos along a trace metal pollution gradient in
northern Sweden. Water Air Soil Pollut, 65(3/4): 339-351.
Jorhem L & Sundstrom B (1993) Levels of lead, cadmium, zinc,
copper, nickel, chromium, manganese, and cobalt in food on the
Swedish market. 1983-1990. J Food Compos Anal, 6: 223-241.
Josephs HW (1931) Treatment of anemia of infancy with iron and
copper. Bull John Hopkins Hosp, 49: 246-258.
Jungmann J, Reins H-A, Lee J, Romeo A, Hassett R, Kosman D, &
Jentsch S (1993) MAC1, is a nuclear regulatory protein related to
Cu-dependent transcription factors involved in CU/Fe utilization
and stress resistance in yeast. EMBO J, 12: 5051-5056.
Juste C & Mench M (1992) Long-term application of sewage sludge and
its effects on metal uptake by crops. In: Domy CA ed.
Biogeochemistry of trace metals. Boca Raton, Florida, Lewis
Publishers, pp 159-192.
Kabata-Pendias A & Pendias H (1984) Trace elements in soils and
plants. Boca Raton, Florida, CRC Press, Inc., 315 pp.
Kaitala S (1988) Multiple toxicity and accumulation of heavy metals
in two bivalve mollusc species. Water Sci Technol, 20(6/7): 23-32.
Kalac P, Niznanská M, Bevilaqua D, & Stasková I (1996)
Concentrations of mercury, copper, cadmium and lead in fruiting
bodies of edible mushrooms in the vicinity of a mercury smelter and
a copper smelter. Sci Total Environ, 177: 251-258.
Kaler SG, Gallo LK, Proud VK, Percy AK, Mark Y, Segal NA, Goldstein
DS, Holmes CS, & Gahl WA (1994) Occipital horn syndrome and a mild
Menkes phenotype associated with splice site mutations at the MNK
locus. Nat Genet, 8: 195-202.
Kanematsu N, Hara M, & Kada T (1980) Rec assay and mutagenicity
studies on metal compounds. Mutat Res, 77: 109-116.
Karlberg A-T, Boman A, & Wahlberg JE (1983) Copper -- a rare
sensitizer. Contact Dermatitis, 9: 134-139.
Kasama T & Tanaka H (1988) Effects of copper administration on
fetal and neonatal mice. J Nutr Sci Vitam, 34: 595-605.
Kataoka M & Tavassoli M (1984) Ceruloplasmin receptors in liver
cell suspensions are limited to the endothelium. Exp Cell Res, 155:
232-240.
Kataoka M & Tavassoli M (1985) Identification of ceruloplasmin
receptors on the surface of human blood monocytes, granulocytes,
and lymphocytes. Exp Hematol, 13: 806-810.
Kawahara D, Oshima H, Kosugi H, Nakamura M, Sugai T, & Tamaki T
(1993) Further epidemiologic study of occupational contact
dermatitis in the dental clinic. Contact Dermatitis, 28: 114-115.
Kay SH, Haller WT, & Garrard LA (1984) Effects of heavy metals on
water hyacinths (Eichhornia crassipes (Mart.) Solms). Aquat
Toxicol, 5: 117-128.
Keinholz EW (1977) Effects of environmental molybdenum levels upon
wildlife. In: Chappel WR & Petersen KK ed. Molybdenum in the
environment -- Volume 2 : The geochemistry, cycling and industrial
uses of molybdenum. New York, Marcel Dekker, Inc., pp 731-737.
Kelley DS, Daudu PA, Taylor PC, Mackey BE, & Turnlund JR (1995)
Effects of low-copper diets on human immune response. Am J Clin
Nutr, 62: 412-416.
Khangarot BS (1992) Copper-induced hepatic ultrastructural
alterations in the snake-headed fish, Channa punctatus. Ecotoxicol
Environ Saf, 23: 282-293.
Khangarot BS & Ray PK (1987) Sensitivity of toad tadpoles,
Bufo melanostictus (Schneider), to heavy metals. Bull Environ
Contam Toxicol, 38: 523-527.
Khangarot BS & Ray PK (1989) Sensitivity of midge larvae of
Chironomus tentans Fabricius (Diptera Chironomidae) to heavy
metals. Bull Environ Contam Toxicol, 42: 325-330.
Kim N & Fergusson J (1993) Concentrations and sources of cadmium,
copper, lead and zinc in house dust in Christchurch, New Zealand.
Sci Total Environ, 138: 1-21.
King LD (1988) Retention of metals by several soils of the
southeastern United States. J Environ Qual, 17: 239-246.
King KA, Leleux J, & Mulhern BM (1984) Molybdenum and copper levels
in white-tailed deer near uranium mines. J Wildl Manage, 48(1):
267-270.
Kinsman GD, Howard AN, Stone DL, & Mullins PA (1990) Studies in
copper status and atheroesclerosis. Biochem Soc Trans, 18:
1186-1188.
Kirk RS & Lewis JW (1993) An evaluation of pollutant induced
changes in the gills of rainbow trout using scanning electron
microscopy. Environ Technol, 14: 577-585.
Kjaer A, Laursen K, Thormann L, Borggaard O, & Lebech PE (1993)
Copper release from copper intrauterine devices removed after up to
8 years of use. Contraception, 47: 349-358.
Klapheck S, Fliegner W, & Zimmer I (1994) Hydroxymethyl
phytochelatins (gamma glutamylcysteine)(n)-serine are metal induced
peptides of the poaceae. Plant Physiol, 104(4): 1325-1332.
Klein WJ, Metz EN, & Price AR (1972) Acute copper intoxication.
Arch Intern Med, 129: 578-582.
Klein D, Schloz P, Drasch GA, Muller-Hocker J, & Summer KH (1991)
Metallothionein, copper and zinc in fetal and neonatal human liver:
changes during development. Toxicol Lett, 56(1-2): 61-67.
Klevay LM (1975) Coronary heart disease: the zinc/copper
hypothesis. Am J Clin Nutr, 28: 764-774.
Klevay LM (1988) Dietary cholesterol lowers liver copper in
rabbits. Biol Trace Elem Res, 38: 47-54.
Klevay LM (1992) Re: Serum copper and the risk of acute myocardial
infarction: a prospective population study in Eastern Finland. Am
J Epidemiol, 135: 832-834.
Klevay LM, Inman L, Johnson LK, Lawler M, Mahalko JR, Milne DB,
Lusaski HC, Bolonchuk W, & Sandstead HH (1984) Increased
cholesterol in plasma in a young man during experimental copper
depletion. Metabolism, 33: 1112-1118.
Klevay LM, Canfield WK, & Gallagher SK (1986) Decreased glucose
tolerance in two men during experimental copper depletion. Nutr Rep
Int, 33: 371-382.
Knobeloch L, Ziarnik M, Howard J, Theis B, Farmer D, Anderson H, &
Proctor M (1994) Gastrointestinal upsets associated with ingestion
of copper-contaminated water. Environ Health Perspect, 102:
958-961.
Kodama H (1993) Recent developments in Menkes disease. J Inherit
Metab Disease, 16: 791-799.
Kok FJ, Van Duijn CM, Hofman A, Van Der Voit GB, De Wolff FA, Paays
CHC, & Valkenburg HA (1988) Serum copper and zinc and the risk of
death from cancer and cardiovascular disease. Am J Epidemiol, 128:
352-359.
Kolb M, Rach P, Schafer J, & Wild A (1992) Investigations of
oxidative UV photolysis: I. Sample preparation for the voltammetric
determination of Zn, Cd, Pb, Cu, Ni and Co in waters. Fresenius J
Anal Chem, 342: 341-349.
Konar SK & Mullick S (1993) Problems of safe disposal of petroleum
products, detergents, heavy metals and pesticides to protect
aquatic life. Sci Total Environ 2 (suppl): 989-1000.
Kosalwat P & Knight AW (1987a) Acute toxicity of aqueous and
substrate-bound copper to the midge, Chironomus decorus. Arch
Environ Contam Toxicol, 16(3): 275-282.
Kosalwat P & Knight AW (1987b) Chronic toxicity of copper to a
partial life cycle of the midge, Chironomus decorus. Arch Environ
Contam Toxicol, 16(3): 283-290.
Kraak MHS, Lavy D, Peeters WHM, & Davids C (1992) Chronic
ecotoxicity of copper and cadmium to the zebra mussel Dreissena
polymorpha. Arch Environ Contam Toxicol, 23: 363-369.
Kraak MHS, Toussaint M, Lavy D, & Davids C (1994) Short-term
effects of metals on the filtration rate of the zebra mussel
Dreissena polymorpha. Environ Pollut, 84: 139-143.
Kressner MJ, Stockert RJ, Morell AG, & Sternlieb I (1984) Origins
of biliary copper. Hepathology, 4(5): 867-870.
Krishnakumar PK, Asokan PK, & Pillai VK (1990) Physiological and
cellular responses to copper and mercury in the green mussel
Perna viridis (Linnaeus). Aquat Toxicol, 18(3): 163-174.
Krolczyk AJ, Bear CE, Lai PFH, & Schimmer BP (1995) Effects of
mutations in camp-dependent protein kinase on chloride efflux in
caco-2 human colonic carcinoma cells. J Cell Physiol, 162: 64-73.
Kruckeberg AL & Wu L (1992) Copper tolerance and copper
accumulation of herbaceous plants colonizing California copper
mines. Ecotoxicol Environ Saf, 23: 307-319.
Kumar D (1984) Genetics of Indian childhood cirrhosis. Trop Geogr
Med, 36(4): 313-316.
Kumpulainen J, Mutanen M, Paaki M, & Lehto J (1987) Validity of
calculation method in estimating mineral element concentration. Var
Foda, 39(1): 75-82.
Ladefoged O & Sturup S (1995) Copper deficiency in cattle, sheep
and horses caused by excess molybdenum from fly ash: a case report.
Vet Hum Toxicol, 37: 63-65.
Lanno RP, Slinger SJ, & Hilton JW (1985) Maximum tolerable and
toxicity levels of dietary copper in rainbow trout (Salmo
gairdneri Richardson). Aquaculture, 49: 257-268.
Larcher W (1995) Physiological plant ecology -- Ecophysiology and
stress physiology of functional groups, 3rd ed. Berlin,
Springer-Verlag.
LeBlanc GA (1982) Laboratory investigation into the development of
resistance of Daphnia magna (Straus) to environmental pollutants.
Environ Pollut, A27: 309-322.
LeBlanc GA (1985) Effects of copper on the competitive interactions
of two species of cladocera. Environ Pollut, A37: 13-25.
Lecyk M (1980) Toxicity of CuSO4 in mice embryonic development.
Zool Pol, 28: 101-105.
Lee YH & Stuebing RB (1990) Heavy metal contamination in the river
toad, Bufo juxtasper (Inger), near a copper mine in East
Malaysia. Bull Environ Contam Toxicol, 45: 272-279.
Lee SH, Lancey R, Montaser A, Madani N, & Linder MC (1993)
Ceruloplasmin and copper transport during the latter part of
gestation in the rat. Proc Soc Exp Biol Med, 203: 428-439.
Lehman AJ (1951) Chemicals in foods -- A report to the Association
of Food and Drug Officials on current developments: Part II.
Pesticides. Q Bull Assoc Food Drug Off, 15: 122-133.
Lehmann RG & Harter RD (1984) Assessment of copper-soil bond
strength by desorption kinetics. Soil Sci Soc Am J, 48: 769-772.
Leland HV, Fend SV, Dudley TL, & Carter JL (1989) Effects of copper
on species composition of benthic insects in a Sierra Nevada,
California, stream. Freshw Biol, 21: 163-179.
Lepp NW (1992) Uptake and accumulation of metals in bacteria and
fungi. In: Advances in trace substances research: Biogeochemistry
of trace metals. Boca Raton, Florida, Lewis Publishers, pp 283-289.
Levinson B, Gitschier J, Vulpe C, Whitney S, Yang S, & Packman S
(1993) Are X-linked cutis laxa and Menkes disease allelic? Nat
Genet, 3: 6.
Levy Y, Zeharia A, Grunebaum M, Nitzan M, & Steinherz R (1985)
Copper deficiency in infants fed cow milk. J Pediatr, 106: 786-788.
Lewis MA (1983) Effect of loading density on the acute toxicities
of surfactants, copper, and phenol to Daphnia magna Straus. Arch
Environ Contam Toxicol, 12: 51-55.
Lide DR & Frederikse HPR (1993) CRC handbook of chemistry and
physics, 74th ed. Boca Raton, Florida, CRC Press.
Lighthart B, Baham J, & Volk VV (1983) Microbial respiration and
chemical speciation in metal-amended soils. J Environ Qual, 12(4):
543-548.
Lim CT & Choo KE (1979) Wilson's disease in a 2 year old child. J
Singap Paediatr Soc, 21: 99-102.
Lin W, Rice MA, & Chien PK (1992) The effects of copper, cadmium
and zinc on particle filtration and uptake of glycine in the
Pacific oyster Crassostrea gigas. Comp Biochem Physiol, 103C(1):
181-187.
Lin H-C & Dunson WA (1993) The effect of salinity on the acute
toxicity of cadmium to the tropical, estuarine, hermaphroditic
fish, Rivulus marmoratus: a comparison of Cd, Cu, and Zn
tolerance with Fundulus heteroclitus. Arch Environ Contam
Toxicol, 25: 41-47.
Linder McC(1991) The biochemistry of copper. New York, Plenum
Press.
Linder MC & Hazegh-Azam M (1996) Copper biochemistry and molecular
biology. Am J Clin Nutr, 63: 797s-811s.
Linder MC, Wooten L, Cerveza P, Cotton S, Shulze R, & Lomeli N
(1998) Copper transport. Am J Clin Nutr, 67(suppl 5): 965/S-971/S.
Liu C-CF & Medeiros DM (1986) Excess diet copper increases systolic
blood pressure in rats. Biol Trace Elem Res, 9: 15-24.
Liu Y, Liu J, Iszard MB, Andrews GK, Palmiteer RD, & Klaassen CD
(1995) Transgenic mice that over-express metallothionein-I are
protected from cadmium lethality and toxicity. Toxicol Appl
Pharmacol, 135: 222-228.
Llewellyn GC, Floyd EA, Hoke GD, Weekley LB, & Kimbrough TD (1985)
Influence of dietary aflatoxin, zinc, and copper on bone size,
organ weight, and body weight in hamsters and rats. Bull Environ
Contam Toxicol, 35: 149-156.
Lo GS, Settle SL, & Steinke FH (1984) Bioavailability of copper in
isolated soybean protein using the rat as an experimental model.
J Nutr, 114: 332-340.
Lobban C, Harrison P, & Duncan M (1985) The physiological ecology
of seaweeds. Cambridge, UK, Cambridge University Press.
Logan JI, Harveyson KB, Wisdon GB, Highes AE, & Archbold GPR (1994)
Hereditary caeruloplasmin deficiency, dementia and diabetes
mellitus. Q J Med, 87: 663-670.
Logue JN, Koontz MD, & Hattwick MAW (1982) A historical prospective
mortality study of workers in copper and zinc refineries. J Occup
Med, 24: 398-408.
Lönnerdal B, Bell JG, & Keen CL (1985) Copper absorption from human
milk, cow's milk and infant formulas using a suckling rat model. Am
J Clin Nutr, 42: 836-844.
Lowe TP, May TW, Brumbaugh WG, & Kane DA (1985) National
contaminant, biomonitoring program: Concentration of seven elements
in freshwater fish 1978-1981. Arch Environ Contam Toxicol, 14:
363-388.
Lowy SL, Fisler JS, Drenick EJ, Hunt IF, & Swendseid ME (1986) Zinc
and copper nutriture in obese men receiving very low calorie diets
of soy or collagen protein. Am J Clin Nutr, 43(2): 272-287.
Lu PL, Huang KS, & Jiang SJ (1993) Determination of traces of
copper, cadmium and lead in biological and environmental samples by
flow-injection isotope dilution inductively coupled plasma mass
spectrometry. Anal Chim Acta, 284: 181-188.
Lukaski HC, Klevay LM, & Milne DB (1988) Effects of copper on human
autonomic cardiovascular function. Eur J Appl Physiol, 58: 74-80.
Lundborg M & Camner P (1984) Lysozyme levels in rabbit lung after
inhalation of nickel, cadmium, cobalt, and copper chlorides.
Environ Res, 34: 335-342.
Lussi A, Hotz P, & Schoenberg V (1992) [The release of mercury and
copper from in vivo aged amalgam fillings.] Schweiz. Mon.schr
Zahnmed, 102: 411-415 (in German).
Lydy MJ & Wissing TE (1988) Effect of sublethal concentrations of
copper on the critical thermal maxima (CTMax) of the fantail
(Etheostoma flabellare) and johnny (E. nigrum) darters. Aquat
Toxicol, 12: 311-322.
Lyle WH, Payton JE, & Hui M (1976) Haemodialysis and copper fever.
Lancet, I: 1324-1325.
Lynch SM & Strain JJ (1990) Effects of skim milk powder, whey or
casein on tissue trace element status and antioxidant enzyme
activities in rats fed control and copper-deficient diets. Nutr
Res, 10: 449-460.
Lyon DB (1984) Studies on the solubility of Ca, Mg, Zn, and Cu in
cereal products. Am J Clin Nutr, 39: 190-195.
Lyon TDB & Fell GS (1990) Isotopic composition of copper in serum
by inductively coupled plasma mass spectrometry. J Anal At
Spectrom, 5: 135-137.
Lyon TDB, Fell GS, Hutton RC, & Eaton AN (1988) Evaluation of
inductively coupled argon plasma mass spectrometry (ICP-MS) for
simultaneous multi-element trace analysis in clinical chemistry.
J Anal At Spectrom, 3: 265-271.
Lyon TDB, Fell GS, Gaffney D, McGaw BA, Russell RI, Park RHR,
Beattie AD, Curry G, Crofton RJ, Gunn I, Sturniolo GS, D'Inca R, &
Patriarca M (1995) Use of a stable copper isotope (65Cu) in the
differential diagnosis of Wilson's disease. Clin Sci, 88: 727-732.
Lyon TDB, Fletcher S, Fell GS, & Patriarca M (1996) Measurement and
application of stable copper isotopes to investigations of human
metabolism. Microchem J, 54: 236-243.
Ma W (1984) Sublethal toxic effects of copper on growth,
reproduction and litter breakdown activity in the earthworm
Lumbricus rubellus, with observations on the influence of
temperature and soil pH. Environ Pollut, A33: 207-219.
Ma W (1988) Toxicity of copper to lumbricid earthworms in sandy
agricultural soils amended with Cu-enriched organic waste
materials. Ecol Bull, 39: 53-56.
McArdle HJ (1995) The metabolism of copper during pregnancy -- a
review. Food Chem, 54: 79-84.
McArdle HJ & Erlich R (1991) Copper uptake and transfer to the
mouse fetus during pregnancy. J Nutr, 121: 208-214.
McCormick RJ, Ovecka GD, & Medeiros DM (1989) Myofibrillar and
nonmyofibrillar myocardial proteins of copper-deficient rats. J
Nutr, 119: 1683-1690.
McCullough AJ, Flemming R, & Thistle JL (1983) Diagnosis of
Wilson's disease presenting as fulminant hepatic failure.
Gastroenterology, 84: 161.
MacDonald JM, Shields JD, & Zimmer-Faust RK (1988) Acute toxicities
of eleven metals to early life-history stages of the yellow crab
Cancer anthonyi. Mar Biol, 98: 201-207.
McHargue JS (1925) The occurrence of copper, manganese, zinc,
nickel, and cobalt in soils, plants, and animals, and their
possible function as vital factors. J Agric Res, 30: 193-196.
McHargue JS (1926) Mineral constituents of the cotton plant. J Am
Soc Agron, 18: 1076-1083.
McHargue JS (1927a) The proportion and significance of copper, iron
and zinc in some mollusks and crustaceans. Trans Ky Acad Sci, 2:
46-52.
McHargue JS (1927b) Significance of the occurrence of manganese,
copper, zinc, nickel, and cobalt Kentucky blue grass. Ind Eng Chem
Res, 19: 274-276.
Mackey DJ & Higgins HW (1988) The copper-complexing capacity of
seawater. Sci Total Environ, 75: 151-167.
McKim JM & Benoit DA (1971) Effects of long-term exposures to
copper on survival, growth, and reproduction of brook trout
(Salvelinus fontinalis). J Fish Res Board Can, 28: 655-662.
McKim JM, Eaton JG, & Holcombe GW (1978) Metal toxicity of embryos
and larvae of eight species of freshwater fish: II. Copper. Bull
Environ Contam Toxicol, 19: 608-616.
McLachlan J (1973) Growth media -- marine. In: Stein JR ed.
Handbook of phycological methods, culture methods and growth
measurements. Cambridge, UK, Cambridge University Press, pp 25-51.
McLaren JW, Lam JWH, Berman SS, Akatsuka K, & Azeredo MA (1993)
On-line method for the analysis of sea-water for trace elements by
inductively coupled plasma mass spectrometry. J Anal At Spectrom,
8: 279-285.
McLaughlin JK, Chen JQ, Dosemeci M, Chen RA, Rexing SH, Wu Z, Hearl
FJ, McCawley MA, & Blot WJ (1992) A nested case-control study of
lung cancer among silica exposed workers in China. Br J Ind Med,
49: 167-171.
McLeese DW & Ray S (1986) Toxicity of CdCl2, CdEDTA, CuCl2, and
CuEDTA to marine invertebrates. Bull Environ Contam Toxicol, 36:
749-755.
McMaster D, McCrum E, Patterson CC, Kerr MM, O'Reilly D, Evans AE,
& Love AH (1992) Serum copper and zinc in random samples of the
population of Northern Ireland. Am J Clin Nutr, 56(2): 440-446.
McNulty HR, Anderson BS, Hunt JW, Turpen SL, & Singer MM (1994)
Age-specific toxicity of copper to larval topsmelt
Atherinops affinis. Environ Toxicol Chem, 13: 487-492.
MacRae RK, Smith DE, Swoboda-Colberg N, Meyer JS, & Bergmann HL (in
press) Copper binding affinity of rainbow trout
(Oncorhynchus mykiss) and brook trout (Salvelinus fontinalis)
gills. Environ Toxicol Chem.
Madoni P, Esteban G, & Gorbi G (1992) Acute toxicity of cadmium,
copper, mercury, and zinc to ciliates from activated sludge plants.
Bull Environ Contam Toxicol, 49: 900-905.
Madoni P, Davoli D, & Gorbi G (1994) Acute toxicity of lead,
chromium, and other heavy metals to ciliates from activated sludge
plants. Bull Environ Contam Toxicol, 53: 420-425.
Maessen O, Freedman B, & McCurdy R (1985) Metal mobilization in
home well water systems in Nova Scotia. J Am Water Works Assoc, 77:
73-80.
Maggiore G, Giacomo D, Sessa F, & Burgio GR (1987) Idiopathic
hepatic copper toxicosis in a child. J Pediatr Gastroenterol Nutr,
6: 908.
Malaisse F, Grégoire J, Brooks RR, Morrison RS, & Reeves RD (1978)
Aeolanthus biformifolius: a hyperaccumulator of copper from Zaïre.
Science, 199: 887-888.
Malaisse F, Grégoire J, Morrison RS, Brooks RR, & Reeves RD (1979)
Copper and cobalt in vegetation of Fungurume, Shaba Province,
Zaïre. Oikos, 33: 472-478.
Malea P, Haritonidis S, & Stratis I (1994) Bioaccumulation of
metals by Rhodophyta species at Antikyra Gulf (Greece) near an
aluminium factory. Bot Mar, 37: 505-513.
Malecki MR, Neuhauser EF, & Loehr RC (1982) The effect of metals on
the growth and reproduction of Eisenia foetida (Oligochaeta,
Lumbricidae). Pedobiologia, 24: 129-137.
Malhotra KM, Shukla GS, & Chandra SV (1982) Neurochemical changes
in rats coexposed to lead and copper. Arch Toxicol, 49: 331-336.
Malvankar PL & Shinde VM (1991) Ion-pair extraction and
determination of copper(II) and zinc(II) in environmental and
pharmaceutical samples. Analyst, 116: 1081-1084.
Manzler AD & Schreiner AW (1970) Copper-induced acute hemolytic
anemia: A new complication of hemodialysis. Ann Intern Med, 73:
409-412.
Marceau N & Aspin N (1973a) The intracellular distribution of the
radiocopper derived from ceruloplasmin and from albumin. Biochim
Biophys Acta, 328(2): 338-350.
Marceau N & Aspin N (1973b) The association of the copper derived
from ceruloplasmin with cytocuprein. Biochim Biophys Acta, 328(2):
351-358.
Marceau N, Aspin N, & Sass-Kortsak A (1970) Absorption of copper 64
from gastrointestinal tract of the rat. Am J Physiol, 218: 377-383.
MARCO (1989) Copper. Birmingham, UK, Market Analysis and Research
Company.
Marigomez JA, Angulo E, & Saez V (1986) Feeding and growth
responses to copper, zinc, mercury and lead in the terrestrial
gastropod Arion ater (Linne). J Molluscan Stud, 52: 68-78.
Marschner H (1986) Mineral nutrition of higher plants. New York,
London, Academic Press.
Martin NA (1986) Toxicity of pesticides to Allolobophora
caliginosa (Oligochaeta: Lumbricidae). N Z J Agric Res, 29:
699-706.
Martin TR & Holdich DM (1986) The acute lethal toxicity of heavy
metals to peracarid crustaceans (with particular reference to
fresh-water asellids and gammarids). Water Res, 20(9): 1137-1147.
Martin M, Hunt JW, Anderson BS, Turpen SL, & Palmer FH (1989)
Experimental evaluation of the mysid Holmesimysis costata as a
test organism for effluent toxicity testing. Environ Toxicol Chem,
8: 1003-1012.
Martin LA, McNemar A, & O'Brien EL (1994) Menkes kinky hair
disease. Am J Matern Child Nurs, 19(3): 162-164.
Martínez J, Soto Y, Vives-Rego J, & Bianchi M (1991)Toxicity of Cu,
Ni and alkylbenzene sulfonate (LAS) on the naturally occurring
bacteria in the Rhone river plume. Environ Toxicol Chem, 10:
641-647.
Marzin DR & Phi HV (1985) Study of the mutagenicity of metal
derivatives with Salmonella typhimurium TA 102. Mutat Res, 155:
49-51.
Mash DC, Pablo J, Flynn DD, Efange SM, & Weiner WJ (1990)
Characterization and distribution of transferrin receptors in the
rat brain. J Neurochem, 55: 1972-1979.
Masters BA, Kelly EJ, Quaife CJ, Brinster RL, & Palmiter RD (1994)
Targeted disruption of metallothionein I and II genes increases
sensitivity to cadmium. Proc Natl Acad Sci (USA), 91: 584-588.
Matejovic I & Durackova A (1994) Comparison of microwave digestion,
wet and dry mineralisation, and solubilisation of plant samples by
flow-injection isotope dilution inductively coupled plasma mass
spectrometry. Commun Soil Sci Plant Anal, 25: 1277-1288.
Mathur SP, Hamilton HA, & Levesque MP (1979) The mitigating effect
of residual fertilizer copper on the decomposition of an organic
soil in situ. Soil Sci Soc Am J, 43: 200-203.
Matsui S (1980) Evaluation of a Bacillus subtilis rec-assay for
the detection of mutagens which may occur in water environments.
Water Res, 14: 1613-1619.
Maund SJ, Taylor EJ, & Pascoe D (1992) Population responses of the
freshwater amphipod crustacean Gammarus pulex (L.) to copper.
Freshw Biol, 28: 29-36.
Mayer FL (1987) Acute toxicity handbook of chemicals to estuarine
organisms. Gulf Breeze, Florida, US Environmental Protection
Agency, Environmental Research Laboratory, 274 pp
(EPA/600/8-87/017).
Mayer FL & Ellersieck MR (1986) Manual of acute toxicity:
Interpretation and data base for 410 chemicals and 66 species of
freshwater animals. Washington, DC, US Department of Interior, Fish
and Wildlife Service, 506 pp (Resource Publication 160).
Mbofung CMF & Subbarau VV (1990) Trace element (zinc, copper, iron
and magnesium) concentrations in human placenta and their
relationship to birth weight of babies. Nutr Res, 10: 359-366.
Meador JP (1991) The interaction of pH, dissolved organic carbon,
and total copper in the determination of ionic copper and toxicity.
Aquat toxicol, 19: 13-32.
Medeiros DM, Milton A, Brunett E, & Stacy L (1991) Copper
supplementation effects on indicators of copper status and serum
cholesterol in adult males. Biol Trace Elem Res, 30(1): 1935.
Meissner W (1817) Sur la présence du cuivre dans les cendres des
végétaux. Ann Chim Phys, 4: 106.
Mercer JF, Livingston J, Hall B, Paynter JA, Begy C,
Chandrasekharappa S, Lockhart P, Grimes A, Bhave M, & Siemieniak D
(1993) Isolation of a partial candidate gene for Menkes disease by
positional cloning see comments. Nat Genet, 3: 20-25.
Mersch J, Morhain E, & Mouvet C (1993) Laboratory accumulation and
depuration of copper and cadmium in the freshwater mussel
Dreissena polymorpha and the aquatic moss
Rhynchostegium riparioides. Chemosphere, 27(8): 1475-1485.
Mesuere K & Fish W (1989) Behavior of runoff-derived metals in a
detention pond system. Water Air Soil Pollut, 47(´): 125-138.
Metaxas A & Lewis AG (1991) Copper tolerance of Skeletonema
costatum and Nitzschia thermalis. Aquat Toxicol, 19: 265-280.
Michalska AE & Choo KH (1993) Targeting and germ-line transmission
of a null mutation at the metallothionein I and II loci in mouse.
Proc Natl Acad Sci (USA), 90: 8088-8092.
Midorikawa T, Tanoue E, & Sugimura Y (1992) Interaction between
dissolved organic matter in seawater and copper. Sci Total Environ,
117/118: 499-507.
Migon C (1993) Riverine and atmospheric inputs of heavy metals to
the Ligurian Sea. Sci Total Environ, 138: 289-299.
Migon C, Morelli J, Nicolas E, & Copin-Montegut G (1991) Evaluation
of total atmospheric deposition of Pb, Cd, Cu and Zn to the
Ligurian Sea. Sci Total Environ, 105: 135-148.
Miller TG & Mackay WC (1980) The effects of hardness, alkalinity
and pH of test water on the toxicity of copper to rainbow trout
(Salmo gairdneri). Water Res, 14: 129-133.
Mills ES (1930) The treatment of idiopathic (hypochromic) anemia
with iron and copper. Can Med Assoc J, 22: 175-178.
Mills CF, Dalgarno AC, & Wenham G (1976) Biochemical and
pathological changes in tissues of Friesian cattle during the
experimental induction of copper deficiency. Br J Nutr, 35(3):
309-331.
Milne DB & Johnson PE (1993) Assessment of copper status: Effect of
age and gender on reference ranges in healthy adults. Clin Chem,
39: 883-887.
Milne DB, Johnson PE, Klevay LM, & Sandstead HH (1990) Effect of
copper intake on balance, absorption, and status indices of copper
in men. Nutr Res, 10: 975-986.
Minnich MM & McBride MB (1986) Effect of copper activity on carbon
and nitrogen mineralization in field-aged copper-enriched soils.
Plant Soil, 91: 231-240.
Mittal SR (1972) Oxyhaemoglobinuria following copper sulphate
poisoning: A case report and a review of the literature. Forensic
Sci, 1: 245-248.
Miyajima H, Nishimura Y, Mizoguchi K, Sakamota M, Shimizu T, &
Honda N (1987) Familial apoceruloplasmin deficiency associated with
blefarospasm and retinal degeneration. Neurology, 37: 761-767.
Moffett JM & Zika RG (1987) Photochemistry of copper complexes in
sea water. In: Zika RG & Cooper WJ ed. Photochemistry of
environmental aquatic systems. Washington, DC, American Chemical
Society, pp 116-131 (ACS Symposium Series No. 327).
Mohan P, Failla M, Bremner I, Arthur-Smith A, & Kerzner B (1995)
Biliary copper excretion in the neonatal rat: role of glutathione
and metallothionein. Hepatology, 21: 1051-1057.
Moore MN (1978) The distribution of dissolved copper in the eastern
Atlantic Ocean. Earth Planet Sci Lett, 41: 461.
Moore MV & Winner RW (1989) Relative sensitivity of
Ceriodaphnia dubia laboratory tests and pond communities of
zooplankton and benthos to chronic copper stress. Aquat Toxicol,
15: 311-330.
Moore PG, Rainbow PS, & Hayes E (1991) The beach-hopper
Orchestia gammarellus (Crustacea: Amphipoda) as a biomonitor for
copper and zinc: North Sea trials. Sci Total Environ, 106: 221-238.
Morgan JE & Morgan AJ (1988) Earthworms as biological monitors of
cadmium, copper, lead and zinc in metalliferous soils. Environ
Pollut, 54: 123-138.
Mori M, Hattori A, Sawaki M, Tsuzuki N, Sawada N, Oyamada M,
Sugawara N, & Enomoto K (1994) The LEC rat: a model for human
hepatitis, liver cancer, and much more. Am J Pathol, 144(1):
200-204.
Morita H, Ikeda S, Yamamoto K, Morita S, Yoshida K, Nomoto S, Kato
M, & Yanagisawa N (1995) Hereditary ceruloplasmin deficiency with
hemosiderosis: a clinicopathological study of a Japanese family.
Ann Neurol, 37(5): 646-656.
Moriya M, Ohta T, Watanabe K, Miyazawa T, Kato K, & Shirasu Y
(1983) Further mutagenicity studies on pesticides in bacterial
reversion assay systems. Mutat Res, 116: 185-216.
Morrison GMP & Florence TM (1989) Comparison of physicochemical
speciation procedures with metal toxicity to Chlorella
pyrenoidosa. Copper complexation capacity. Electroanalysis, 1:
107-112.
Moser H & Wieser W (1979) Copper and nutrition in Helix pomatia
(L.). Oecologia, 42: 241-251.
Mount DI (1968) Chronic toxicity of copper to fathead minnows
(Pimephales promelas, Rafinesque). Water Res, 2: 215-223.
Mount DI & Norberg TJ (1984) A seven-day life-cycle cladoceran
toxicity test. Environ. Toxicol Chem, 3: 425-434.
Mount DI & Stephen C (1969) Chronic toxicity of copper to fathead
minnow (Pimephales promelas) in soft water. J Fish Res Board Can,
26: 2449-2457.
Mount DR, Barth AK, Garrison TD, Barten KA, & Hockett JR (1994)
Dietary and waterborne exposure of rainbow trout
(Oncorhynchus mykiss) to copper, cadmium, lead and zinc using a
live diet. Environ Toxicol Chem, 13: 2031-2041.
Müller T, Feichtinger H, Berger H, & Müller W (1996) Endemic
Tyrolean infantile cirrhosis: an ecogenetic disorder. Lancet,
347(9005): 877-880.
Müller-Höcker J, Weiss M, & Meyer J (1987) Fatal copper storage
disease of the liver in a German infant resembling Indian childhood
cirrhosis. Virchows Arch A411: 379-385.
Müller-Höcker J, Meyer U, Wiebecke B, & Hubner G (1988) Copper
storage disease of the liver and chronic dietary copper
intoxication in two further German infants mimicking Indian
childhood cirrhosis. Pathol Res Pract, 183: 39-45.
Muñoz MJ, Carballo M, & Tarazona JV (1991) The effect of sublethal
levels of copper and cyanide on some biochemical parameters of
rainbow trout along subacute exposition. Comp Biochem Physiol,
100C: 577-582.
Murphy EA (1993) Effectiveness of flushing on reducing lead and
copper levels in school drinking water. Environ Health Perspect,
101: 240-241.
Murthy RC, Lal S, Saxena DK, Shukla GS, Ali MM, & Chandra SV (1981)
Effect of manganese and copper interaction on behavior and biogenic
amines in rats fed a 10% casein diet. Chem-Biol Interact, 37:
299-308.
Mussalo-Rauhamaa H, Salmela SS, Leppanen A, & Pyysalo H (1986)
Cigarettes as a source of some trace and heavy metals and
pesticides in man. Arch Environ Health, 41: 49-55.
Napolitano M, Gialanell G, Grossi GG, Durante M, Zhang YX, Lanzone
A, & Mancuso S (1994) Trace elements in amniotic fluid in different
physiopathologic conditions. Trace Elem Med, 11: 96-98.
Naveh Y, Hazzani A, & Berant M (1981) Copper deficiency with cow's
milk diet. Pediatrics, 68: 397-400.
Nayak NC & Ramalingaswamy V (1975) Indian childhood cirrhosis. Clin
Gastroenterol, 4: 333-339.
Nebeker AV, Cairns MA, & Wise CM (1984a) Relative sensitivity of
Chironomus tentans life stages to copper. Environ Toxicol Chem,
3: 151-158.
Nebeker AV, Savonen C, Baker RJ, & McCrady JK (1984b) Effects of
copper, nickel and zinc on the life cycle of the caddisfly
Clistoronia magnifica (Limnephilidae). Environ Toxicol Chem, 3:
645-649.
Nebeker AV, Stinchfield A, Savonen C, & Chapman GA (1986) Effects
of copper, nickel and zinc on three species of Oregon freshwater
snails. Environ Toxicol Chem, 5: 807-811.
Nectoux M & Bounias M (1988) Toxicologie du sulfate cuivrique chez
l'abeille: I. Nouveaux paramètres algébriques de létalité comme
alternative à la DL50. C R Séances Soc Biol, 182: 544-555.
Nell JA & Chvojka R (1992) The effect of bis-tributyltin oxide
(TBTO) and copper on the growth of juvenile Sydney rock oysters
Saccostrea commercialis (Iredale and Roughley) and Pacific
oysters Crassostrea gigas Thunberg. Sci Total Environ, 125:
193-201.
Nelson DA, Miller JE, & Calabrese A (1988) Effect of heavy metals
on bay scallops, surf clams, and blue mussels in acute and
long-term exposures. Arch Environ Contam Toxicol, 17: 595-600.
Nemcsók JG & Hughes GM (1988) The effect of copper sulphate on some
biochemical parameters of rainbow trout. Environ Pollut, 49: 77-85.
Neubecker TA & Allen HE (1983) The measurement of complexation
capacity and conditional stability constants for ligands in natural
waters--A review. Water Res, 17: 1-14.
Neuhauser EF, Malecki MR, & Loehr RC (1984) Growth and reproduction
of the earthworm Eisenia fetida after exposure to sublethal
concentrations of metals. Pedobiologia, 27: 89-97.
Neuhauser EF, Loehr RC, Milligan DL, & Malecki MR (1985) Toxicity
of metals to the earthworm Eisenia fetida. Biol Fertil Soils,
1: 149-152.
Neumann PZ & Sass-Kortsak A (1967) The state of copper in human
serum: evidence for an amino acid-bound fraction. J Clin Invest,
46(4): 646-658.
NFA (Australian National Food Authority) (1992) The 1992 Australian
market basket survey. Canberra, Australian Government Publishing
Service, 96 pp.
NFA (Australian National Food Authority) (1993) The 1992 Australian
market survey -- A total diet survey of pesticides and
contaminants. Canberra, Australian National Food Authority, 96 pp.
Nielsen FH, Gallagher SK, Johnson LK, & Nielsen EJ (1992) Boron
enhances and mimics some effects of estrogen therapy in
postmenopausal women. J Trace Elem Exp Med, 5: 237-246.
NIOSH (1981a) Health hazard evaluation report No. HHE-80-084-927,
General Electric Company, Lynn, Massachusetts. Springfield,
Virginia, US Department of Commerce, National Technical Information
Service (PB83-102848).
NIOSH (1981b) Health hazard evaluation report No. HHE-78-132-818,
Copper Division Southwire Company, Inc. Carrollton. Springfield,
Virginia, US Department of Commerce, National Technical Information
Service (PB82-188632).
NIOSH (1987) Manual of analytical methods, 3rd ed. Cincinnati,
Ohio, National Institute for Occupational Safety and Health (DHHS
Publication No. 84-100).
NIOSH (1993) Registry of toxic effects of chemical substances.
Cincinnati, Ohio, National Institute for Occupational Safety and
Health (Silverplatter, Chem-Bank, July 1993).
NIPHEP (1989) Integrated criteria document copper. Bilthoven, The
Netherlands, National Institute of Public Health and Environmental
Protection, 91 pp (Appendix to Report No. 758474 009).
Nishioka H (1975) Mutagenic activities of metal compounds in
bacteria. Mutat Res, 31: 185-189.
Nor YM (1987) Ecotoxicity of copper to aquatic biota: a review.
Environ Res, 43(1): 274-282.
Nor YM & Cheng HH (1986) Chemical speciation and bioavailability of
copper: uptake and accumulation by Eichornia. Environ Toxicol Chem,
5: 941-947.
Nordlind K & Liden S (1992) Patch test reactions to metal salts in
patients with oral mucosal lesions associated with amalgam
restorations. Contact Dermatitis, 27(3): 157-160.
NRC (National Research Council) (1980) Mineral tolerance of
domestic animals. Washington, DC, National Academy of Sciences.
Nriagu JO (1979a) Global inventory of natural and anthropogenic
emissions of trace metals to the atmosphere. Nature (Lond), 279:
409-411.
Nriagu JO ed. (1979b) Copper in the environment: Part 1. Ecological
cycling. New York, John Wiley & Sons Ltd, pp 43-75.
Nriagu JO (1989) A global assessment of natural sources of
atmospheric trace metals. Nature (Lond), 338: 47-49.
Odermatt A, Suter H, Krapf R, & Solioz M (1993) Primary structure
of two P-type ATPases involved in copper homeostasis in
Enterococcus hirae. J Biol Chem, 268: 12775-12779.
O'Donohue JW, Reid MA, Varghese A, Portmann B, & Williams R (1993)
Case report: Micronodular cirrhosis and acute liver failure due to
chronic copper self-intoxication. Eur J Gastroenterol Hepatol, 5:
561-562.
OECD (1995) Report of the OECD Workshop on Environmental
Hazard/Risk Assessment. Paris, Organisation for Economic
Co-operation and Development, 96 pp (OECD Environment Monographs
No.15; OCDE/GD(95)134).
Oestreicher P & Cousins RJ (1985) Copper and zinc absorption in the
rat: mechanism of mutual antagonism. J Nutr, 115: 159-166.
Ohi R & Lilly JR (1980) Copper kinetics in infantile hepatobiliary
disease. J Pediatr Surg, 15: 509-512.
Oikari A, Kukkonen J, & Virtanen V (1992) Acute toxicity of
chemicals to Daphnia magna in humic waters. Sci Total Environ,
117/118: 367-377.
Olin KL, Walter RM, & Keen CL (1994) Copper deficiency affects
selenoglutathione peroxidase and selenodeiodinase activities and
antioxidant defense in weanling rats. Am J Clin Nutr, 59: 654-658.
Olivier P & Marzin D (1987) Study of the genotoxic potential of 48
inorganic derivatives with the SOS chromotest. Mutat Res, 189:
263-269.
Olsen KB, Wang J, Setiadji R, & Lu JM (1994) Fiels screening of
chromium, zinc, copper, and lead in sediments by stripping
analysis. Environ Sci Technol, 28: 2074-2079.
OMME (1992) Air monitoring programme. Toronto, Canada, Province of
Ontario, Ministry of Environment and Energy (Unpublished data).
Omoto E & Tavassoli M (1990) Purification and partial
characterization of ceruloplasmin receptors from rat liver
endothelium. Arch Biochem Biophys, 282: 34-38.
O'Neill NC & Tanner MS (1989) Uptake of copper from brass vessels
by bovine milk and its relevance to Indian childhood cirrhosis. J
Pediatr Gastroenterol Nutr, 9: 167-172.
Oris JT, Winner RW, & Moore MV (1991) A four-day survival and
reproduction toxicity test for Ceriodaphnia dubia. Environ
Toxicol Chem, 10: 217-224.
Ortel J, Gintenreiter S, & Nopp H (1993) The effects of host metal
stress on a parasitoid in an insect/insect relationship
(Lymantria dispar L., Lymantriidae Lepid.- Glyptapanteles
liparidis Bouchè, Braconidae Hym.). Arch Environ Contam Toxicol,
24: 421-426.
Ottley CJ & Harrison RM (1993) Atmospheric dry deposition flux of
metallic species to the North Sea. Atmos Environ, 27A: 685-695.
Ouseph PP (1992) Dissolved and particulate trace metals in the
Cochin estuary. Mar Pollut Bull, 24(4): 186-192.
Overvad K, Wang DY, Olsen J, Allen DS, Thorling EB, Bulbrook RD, &
Hayward JL (1993) Copper in human mammary carcinogenesis: a
case-cohort study. Am J Epidemiol, 137: 409-414.
Owen CA Jr (1965) Metabolism of radio copper (Cu64) in the rat. Am
J Physiol, 209: 900-904.
Owen CA Jr (1982) Biochemical aspects of copper: Copper deficiency
and toxicity. In: Physiological aspects of copper. Park Ridge, New
Jersey, Noyes Publications.
Ozoh PTE (1992a) The effect of temperature and salinity on copper
body-burden and copper toxicity to Hediste (Nereis) diversicolor.
Environ Monit Assess, 21: 11-17.
Ozoh PTE (1992b) The importance of adult Hediste (Nereis)
diversicolor in managing heavy metal pollution in shores and
estuaries. Environ Monit Assess, 21: 165-171.
Ozoh PTE (1992c) The effects of salinity, temperature and sediment
on the toxicity of copper to juvenile Hediste (Nereis)
diversicolor (O.F. Muller). Environ Monit Assess, 21(1): 1-10.
Ozoh PTE (1994) The effect of salinity, temperature and time in the
accumulation and depuration of copper in ragworm, Hediste (Nereis)
diversicolor (O.F. Muller). Environ Monit Assess, 29: 155-166.
Ozoh PTE & Jones NV (1990) The effects of salinity and temperature
on the toxicity of copper to 1-day and 7-day-old larvae of Hediste
(Nereis) diversicolor (O.F. Muller). Ecotoxicol Environ Saf, 19:
24-32.
Pagenkopf GK (1983) Gill surface interaction model for trace metal
toxicity to fishes: Role of complexation, pH, and water hardness.
Environ Sci Technol, 17(6): 342-347.
Palanques A. & Diaz JI (1994) Anthropogenic heavy metal pollution
in the sediments of the Barcelona continental shelf (northwestern
Mediterranean). Mar Environ Res, 38: 17-31.
Palmiter RD (1993) Constitutive expression of metallothionein -- III
(MT-III), but not MT-I, inhibits growth when cells become zinc
deficient. Toxicol Appl Pharmacol, 135: 139-146.
Palmiter RD, Sandgren EP, Koeller DM, & Brinster RL (1993) Distal
regulatory elements from the mouse methallothionein locus stimulate
gene expression in transgenic mice. Mol Cell Biol, 13: 5266-5275.
Pandit AN & Bhave SA (1983) Copper and Indian childhood cirrhosis.
Indian Pediatr, 20: 893-899.
Pantani C, Ghetti PF, Cavacini A, & Muccioni P (1990) Acute
toxicity of equitoxic binary mixtures of some metals, surfactants
and pesticides to the freshwater amphipod Gammarus italicus
Goedm. Environ Technol, 11: 1143-1146.
Pantani C, Spreti N, Novelli AA, Ghirardini AV, & Ghetti PF (1995)
Effect of particulate matter on copper and surfactants' acute
toxicity to Echinogammarus tibaldii (Crustacea, Amphipoda).
Environ Technol, 16: 263-270.
Paoletti MG, Iovane E, & Cortese M (1988) Pedofauna bioindicators
and heavy metals in five agroecosystems in north-east Italy. Rev
Ecol Biol Sol, 25: 33-58.
Parekh SR & Patel BD (1972) Epidemiologic survey of Indian
childhood cirrhosis. Indian Pediatr, 9: 43-49.
Parmelee RW, Wentsel RS, Phillips CT, Simini M, & Checkai RT (1993)
Soil microcosm for testing the effects of chemical pollutants on
soil fauna communities and trophic structure. Environ Toxicol Chem,
12: 1477-1486.
Parrish CS & Uchrin CG (1990) Runoff-induced metals in Lakes Bay,
New Jersey. Environ Toxicol Chem, 9: 559-567.
Paulson PC, Pratt JR, & Cairns J (1983) Relationship of alkaline
stress and acute copper toxicity in the snail Goniobasis livescens
(Menke). Bull Environ Contam Toxicol, 31: 719-726.
Pedder SCJ & Maly EJ (1985) The effect of lethal copper solutions
on the behavior of rainbow trout, Salmo gairdneri. Arch Environ
Contam Toxicol, 14: 501-507.
Pennington JA, Young BE, Wilson DB, Johnson RD, & Vanderveen JE
(1986) Mineral content of food and total diets: the selected
minerals in food surveys 1982 to 1984. J Am Diet Assoc, 86(7):
876-891.
Pennington JA, Young BE, & Wilson DB (1989) Nutritional elements in
US diets: results from the total diet study, 1982 to 1986. J Am
Diet Assoc, 89(5): 659-664.
Percival SS (1995) Neutropenia caused by copper deficiency:
possible mechanisms of action. Nutr Rev, 53: 59-66.
Percival SS & Harris ED (1988) Specific binding of ceruloplasmin to
hemin-induced K562 cells. J Trace Elem Exp Med, 1: 63-70.
Percival SS & Harris ED (1990) Copper transport from ceruloplasmin:
characterization of the cellular uptake mechanism. Am J Physiol,
258C: 140-146.
Percival SS & Harris ED (1991) Regulation of Cu, Zn superoxide
dismutase with copper. Caeruloplasmin maintains levels of
functional enzyme activity during differentiation of K562 cells.
Biochem J, 274: 153-158.
Peres I & Pihan JC (1991a) Copper LC50 to Cyprinus carpio.
Influence of hardness, seasonal variation, proposition of maximum
acceptable toxicant concentration. Environ Technol, 12: 161-167.
Peres I & Pihan JC (1991b) Study of accumulation of copper by carp
(Cyprinus carpio L.) - adaptation analysis of bioconcentration by
the gills. Environ Technol, 12: 169-177.
Petering HG, Murthy L, Stemmer KL, Finelli VN, & Menden EE (1986)
Effects of copper deficiency on the cardiovascular system of the
rat. Biol Trace Elem Res, 9: 251-270.
Peterson RE & Bollier ME (1955) Spectrophotometric determination of
serum copper with biscyclohexanoeoxalyldihydrazone. Anal Chem,
27: 1195-1197.
Peterson DF, Koo SI, & Lee CC (1990) Interactive effects of dietary
(Cu) and carbohydrates on serum cholesterol (CH) and minerals.
FASEB J, 4: A534.
Petrukhin K, Fischer SG, & Pirastu M (1993) Mapping, cloning and
genetic characterisation of the region containing the Wilson
disease gene. Nat Genet, 5: 338.
Petruzzelli G, Szymura I, Lubrano L, & Cervelli S (1988) Retention
of Cu and Cd by soil influenced by different adsorbents.
Agrochimica, 32: 240-243.
Petruzzelli G, Lubrano L, Petronio BM, Gennaro MC, Vanni A, &
Liberatori A (1994) Soil sorption of heavy metals as influenced by
sewage sludge addition. J Environ Sci Health, A29: 31-50.
Pettersson R & Sandstrom B (1995) Copper. In: Oskarsson A ed. Risk
evaluation of essential trace elements: essential versus toxic
levels of intake. Copenhagen, Nordic Council of Ministers, pp
149-167 (Report NORD 1995:18).
Phelps HL, Hardy JT, Pearson WH, & Apts CW (1983) Clam burrowing
behaviour: inhibition by copper-enriched sediment. Mar Pollut Bull,
14(12): 452-455.
Phillips DJH (1977) The use of biological indicator organisms to
monitor trace metal pollution in marine and estuarine environments:
A review. Environ Pollut, 13: 281-317.
Phipps GL, Mattson VR, & Ankley GT (1995) Relative sensitivity of
three freshwater benthic macroinvertebrates to ten contaminants.
Arch Environ Contam Toxicol, 28: 281-286.
Pickering QH & Lazorchak JM (1995) Evaluation of the robustness of
the fathead minnow, Pimephales promelas, larval survival and
growth test, US EPA method 1000.0. Environ Toxicol Chem, 14(4):
653-659.
Pickering Q, Brungs W, & Gast M (1977) Effect of exposure time and
copper concentration on reproduction of the fathead minnow
(Pimephales promelas). Water Res, 11: 1079-1083.
Pimentel JC & Marques F (1969) "Vineyard sprayer's lung": a new
occupational disease. Thorax, 24: 678-688.
Pimentel JC & Menezes AP (1975) Liver granulomas containing copper
in vineyard sprayer's lung: A new etiology of hepatic
granulomatosis. Am Rev Respir Dis, 111: 189-195.
Pimentel JC & Menezes AP (1977) Liver disease in vineyard sprayers.
Gastroenterology, 72: 275-283.
Pissarek HP (1974) [Investigation of the anatomical changes in oats
and sunflower, caused by copper deficiency.] Z Pflanz Ernähr
Bodenk, 137: 224-234 (in German).
Plamenac P, Santic Z, Nikulin A, & Serdarevic H (1985) Cytologic
changes of the respiratory tract in vineyard spraying workers. Eur
J Respir Dis, 67: 50-55.
Playle RA (1997) Physiological and toxicological effects of metals
at gills of freshwater fish. In: Bergmann HL & Dorward-King EJ ed.
Reassessment of metals criteria for aquatic life protection
-- Priorities for research and implementation: Proceedings of the
Pelleston Workshop on Reassessment of Metals Criteria for Aquatic
Life Protection, Pensacola, Florida, 10-14 February 1996, pp
101-105 (SETAC Technical Publication Series).
Playle RC, Gensemer RW, & Dixon DG (1992) Copper accumulation on
gills of fathead minnows: influence of water hardness, complexation
and pH of the gill micro-environment. Environ Toxicol Chem, 11:
381-391.
Playle RA, Dixon DG, & Burnison K (1993a) Copper and cadmium
binding to fish gills: modification by dissolved organic carbon and
synthetic ligands. Can J Fish Aquat Sci, 50: 2667-2677.
Playle RA, Dixon DG, & Burnison K (1993b) Copper and cadmium
binding to fish gills: estimates of metal-gill stability constants
and modelling of metal accumulation. Can J Fish Aquat Sci, 50:
2678-2687.
Pocino M, Malavé I, & Baute L (1990) Zinc administration restores
the impaired immune response observed in mice receiving excess
copper by oral route. Immunopharmacol Immunotoxicol, 12: 697-713.
Pocino M, Baute L, & Malave I (1991) Influence of the oral
administration of excess copper on the immune response. Fundam Appl
Toxicol, 16: 249-256.
Pradhan AM, Talbot IC, & Tanner MS (1983) Indian childhood
cirrhosis and other cirrhosis of Indian children. Pediatr Res, 17:
435-438.
Prasad AS, Brewer GJ, Schoomaker EB, Rabbani P (1978) Hypocupremia
induced by zinc therapy. J Am Med Assoc, 1978: 2166-2168.
Prasad MPR, Krishna TP, Pasricha S, Krishnaswamy K, & Quereshi MA
(1992) Esophageal cancer and diet a case-control study. Nutr
Cancer, 18: 85-93.
Pratt WB, Omdahl JL, & Sorenson JRJ (1985) Lack of effects of
copper gluconate supplementation. Am J Clin Nutr, 42: 681-682.
Prins HW & Van den Hamer CJ (1981) Comparative studies of copper
metabolism in liver and kidney of normal and mutated brindled mice
-- with special emphasis on metallothionein. Comp Biochem Physiol,
C70(2): 255-260.
Prohaska JR & Failla ML (1993) Copper and immunity In: Klurfeld DM
ed. Human nutrition: A comprehensive treatise -- Volume 8.
Nutrition and immunology. New York, Plenum Press, pp 309-332.
Prohaska JR, Bailey WR, & Cox DA (1985) Failure of iron injection
to reverse copper dependent anemia in mice. In: Mills CF, Bremner
I, & Chesters JK ed. Trace elements in man and animals. Slough,
Bucks, UK, Commonwealth Agricultural Bureau, pp 27-32.
Prothro MY (1993) Guidance on interpretation and implementation of
aquatic life metals criteria. Washington, DC, US Environmental
Protection Agency, Office of Water Policy and Technical Guidance.
Punsar S, Erametese O, Karvonen MJ, Ryahanen A, Hilska P, & Vornamo
H (1975) A search in two Finnish male cohorts for epidemiologic
evidence of a water factor. J Chron Dis, 28: 259-287.
Rad MR, Kirchrath L, & Hollenberg CP (1994) A putative p-type
cu2+-transporting atpase gene on chromosome II of saccharomyces
cerevisiae. Yeast, 10: 1217-1225.
Ragan HA, Natch S, Lee GR, Bishop CR, & Cartwright GE (1969) Effect
of ceruloplasmin on plasma iron in copper deficient swine. Am J
Physiol, 217: 1320-1323.
Rahimi A & Bussler W (1973) [Physiological conditions for the
development of copper deficiency symptoms.] Z Pflanz Bodenk,
136: 25-32 (in German).
Rahimi A & Bussler W (1974) [Copper deficiency in higher plants and
its histochemical detection.] Landwirtsch Forsch Sonderh, 30:
101-111 (in German).
Rainbow PS (1988) The significance of trace metal requirements in
decapods. Symp Zool Soc Lond, 59: 291-313.
Rainbow PS & Abdennour C (1989) Copper and hemocyanin in the
mesopelagic decapod crustacean Systellaspis debilis. Oceanol
Acta, 12(1): 91-94.
Rainbow PS & White SL (1989) Comparative strategies of heavy metal
accumulation by crustaceans: zinc, copper and cadmium in a decapod,
an amphipod and a barnacle. Hydrobiologia, 174: 245-262.
Rainbow PS, Moore PG, & Watson D (1989) Talitrid amphipods
(Crustacea) as biomonitors for copper and zinc. Estuar Coast Shelf
Sci, 28: 567-582.
Rajalekshmi P & Mohandas A (1993) Effect of heavy metals on tissue
glycogen levels in the freshwater mussel, Lamellidens corrianus
(Lea). Sci Total Environ, 1: 617-630.
Rand GM & Petrocelli SR (1985) Fundamentals of aquatic toxicology.
New York, Hemisphere Publishing Corporation, 666 pp.
Räsänen L, Hattula ML, & Arstila AU (1977) The mutagenicity of MCPA
and its soil metabolites, chlorinated phenols, catechols and some
widely used slimicides in Finland. Bull Environ Contam Toxicol, 18:
565-571.
Rauser WE & Winterhalder EK (1985) Evaluation of copper, nickel,
and zinc tolerances in four grass species. Can J Bot, 63: 58-63.
Redpath KJ & Davenport J (1988) The effect of copper, zinc and
cadmium on the pumping rate of Mytilus edulis L. Aquat Toxicol,
13(3): 217-226.
Reed RH & Moffat L (1983) Copper toxicity and copper tolerance in
Enteromorpha compressa (L.) Grev. J Exp Mar Biol Ecol, 69(1):
85-103.
Rehwoldt R, Menapace LW, Nerrie B, & Alessandrello D (1972) The
effect of increased temperature upon the acute toxicity of some
heavy metal ions. Bull Environ Contam Toxicol, 8: 91-96.
Rehwoldt R, Lasko L, Shaw C, & Wirhowski E (1973) The acute
toxicity of some heavy metal ions toward benthic organisms. Bull
Environ Contam Toxicol, 10: 291-294.
Reilly A & Reilly C (1973) Copper-induced chlorosis in Becium
homblei (De Wild) Duvign. and Plancke. Plant Soil, 38: 671-674.
Reilly C (1967) Accumulation of copper by some Zambian plants.
Nature (Lond), 215: 667-668.
Reiser S, Smith JC, Mertz W, Holbrook JT, Scholfield DJ, Powell AS,
Canfield WK, & Canary JJ (1985) Indices in copper status in humans
consuming a typical American diet containing either fructose or
starch. Am J Clin Nutr, 42 242-251.
Reiser S, Powell A, Yang C-Y, & Canary JJ (1987) Effect of copper
intake on blood cholesterol and its lipoprotein distribution in
men. Nutr Rep Int, 36(3): 641-649.
Remoudaki E, Bergametti G, & Losno R (1991) On the dynamic of the
atmospheric input of copper and manganese into the western
Mediterranean Sea. Atmos Environ, 25A: 733-744.
Reunanen A, Knekt P, & Aaran RK (1992) Serum ceruloplasmin level
and the risk of myocardial infarction and stroke. Am J Epidemiol,
136: 1082-1090.
Reuther W & Smith PF (1952) Iron chlorosis in Florida citrus groves
in relation to certain soil constituents. Proc Fla State Hortic
Soc, 65: 62-69.
Reuther W & Smith PF (1953) Effects of high copper content of sandy
soil on growth of citrus seedlings. Soil Sci, 75: 219-224.
Richmond J, Strehlow CD, & Chalkley SR (1993) Dietary intake of Al,
Ca, Cu, Fe, Pb, and Zn in infants. Br J Biomed Sci, 50: 178-186.
Ringwood AH (1992) Comparative sensitivity of gametes and early
developmental stages of a sea urchin species (Echinometra mathaei)
and a bivalve species (Isognomon californicum) during metal
exposures. Arch Environ Contam Toxicol, 22: 288-295.
Ritchie HD, Luecke RW, Baltzer BV, Miller ER, Ullrey DE, & Hoefer
JA (1963) Copper and zinc interrelationships in the pig. J Nutr,
79: 117-123.
Robbins CT (1983) Wildlife feeding and nutrition. New York, London,
Academic Press, 343 pp.
Robbins KR & Baker DH (1980) Effect of sulfur amino acid level and
source on the performance of chicks fed high levels of copper.
Poult Sci, 59: 1246-1253.
Robson AD & Reuter DJ (1981) Diagnosis of copper deficiency and
toxicity. In: Loneragan JF, Robson AD, & Graham RD ed. Copper in
soils and plants: Proceedings of the Golden Jubilee International
Symposium, Murdoch University, Perth, Western Australia. London,
New York, Sydney, Academic Press, pp 287-312.
Rodriguez A, Soto G, Torres S, Venegas G, & Castillo-Duran C (1985)
Zinc and copper in hair and plasma of children with chronic
diarrhea. Acta Paediatr Scand, 74: 770-774.
Rogers JE & Li SW (1985) Effect of metals and other inorganic ions
on soil microbial activity: soil dehydrogenase assay as a simple
toxicity test. Bull Environ Contam Toxicol, 34: 858-865.
Román DA & Rivera L (1992) The behaviour of a Cu (II) ion selective
electrode in seawater; copper consumption capacity and copper
determinations. Mar Chem, 38: 165-184.
Romo-Kröger CM & Llona F (1993) A case of atmospheric contamination
at the slopes of the Los Andes mountain range. Atmos Environ, 27A:
401-404.
Romo-Kröger CM, Morales JR, Dinator MI, Llona F, & Eaton LC (1994)
Heavy metals in the atmosphere coming from a copper smelter in
Chile. Atmos Environ, 28: 705-711.
Rose GA & Parker GH (1983) Metal content of body tissues, diet
items, and dung of ruffed grouse near the copper-nickel smelters at
Sudbury, Ont. Can J Zool, 61: 505-511.
Rowe DW, McGoodwin EB, Martin GR, & Gahn D (1977) Decreased
lysyloxidase activity in aneurysm-rione, mottled mouse. J Biol
Chem, 252: 939-942.
Rucker RB, Parker HE, & Rogler JC (1969) Effect of copper
deficiency on chick bone collagen and selected bone enzymes. J
Nutr, 98: 57-63.
Ruiz R, Romero F, & Besga G (1991) Selective solubilization of
heavy metals in torrential river sediments. Toxicol Environ Chem,
33: 1-6.
Ruoling C & Mengxuan H (1990) A cohort study of cancer mortality in
copper miners. In Sakurai H ed. Occupational epidemiology.
Amsterdam, Elsevier Science Publishers BV, Biomedical Division, pp
75-78.
Saari JT & Johnson WT (1990) Time course of hematocrit and heart
weight changes in dietary copper deficiency. FASEB J, 4: A391.
Sahoo DK, Kar RN, & Das RP (1992) Bioaccumulation of heavy metal
ions by Bacillus circulans. Bioresour Technol, 41: 177-179.
Salim S, Farquharson J, Arneil GC, Cockburn F, Forbes GI, Logan RW,
Sherlock JC, & Wilson TS (1986) Dietary copper intake in
artificially fed infants. Arch Dis Child, 61(11): 1068-1075.
Salomons W & Eagle AM (1990) Hydrology, sedimentology and the fate
and distribution of copper in mine-related discharges in the Fly
River system, Papua New Guinea. Sci Total Environ, 97/98: 315-334.
Salonen JT, Salonen R, Korpela H, Suntioinen S, & Tuomilehto J
(1991) Serum copper and the risk of acute myocardial infarction: A
prospective population study in men in Eastern Finland. Am J
Epidemiol, 134: 268-276.
Samanidou V & Fytianos K (1990) Mobilization of heavy metals from
river sediments of northern Greece by complexing agents. Water Air
Soil Pollut, 52: 217-225.
Samanidou V, Papadoyannis I, & Vasilikiotis G (1991) Mobilization
of heavy metals from river sediments of northern Greece, by humic
substances. J Environ Sci Health, A26: 1055-1068.
Sanders JR & McGrath SP (1988) Experimental measurements and
computer predictions of copper complex formation by soluble soil
organic matter. Environ Pollut, 49: 63-76.
Sarzeau A (1830) Sur la présence du cuivre dans les végétaux et
dans le sang. J. Pharm Sci Accessoires, 16: 505-518.
Sato M & Bremner I (1984) Biliary excretion of metallothionein and
a possible degradation product in rats injected with copper and
zinc. Biochem J, 223: 475-479.
Saward D, Stirling A, & Topping G (1975) Experimental studies on
the effects of copper on a marine food chain. Mar Biol, 29:
351-361.
Sayer MDJ, Reader JP, & Morris R (1989) The effect of calcium
concentration on the toxicity of copper, lead and zinc to yolk-sac
fry of brown trout, Salmo trutta L., in soft, acid water. J Fish
Biol, 35: 323-332.
Scanferlato VS & Cairns J (1990) Effect of sediment-associated
copper on ecological structure and function of aquatic microcosms.
Aquat Toxicol, 18: 23-34.
Scarano G, Morelli E, Seritti A, & Zirino A (1990) Determination of
copper in seawater by anodic stripping voltammetry using
ethylenediamine. Anal Chem, 62: 943-948.
Schafer EW Jr & Bowles WA Jr (1985) Acute oral toxicity and
repellency of 933 chemicals to house and deer mice. Arch Environ
Contam Toxicol, 14: 111-129.
Schäfer H, Wenzel A, Fritsche U, Röderer G, & Traunspurger W (1993)
Long-term effects of selected xenobiotica on freshwater green
algae: development of a flow-through test system. Sci Total
Environ, 1(suppl): 735-740.
Schäfer H, Hettler H, Fritsche U, Pitzen G, Roderer G, & Wenzel A
(1994) Biotests using unicellular algae and ciliates for predicting
long-term effects of toxicants. Ecotoxicol Environ Saf, 27: 64-81.
Schecher WD & McAvoy DC (1992) MINEQL+: a software environment for
chemical equilibrium modeling. Comput Environ Urban Syst, 16: 65-76
Scheinberg IH & Sternlieb I (1994) Is non-Indian childhood
cirrhosis caused by excess dietary copper? Lancet, 344: 1002-1004.
Schiatz EH (1949) Metal fume fever produced by copper dust. In:
Proceedings of 9th International Congress on Industrial Medicine,
London, 13-17 September 1948. Bristol, UK, John Wright & Sons, pp
798-801.
Schilsky ML & Sternlieb I (1993) Animal models of copper toxicosis.
Adv Vet Sci Comp Med, 37: 357-377.
Schilsky ML (1994) Identification of the Wilson's gene: clues for
disease pathogenesis and the potential for molecular diagnosis.
Hepatology, 20: 529.
Schilsky ML, Scheinberg IH, & Sternlieb I (1991) Prognosis of
Wilsonian chronic active hepatitis. Gastroenterology, 100: 762.
Schilsky ML, Scheinberg IH, & Sternlieb I (1994a) Liver
transplantation for Wilson's disease: indications and outcome.
Hepatology, 9: 583.
Schilsky ML, Stockert RJ, & Sternlieb I (1994b) Pleiotropic effect
of the LEC mutation: a rodent model of Wilson's disease. Am J
Physiol, 266: G907.
Schimmelpfennig W, Dieter HH, & Tabert M (1996) Cirrhosis of the
liver in early childhood and copper content of drinking and well
water, respectively: Multi-centric retrospective clinical study on
frequency, distribution and etiology in Germany. Berlin, Institute
for Water, Soil and Air Hygiene of the Federal Environmental Agency
of Germany.
Schmidt JM (1988) Determination of the toxic limit concentration
and the 50% inhibitory concentration of sodium chloride, copper
sulfate, dodecylhydrogensulfate-sodium salt and calcium cyanamide
on the primary root seeds of Lupius albus and Cier aretinum. Z
Wasser Abwasser Forch, 21: 107-109.
Schmitt CJ & Brumbaugh WG (1990) National contaminant biomonitoring
program: Concentrations of arsenic, cadmium, copper, lead, mercury,
selenium, and zinc in US freshwater fish, 1976-1984. Arch Environ
Contam Toxicol, 19: 731-747.
Schock MR & Neff CH (1988) Trace metal contamination from brass
fittings. J Am Water Works Assoc, 7: 47-56.
Schoenemann HM, Failla ML, & Steele NC (1990) Consequences of
severe copper deficiency are independent of dietary carbohydrate in
young pigs. Am J Clin Nutr, 52: 147-154.
Schramel P, Müller-Höcker J, Meyer U, Wei M, & Eife R (1988)
Nutritional copper intoxication in three German infants with severe
liver cell damage (features of Indian childhood cirrhosis). J Trace
Elem Electrolytes Health Dis, 2: 85-89.
Schrauzer GN, White DA, & Schneider CJ (1977) Cancer mortality
correlation studies: IV: Associations with dietary intakes and
blood levels of certain trace elements, notably Seantagonists.
Bioinorg Chem, 7: 35-56.
Schreiber DR, Gordon AS, & Millero FJ (1985) The toxicity of copper
to the marine bacterium Vibrio alginolyticus. Can J Microbiol,
31: 83-87.
Schroeder WH, Dobson M, Kane DM, & Johnson ND (1987) Toxic trace
elements associated with airborne particulate matter: A review. J
Air Pollut Control Assoc, 37: 1267-1285.
Schubauer-Berigan MK, Dierkes JR, Monson PD & Ankley GT (1993)
pH-dependent toxicity of Cd, Cu, Ni and Zn to Ceriodaphnia dubia,
Pimephales promelas, Hyalella azteca and Lumbriculus
variegatus. Environ Toxicol Chem, 12: 1261-1266.
Schubert WK & Lahey ME (1959) Copper and protein depletion
complicating hypoferic anemia of infancy. Pediatrics, 24: 710-733.
Schultz CL & Hutchinson TC (1988) Evidence against a key role for
metallothionein-like protein in the copper tolerance mechanism of
Deschampsia cespitosa (L) Beauv. New Phytol, 110(2): 163-171.
Scott J, Gollan JL, Samourian S, & Sherlock S (1978) Wilson's
disease, presenting as chronic active hepatitis. Gastroenterology,
74(4): 645-651.
Scudder BC, Carter JL, & Leland HV (1988) Effects of copper on
development of the fathead minnow, Pimephales promelas
Rafinesque. Aquat Toxicol, 12: 107-124.
Scudlark JR, Conko KM, & Church TM (1994) Atmospheric wet
deposition of trace elements to Chesapeake Bay: CBAD study year 1
results. Atmos Environ, 28: 1487-1498.
Seim WK, Curtis LR, Glenn SW, & Chapman GA (1984) Growth and
survival of developing steelhead trout (Salmo gairdneri)
continuously or intermittently exposed to copper. Can J Fish Aquat
Sci, 41: 433-438.
Sela M, Tel-Or E, Fritz E, & Huttermann A (1988) Localization and
toxic effects of cadmium, copper, and uranium in Azolla. Plant
Physiol, 88: 30-36.
Semple AB, Parry WH, & Phillips DE (1960) Acute copper poisoning:
An outbreak traced to contaminated water from a corroded geyser.
Lancet, 2: 700-701.
Sethi S, Grover S, & Khodaskar MB (1993) Role of copper in Indian
childhood cirrhosis. Ann Trop Paediatr, 13: 3-6.
Shacklette HT & Boerngen JG (1984) Element concentrations in soils
and other surficial materials of the conterminous United States.
Washington, DC, US Geological Survey, 105 pp (US Geological Survey
Professional Paper No. 1270).
Shanaman JE (1972) Report of one year chronic oral toxicity of
copper gluconate (W10219A) in beagle dogs. Morris Plains, New
Jersey, Warner Lambert Research Institute (Report No. 955-0353).
Shanaman JE, Wazeter FX, & Goldenthal EI (1972) One-year chronic
oral toxicity of copper gluconate, W/02/09A, in beagle dogs. Morris
Plains, New Jersey, Warner-Lambert Research Institute (Research
Report No. 955-0353).
Shaner SW & Knight AW (1985) The role of alkalinity in the
mortality of Daphnia magna in bioassays of sediment-bound copper.
Comp Biochem Physiol, 82C: 273-277.
Shanmukhappa H & Neelakantan K (1990) Influence of humic acid on
the toxicity of copper, cadmium and lead to the unicellular alga,
Synechosystis aquatilis. Bull Environ Contam Toxicol, 44:
840-843.
Sharda B & Bhandari B (1984) Copper concentration in plasma, cells,
liver, urine, hair and nails in hepalobiliary disorders in
children. Indian Pediatr, 21: 167-171.
Sharma VK & Millero FJ (1988) Oxidation of copper(I) in seawater.
Environ Sci Technol, 22: 768-771.
Shaw JCL (1992) Copper deficiency in term and preterm infants. In:
Formon SJ & Zlotkin S ed. Nutritional anaemias. New York, Raven
Press Ltd, pp 105-119 (Nestlé Nutrition Workshop Series, Volume
30).
Shenkin A, Fraser WD, Mclelland JD, Fell GS, & Garden OJ (1987)
Maintenance of vitamin and trace element status in intravenous
nutrition using a complete nutritive mixture. J Parenter Enter
Nutr, 11(3): 238-242.
Shibu MP, Balchand AN, & Nambisan PNK (1990) Trace metal speciation
in a tropical estuary -- significance of environmental factors. Sci
Total Environ, 97/98: 267-287.
Shike M, Roulet M, Kurian R, Whitwell J, Stewart S, & Jeejeebhoy KN
(1981) Copper metabolism and requirements in total parental
nutrition. Gastroenterology, 81: 290-297.
Shiller AM & Boyle EA (1987) Variability of dissolved trace of
metals in the Mississippi River. Geochim Cosmochim Acta, 51:
3273-3277.
Sideris EG, Charalambous SC, Tsolomyty A, & Katsaros N (1988)
Mutagenesis, carcinogenesis and the metal elements -- DNA
interaction. Prog Clin Biol Res, 259: 13-25.
Silverberg BA, Stokes PM, & Ferstenberg LB (1976) Intranuclear
complexes in copper tolerant green algae. J Cell Biol, 69: 210-214.
Sinha S & Chandra P (1990) Removal of Cu and Cd from water by
Bacopa monnieri L. Water Air Soil Pollut, 51: 271-276.
Skornik WA & Brain JD (1983) Relative toxicity of inhaled metal
sulfate salts for pulmonary macrophages. Am Rev Respir Dis, 128:
297-303.
Slooff W, Cleven RFMJ, Janus JA, & Ros JPM (1989) Integrated
criteria document copper. Bilthoven, The Netherlands, National
Institute of Public Health and Environmental Protection, 147 pp
(Report No. 758474009).
Small M, Germaini MS, Small AM, Zoller WH, & Moyers JL (1981)
Airborne plume study of emissions from the processing of copper
ores in southeastern Arizona. Environ Sci Technol, 15: 293-299.
Smith CH & Bidlack WR (1980) Interrelationships of dietary ascorbic
acid and iron on the tissue distribution of ascorbic acid, iron and
copper in female guinea-pigs. J Nutr, 110: 1398-1408.
Smith MJ & Heath AG (1979) Acute toxicity of copper, chromate,
zinc, and cyanide to freshwater fish: effect of different
temperatures. Bull Environ Contam Toxicol, 22: 113-119.
Smith GJ & Rongstad OJ (1982) Small mammal heavy metal
concentrations from mined and control sites. Environ Pollut, 28A:
121-134.
Smith JD, Jordan RM, & Nelson ML (1975) Tolerance of ponies to high
levels of dietary copper. J Anim Sci, 41: 1645-1649.
Smith KL, Hann AC, & Harwood JL (1986) The subcellular localization
of absorbed copper in Fucus. Physiol Plant, 66(4): 692-698.
Smyth HF, Carpenter CP, Weil CS, Pozzani UC, Striegel JA, & Nycum
JS (1969) Range-finding toxicity data: list VII. Am Ind Hyg Assoc
J, 30: 470-476.
Snell TW & Persoone G (1989a) Acute toxicity bioassays using
rotifers: I. A test for brackish and marine environments with
Brachionus plicatilis. Aquat Toxicol, 14: 65-80.
Snell TW & Persoone G (1989b) Acute toxicity bioassays using
rotifers: II. A freshwater test with Brachionus rubens. Aquat
Toxicol, 14: 81-92.
Snell TW, Moffat BD, Janssen C, & Persoone G (1991) Acute toxicity
tests using rotifers: IV. Effects of cyst age, temperature, and
salinity on the sensitivity of Branchionus calyciflorus.
Ecotoxicol Environ Saf, 21: 308-317.
Soares HMVM, Teresa M, & Vasconcelos SD (1994) Study of the
lability of copper(II)-fulvic acid complexes by ion selective
electrodes and potentiometric stripping analysis. Anal Chim Acta,
293: 261-270.
Solioz M, Odermatt A, & Krapf R (1994) Copper pumping ATPases:
common concepts in bacteria and man. FEBS Lett, 346: 44-47.
Solomons NW (1979) On the assessment of zinc and copper nutriture
in man. Am J Clin Nutr, 32: 856-871.
Sorenson JRJ (1989) Copper complexes offer a physiological approach
to the treatment of chronic diseases. Prog Med Chem, 26: 437-568.
Sosnowski SL, Germond DJ, & Gentile JH (1979) The effect of
nutrition on the response of field populations of the calanoid
copepod Acartia tonsa to copper. Water Res, 13: 449-452.
Spitalny KC, Brondum J, Vogt RL, Sargent HE, & Kappel S (1984)
Drinking-water-induced copper intoxication in a Vermont family.
Pediatrics, 74: 1103-1106.
Spurgeon DJ, Hopkin SP, & Jones DT (1994) Effects of cadmium,
copper, lead and zinc on growth, reproduction and survival of the
earthworm Eisenia fetida (Savigny): Assessing the environmental
impact of point-source metal contamination in terrestrial
ecosystems. Environ Pollut, 84: 123-130.
Srivastava AK, Gupta BN, Bihari V, Mathur N, Gaur JS, Mahendra PN,
Kumar P, & Bharti RS (1992) Clinical studies in workers engaged in
maintenance of watermark moulds in a paper mill. Int Arch Occup
Environ Health, 64: 141-145.
Stack T, Aggett PJ, Aitken E, & Lloyd DJ (1990) Routine L-ascorbic
acid supplementation does not alter iron, copper, and zinc balance
in low-birth-weight infants fed a cow's milk formula. J Pediatr
Gastroenterol Nutr, 10: 351-356.
Stauber JL (1995) Toxicity testing using marine and freshwater
unicellular algae. Australasian J Ecotoxicol, 1: 15-24.
Stauber JL & Florence TM (1985a) The influence of iron on copper
toxicity to the marine diatom, Nitzchia closterium (Ehrenberg) W.
Smith. Aquat Toxicol, 6: 297-305.
Stauber JL & Florence TM (1985b) Interactions of copper and
manganese: a mechanism by which manganese alleviates copper
toxicity to the marine diatom, Nitzchia closterium (Ehrenberg) W.
Smith. Aquat Toxicol, 7: 241-254.
Stauber JL & Florence TM (1987) Mechanism of toxicity of ionic
copper and copper complexes to algae. Mar Biol, 94: 511-519.
Steele CW (1989) Effects of sublethal exposure to copper on diel
activity of sea catfish, Arius felis. Hydrobiologia, 178:
135-141.
Stein RS, Jenkins D, & Korns ME (1976) Death after use of cupric
sulfate as emetic. J Am Med Assoc, 235: 801.
Steinkuhler C, Sapora O, Carri MT, Nagel W, Marcocci L, Ciriolo MR,
Weser U, & Rotilio G (1991) Increase of Cu, Zn-superoxide dismutase
activity during differentiation of human K562 cells involves
activation by copper of a constantly expressed copper-deficient
protein. J Biol Chem, 266: 24580-24587.
Stenhammar L (1979) [Copper poisoning: A differential diagnosis of
diarrhoea in children.] Lakartidningen, 76(30-31): 2618-2620 (in
Swedish).
Stephenson RR (1983) Effects of water hardness, water temperature,
and size of the test organism on the susceptibility of the
freshwater shrimp, Gammarus pulex (L.) to toxicants. Bull Environ
Contam Toxicol, 31: 459-466.
Stephenson MD & Leonard GH (1994) Evidence for the decline of
silver and lead and the increase of copper from 1977 to 1990 in the
coastal marine waters.
Stern RV & Frieden E (1993) Partial purification of the rat
erythrocyte ceruloplasmin receptor monitored by an electrophoresis
mobility shift assay. Anal Biochem, 212: 221-228.
Sternlieb I (1980) Copper and the liver. Gastroenterology, 78:
1615-1628.
Sternlieb I (1990) Perspectives on Wilson's disease. Hepatology,
12: 1234.
Sternlieb I (1993) The outlook for the diagnosis of Wilson's
disease. J Hepatol, 17: 263.
Stevens MD, DiSilvestro RA, & Harris ED (1984) Specific receptor
for ceruloplasmin in membrane fragments from aortic and heart
tissues. Biochemistry, 23: 261-266.
Stevenson FJ (1986) Cycles of soil: Carbon, nitrogen, phosphorus,
sulfur, micronutrients. New York, John Wiley & Sons Ltd.
Stewart C, Norton DA, & Fergusson JE (1991) Historical monitoring
of heavy metals in kahikatea ring wood in Christchurch, New
Zealand. Sci Total Environ, 105: 171-190.
Stiff MJ (1971) The chemical states of copper in polluted fresh
water and a scheme of analysis to differential them. Water Res, 5:
585-599.
Stoner GD, Shimkin MB, Troxell MC, Thompson TL, Terry LS (1976)
Test for carcinogenicity of metallic compounds by the pulmonary
tumour response in strain A mice. Cancer Res, 36: 1744-1747.
Stouthart XJHX, Haans JLM, Lock RAC, & Wendelaar Bonga SE (1996)
Effects of water pH on copper toxicity to early life stages of the
common carp (Cyprinus carpio). Environ Toxicol Chem, 15(3):
376-383.
Strain WH, Hershey CO, McInnes S, Breslau D, Hershey LA, McKinney
BM, Varnes AW, & Khourey CJ (1984) Hazards to groundwater from acid
rain. Trace Subst Environ Health, 18: 178-184.
Streit B (1984) Effects of high copper concentrations on soil
invertebrates (earthworms and oribatid mites): experimental results
and a model. Oecologia, 64: 381-388.
Stromgren T & Nielsen MV (1991) Spawning frequency, growth and
mortality of Mytilus edulis larvae, exposed to copper and diesel
oil. Aquat Toxicol, 21: 171-180.
Sturgeon P & Brubaker C (1956) Copper deficiency in infants. Am J
Dis Child, 92: 254-265.
Suciu I, Prodan L, Lazar V, Ilea E, Cocîrla A, Olinici L, Paduraru
A, Zagreanu O, Lengyel P, Gyrffi L, & Andru D (1981) Research on
copper poisoning. Med Lav, 3: 190-197.
Sunda WG & Guillard RRL (1976) Relationship between cupric ion
activity and toxicity of copper to phytoplankton. J Mar Res, 34:
511-529.
Suttle NF & Mills CF (1966) Studies of the toxicity of copper to
pigs. I. Effects of oral supplements of zinc and iron salts on the
development of copper toxicosis. Br J Nutr, 20: 135-149.
Sutton AM, Harvie A, Cockburn A, Farquharson J, & Logan RW (1985)
Copper deficiency in the preterm infant of very low birth weight:
four cases and a reference range for plasma copper. Arch Dis Child,
60(7): 644-651.
Suzuki N, Iwata Y, & Imura H (1987) Determination of several trace
metals in seaweed by neutron activation analysis after
diethydithiocarbamate extraction and polystyrene-foam collection.
Int J Environ Anal Chem, 30: 289-297.
Sweet CW, Vermette SJ, & Landsberger S (1993) Sources of toxic
trace elements in urban air in Illinois. Environ Sci Technol, 27:
2502-2510.
Symeonidis L, McNeilly T, & Bradshaw AD (1985) Differential
tolerance of three cultivars of Agrostis capillaris L. to cadmium,
copper, lead, nickel and zinc. New Phytol, 101: 309-315.
Tachibana K (1952) Pathological transition and functional
vicissitude of liver during formation of cirrhosis by copper.
Nagoya J Med Sci, 15: 108-114.
Taggart DPP, Shenkin A, & Fell GS (1986) Observations on serum
iron, zinc, copper, and magnesium in intravenously fed patients
with chronic sepsis. Clin Nutr, 5: 139-144.
Tan WT, Tan GS, & Khan ISAN (1988) Solubilities of trace copper and
lead species and the complexing capacity of river water in the
Linggi River Basin. Environ Pollut, 52: 221-235.
Tanaka Y, Hatano S, Nishi Y, & Usui T (1980) Nutritional copper
deficiency in a Japanese infant on formula. J Pediatr, 96: 255-257.
Tanner MS, Postmann B, Mowat AP, Williams B, Pandit A, Mills C, &
Bremner I (1979) Increased hepatic copper concentration in Indian
Childhood cirrhosis. Lancet, 1: 1203-1205.
Tanner MS, Kantarjian AH, Bhave SA, & Pandit AN (1983) Early
introduction of copper-contaminated animal milk feeds as a possible
cause of Indian childhood cirrhosis. Lancet, 2: 992-995.
Tanner MS, Bhave SA, Pradhan AM, & Pandit AN (1987) Clinical trials
of penicillamine in Indian childhood liver cirrhosis. Arch Dis
Childh, 62: 118-124.
Tanzi RE, Petrukhin K, & Cherov I (1993) The Wilson gene is a
copper transporting ATPase with homology to the Menkes disease
gene. Nat Genet, 5: 344.
Tavassoli M, Kishimoto T, & Kataoka M (1986) Liver endothelium
mediates the hepatocyte's uptake of ceruloplasmin. J Cell Biol,
102: 1298-1303.
Taylor GJ & Crowder AA (1984) Copper and nickel tolerance in
Typha latifolia clones from contaminated and uncontaminated
environments. Can J Bot, 62: 1304-1308.
Taylor GJ & Foy CD (1985) Differential uptake and toxicity of ionic
and chelated copper in Triticum aestivum. Can J Bot, 63:
1271-1275.
Taylor D, Maddock BG, & Mance G (1985) The acute toxicity of nine
'grey list' metals (arsenic, boron, chromium, copper, lead, nickel,
tin, vanadium and zinc) to two marine fish species: dab
(Limanda limanda) and grey mullet (Chelon labrosus). Aquat
Toxicol, 7: 135-144.
Taylor EJ, Maund SJ, & Pascoe D (1991) Toxicity of four common
pollutants to the freshwater macroinvertebrates Chironomus
riparius Meigen (Insecta: Diptera) and Gammarus pulex (L.)
(Crustacea: Amphipoda). Arch Environ Contam Toxicol, 21: 371-376.
Thiel H & Finck A (1973) [Determination of limiting values of
optimum copper supply of oat and barley plants.] Z Pflanz Bodenk,
134: 107-125 (in German).
Thomas GR, Forbes JR, Roberts EA, Walshe JM, & Cox DW (1995) The
Wilson disease gene -- spectrum of mutations and their
consequences. Nat Genet, 9: 210-217.
Thompson JJ & Houk RS (1986) Inductively coupled plasma mass
spectrometric detection for multielement flow injection analysis
and elemental speciation by reversed-phase liquid chromatography.
Anal Chem, 58: 2541-2548.
Thorn JM, Aggett PJ, Delves HT, & Clayton BE (1978) Mineral and
trace metal supplement for use with synthetic diets based on
comminuted chicken. Arch Dis Child, 53(12): 931-938.
Thornalley PJ & Vasak M (1985) Possible role for metallothionein in
protection against radiation-induced oxidative stress. Kinetics and
mechanism of its reaction with superoxide and hydroxyl radicals.
Biochim Biophys Acta, 827(1): 36-44.
Tijero J, Guardiola E, Mirada F, & Cortijo M (1991) Effect of
Cu2+, Ni2+ and Zn2+ on an anaerobic digestion system. J Environ
Sci Health, 26: 799-811.
Timmermans KR & Walker PA (1989) The fate of trace metals during
the metamorphosis of chironomids (Diptera, Chironomidae). Environ
Pollut, 62: 73-85.
Tinker D, Romero-Chapman N, Reiser K, Hyde D, & Rucker C (1990)
Elastin metabolism during recovery from impaired cross-linking
formation. Arch Biochem Biophys, 278: 326-332.
Tinwell H & Ashby J (1990) Inactivity of copper sulphate in a mouse
bone-marrow micronucleus assay. Mutat Res, 245: 223-226.
Tomlin C ed. (1994) A world compendium -- The pesticide manual,
incorporating the agrochemicals handbook. London, Crop Protection
Publications.
Town RM & Powell HKJ (1993) Ion-selective electrode potentiometric
studies on the complexation of copper(II) by soil-derived humic
acid and fulvic acid. Anal Chim Acta, 279: 221-233.
Tubbing DMJ, Admiraal W, & Katako A (1995) Successive changes in
bacterioplankton communities in the River Rhine after copper
additions. Environ Toxicol Chem, 14(9): 1507-1512.
Tuddenham WM & Dougall PA (1978) Copper. In: Kirk-Othmer
encyclopedia of chemical technology, 3rd ed. New York, John Wiley
& Sons Ltd, pp 819-869.
Turnlund JR, Swanson CA, & King JC (1983) Copper absorption and
retention in pregnant women fed diets based on animal and plant
proteins. J Nutr, 113: 2346-2352.
Turnlund JR, King JC, Keyes WR, Gong B, & Michel MC (1984) A stable
isotope study of zinc absorption in young men: effects of phytate
and alpha-cellulose. Am J Clin Nutr, 40: 1071-1077
Turnlund JR, Keyes WR, Anderson HL, & Acord LL (1989) Copper
absorption and retention in young men at three levels of dietary
copper by use of the stable isotope 65Cu. Am J Clin Nutr, 49:
870-878.
Turnlund JR, Keens CL, & Smith RG (1990) Copper status and urinary
and salivary copper in young men at three levels of dietary copper.
Am J Clin Nutr, 51: 658-664.
Turnlund JR, Keyes WR, Hudson CA, Betschart AA, Kretsch MJ, &
Sauberlich HE (1991) A stable-isotope study of zinc, copper, and
iron absorption and retention by young women fed vitamin
B-6-deficient diets. Am J Clin Nutr, 54: 1059-1064.
Tyler LD & McBride MB (1982) Mobility and extractability of
cadmium, copper, nickel, and zinc in organic and mineral soil
columns. Soil Sci, 134: 198-205.
Tyrala EE (1986) Zinc and copper balances in preterm infants.
Pediatrics, 77: 513-517.
Uauy R, Castillo-Duran C, Fisberg M, Fernandez N, & Valenzuela A
(1985) Red cell superoxide dismutase activity as an index of human
copper nutrition. J Nutr, 115: 1650-1655.
Underwood EJ (1977) Trace elements in human and animal nutrition,
4th ed. New York, London, Academic Press, 545 pp.
Ünlü E & Gümgüm B (1993) Concentrations of copper and zinc in fish
and sediments from the Tigris River in Turkey. Chemosphere, 26(11):
2055-2061.
US EPA (1984) Ambient water quality criteria for copper.
Washington, DC, US Environmental Protection Agency, 84 pp (EPA
440/5-84-031).
US EPA (1986) Test methods for evaluating solid waste, 3rd ed.
Washington, DC, US Environmental Protection Agency, Office of Solid
Waste (Report SW-846).
US EPA (1991) Maximum contaminant levels, goals and national
primary drinking-water regulations for lead and copper, final rule.
Fed Reg, 56: 110.
US EPA (1992) Interim guidance on interpretation and implementation
of aquatic life criteria for metals. Washington, DC, US
Environmental Protection Agency.
US EPA (1995) Sampling ambient water for trace metals at EPA water
quality criteria levels: Method 1669. Washington, DC, US
Environmental Protection Agency.
V-Balogh K (1988) Heavy metal pollution from a point source
demonstrated by mussel (Unio pictorum L.) at Lake Balaton,
Hungary. Bull Environ Contam Toxicol, 41: 910-914.
Van Campen DR & Mitchell EA (1965) Absorption of Cu64, Zn65, Mo99,
and Fe59 from ligated segments of the rat gastrointestinal tract.
J Nutr, 86: 120-124.
Van den Berg CMG (1984) Organic and inorganic speciation of copper
in the Irish Sea. Mar Chem, 14: 201-212.
Van den Berg GJ & Beynen AC (1992) Influence of ascorbic acid
supplementation on copper metabolism in rats. Br J Nutr, 68:
701-715.
Van den Berg CMG, Nimmo M, Daly P, & Turner DR (1990) Effects of
the detection window on the determination of organic copper
speciation in estuarine waters. Anal Chim Acta, 232: 149-159.
Van den Berg GJ, Yu S, Lemmens AG, & Beynen AC (1994) Ascorbic acid
feeding of rats reduces copper absorption, causing impaired copper
status and depressed biliary copper excretion. Biol Trace Elem Res,
41: 47-58.
Van Gestel CAM, Van Dis WA, Van Breemen EM, & Sparenburg PM (1989)
Development of a standardized reproduction toxicity test with the
earthworm species Eisenia fetida Andrei using copper,
pentachlorophenol, and 2,4-dichloroaniline. Ecotoxicol Environ Saf,
18: 305-312.
Van Gestel CAM, Van Dis WA, Dirven-van Breemen EM, Sparenburg PM,
& Baerselman R (1991) Influence of cadmium, copper, and
pentachlorophenol on growth and sexual development of Eisenia
Andrei (Oligochaeta; Annelida). Biol Fertil Soils, 12: 117-121.
van Leeuwen CJ, Büchner JL, & van Dijk H (1988) Intermittent flow
system for population toxicity studies demonstrated with Daphnia
and copper. Bull Environ Contam Toxicol, 40: 496-502.
van Tilborg WJM (1996) 'A further look at zinc' refuted. The
Netherlands, VTBC, 107 pp (Report No. 9601).
Vardia HK, Rao PS, & Durve VS (1988) Effect of copper, cadmium and
zinc on fish-food organisms, Daphnia lumholtzi and
Cypris subglobosa. Proc Indian Acad Sci (Anim Sci), 97(2):
175-180.
Venugopal B & Luckey TD (1978) Metal toxicity in mammals -- 2. New
York, Plenum Press.
Vermeiren K, Vandecasteele C, & Dams R (1990) Determination of
trace amounts of cadmium, lead, copper and zinc in natural waters
by inductively coupled plasma atomic emission spectrometry with
thermospray nebulisation, after enrichment on Chelex-100. Analyst,
115: 17-22.
Verriopoulos G & Dimas S (1988) Combined toxicity of copper,
cadmium, zinc, lead, nickel, and chrome to the copepod Tisbe
holothuriae. Bull Environ Contam Toxicol, 41: 378-384.
Verweij W, Glazewski R, & DeHaan H (1992) Speciation of copper in
relation to its bioavailability. Chem Speciation Bioavailab, 4:
43-52
Viarengo A, Canesi L, Pertica M, Poli G, Moore MN, & Orunesu M
(1990) Heavy metal effects on lipid peroxidation in the tissues of
Mytilus galloprovincialis Lam. Comp Biochem Physiol, 97C(1):
37-42.
Viksna A, Mwiruki G, Jagner D, & Selin E (1995) Intercomparison
between energy-dispersive X-ray fluorescence and stripping
potentiometry for the determination of copper levels in human
serum. X-Ray Spectrom, 24: 76-80.
Viren JR & Silvers A (1994) Unit risk estimates for airborne
arsenic exposure: an updated view based on recent data from two
copper smelter cohorts. Regul Toxicol Pharmacol, 20: 125-138.
Visviki I & Rachlin JW (1991) The toxic action and interactions of
copper and cadmium to the marine alga Dunaliella minuta, in both
acute and chronic exposure. Arch Environ Contam Toxicol, 20:
271-275.
Visviki I & Rachlin JW (1994a) Acute and chronic exposure of
Dunaliella salina and Chlamydomonas bullosa to copper and
cadmium: Effects on growth. Arch Environ Contam Toxicol, 26:
149-153.
Visviki I & Rachlin JW (1994b) Acute and chronic exposure of
Dunaliella salina and Chlamydomonas bullosa to copper and
cadmium: Effects on ultrastructure. Arch Environ Contam Toxicol,
26: 154-162.
Vogt G & Quinitio ET (1994) Accumulation and excretion of metal
granules in the prawn, Penaeus monodon, exposed to water-borne
copper, lead, iron and calcium. Aquat Toxicol, 28: 223-241.
Vohra P, Gray GA, & Kratzer FH (1965) Phytic acid-metal complexes.
Proc Soc Exp Biol Med, 120: 447-449.
Vollkopf U & Barnes K (1995) Rapid multielement analysis of urine.
At Spectrosc, 1995: 19-21.
Vranken G, Tiré C, & Heip C (1988) The toxicity of paired metal
mixtures to the nematode Monhystera disjuncta (Bastian, 1865).
Mar Environ Res, 26: 161-179.
Vulpe C, Levinson B, Whitney S, Packman S, & Gitschier J (1993)
Isolation of a candidate gene for Menkes disease and evidence that
it encodes a copper-transporting ATPase. Nat Genet, 3(1): 7-13
(erratum in Nat Genet, 3(3):273).
Wainwright SJ & Woolhouse HW (1977) Some physiological aspects of
copper and zinc tolerance in Agrostis tenuis Sibth.: Cell
elongation and membrane damage. J Exp Bot, 28: 1029-1036.
Waldrop GL & Ettinger MJ (1990) The relationship of excess copper
accumulation by fibroblasts from the brindled mouse model of Menkes
disease to the primary defect. Biochem J, 267: 417-422.
Walker-Smith J & Blomfield J (1973) Wilson's disease or chronic
copper poisoning? Arch Dis Child, 48: 476-479.
Walsh LH, Erhardt WH, & Seibel HD (1972) Copper toxicity in
snapbeans (Phaseolus vulgaris L.). J Environ Qual, 1: 197-200.
Walsh FM, Crosson FJ, Bayley M, McReynolds J, & Pearson BJ (1977)
Acute copper intoxication: Pathophysiology and therapy with a case
report. Am J Dis Child, 131: 149-151.
Walshe JM (1995) Copper: Not too little, not too much, but just
right. J R Coll Phys (Lond), 29: 280-287
Wapnir RA & Balkman C (1992) Intestinal absorption of copper:
influence of carbohydrates. Biochem Med Metab Biol, 47: 47-53.
Wapnir RA & Lee SY (1993) Dietary regulation of copper absorption
and storage in rats: Effects of sodium, zinc and histidine-zinc. J
Am Coll Nutr, 12: 714-719.
Ward GM & Nagy JG (1976) Molybdenum and copper in Colorado forages,
molybdenum toxicity in deer, and copper supplementation in cattle.
In: Chappel WR & Petersen KK ed. Molybdenum in the environment:
Volume 1. The biology of molybdenum. New York, Marcel Dekker, Inc.,
pp 97-113.
Watton AJ & Hawkes HA (1984) The acute toxicity of ammonia and
copper to the gastropod Potamopyrgus jenkinsi (Smith). Environ
Pollut, A36: 7-29.
Weant GE (1985) Sources of copper air emissions. Research Triangle
Park, North Carolina, US Environmental Protection Agency, Air and
Energy Engineering Research Laboratory (EPA 600/2-85-046).
Weeks JM (1992a) The Talitrid amphipod (Crustacea)
Platorchestia platensis as a biomonitor of trace metals (Cu and
Zn) in Danish waters. In: Bjornestad E, Hagerman L, & Jensen K ed.
Proceedings of the 12th Baltic Marine Biologists Symposium,
Helsingor, Denmark, 25-30 August 1991. Fredensborg, Olsen & Olsen,
pp 173-178.
Weeks JM (1992b) Copper-rich granules in the ventral caeca of
Talitrid amphipods (Crustacea; Amphipoda: Talitridae). Ophelia, 36:
119-133.
Weeks JM (1993) Effects of dietary copper and zinc concentrations
on feeding rates of two species of Talitrid amphipods (Crustacea).
Bull Environ Contam Toxicol, 50: 883-890.
Weeks JM & Rainbow PS (1991) The uptake and accumulation of zinc
and copper from solution by two species of Talitrid amphipods
(Crustacea). J Mar Biol Assoc (UK), 71: 811-826.
Weeks JM & Rainbow PS (1993) The relative importance of food and
seawater as sources of copper and zinc to Talitrid amphipods
(crustacea; Amphipoda; Talitridae. J Appl Ecol, 30: 722-735.
Weeks JM, Rainbow PS, & Moore PG (1992) The loss, uptake and tissue
distribution of copper and zinc during the moult cycle in an
ecological series of Talitrid amphipods (Crustacea: Amphipoda).
Hydrobiologia, 245: 15-25.
Weeks JM, Jensen FB, & Depledge MH (1993) Acid-base status,
haemolymph composition and tissue copper accumulation in the shore
crab Carcinus maenas exposed to combined copper and salinity
stress. Mar Ecol Prog Ser, 97: 91-98.
Weiss M, Müller-Höcker J, Wiebecke B, & Belohradsky BH (1989) First
description of Indian childhood cirrhosis in a non-Indian infant in
Europe. Acta Paediatr Scand, 79: 152-156.
Welsh PG, Skidmore JF, Spry DJ, Dixon DG, Hutchinson NJ, & Hickie
BE (1993) Effect of pH and dissolved organic carbon on the toxicity
of copper to larval fathead minnow (Pimephales promelas) in
natural lake waters of law alkalinity. Can J Fish Aquat Sci, 50:
1356-1362.
Wharton DC & Rader M (1970) Rapid spectrophotometric method for
determination of micro amounts of copper in proteins. Anal Biochem,
33(2): 226-229.
White SL & Rainbow PS (1985) On the metabolic requirements for
copper and zinc in molluscs and crustaceans. Mar Environ Res, 16:
215-229.
WHO (1982) Evaluation of certain food additives and contaminants.
Twenty-sixth report of the Joint FAO/WHO Expert Committee on Food
Additives. Geneva, World Health Organization, pp 31-32 (WHO
Technical Report Series, No. 683).
WHO (1990) In: Akre J ed. Infant feeding -- the physiological
basis. Supplement to Volume 67 of WHO Bulletin, 1989. Geneva, World
Health Organization, pp 68-84.
WHO (1993) Guidelines for drinking-water quality, 2nd ed. Volume 1:
Recommendations. Geneva, World Health Organization, p 46.
WHO (1996) Copper. In: Trace elements in human nutrition and
health. Geneva, World Health Organization, chapter 7, pp 123-143.
Widdowson EM & Dickerson JWT (1964) Chemical composition of the
body. In: Comar CL & Bronner F ed. Mineral metabolism. New York,
Academic Press, vol 2, chapter 17, p 1247.
Widdowson EM, Dauncey J, & Shaw JCL (1974) Trace elements in fetal
and early postnatal development. Proc Nutr Soc, 33: 275-284.
Wieser W, Busch G, & Büchel L (1976) Isopods as indicators of the
copper content of soil and litter. Oecologia, 23: 107-114.
Williams DM (1982) Clinical significance of copper deficiency and
toxicity in the world population. In: Prasad AS ed. A clinical,
biochemical and nutritional aspects of trace elements. New York,
Alan R. Lyss, pp 277-299.
Williams DM (1983) Copper deficiency in humans. Semin Hematol,
20: 118-128.
Wilson SAK (1912) Progressive lenticular degeneration: A familial
nervous disease associated with cirrhosis of the liver. Brain,
34: 295-509.
Wilson P, Cooke M, Cawley J, Giles L, & West M (1995) Comparison of
the determination of copper, nickel and zinc in contaminated soils
by X-ray fluorescence spectrometry and inductively coupled plasma
spectrometry. X-Ray Spectrom, 24: 103-108.
Windom HL, Byrd JT, Smith RG Jr, & Huan F (1991) Inadequacy of
NASQAN data for assessing metal trends in the nation's river.
Environ Sci Technol, 25(6): 1137-1142.
Winge DR & Mehra RK (1990) Host defenses against copper toxicity.
Int Rev Exp Pathol, 31: 47-83.
Winner RA (1984) The toxicity and bioaccumulation of cadmium and
copper as affected by humic acid. Aquat Toxicol, 5: 267-274.
Winner RW (1985) Bioaccumulation and toxicity of copper as affected
by interactions between humic acid and water hardness. Water Res,
19(4): 449-455.
Winner RW & Farrell MP (1976) Acute and chronic toxicity of copper
to four species of Daphnia. J Fish Res Board Can, 33: 1685-1691.
Winner RW & Owen HA (1991a) Seasonal variability in the sensitivity
of freshwater phytoplankton communities to a chronic copper stress.
Aquat Toxicol, 19: 73-88.
Winner RW & Owen HA (1991b) Toxicity of copper to
Chlamydomonas reinhardtii (Chlorophyceae) and
Ceriodaphnia dubia (Crustacea) in relation to changes in water
chemistry of a freshwater pond. Aquat Toxicol, 21: 157-170.
Winner RW, Owen HA, & Moore MV (1990) Seasonal variability in the
sensitivity of freshwater lentic communities to a chronic copper
stress. Aquat Toxicol, 17: 75-92.
Wirth PL & Linder MC (1985) Distribution of copper among multiple
components of human serum. J Natl Cancer Inst, 75: 277-284.
Wong PK (1988) Mutagenicity of heavy metals. Bull Environ Contam
Toxicol, 40: 597-603.
Wong CK (1992) Effects of chromium, copper, nickel, and zinc on
survival and feeding of the cladoceran Moina macrocopa. Bull
Environ Contam Toxicol, 49: 593-599.
Wong MH & Bradshaw AD (1982) A comparison of the toxicity of heavy
metals, using root elongation of rye grass, Lolium perenne. New
Phytol, 91: 255-261.
Wong PK & Chang L (1991) Effects of copper, chromium and nickel on
growth, photosynthesis and chlorophyll a synthesis of
Chlorella pyrenoidosa 251. Environ Pollut, 72: 127-139.
Wong PK, Lam KC, & So CM (1993a) Removal and recovery of Cu(II)
from industrial effluent by immobilized cells of Pseudomonas putida
II-11. Appl Microbiol Biotechnol, 39: 127-131.
Wong CK, Chu KH, Tang KW, Tan TW, & Wong LJ (1993b) Effects of
chromium, copper and nickel on survival and feeding behaviour of
Metapenaeus ensis larvae and postlarvae (Decapoda: Penaeidae).
Mar Environ Res, 36: 63-78.
Wong YS, Lam EKH, & Tam NFY (1994) Physiological effects of copper
treatment and its uptake pattern in Festuca rubra cv. Merlin.
Resour Conserv Recycl, 11(1-4): 311-319
Wood AM (1983) Available copper ligands and the apparent
bioavailability of copper to natural phytoplankton assemblages. Sci
Total Environ, 28: 51-64.
Wood CM (1992) Flux measurements as indices of H+ and metal
effects on freshwater fish. Aquat Toxicol, 22: 239-264
Woolhouse HW (1983) Toxicity and tolerance in the responses of
plants to metals Chapter 7. In: Lange OC, Nobel PS, Osmond CB, &
Ziegler H ed. Encyclopedia of plant physiology. New York, Basel,
Springer-Verlag, chapter 7, pp 245-300.
Wu L & Bradshaw AD (1972) Aerial pollution and the rapid evolution
of copper tolerance. Nature (Lond), 238: 167-169.
Wu L & Kruckeberg AL (1985) Copper tolerance in two legume species
from a copper mine habitat. New Phytol, 99: 565-570.
Wu L & Lin S-L (1990) Copper tolerance and copper uptake of Lotus
purshianus (Benth.) Clem. & Clem. and its symbiotic Rhizobium loti
derived from a copper mine waste population. New Phytol, 116:
531-539.
Wu ZY, Han M, Lin ZC, & Ondov JM (1994) Chesapeake Bay atmospheric
deposition study, year 1: sources and dry deposition of selected
elements in aerosol particles. Atmos Environ, 28(8): 1471-1486.
Wurtsbaugh WA & Horne AJ (1982) Effects of copper on nitrogen
fixation and growth of blue-green algae in natural plankton
associations. Can J Fish Aquat Sci, 39: 1636-1641.
Wyllie J (1957) Copper poisoning at a cocktail party. Am J Public
Health, 47: 617.
Yang FM, Friedrichs WE, Cupples RL, Bonifacio MJ, Sanford JA,
Horton WA, & Bowman BH (1990) Human ceruloplasmin. Tissue-specific
expression of transcripts produced by alternative splicing. J Biol
Chem, 265: 10780-10785.
Yeowell HN, Marshall MK, Walker LC, Ha V, & Pinnell SR (1994)
Regulation of lysyl oxidase mRNA in dermal fibroblasts from normal
donors and patients with inherited connective tissue disorders.
Arch Biochem Biophys, 308: 299-305.
Yip R, Reeves JD, Lönnerdal B, Keen CL, & Dallman PR (1985) Does
iron supplementation compromise zinc nutrition in healthy infants?
Am J Clin Nutr, 42: 683-687.
Zabowski D & Zasoski RJ (1987) Cadmium, copper, and zinc adsorption
by a forest soil in the presence of sludge leachate. Water Air Soil
Pollut, 36: 103-113.
Zak B (1958) Simple procedure for the single sample determination
of serum copper and iron. Clin Chim Acta, 3: 328-334.
Zhang M & Florence TM (1987) A novel adsorbent for the
determination of the toxic fraction of copper in natural waters.
Anal Chim Acta, 197: 137-148.
Zhou P & Theil DJ (1991) Isolation of a metal-activated
transcription factor gene from Candida glabrata by complementation
in Saccharomyces cervisiae. Proc Natl Acad Sci (USA), 88:
6112-6116.
Zia S & Alikhan MA (1989) Copper uptake and regulation in a
copper-tolerant decapod Cambarus bartoni (Fabricius) (Decapoda,
Crustacea). Bull Environ Contam Toxicol, 42: 103-110.
Zidar BL, Shadduck RK, Zeigler Z, & Winkelstein A (1977)
Observation of the anemia and neutropenia of human copper
deficiency. Am J Hematol, 3: 177-185.
Zitko V & Carson WG (1976) A mechanism of the effects of water
hardness on the lethality of heavy metals to fish. Chemosphere, 5:
299-303.
Zoller WH, Gladney ES, & Duce RA (1974) Atmospheric concentrations
and sources of trace metals at the South Pole. Science, 183:
198-200.
Zou E & Bu S (1994) Acute toxicity of copper, cadmium, and zinc to
the water flea, Moina irrasa (Cladocera). Bull Environ Contam
Toxicol, 52: 742-748.
Zucker SD & Gollan JL (1996) Wilson's disease and hepatic copper
toxicosis. In: Zakin D & Boyer T ed. Hepatology: A textbook of
liver disease. Philadelphia, Pennsylvania, Saunders.
Zwozdziak J, Zwozdziak A, Matyniak Z, & Lisowski A (1985)
Atmospheric sulphate formation in the vicinity of a copper smelter.
Sci Total Environ, 46: 95-106.
RÉSUMÉ ET CONCLUSIONS
1. Résumé
1.1 Identité, propriétés physiques et chimiques
Le cuivre est un métal ductile et malléable, de couleur brun
rougeâtre. Il appartient au groupe IB de la Classification
périodique. Il est généralement présent dans l'environnement au
degré d'oxydation +2 mais peut également exister au degré 0,
c'est-à-dire à l'état métallique, ainsi qu'aux degrés +1 et +3.A
l'état naturel, il se présente sous la forme de sels minéraux et de
composés organiques très divers ou encore sous forme métallique. Le
métal est à peine soluble dans l'eau et les solutions salines ou
légèrement acides mais il est dissous par l'acide nitrique et
l'acide sulfurique ainsi que par les solutions basiques d'hydroxyde
ou de carbonate d'ammonium.
Le cuivre présente une forte conductivité électrique et
thermique et il est résistant à la corrosion.
1.2 Méthodes d'analyse
La grande diversité des dérivés du cuivre, qu'ils soient
minéraux ou organiques, a conduit à la mise au point de tout un
arsenal de techniques d'échantillonnage, de préparation et
d'analyse en vue du dosage de cet élément dans les échantillons
biologiques ou ceux qui proviennent de l'environnement. Il est
essentiel de mettre en oeuvre des techniques "propres" car la
contamination des échantillons par du cuivre provenant de l'air, de
la poussière, des récipients ou des réactifs est une source
importante d'erreurs d'analyse.
Le dosage colorimétrique ou gravimétrique du cuivre est bon
marché et d'exécution simple. Son intérêt se limite cependant aux
cas où il n'est pas essentiel d'avoir une sensibilité extrêmement
élevée. Pour doser de faibles concentrations de cuivre dans des
matrices diverses, on fait le plus souvent appel à la
spectrophotométrie d'absorption atomique. En opérant par la même
méthode mais avec un four à électrodes de graphite, le gain de
sensibilité est considérable par rapport à la spectrophotométrie de
flamme. En fonction du traitement préalable subi par l'échantillon
ainsi que des techniques de séparation et de concentration
utilisées, la limite de détection dans l'eau atteint environ 1
µg/litre par absorption atomique avec électrodes de graphite
(GF-AAS) et 20 µg/litre par absorption atomique classique; on a pu
aller jusqu'à 0,05-0,2 µg/g de tissu biologique par GF-AAS. On peut
parvenir à une sensibilité encore meilleure en ayant recours à des
techniques d'émission comme par exemple le plasma d'argon à
couplage inductif associé à la spectroscopie d'émission atomique ou
à la spectrométrie de masse. Il existe encore d'autres méthodes
comme la fluorescence X, l'utilisation d'électrodes à membrane
sélective ou la voltampérométrie avec redissolution anodique ou
cathodique.
1.3 Sources d'exposition humaine et environnementale
Parmi les sources d'exposition au cuivre on peut citer la
poussière soulevée par le vent, les volcans, les végétaux en
décomposition, les feux de forêt et les embruns marins. Parmi les
sources d'émission anthropogéniques, on compte les fours de fusion,
les fonderies de fonte, les centrales thermiques ainsi que les
sources de combustion telles que les installations municipales
d'incinération. Les rejets de cuivre dans le sol proviennent
essentiellement des résidus et terres de recouvrement des
exploitations minières et des boues d'égouts. Les produits
agricoles à base de cuivre représentent 2% des rejets de cuivre
dans le sol.
L'extraction, la fusion et le raffinage des minerais de cuivre
débouchent sur la fabrication d'un grand nombre de produits
industriels et commerciaux. Le cuivre est très utilisé pour la
fabrication d'ustensiles de cuisine, dans les réseaux de
distribution d'eau, ainsi que sous la forme d'engrais, de
bactéricides, d'algicides et de peintures antisalissures. Il sert
également à la préparation d'additifs pour l'alimentation des
bestiaux et de produits favorisant la croissance, et il entre dans
la composition de substances permettant de lutter contre les
maladies du bétail et de la volaille. Dans l'industrie, on
l'utilise comme activateur pour la flottation des minerais
sulfurés, pour la production d'agents de protection du bois, en
galvanoplastie, dans la fabrication des colorants azoïques, comme
mordant pour les colorants des tissus, dans le raffinage du pétrole
et enfin pour la préparation de composés divers.
1.4 Transport, distribution et transformation dans l'environnement
Le cuivre est libéré dans l'atmosphère en association avec des
particules de matière. Il s'élimine par gravité, dépôt à sec,
lessivage et entraînement par les précipitations. La vitesse
d'élimination et la distance parcourue depuis la source dépendent
des caractéristiques de cette dernière, de la granulométrie des
particules et de la vitesse du vent.
Le lessivage naturel du sol par les intempéries et les
décharges provenant de l'industrie et des stations d'épuration sont
à l'origine du cuivre présent dans l'eau. Il est également possible
que des composés cupriques soient volontairement introduits dans
l'eau pour détruire les algues. Le devenir du cuivre dans le milieu
aquatique est tributaire d'un certain nombre de processus. Il
s'agit notamment de la formation de complexes, de la sorption par
des oxydes métalliques hydratés, des argiles et des substances
organiques ou encore de la bioaccumulation. La connaissance de la
forme physicochimique sous laquelle se trouve le cuivre (l'espèce
chimique en cause) apporte plus de renseignements que la
concentration totale de l'élément. Une grande partie du cuivre
rejeté dans l'eau se trouve sous forme particulaire et il a
tendance à se déposer, à précipiter ou à s'adsorber à des matières
organiques, à des oxydes de fer et de manganèse hydratés ou aux
argiles présents dans les sédiments ou dans la couche aqueuse.
Dans l'environnement aquatique, la concentration du cuivre dépend
de facteurs tels que la dureté et l'alcalinité de l'eau, sa force
ionique, son pH et son potentiel redox, la présence de substances
complexantes, de matières en suspension et de carbone et enfin, des
interactions entre l'eau et les sédiments.
C'est dans le sol que le cuivre est rejeté en majeure partie;
les sources principales en sont les exploitations minières,
l'agriculture et les déchets solides ou les boues provenant des
stations d'épuration. La plus grande partie du cuivre déposé dans
le sol est fortement adsorbée et demeure dans les premiers
centimètres de la couche supérieure. Le cuivre s'adsorbe aux
matières organiques, aux carbonates, aux argiles ainsi qu'aux
oxydes hydratés de fer et de manganèse. C'est dans les sols sableux
acides que le lessivage est le plus important. Dans l'environnement
terrestre, un certain nombre de facteurs importants conditionnent
le devenir du cuivre. Il s'agit notamment de la nature du sol
lui-même, de la présence d'oxydes, du potentiel redox, des surfaces
porteuses de charges électriques, des matières organiques et des
échanges de cations.
Il peut y avoir bioaccumulation du cuivre présent dans
l'environnement s'il est biologiquement disponible. La valeur du
facteur de bioaccumulation varie beaucoup d'un organisme à l'autre,
mais il a tendance à être plus élevé en cas d'exposition à de
faibles concentrations. Par accumulation, il peut arriver que
certains animaux (par exemple, les bivalves) ou certaines plantes
terrestres (comme celles qui poussent sur des sols contaminés) se
chargent d'une quantité exceptionnellement élevée de cuivre.
Néanmoins, de nombreux organismes sont capables de réguler leur
concentration totale de cuivre.
1.5 Concentrations dans l'environnement et exposition humaine
La concentration du cuivre dans l'air d'un site est liée à la
proximité de sources polluantes importantes comme les fours, les
centrales électriques et les installations d'incinération. Le
cuivre étant un élément naturel, il est largement disséminé dans
l'eau. Il faut cependant être prudent lorsqu'on cherche à
interpréter la teneur en cuivre d'un environnement aquatique donné.
En effet, dans un système aquatique, la quantité de cuivre qui est
mesurée correspond généralement soit au cuivre total, soit au
cuivre dissous, ce dernier étant plus représentatif de la
biodisponibilité du métal.
En milieu rural, la concentration moyenne de fond dans l'air
va de 5 à 50 ng/m3. Dans les zones non contaminées, la
concentration est de 0,15 µg/litre dans l'eau de mer et de 1 à 20
µg/litre dans l'eau douce. Les sédiments constituent un important
réservoir et milieu récepteur pour le cuivre. La concentration de
fond dans les sédiments naturels en eau douce va de 16 à 5000 mg/kg
de poids sec. Dans les sédiments marins, la teneur en cuivre va de
2 à 740 mg/kg de poids sec. En milieu dépourvu d'oxygène, le cuivre
présent dans les sédiments est fortement lié sous la forme de
sulfure et il n'est donc
pas biodisponible. Dans des sols non contaminés, on a relevé une
concentration médiane en cuivre de 30 mg/kg (limites: 2-250 mg/kg).
Le cuivre s'accumule dans les végétaux, les invertébrés et les
poissons. La teneur de divers organismes en cuivre est plus élevée
dans les zones contaminées que dans celles qui ne le sont pas.
Chez les personnes en bonne santé qui ne sont pas soumis à une
exposition professionnelle, la principale voie d'exposition est la
voie buccale. L'apport journalier moyen par l'alimentation est de
0,9 à 2,2 mg pour un adulte. La plupart des études montrent que
dans la majorité des cas, cet apport est voisin de l'extrémité
inférieure de la fourchette. Les variations que l'on peut constater
traduisent la diversité des habitudes alimentaires et des pratiques
agricoles ou culinaires de par le monde. Parfois, l'eau de boisson
peut contribuer de façon substantielle à l'apport journalier total
de cuivre, en particulier dans les habitations dont la tuyauterie
est au contact d'une eau corrosive. Dans les habitations dont la
tuyauterie n'est pas en cuivre ou qui ne sont pas alimentées par
une eau corrosive, l'apport de cuivre par l'eau de boisson ne
dépasse que rarement 0,1 mg/jour, alors que si l'eau distribuée est
corrosive, cet apport peut excéder plusieurs mg par jour. En
général, l'apport journalier total par la voie buccale
(alimentation et eau de boisson) se situe entre 1 et 2 mg par jour,
avec des pointes occasionnelles à plus de 5 mg/jour. L'apport de
cuivre par les autres voies (respiratoire ou percutanée) est
négligeable par rapport à la voie buccale. L'inhalation de
poussières et de fumée ajoute quelque 0,3-2,0 mg de Cu par jour.
Les femmes qui portent des DIU en cuivre ne sont exposées de ce
fait qu'à un apport supplémentaire de 80 µg au maximum.
1.6 Cinétique et métabolisme chez les animaux de
laboratoire et l'Homme
L'homéostase du cuivre est liée à la dualité du cuivre,
élément à la fois essentiel et toxique. Son caractère essentiel
tient au fait qu'il intervient dans un grand nombre de protéines,
tant comme élément structural que comme catalyseur. Les mêmes
processus cellulaires de fixation et d'incorporation dans les
protéines ainsi que les sorties de cuivre se retrouvent chez tous
les mammifères et sont modulés par le métal lui-même.
Le cuivre est principalement absorbé dans les voies
digestives. Le taux de résorption du cuivre alimentaire est de 20
à 60%, le reste étant excrété dans les matières fécales. Après être
passé à travers la membrane basolatérale, le cuivre se fixe à
l'albumine qui le transporte jusqu'au foie. Cet organe joue un rôle
déterminant dans l'homéostase du cuivre. Le cuivre se répartit
ensuite en deux fractions, l'une qui est excrétée par la bile, et
l'autre qui est incorporée aux protéines intra- et
extracellulaires. La bile constitue la principale voie d'excrétion.
Le transport du cuivre vers les tissus périphériques est assuré par
l'albumine plasmatique, la céruléoplasmine et des complexes de
faible masse moléculaire.
Parmi les méthodes utilisées pour étudier l'homéostase du
cuivre chez les mammifères figurent les analyses de rations
alimentaires et les études de bilan. Il est essentiel de recourir
à des méthodes isotopiques et à des analyses biochimiques
standardisées pour bien établir l'existence de carences ou d'excès
de cuivre.
La toxicité biochimique du cuivre, lorsque la régulation
homéostatique devient inopérante, résulte de l'effet que cet
élément exerce sur la structure et la fonction des biomolécules
comme l'ADN, les membranes et les protéines, soit directement, soit
par l'intermédiaire de mécanismes faisant intervenir des radicaux
oxygénés.
1.7 Effets sur les animaux de laboratoire et les systèmes
d'épreuve in vitro
La toxicité d'une dose unique de cuivre varie largement selon
l'espèce en cause (DL50 comprise entre 15 et 1664 mg Cu/kg de poids
corporel). Parmi les sels de cuivre, ceux qui présentent une bonne
solubilité (sulfate de Cu(II), chlorure de Cu (II)), sont
généralement plus toxiques que par exemple l'hydroxyde de Cu(II) ou
l'oxyde de Cu (II), moins solubles. Des symptômes tels
qu'hémorragie gastrique, tachycardie, hypotension,crise
hémolytique, convulsions et paralysie précèdent l'issue fatale.
Pour la DL50 en exposition percutanée, on a fait état de valeurs
> 1124 et >2058 mg Cu/kg p.c. respectivement chez le rat et chez
le lapin. La CL50 pour une exposition par inhalation (durée non
précisée) a été trouvée > 1303 mg Cu/kg p.c. chez des lapins et on
a constaté une détérioration de la fonction respiratoire chez des
cobayes exposés à une dose de 1,3 mg Cu/m3 pendant 1 h.
Des rats qui avaient reçu quotidiennement pendant 15 jours 305
mg Cu/kg dans leur nourriture, sous la forme de sulfate de Cu (II),
on présenté des modifications de leurs paramètres biochimiques
sanguins accompagnées d'autres anomalies hématologiques (anémie en
particulier) et l'on a également observé des effets nocifs au
niveau du foie, des reins et des poumons. Ces effets étaient de
même nature que ceux observés chez d'autres espèces avec d'autres
dérivés du cuivre. La dose sans effet observable (NOEL) a été
évaluée dans cette étude à 23 mg Cu/kg p.c. par jour. On a
cependant relevé que les moutons étaient particulièrement sensibles
et des doses de Cu (II) réitérées correspondant à 1,5-7,5 mg Cu/kg
p.c. administrées chaque jour sous la forme de sulfate ou d'acétate
ont entraîné des lésions hépatiques progressives, une crise
hémolytique et la mort.
Exposés pendant une longue période, des rats et des souris
n'ont pas présenté de signes manifestes de toxicité autres qu'une
réduction de croissance liée à la dose, après ingestion de doses
quotidienne équivalant à 138 mg Cu/kg p.c. (rats) et 1000 mg Cu/kg
p.c. (souris). La dose sans effet nocif observable (NOAEL) a été
évaluée à 17 mg Cu/kg p.c. par jour pour les rats et à 44 et 126 mg
Cu/kg p.c. par jour, respectivement pour les souris mâles et les
souris femelles. Les effets observés consistaient notamment en une
inflammation du foie et en une dégénérescence de l'épithélium
tubulaire rénal.
Les études consacrées aux effets toxiques sur la reproduction
et le développement sont limitées. On a constaté une certaine
dégénérescence testiculaire et une réduction du poids du corps et
des organes chez des rats nouveau-nés à des doses dépassant 30 mg
Cu/kg p.c. par jour et administrées sur de longues périodes. On a
également observé des malformations foetales et autres effets
foetotoxiques à dose élevée (> 80 mg Cu/kg p.c. par jour).
Le sulfate de Cu (II) ne s'est pas révélé mutagène dans les
épreuves sur bactéries. Toutefois, on a observé une synthèse non
programmée de l'ADN qui augmentait en fonction de la dose dans des
hépatocytes de rat. Lors du test des micronoyaux sur la souris, on
a observé- dans une étude tout du moins- une augmentation
significative des cassures chromosomiques à la dose I.V. la plus
élevée (1,7 mg Cu/kg p.c.), mais aucun effet n'a été constaté lors
d'une autre étude à des doses allant jusqu'à 5,1 mg Cu/kg p.c.
Les études de neurotoxicité n'ont révélé aucun effet sur le
comportement mais des modifications neurochimiques ont été
signalées après administration par voie buccale de doses
correspondant à 20-40 mg Cu/kg p.c. par jour. D'après un nombre
limité d'études d'immunotoxicité, il y a eu une détérioration de la
fonction immunitaire humorale et à médiation cellulaire après
ingestion, avec l'eau de boisson, de doses équivalant à environ 10
mg Cu /kg p.c. par jour.
1.8 Effets sur l'Homme
Le cuivre est un élément essentiel et les effets indésirables
qui lui sont imputables peuvent provenir d'une carence comme d'un
excès. La carence en cuivre est à l'origine d'anémies, de
neutropénies et d'anomalies osseuses mais il est rare qu'elle se
manifeste cliniquement chez l'Homme. On peut faire un bilan
cuprique pour essayer de prévoir certains effets cliniques ou
encore procéder à un dosage du cuivre et de la céruléoplasmine
sériques pour évaluer une carence modérée à forte, dosage qui
n'offre toutefois pas autant de sensibilité dans le cas d'une
carence limite.
Si l'on excepte les cas d'intoxication aiguë, on n'observe
guère d'effets dans les populations normales. L'absorption d'une
dose unique d'un dérivé du cuivre soit accidentellement, soit dans
un but de suicide, donne lieu aux symptômes suivants: goût
métallique, douleurs épigastriques, céphalées, nausées,
étourdissements, vomissements et diarrhée, tachycardie, difficultés
respiratoires, anémie hémolytique, hématurie, hémorragie
gastrointestinale massive, insuffisance hépatique et rénale
aboutissant finalement à la mort. On a observé des effets
gastrointestinaux après ingestion unique ou répétée d'eau à forte
teneur en cuivre et on a fait état d'insuffisance hépatique
consécutive à l'absorption de cuivre pendant une longue période. Il
ne semble pas qu'une exposition cutanée puisse entraîner une
intoxication générale, mais le cuivre peut provoquer des réactions
allergiques chez certains individus. On a mentionné des cas de fièvre
des fondeurs consécutifs à l'inhalation, sur le lieu de travail,
d'air fortement chargé en cuivre mais, bien que d'autres effets
respiratoires aient été attribués à l'inhalation de mélanges
contenant du cuivre (par ex. bouillie bordelaise, travail à la
mine, travail auprès des fours), la responsabilité du cuivre n'a
pas été démontrée. Des ouvriers apparemment exposés à des
concentrations atmosphériques correspondant à l'absorption d'une
dose de 200 mg Cu/jour, ont présenté des signes évocateurs d'une
intoxication cuprique (par ex. élévation du Cu sérique,
hépatomégalie). Les données dont on dispose au sujet de la
cancérogénicité et des effets toxiques du cuivre sur la
reproduction sont insuffisantes pour permettre une évaluation du
risque.
On a décrit un certain nombre de groupes que des troubles de
l'homéostase cuprique semblent rendre plus sensibles que le reste
de la population à une carence ou à un excès de cuivre. Certains
troubles ont une origine génétique précise. Il s'agit notamment de
la maladie de Menkes, une carence cuprique généralement mortelle,
de la maladie de Wilson (dégénérescence hépatolenticulaire), une
pathologie qui conduit à une accumulation progressive de cuivre et
de l'acéruléoplasminémie héréditaire, qui s'accompagne des
manifestations cliniques d'une surcharge martiale. La cirrhose
infantile indienne et la cuprotoxicose idiopathique sont des
affections liées à un excès de cuivre et peut-être associées à une
sensibilité au cuivre d'origine génétique, encore que cette
hypothèse n'ait pas été indiscutablement prouvée. Il s'agit là
d'affections mortelles de la petite enfance dans lesquelles le
cuivre s'accumule dans le foie. On a pu mettre ces maladies en
parallèle avec une forte consommation de cuivre, tout du moins dans
certains cas.
Parmi les autres groupes potentiellement sensibles à l'excès
de cuivre on peut citer les personnes en hémodialyse et les malades
atteints d'une affection hépatique chronique. Parmi les groupes
exposés au risque de carence en cuivre figurent les nourrissons
(notamment les enfants de faible poids de naissance et les
prématurés, les enfants qui se remettent d'une malnutrition et les
enfants nourris exclusivement au lait de vache), les sujets
souffrant d'un syndrome de malabsorption (maladie coeliaque, sprue,
mucoviscidose) et les malades nourris exclusivement par voie
parentérale. On a également incriminé une carence en cuivre dans la
pathogénèse de certaines maladies cardiovasculaires.
1.9 Effets sur les autres êtres vivants au laboratoire et dans
leur milieu naturel
Il faut mettre en balance les effets indésirables du cuivre et
son caractère essentiel. Cet élément est en effet essentiel pour
tout les êtres vivants et il faut veiller à ce que ces organismes
reçoivent la quantité de cuivre qui correspond à leur besoins. Il
y a au moins 12 protéines importantes dont le cuivre fait partie
intégrante de la structure. Il joue un rôle essentiel dans
l'utilisation du fer pour la formation de l'hémoglobine et la
plupart des crustacés et des mollusques possèdent une protéine,
l'hémocyanine, qui contient du cuivre et représente leur principal
transporteur d'oxygène. Chez les végétaux, le cuivre entre dans la
composition de plusieurs enzymes qui interviennent dans le
métabolisme des sucres, de l'azote et de la paroi cellulaire.
Dans l'évaluation du risque imputable au cuivre, la
biodisponibilité de cet élément joue un rôle déterminant.
L'adsorption du cuivre à des particules de matière ou sa
complexation par des substances organiques peuvent en limiter
fortement l'accumulation et par voie de conséquence, les effets.
Les autres cations ainsi que le pH peuvent également avoir une
influence importante sur la biodisponibilité.
On a montré que le cuivre exerçait des effets nocifs sur la
reproduction, les paramètres biochimiques, les fonctions
physiologiques et le comportement chez divers organismes
aquatiques. Ainsi, des effets toxiques se manifestent chez ces
organismes à des concentrations ne dépassant pas 1-2 µg/litre. Il
est vrai cependant qu'il faut prendre en considération les
importantes variations de sensibilité et de biodisponibilité
interspécifiques lorsque l'on se propose d'interpréter et
d'appliquer ces données.
Dans des communautés naturelles de phytoplancton, on a
constaté que la chlorophylle a et la fixation de l'azote étaient
sensiblement réduites à des concentrations de cuivre > 20
µg/litre et que la fixation du carbone était aussi notablement
réduite à une concentration > 10 µg/litre. Pour les algues, on
a obtenue une CE50 basée sur l'inhibition de la croissance qui
allait de 47 à 120 µg Cu/litre.
Chez les invertébrés dulçaquicoles, la valeur de la CL ou de
la CE50 à 48 h varie de 5 µg Cu/litre pour une espèce de daphnie
à 5300 µg Cu/litre pour un ostracode. Dans le cas des invertébrés
marins, on a obtenu une CL50 à 96 h de 29 µg Cu/litre pour une
coquille saint-jacques et de 9400 µg Cu/litre pour les crabes du
genre Uca. La toxicité aiguë du cuivre pour les poissons d'eau
douce et les poissons de mer est très variable. Pour les poissons
d'eau douce, la valeur de la CL50 à 96 h va de 3 µg Cu/litre (ombre
arctique Thymallus signifer) à 7340 µg Cu/litre
(Lepomis machrochirus). Dans le cas des espèces marines, la Cl50 à
96 h va de 60 µg Cu/litre pour un saumon, Onchorhynchus tschawtscha, à
1400 µg Cu/litre pour le mulet.
Le cuivre joue le rôle d'oligoélément pour les plantes mais un
sol trop riche en cuivre peut se révéler extrêmement toxique. En
général, les signes d'une toxicité d'origine métallique consistent
dans l'apparition de petites feuilles chlorotiques qui tombent
prématurément. Il y a rabougrissement de la plante dont les racines
démarrent mal et ne forment pas de départs latéraux. La réduction
du développement des racines peut conduire à une moindre fixation
d'eau et de nutriments par la plante avec perturbation du
métabolisme et de la croissance. Au niveau cellulaire, le cuivre
inhibe un grand nombre d'enzymes et perturbe plusieurs processus
biochimiques (notamment la photosynthèse, la synthèse des pigments
et l'intégrité des membranes) ou physiologiques (notamment le
métabolisme des acides gras et des protéines avec également un effet
inhibiteur sur la respiration et les processus de fixation de
l'azote).
Des effets toxiques ont également été observés au laboratoire
chez des lombrics placés dans une terre riche en cuivre; le
paramètre le plus sensible qui ait été mesuré était la formation de
cocons et des effets nocifs ont été notés à des concentrations de
50-60 mg Cu/kg.
Certains effets délétères observés chez des microorganismes
terricoles ont pu être mis en corrélation avec la présence de
fortes concentrations de cuivre dues à l'épandage d'engrais à base
de cuivre ou à l'implantation de fonderies de zinc dans le
voisinage. Dans des plantations d'agrumes traitées par des
fongicides à base de cuivre, on a constaté une chlorose foliaire en
corrélation significative avec la teneur du sol en cuivre.
On a montré que dans le milieu naturel, le phytoplancton, les
invertébrés aquatiques et terrestres, de même que les poissons et
les plantes terrestres, faisaient preuve d'une certaine tolérance
au cuivre. Parmi les mécanismes invoqués pour expliquer cette
tolérance chez les plantes, on peut citer la fixation du métal à
certains composants de la paroi cellulaire, la présence d'enzymes
métallo-tolérantes, la formation de complexes avec des acides
organiques suivie d'une élimination dans la vacuole et enfin, la
combinaison avec des protéines spécialisées riches en thiols ou
avec des phytochélatines.
2. Conclusions
2.1 Santé humaine
La limite inférieure de l'intervalle de dose acceptable par
ingestion (AROI) est égale à 20 µg Cu/kg de poids corporel par
jour. Pour obtenir cette valeur, on est parti de l'apport minimal
requis pour un adulte en tenant compte des variations du taux
d'absorption, de rétention et d'accumulation du cuivre (OMS, 1996).
Pour les enfants en bas âge, ce chiffre est égal à 50 µg Cu/kg p.c.
par jour.
La limite supérieure de l'intervalle précité n'est pas connue
avec certitude chez l'adulte mais il est très probable qu'elle est
de l'ordre de quelques mg par jour et pas davantage (par quelques
on entend plus de 2 à 3 mg/jour). Cette évaluation ne repose que
sur l'étude des effets gastrointestinaux d'une consommation d'eau
contaminée par du cuivre. Il n'a pas été possible de donner une
limite supérieure plus spécifique pour un groupe quelconque de
population. Nous ne disposons que de données limitées sur la
quantité de cuivre d'origine alimentaire qui serait susceptible de
nuire à la santé.
On a estimé que les données toxicologiques obtenues sur
l'animal n'étaient d'aucun secours pour l'établissement de la
limite supérieure de l'intervalle de dose acceptable par ingestion
chez l'Homme, du fait de l'incertitude quant à l'applicabilité à
l'Homme des modèles utilisés. En outre, les méthodes auxquelles on
a habituellement recours pour évaluer l'innocuité d'une substance,
méthodes qui impliquent l'application d'un coefficient de sécurité
aux données obtenues sur l'animal, ne sauraient convenir dès lors
que l'on doit prendre en considération des caractéristiques
particulières qui sont celles d'éléments essentiels comme le
cuivre.
A la lumière des données dont on dispose sur l'exposition
humaine au cuivre dans l'ensemble du monde, mais plus spécialement
en Europe et dans les Amériques, il semble que les dangers d'une
carence en cuivre sont plus grands que ceux d'un excès de cet
élément.
2.2 Effets sur l'environnement
Pour assurer la protection des organismes aquatiques dans les
eaux où la biodisponibilité est forte, il faut que le cuivre total
en solution reste en dessous de 10 µg/litre environ, la valeur la
plus appropriée étant fonction des espèces présentes et des
conditions d'exposition du site en cause; elle devra être fixée
après étude approfondie de tous les paramètres à prendre en
considération.
En de nombreux endroits, l'existence de facteurs
physico-chimiques limitant la biodisponibilité permettra de relever
les limites de concentration. La réglementation devra prendre en
considération les espèces chimiques en présence si les auteurs de
rejets sont à même de prouver que la biodisponibilité du cuivre
dans les eaux réceptrices peut être mesurée avec une fiabilité
suffisante.
Lors des prélèvements et des analyses effectués dans
l'environnement en vue de la recherche et du dosage du cuivre, il
est essentiel d'utiliser des techniques "propres".
Etant donné que le cuivre est un élément essentiel, il faut,
lorsqu'on cherche à éviter l'absorption de quantités toxiques de
cuivre, se garder d'introduire des coefficients de sécurité qui
aboutissent finalement à des concentrations recommandées
inférieures aux teneurs naturelles.
RESUMEN Y CONCLUSIONES
1. Resumen
1.1 Identidad, propiedades físicas y químicas
El cobre es un metal de color pardo rojizo, dúctil y maleable.
Pertenece al grupo IB de la Tabla periódica. Se suele encontrar en el
medio ambiente formando compuestos con valencia 2, pero pueden existir
estados metálicos de valencia +1 y +3. Está presente en la naturaleza
en una gran variedad de sales minerales y compuestos orgánicos, y en
forma metálica. El metal es muy poco soluble en soluciones acuosas,
salinas o ligeramente ácidas, pero se puede disolver en los ácidos
nítrico y sulfúrico, así como en soluciones básicas de hidróxido o
carbonato de amonio.
El cobre posee una elevada conductividad eléctrica y térmica y es
resistente a la corrosión.
1.2 Métodos analíticos
La gran variedad de especies de cobre, inorgánicas y orgánicas,
ha dado lugar a una serie de técnicas de muestreo, preparación y
métodos analíticos para cuantificar el elemento en muestras del medio
ambiente y biológicas. La contaminación de las muestras por cobre
procedente del aire, el polvo, los recipientes o los reactivos durante
la preparación y el muestreo es una fuente importante de errores
analíticos, por lo que es fundamental el uso de técnicas "limpias".
Los métodos colorimétricos y gravimétricos para la medición del
cobre son fáciles de usar y económicos; sin embargo, su utilidad se
limita a las situaciones en las cuales no es indispensable una
sensibilidad máxima. Para la medición de concentraciones bajas de
cobre en diversas matrices, los métodos más utilizados son los de
espectrofotometría de absorción atómica. La sensibilidad aumenta
enormemente con la utilización de la espectrofotometría de absorción
atómica en electrohorno de grafito, en lugar de la de llama. En
función de los procedimientos de tratamiento previo, separación y
concentración de la muestra, se han notificado límites de detección de
alrededor 1 µg/litro en agua mediante espectrofotometría en
electrohorno de grafito y 20 µg/litro por la de llama y niveles de
0,05-0,2 µg/g de tejido con la primera. Se puede conseguir una
sensibilidad mayor mediante el uso técnicas de emisión, como las
técnicas de plasma de argon con acoplamiento inductivo de alta
temperatura, seguidas de espectroscopia de emisión atómica o
espectrometría de masas. Existen otras metodologías más sensibles y
especializadas, como la fluorescencia por rayos X, los métodos de
electrodos selectivos de iones y potenciométricos y la voltametría de
descascarillado anódico y de descascarillado catódico.
1.3 Fuentes de exposición humana y ambiental
Las fuentes naturales de exposición al cobre son el polvo
arrastrado por el viento, los volcanes, la vegetación en
descomposición, los incendios forestales y la dispersión marina. Entre
las emisiones antropogénicas cabe mencionar los hornos de fusión, las
fundiciones de hierro, las centrales eléctricas y fuentes de
combustión como los incineradores municipales. El desplazamiento
principal del cobre a la tierra se produce a partir de las escorias y
el manto de las minas de cobre y los fangos cloacales. El uso agrícola
de productos de cobre representa el 2% de la liberación de cobre al
suelo.
Los minerales de cobre se extraen, funden y refinan para la
fabricación de numerosos productos industriales y comerciales. Se
utiliza ampliamente en utensilios de cocina y sistemas de
abastecimiento de agua, así como en fertilizantes, bactericidas,
fungicidas, alguicidas y pinturas antiincrustantes. Se emplea asimismo
en aditivos de piensos y estimulantes del crecimiento, así como en la
lucha contra determinadas enfermedades del ganado vacuno y de las
aves. El cobre se utiliza en la industria como activador en la
flotación por espuma de los minerales sulfurosos, la producción de
conservantes de la madera, la galvanoplastia, la fabricación de
colorantes nitrogenados, como mordiente para tintes de tejidos, en el
refinado del petróleo y en la fabricación de los compuestos de cobre.
1.4 Transporte, distribución y transformación en el medio ambiente
El cobre se libera en la atmósfera asociado con materia
particulada. Se elimina mediante sedimentación gravitatoria,
deposición seca, arrastre y lavado por la lluvia. La velocidad de
eliminación y la distancia recorrida desde la fuente dependen de las
características de ésta, del tamaño de las partículas y de la
velocidad del viento.
El cobre se libera en el agua como consecuencia de la exposición
natural a la intemperie del suelo y los vertidos de industrias y
plantas de depuración de aguas residuales. Se pueden aplicar
compuestos de cobre de manera intencionada al agua para destruir las
algas. Hay varios procesos que influyen en el destino del cobre en el
medio acuático. Son la formación de complejos, la sorción para formar
óxidos metálicos hidratados, arcillas y materiales orgánicos y la
bioacumulación. Los datos sobre las formas fisicoquímicas del cobre
(especiación) son más informativos que las concentraciones totales de
cobre. Gran parte del cobre vertido en el agua está en forma
particulada y tiende a sedimentarse, precipitar o adsorberse en
materia orgánica, hierro hidratado, óxidos de manganeso y arcilla en
el sedimento o la columna de agua. En el medio acuático, la
concentración de cobre y su biodisponibilidad dependen de factores
como la dureza y la alcalinidad del agua, la fuerza iónica, el pH y el
potencial redox, así como de la formación de ligandos complejos, la
materia particulada y el carbón suspendidos y la interacción entre los
sedimentos y el agua.
La liberación más importante de cobre se produce hacia la tierra;
sus fuentes principales son las operaciones de extracción, la
agricultura, los residuos sólidos y los fangos procedentes de las
actividades de tratamiento. La mayor parte del cobre depositado en el
suelo se adsorbe fuertemente y se mantiene en los centímetros más
superficiales. El cobre se adsorbe en la materia orgánica, los
minerales carbonados, los minerales arcillosos, el hierro hidratado y
los óxidos de manganeso. La mayor parte de la lixiviación se produce a
partir de suelos arenosos ácidos. En el medio ambiente terrestre hay
varios factores importantes que influyen en el destino del cobre en el
suelo. Son las características del propio suelo, el pH, la presencia
de óxidos, el potencial redox, las superficies cargadas, la materia
orgánica y el intercambio de iones.
Se produce bioacumulación de cobre procedente del medio ambiente
si el cobre está biológicamente disponible. Los factores de
acumulación varían enormemente entre los distintos organismos, pero
tienden a ser más elevados a concentraciones de exposición más bajas.
La acumulación puede dar lugar a concentraciones corporales
excepcionalmente altas en algunos animales (como por ejemplo los
bivalvos) y en plantas terrestres (como las que crecen en suelos
contaminados). Sin embargo, muchos organismos son capaces de regular
su concentración interna de cobre.
1.5 Niveles medioambientales y exposición humana
La concentración de cobre en el aire depende de la proximidad del
lugar a fuentes importantes, como hornos de fusión, centrales
eléctricas e incineradores. El cobre esta ampliamente distribuido en
el agua, porque se encuentra en ella de forma natural. Sin embargo,
sus concentraciones en el medio acuático se deben interpretar con
cautela. En sistemas acuáticos, los niveles ambientales de cobre se
suelen medir como concentración total o disuelta, siendo esta última
más representativa de la biodisponibilidad del metal.
El promedio de las concentraciones básicas de cobre en el aire de
las zonas rurales oscila entre 5 y 50 ng/m3. En las zonas no
contaminadas, en el agua marina se encuentran concentraciones de 0,15
µg/litro y en el agua dulce de 1-20 µg/litro. Los sedimentos son un
depósito y una reserva importantes de este metal. Las concentraciones
básicas de cobre en sedimentos de agua dulce naturales oscilan entre
16 y 5000 mg/kg (peso seco). Las concentraciones en sedimentos marinos
varían entre 2 y 740 mg/kg (peso seco). En sedimentos anóxicos, el
cobre se une fuertemente mediante sulfuros, por lo que no está
biodisponible. Se notificaron concentraciones medias de cobre de 30
mg/kg en suelos no contaminados (intervalo de 2-250 mg/kg). Este metal
se acumula en las plantas, los invertebrados y los peces. En
organismos de lugares contaminados por cobre se han notificado
concentraciones más elevadas que en los de zonas no contaminadas.
Para las personas sanas no expuestas al cobre en el puesto de
trabajo la vía principal de exposición es la oral. La ingesta diaria
media con los alimentos oscila en las personas adultas entre 0,9 y 2,2
mg. En la mayoría de los estudios se ha encontrado que los valores de
la ingesta se sitúan en el extremo inferior del intervalo. La
variación refleja los diferentes hábitos alimentarios, así como las
distintas prácticas agrícolas y de preparación de alimentos utilizadas
en todo el mundo. En algunos casos, el agua potable puede contribuir a
un aumento importante del valor total de la ingesta diaria de cobre,
sobre todo en hogares con aguas corrosivas y tuberías de cobre. En los
hogares sin tuberías de cobre o con aguas no corrosivas, la ingesta de
cobre a partir del agua potable raramente supera el valor de 0,1
mg/día, aunque puede haber valores superiores a unos pocos mg al día a
causa de la distribución de agua corrosiva a través de tuberías de
cobre. En general, la ingesta diaria total de cobre por vía oral
(alimentos más agua potable) oscila entre 1 y 2 mg/día, aunque
ocasionalmente puede alcanzar un valor superior a 5 mg/día. Todas las
demás ingestas de cobre (inhalación y cutánea) son insignificantes en
comparación con la vía oral. La inhalación añade 0,3-2,0 µg/día
procedente del polvo y el humo. Las mujeres que utilizan DIU están
expuestas sólo a 80 µg o menos de cobre al día a partir de esta
fuente.
1.6 Cinética y metabolismo en animales de laboratorio y en
el ser humano
La homeóstasis del cobre se debe al doble carácter del elemento,
esencial y tóxico. El carácter esencial se deriva de su incorporación
específica a un gran número de proteínas con fines catalíticos y
estructurales. En los mamíferos se conservan las rutas celulares de
absorción, incorporación a las proteínas y exportación del cobre,
reguladas por el propio metal.
El cobre se absorbe fundamentalmente a través del tracto
gastrointestinal. Se absorbe del 20% al 60% del cobre procedente de
los alimentos, mientras que el resto se excreta a través de las heces.
Una vez que el metal ha atravesado la membrana basolateral, es
transportado hasta el hígado unido a la seroalbúmina. El hígado es el
órgano fundamental para la homeóstasis del cobre. El metal se reparte
entre la excreción a través de la bilis y la incorporación a proteínas
intracelulares y extracelulares. La vía de eliminación más importante
es la biliar. El transporte de cobre hasta los tejidos periféricos se
realiza a través del plasma, unido a seroalbúmina, ceruloplasmina o
complejos de bajo peso molecular.
Los métodos utilizados para estudiar la homeóstasis del cobre en
los mamíferos son el análisis de los alimentos y los estudios del
balance. Para conocer la deficiencia y el exceso de cobre son
imprescindibles los isótopos y los análisis bioquímicos normalizados
de estos procesos.
La toxicidad bioquímica del cobre, cuando supera el control
homeostático, se debe a sus efectos en la estructura y la función de
biomoléculas como el ADN, las membranas y las proteínas, directamente
o mediante mecanismos con intervención de radicales de oxígeno.
1.7 Efectos en los animales de laboratorio y en los sistemas
de prueba in vitro
La toxicidad de una dosis oral única de cobre varía enormemente
entre las especies (DL50 de 15-1664 mg de Cu/kg de peso corporal).
Las sales más solubles de cobre (sulfato de cobre (II) y cloruro de
cobre (II)) son generalmente más tóxicas que las menos solubles
(hidróxido de cobre (II), óxido de cobre (II)). La muerte se produce
tras la aparición de hemorragia gástrica, taquicardia, hipotensión,
crisis hemolítica, convulsiones y parálisis. Se notificaron valores de
la DL50 para la exposición cutánea > 1124 y > 2058 mg de Cu/kg de
peso corporal en ratas y conejos, respectivamente. La DL50 por
inhalación (duración de la exposición no especificada) fue >1303 mg
de Cu/kg de peso corporal en conejos, y en los cobayas expuestos a
concentraciones de 1,3 mg de Cu/m3 durante una hora se observó
insuficiencia respiratoria.
Las ratas que recibieron 305 mg de Cu/kg al día por vía oral con
los alimentos en forma de sulfato de cobre (II) durante 15 días
mostraron alteraciones de la bioquímica sanguínea y los datos
hematológicos (particularmente anemia) y efectos secundarios en el
hígado, el riñón y los pulmones. Los efectos fueron cualitativamente
semejantes a los de otros compuestos de cobre y en otras especies. La
concentración sin efectos observados (NOEL) en este estudio fue de 23
mg de Cu/kg de peso corporal al día. Sin embargo, las ovejas fueron
particularmente sensibles, y dosis repetidas de 1,5-7,5 mg de Cu/kg de
peso corporal al día en forma de sulfato de cobre (II) o acetato de
cobre (II) produjeron lesiones hepáticas progresivas, crisis
hemolítica y por último la muerte.
La exposición prolongada de ratas y ratones no puso de manifiesto
signos evidentes de toxicidad, salvo una reducción del crecimiento
relacionada con la dosis tras la ingestión de 138 mg de Cu/kg de peso
corporal al día (ratas) y 1000 mg de Cu/kg de peso corporal al día
(ratones). La concentración sin efectos adversos observados (NOAEL)
fue de 17 mg de Cu/kg de peso corporal al día en ratas y de 44 y 126
mg de Cu/kg de peso corporal al día en ratones machos y hembras,
respectivamente. Los efectos fueron la inflamación del hígado y la
degeneración del epitelio tubular del riñón
Los estudios de la toxicidad reproductiva y en el desarrollo
fueron limitados. Se observó cierta degeneración testicular y una
reducción del peso del cuerpo y de los órganos al nacer en ratas
tratadas con dosis superiores a 30 mg de Cu/kg de peso corporal al día
durante períodos prolongados de tiempo y efectos fetotóxicos y
malformaciones con concentraciones altas (>80 mg de Cu/kg de peso
corporal al día).
El sulfato de cobre (II) no fue mutagénico en valoraciones
realizadas con bacterias. Sin embargo, se observó un aumento
relacionado con la dosis de la síntesis de ADN no programado en
hepatocitos de rata. En el ensayo del micronúcleo, un estudio puso de
manifiesto un aumento significativo de las fracturas cromosómicas con
la dosis intravenosa más alta (1,7 mg de Cu/kg de peso corporal al
día), pero en otro estudio realizado con dosis intravenosas de hasta
5,1 mg de Cu/kg de peso corporal al día no se observó ningún efecto.
Los estudios de neurotoxicidad no han puesto de manifiesto
efectos en el comportamiento, pero se han notificado cambios
neuroquímicos tras la administración oral de 20-40 mg de Cu/kg de peso
corporal al día. En un número limitado de estudios de inmunotoxicidad
se ha observado un trastorno de la función inmunitaria humoral y
mediada por células en ratones después de la ingesta oral con agua de
bebida de unos 10 mg de Cu/kg de peso corporal al día.
1.8 Efectos en el ser humano
El cobre es un elemento esencial y hay efectos perjudiciales para
la salud relacionados tanto con su deficiencia como con su exceso. La
deficiencia de cobre está asociada con anemia, neutropenia y anomalías
óseas, pero la deficiencia clínicamente manifiesta es relativamente
poco frecuente en el ser humano. Se pueden utilizar los datos del
balance para prever los efectos clínicos, mientras que las
concentraciones de cobre en el suero y en la ceruloplasmina son
medidas útiles de la deficiencia entre moderada y grave, pero son
medidas menos sensibles de la deficiencia marginal.
Excepto en el caso de accidentes agudos ocasionales de
intoxicación por cobre, se han observado pocos efectos en la población
normal. Se han notificado efectos de una exposición única tras la
ingestión oral con fines suicidas o accidental consistentes en sabor
metálico, dolor epigástrico, dolor de cabeza, náuseas,
desvanecimiento, vómitos y diarrea, taquicardia, dificultad
respiratoria, anemia hemolítica, hematuria, hemorragia
gastrointestinal masiva, insuficiencia hepática y renal y la muerte.
También se han presentado efectos gastrointestinales por una ingestión
única y repetida de agua de bebida con altas concentraciones de cobre
y se ha notificado insuficiencia hepática tras la ingestión crónica de
cobre. La exposición cutánea no se ha asociado con la toxicidad
sistémica, pero el cobre puede inducir respuestas alérgicas en
personas sensibles. Se han notificado casos de fiebre de los
fundidores debidos a la inhalación de concentraciones elevadas en el
aire en el puesto trabajo y, aunque se han atribuido otros efectos
respiratorios a la exposición a mezclas que contenían cobre (por
ejemplo, caldo bordelés, extracción y fundición), no se ha demostrado
la función del cobre. Los trabajadores aparentemente expuestos a
concentraciones elevadas en el aire que daban lugar a una ingesta
estimada de 200 mg de Cu/día mostraron signos que parecían indicar una
intoxicación por cobre (por ejemplo, concentraciones elevadas de cobre
en el suero, hepatomegalia). Los datos disponibles sobre la toxicidad
reproductiva y la carcinogenicidad son inadecuados para la evaluación
del riesgo.
Se describen varios grupos en los cuales los trastornos aparentes
de la homeóstasis del cobre producen una sensibilidad mayor al déficit
o el exceso de cobre que en la población general. Algunos trastornos
tienen una base genética bien definida. Entre éstos figuran la
enfermedad de Menkes, manifestación de la deficiencia de cobre
generalmente fatal; la enfermedad de Wilson (degeneración
hepatolenticular), enfermedad que lleva a una acumulación progresiva
de cobre; y la aceruloplasminemia hereditaria, con síntomas clínicos
de sobrecarga de hierro. La cirrosis infantil india y la toxicosis
idiopática por cobre son enfermedades relacionadas con el exceso de
cobre que pueden estar asociadas con una sensibilidad al cobre de base
genética, aunque esto no se ha demostrado de manera inequívoca. Estas
son enfermedades hepáticas fatales en la primera infancia, en las que
el cobre se acumula en el hígado. Las incidencias de las enfermedades
estaban relacionadas con un ingestión elevada de cobre, por lo menos
en algunos casos.
Otros grupos potencialmente sensibles al exceso de cobre son los
pacientes sometidos a hemodiálisis y las personas con enfermedades
hepáticas crónicas. Los grupos con riesgo de deficiencia de cobre
incluyen los niños pequeños (en particular los recién nacidos de bajo
peso al nacer/prematuros, los niños que se están recuperando de una
malnutrición, los niños pequeños alimentados exclusivamente con leche
de vaca), las personas con síndrome de mala absorción (por ejemplo
enfermedad celíaca, esprue, fibrosis cística) y los pacientes
totalmente dependientes de una nutrición parenteral. Se ha relacionado
la deficiencia de cobre con la patogénesis de las enfermedades
cardiovasculares.
1.9 Efectos en otros organismos en el laboratorio y en el
medio ambiente
Hay que buscar un equilibrio entre los efectos adversos del cobre
y su carácter esencial. El cobre es un elemento esencial para toda la
biota, y hay que tener cuidado para asegurar que queden cubiertas las
necesidades nutricionales de cobre de los organismos. Este elemento
forma parte integrante de la estructura de 12 proteínas importantes
por lo menos. Es imprescindible para la utilización del hierro en la
formación de la hemoglobina; en la mayor parte de los crustáceos y
moluscos la principal proteína sanguínea transportadora de oxígeno es
la hemocianina, en cuya estructura figura el cobre. En las plantas, el
cobre forma parte de varias enzimas que intervienen en el metabolismo
de los hidratos de carbono, del nitrógeno y de la pared celular.
Un factor decisivo en la evaluación del peligro del cobre es su
biodisponibilidad. La adsorción de cobre en las partículas y la
formación de complejos con la materia orgánica puede limitar mucho el
grado de acumulación del metal y sus efectos. Su biodisponibilidad
puede verse afectada también en gran medida por la presencia de otros
cationes y por el pH.
Se ha demostrado que el cobre tiene efectos adversos en la
reproducción, la bioquímica, la fisiología y el comportamiento de
diversos organismos acuáticos. Se ha observado que concentraciones de
cobre de apenas 1-2 µg/litro tienen efectos perjudiciales en
organismos acuáticos; sin embargo, en la interpretación y aplicación
de esta información se deben considerar grandes variaciones debidas a
la sensibilidad y la biodisponibilidad de las especies.
En las comunidades naturales de fitoplancton se observó una
reducción significativa de la clorofila á y de la fijación del
nitrógeno con concentraciones de cobre > 20 µg/litro, y la fijación
del carbono disminuyó de manera considerable con concentraciones >
10 µg/litro. La CE50 (72 horas) para las algas, basada en la
inhibición del crecimiento, oscila entre 47 y 120 µg de Cu/litro.
En los invertebrados de agua dulce, la C(E)L50 a las 48 horas
oscila entre 5 µg de Cu/litro para una especie de dáfnidos y 5300 µg
de Cu/litro para un ostrácodo. La CL50 a las 96 horas en los
invertebrados marinos varía entre 29 µg de Cu/litro para el peine
caletero y 9600 µg de Cu/litro para el cangrejo violinista. La
toxicidad aguda del cobre para los peces de agua dulce y marinos es
enormemente variable. En los primeros, la CL50 oscila entre 3 µg de
Cu/litro (tímalo ártico) y 7340 µg de Cu/litro para
Lepomis macrochirus. En los segundos, la CL50 a las 96 horas oscila
entre 60 µg de Cu/litro para el salmón real y 1400 µg de Cu/litro para
el mujol.
Aunque las plantas necesitan cobre como elemento traza, la
concentración elevada de este metal en el suelo puede ser muy tóxica.
En general, los síntomas visibles de la toxicidad metálica son las
hojas cloróticas pequeñas y la caída temprana de las hojas. También se
produce un retraso del crecimiento y la iniciación de las raíces y el
desarrollo de las laterales son escasos. El reducido crecimiento de
las raíces puede dar lugar a una menor absorción de agua y de
nutrientes, y esto provoca alteraciones en el metabolismo y retraso
del crecimiento. A nivel celular, el cobre inhibe un gran número de
enzimas e interfiere con varios aspectos de la bioquímica vegetal (por
ejemplo la fotosíntesis, la síntesis de pigmentos y la integridad de
la membrana) y la fisiología (en particular interfiere con los ácidos
grasos y el metabolismo de las proteínas e inhibe la respiración y los
procesos de fijación del nitrógeno).
Se han observado efectos tóxicos en estudios de laboratorio
realizados con lombrices de tierra expuestas a cobre en el suelo; la
formación del cocón es el parámetro más sensible medido, con efectos
adversos importantes en presencia de 50-60 µg de Cu/litro.
En la naturaleza, los efectos adversos en los microorganismos del
suelo se han relacionado con concentraciones más elevadas de cobre en
zonas tratadas con fertilizantes que contenían este elemento y en
lugares cercanos a fundiciones de cobre-zinc. En las zonas citrícolas
en las cuales se han aplicado fungicidas con cobre se ha observado que
la clorosis foliar está fuertemente relacionada con las
concentraciones de cobre en el suelo.
Se ha demostrado tolerancia al cobre en el medio ambiente para el
fitoplancton, los invertebrados acuáticos y terrestres, los peces y
las plantas terrestres. Los mecanismos de tolerancia propuestos en las
plantas comprenden la unión del metal al material de la pared celular,
la presencia de enzimas tolerantes al metal, la formación de complejos
con ácidos orgánicos y la consiguiente eliminación en las vacuolas y
la unión a proteínas específicas ricas en grupos tiol o a
fitoquelatinas.
2. Conclusiones
2.1 Salud humana
El límite inferior de la gama aceptable de ingesta oral (AROI) es
de 20 µg/kg de peso corporal al día. Esta cifra se obtiene a partir de
las necesidades basales de una persona adulta con un margen para tener
en cuenta las variaciones en la absorción, retención y almacenamiento
del cobre (OMS, 1996). En la infancia, esta cifra es de 50 µg/kg de
peso corporal.
El límite superior de la AROI en las personas adultas es
incierto, pero muy probablemente es del orden de varios, pero no
muchos, mg por día (por varios se entiende más de 2-3 mg/día). Esta
evaluación se basa únicamente en los estudios de los efectos
gastrointestinales del agua de bebida contaminada por cobre. No se
pudo confirmar un valor más específico para el límite superior de la
AROI con respecto a ningún sector de la población general. Es limitada
la información disponible sobre el nivel de ingestión del cobre en los
alimentos capaz de provocar efectos adversos para la salud.
Los datos disponibles sobre la toxicidad en los animales no se
consideraron de ayuda para establecer el límite superior de la AROI,
debido a la incertidumbre acerca del modelo apropiado para el ser
humano. Además, la metodología tradicional para la evaluación de la
inocuidad, basada en la aplicación de factores de incertidumbre a los
datos de los animales, no aborda de manera adecuada las
características especiales de elementos esenciales como el cobre.
De los datos disponibles sobre la exposición humana en todo el
mundo, pero particularmente en Europa y en las Américas, se deduce que
la deficiencia en la ingesta de cobre representa un riesgo de efectos
en la salud mayor que el debido a un exceso.
2.2 Efectos en el medio ambiente
La protección de la vida acuática en las aguas con una elevada
biodisponibilidad exigirá el mantenimiento de la concentración total
de cobre disuelto en un valor inferior a 10 µg/litro; sin embargo, el
límite adecuado de la concentración depende de la biota y de las
condiciones de exposición en los lugares que despiertan preocupación y
se debe establecer en función de una nueva evaluación de todos los
datos pertinentes.
En muchos lugares, los factores fisicoquímicos que limitan la
biodisponibilidad permitirán valores de cobre más elevados. En los
criterios reglamentarios se debe tener en cuenta la especiación del
cobre si los autores de los vertidos pueden demostrar que se puede
medir de forma fidedigna la biodisponibilidad del cobre en las aguas
receptoras.
En el muestreo y el análisis del cobre en el medio ambiente es
fundamental la utilización de técnicas "limpias".
Habida cuenta de que el cobre es un elemento esencial, no se
deben incorporar a los procedimientos para impedir niveles tóxicos de
este metal factores de inocuidad que den lugar a concentraciones
recomendadas inferiores a los niveles naturales.
10.2.2 Occupational exposures
Under occupational conditions where exposure to airborne copper
is controlled at or below the widely accepted standard of 1 mg Cu/m3,
and assuming a shift inspiratory volume of 10 m3 and a usual
workplace distribution of particle sizes, an estimated intake of 8.5
mg Cu/day can be calculated for occupational sources. This may be an
important contribution to daily intake; however, this is a worst-case
estimate using default values and present occupational conditions
rarely lead to this level of exposure.
10.3 Essentiality versus toxicity in humans
10.3.1 Risk of copper deficiency
Clinically evident copper deficiency in adults is rarely found in
the general population. However, recent dietary surveys show that the
mean population intake is suboptimal. In some regions of the world,
such as Europe and the USA, intakes are about 20% below the
recommended levels. The health consequences of marginally adequate
intakes remain to be determined.
Infants with low birth weight (up to 15% of children worldwide)
are particularly at risk for deficiency. Frequent episodes of
diarrhoea are another risk factor leading to copper deficiency. Copper
deficiency commonly occurs during the recovery from protein energy
malnutrition, since these infants grow rapidly and are usually fed
diets that supply inadequate copper.
Based on dietary interactions, individuals taking supplements of
zinc and ascorbic acid are at risk of developing copper deficiency.
Malabsorption states associated with copper deficiency include
chronic diarrhoea, short bowel syndrome, partial gastrectomy, coeliac
disease, sprue and cystic fibrosis.
Patients receiving prolonged intravenous nutrient mixtures which
lack sufficient copper may develop symptomatic evidence of copper
deficiency.
Menkes disease (see chapter 8) is a rare (approx. 1 : 200 000)
X-linked recessive disorder which results in a defect in the
intestinal absorption of copper. This disorder leads to a severe,
symptomatic, fatal deficiency state even at copper intakes above the
AROI.
Copper deficiency has been implicated as a possible risk factor
in the pathogenesis of cardiovascular disease.
10.3.2 Risk from excess copper intake
10.3.2.1 General population
When copper homoeostatic control is defective and/or copper
intake is excessive, copper toxicity may occur. Ingestion of excess
copper is infrequent in humans and is usually a consequence of the
contamination of beverages (including drinking-water) or from
accidental or deliberate ingestion of high quantities of copper salts.
Effects which occur at lowest levels are those on the gastrointestinal
tract; for example, nausea, vomiting and diarrhoea. Doses which
induce such effects have not been well characterized and confounders
such as microbiological quality of water supplies or other potential
causes of the symptoms have not been adequately considered. On the
basis of available data, gastrointestinal illness appears to be
associated with consumption of drinking-water containing several
mg/litre of copper, but it is not possible to provide a precise
number. Symptoms disappear following a change of water supply.
Wilson disease (hepatolenticular degeneration; see chapter 8) is
the most common (approx. 1 : 30 000) inherited disorder of copper
metab olism. The mode of inheritance is an autosomal recessive trait
which results in decreased biliary excretion of copper and in hepatic
accumulation of the metal.
Other extremely rare conditions such as ICC and ICT are
characterized by copper accumulation in early childhood. The relative
contribution of genetic factors and/or elevated environmental exposure
to copper remains undefined.
A more common cause of copper accumulation in the liver is
chronic liver disease associated with chronic cholestasis. These
disorders include primary biliary cirrhosis, primary sclerosing
cholangitis, extrahepatic biliary obstruction or atresia and
intrahepatic cholestasis of childhood. In these conditions, copper
accumulation does not appear to be primarily responsible for hepatic
injury.
Copper or copper salts may induce allergic contact dermatitis in
susceptible individuals.
There is no convincing evidence of an association between
increased dietary copper intake and cardiovascular disease.
Available data in humans and animals are inadequate to assess the
reproductive/developmental effects of copper compounds.
There is no convincing evidence that copper plays an aetiological
role in the development of cancer in humans, on the basis of available
epidemiological data and limited experimental data in animals. The
weight of evidence from in vitro and in vivo assays indicates that
copper sulfate is not genotoxic.
10.3.2.2 Occupational risks
Studies of populations of copper workers have failed to
demonstrate systemic copper toxicity or significant excess of cancer.
No occupational studies were found to indicate that copper exposures
resulted in reproductive or developmental effects.
In occupational settings, acute effects are limited to metal fume
fever. This condition has been produced by inhalation of fresh copper
fume at air concentrations above 0.1 mg Cu/m3. Similar responses to
very finely divided copper metal and oxide dusts have been reported
where conditions probably resulted in unusually high dust
concentrations.
Chronic effects involving the liver have been reported in workers
whose exposures were uncontrolled and likely to have been high.
10.4 Evaluation of effects on the environment
10.4.1 Concept of environmental risk assessment
The science of performing environmetal risk assessments has
evolved rapidly in recent years, with standardized techniques being
adopted in both the USA and Europe (US EPA, 1992; OECD, 1995). The
key components of environmental risk assessment paradigms include
problem formulation, analysis (which includes both exposure and
effects analysis), and risk characterization.
Problem formulation consists of defining the risk problem,
assessing the population, community, or ecosystem at risk,
establishing the model for evaluating the potential for risk and
selecting the biological end-points and environmental media to
analyse. The analysis phase consists of performing detailed studies
designed to characterize the spatial and temporal concentrations of
the chemical of interest. Additionally, a series of standardized
laboratory and, in some cases field studies, are performed to evaluate
the toxicity dose-response curve for selected end-points and species
of interest. The risk characterization phase integrates the exposure
and effects data, determines the potential for co-occurrence between
organism and contaminant and comes to a conclusion about the potential
for risk. The risk statement can be made in terms of a probability
statement, frequency of time effects are expected to occur or number
of species to be affected. Risk is assessed by determination of the
adequacy of the margin of safety between effects and exposure
concentrations, and expert judgement is typically used to determine
the acceptability of the perceived margin of safety. There is a
general consensus that the larger the margin of safety the lower is
the environmental risk. Margins of safety less than 1.0 are usually
indicative of a higher potential for risk and may require further
evaluation.
10.4.2 Components of risk assessment process for copper
The principal components of risk assessment are exposure and
effects characterization. The environmental exposure has been
assessed by reviewing the fate (transport, distribution and behaviour)
from the point of release into and through the environmental
compartments of air, water soil/sediment and biota. Toxicity tests
with copper have been done on representative species of the trophic
levels in the ecological community of interest, including algae and
plants (primary producers), aquatic and terrestrial invertebrates
(secondary producers) and fish and terrestrial animals (consumers).
Since copper is an essential micronutrient, a lower limit exists
below which deficiency will occur (see section 10.1). Thus the use of
large safety factors in procedures to limit exposures to below toxic
levels might result in target concentrations below essential levels.
This potential problem has been addressed in the deficiency toxicity
optimum concentration band for essential elements (DT-OCEE) concept
(van Tilborg, 1996). Because copper is a ubiquitous trace metal in
the natural environment, it is unlikely except in some terrestrial
regions where copper concentrations are very low, or where
antagonistic molybdenum interactions occur, that deficiency will be a
significant issue in the environment. In view of these concepts, the
environmental risk assessment paradigm for essential elements such as
copper must (as for humans, see section 10.1.1) be expressed as a
deficiency-toxicity model which describes an acceptable concentration
range for copper in the environment.
One of the key questions in ecotoxicology is to what extent
laboratory tests in defined media under carefully controlled
conditions are predictive of effects that will be seen in the
environment. Traditional toxicity testing has in the past focused on
the acute (mortality) and chronic (e.g. growth and reproduction)
effects of chemicals on the life stages of representative aquatic and
terrestrial organisms. In recent years it has been realized that the
environmental chemistry, especially in relation to metal speciation
and complexation, will have a signficant influence on and be a
determinant of the outcome of laboratory toxicity tests as well as the
effects actually seen in the environment. Several papers cited in
chapter 9 report this circumstance (see section 9.1), which has been
generalized in an hypothesis which describes the bioavailability of
copper. This has led to the now accepted view that the total copper
in the environmental medium is not a good predictor of its
bioavailability. Acceptance of this concept also leads to the logical
conclusion that the risk assessment of copper should ideally be made
on a site-specific basis.
Organisms may also become adapted at a local scale by
physiological acclimation and possibly genetic changes. Because of
such adaptations the test-derived toxicity values will be elevated
compared to the values for the same species from a nonadapted
population. On this basis it is essential that the risk assessment of
copper should be made on a site-specific basis.
10.5 Environmental risk assessment for copper
For the purposes of characterizing the potential risk of copper
to the environment there are limited data available for perfoming a
detailed risk assessment for each environmental medium (air, water,
soil, sediment). The largest data set is available for the aquatic
environment. The intent of this section is to evaluate the available
biological effects and exposure data for various organisms and media
consistent with this risk paradigm, and describe ranges of
concentrations where the potential for risk increases.
10.5.1 Aquatic biota
10.5.1.1 Overview of exposure data
Natural freshwater streams normally have total dissolved copper
concentrations in the range of 1.0-20 µg/litre. Open ocean surface
waters contain 0.02-0.2 µg Cu/litre, although near-shore seawater may
have copper concentrations as high as 1.0 µg/litre. In the ocean,
copper concentration increases with depth. These natural copper
levels can be increased by anthropogenic input; for example, acid mine
drainage increased the copper concentration up to 600 µg/litre in
Restronquet creek, United Kingdom, and Chesapeake bay, USA, can have
copper levels as high as 80 µg/litre as a result of shipping activity.
The toxic effect of copper on aquatic biota is critically
dependent on the bioavailability of copper in water, which in turn
depends on the physicochemical form (i.e. speciation) of the copper.
The bioavailability is decreased by the complexation and adsorption of
copper by natural organic matter, iron and manganese hydrated oxides,
and chelating agents excreted by algae and other aquatic organisms.
Toxicity can also be affected by pH and hardness. For these reasons,
total copper is rarely useful as a predictor of toxicity. Studies
have shown that in natural seawater more than 98% of copper is bound
by organic matter and in rivers a high percentage is often organically
bound, but the actual percentage depends on the dissolved organic
concentration of the river water and its pH.
10.5.1.2 Overview of toxicity data
Copper exhibits significant toxicity to some aquatic organisms,
although the degree of toxicity is highly variable and the
bioavailability of copper dictates its toxicity to a large extent.
Some algal species are very sensitive to copper. EC50 values as
low as 47 µg/litre total dissolved copper have been reported for 96-h
growth rate experiments, but for other algal species EC50 values up
to 481 µg/litre have been found. However, it is possible that many of
the high EC50 values in the literature are the result of the growth
rate experiments being carried out in culture media containing
copper-complexing agents such as silicate, iron, manganese and EDTA,
which reduce the bioavailability of copper.
Acutely lethal copper concentrations to aquatic invertebrates
range from several µg/litre to several mg/litre. The 48-96-h LC50s
of copper ranged from 7 to 54 µg/litre for Daphnia magna, 37 to 183
µg/litre for amphipods, 58 to 112 µg/litre for gastropods and 50 to
100 µg/litre for crab larvae. Sublethal effects and effects on
longer-term survival have been reported in a variety of invertebrate
species for copper concentrations from about 1 µg/litre to a few
hundred µg/litre. For high bioavailability waters, effect
concentrations for several sensitive taxa can be < 10 µg Cu/litre.
Acutely lethal copper concentrations for fish range from a few
µg/litre to several mg/litre, depending greatly both on the test
species and exposure conditions. Acute LC50s less than 50 µg
Cu/litre for fish generally are associated with test waters with low
DOC, low hardness, and neutral to slightly acidic pH. Sublethal
effects and effects on longer-term survival have been reported from 1
µg/litre to a few hundred µg/litre, with effects less than 50 µg
Cu/litre being reported for several species. Again, lower effect
concentrations are generally associated with test waters of high
bioavailability.
Because of the variability of toxic effects concentrations among
different biological taxa and exposure conditions, the expected
response of aquatic communities will be highly site specific. Table
25 provides a general summary of the nature of response expected for
various concentration ranges at sites with moderate to high
bioavailability similar to water used in most toxicity tests.
10.5.2 Terrestrial biota
10.5.2.1 Overview of exposure data
Copper in uncontaminated soils in Europe, USA, Canada and
elsewhere has been measured as total and extractable and with depth in
soils. The range of copper concentrations in such soils varies
between 0.3 and 250 mg/kg (Bowen, 1985; Adriano, 1992) with soil type
being a factor in determining the levels found. Peaty and organic
soils are at the upper end of this range, as are loams; sandy soils
are at the low end.
Any anthropogenic addition to the surface of such soils, whether
by fertilizer or fungicide applications or from highway dust or
airborne deposition from urban and industrial sources, causes sharp
increases in the copper levels of such soils. Copper added to provide
adequate levels for citrus crops or in orchards and vineyards from
fungicide and insecticide application causes a buildup in soils
(150-400 mg Cu/kg).
Table 25. Responses expected for various concentration ranges of coppera
Total dissolved Effects of high bioavailability in water
Cu concentration
range (µg/litre)
1-10 significant effects are expected for diatoms and sensitive
invertebrates, notably cladocerans. Effects on fish could be
significant in freshwaters with low pH and hardness
10-100 significant effects are expected on various species of
microalgae, some species of macroalgae, and a range of
invertebrates, including crustaceans, gastropods and sea
urchins. Survival of sensitive fish will be affected and a variety
of fish should show sublethal effects
100-1000 most taxonomic groups of macroalgae and invertebrates will
be severely affected. Lethal levels for most fish species will
be reached
> 1000 lethal concentrations for the most tolerant organisms are
reached
a Sites chosen have moderate to high bioavailability similar to water used in
most toxicity tests.
Mining and smelting activities, especially from copper or
copper-zinc smelters, often cause surface soil levels to exceed 1000
mg Cu/kg.
10.5.2.2 Plant foliar levels
Generally, vegetation rooted in soils reflects the soil copper
levels in its foliage. This is dependent upon the bioavailability of
the copper, and the physiological requirements of species concerned.
On uncontaminated soils foliar levels vary broadly in the range 6.1-25
mg/kg. For grazing animals and for much of the food chain, plant
foliar levels are of concern.
On soil contaminated by copper additions (in the range of 150-450
mg Cu/kg), the foliar levels may reach 80 mg Cu/kg, and in mining and
smelting area the copper level in foliage can reach 300 mg/kg.
Specific hyperaccummulator species can have foliar levels to 17 000 mg
Cu/kg without adverse symptoms.
On normal forest soils the nonrooted plants can have higher
copper concentrations. These species include mosses and lichens. The
fruiting bodies and mycorrhizal sheaths of soil fungi associated with
higher plants in forests often accumulate copper to much higher levels
than the higher plants at the same site, e.g. Lepp (1992) reports
copper concentrations in fungi up 469 mg/kg while foliage levels of
5-20 mg Cu/kg were measured at the same site.
10.5.2.3 Assessment of toxicity of copper in soil
Leaving aside the question of copper surface mineralization, at
the normal soil concentrations reported (0.3-250 mg Cu/kg) plants
rarely if ever show symptoms of toxicity or of adverse growth effects.
Crops are often more sensitive to copper than the native flora, so
protection levels for agricultural crops range from 25 mg Cu/kg to
several hundred mg/kg, depending on the country. Chronic and or acute
effects on sensitive species do occur at copper levels occurring in
some soils as a result of human activities, e.g. copper fertilizer
addition, fungicide spraying, sludge additions (50-150 mg Cu/kg).
When soil levels rise above 150 mg Cu/kg we begin to find more
and more native and agricultural species showing chronic effects.
Soils in the range 500-1000 mg Cu/kg act in a strongly selective way,
allowing only survival of copper-tolerant species or strains. A
reduction in species diversity occurs. By the time soil levels reach
2000 mg Cu/kg a high number of species cannot survive. By 3500 mg
Cu/kg areas are largely devoid of vegetation cover. Exceptions again
are the old-established copper-tolerant flora on major
mineralizations, e.g. in Zaire, Zimbabwe and Borneo.
Effects of copper in soil on terrestrial biota are reported at
concentrations ranging from approximately 4 to 7000 mg Cu/kg (chapter
9). With the exception of one study reporting a decrease in yield for
snap beans at 15 mg/kg (copper extracted with EDTA) (Walsh et al.,
1972) the most sensitive end-points were related to soil microbial
metabolism, measured as enzymatic activity and soil respiration. On
the basis of the data reviewed in this assessment, the organic content
of the soil appears to be a key factor affecting the bioavailability
of copper, thus strongly influencing its toxicity.
11. CONCLUSIONS AND RECOMMENDATIONS FOR PROTECTION OF HUMAN HEALTH
AND THE ENVIRONMENT
11.1 Human health
The lower limit of the AROI is 20 µg Cu/kg per day. This figure
is arrived at from the adult basal requirement with an allowance for
variations in copper absorption, retention and storage (WHO, 1996).
In infancy, this figure is 50 µg Cu/kg per day.
The upper limit of the AROI in adults is uncertain, but it is
most likely in the range of several but not many mg per day in adults
(more than 2 or 3 mg/day). This evaluation is based solely on studies
of gastrointestinal effects of copper-contaminated drinking-water. A
more specific value for the upper AROI could not be confirmed for any
segment of the general population. We have limited information on the
level of ingestion of copper from food that would provoke adverse
health effects.
The available data on toxicity in animals were considered
unhelpful in establishing the upper limit of the AROI, owing to
uncertainty about an appropriate model for humans. Moreover,
traditional methodology for safety assessment, based on application of
uncertainty factor to data in animals, does not adequately address the
special attributes of essential elements such as copper.
From available data on human exposures worldwide, but
particularly in Europe and the Americas, there is greater risk of
health effects from deficiency of copper intake than from excess
copper intake.
To increase the level of public health protection worldwide, it
is recommended that:
1. National and international nutritional guidelines are adhered to
in order to address potential copper deficiency.
2. Increased monitoring of the concentration of copper in
drinking-water and food should be carried out.
3. There should be increased awareness of the possibility that high
copper exposure of newborns may result in adverse health effects.
4. The development of population-based liver disease registries for
infant and childhood disease should be encouraged.
11.2 Environmental protection
Protection of aquatic life in waters with high bioavailability
will require limiting total dissolved copper to some concentration
less than 10 µg/litre (see Table 25); however, the appropriate
concentration limit will depend on the biota and exposure conditions
at sites of concern and should be set based on further evaluation of
relevant data.
At many sites, physicochemical factors limiting bioavailability
will warrant higher copper limits. Regulatory criteria should take
into account the speciation of copper if dischargers can demonstrate
that the bioavailability of copper in the receiving water can be
measured reliably.
When sampling and analysing environmental media for copper, it is
essential that clean techiques be employed.
Because copper is an essential element, procedures to prevent
toxic levels of copper should not incorporate safety factors that
result in desired concentrations being below natural levels.
12. FURTHER RESEARCH
12.1 Health protection
1. Determine the bioavailability of dietary copper, particularly in
vegetarian diets.
2. In human populations develop the methodology for identifying
adverse effects of marginal copper deficiency and of intakes in
excess of recommended levels. This should include an evaluation
of stable isotope technology to define bioavailability and body
stores of copper.
3. Determine the concentrations of copper and the other quality
parameters of drinking-water that produce toxicity from single
and chronic exposures (e.g. gastrointestinal effects).
4. Characterize the mechanisms that influence copper homoeostasis
including placental transfer of copper.
5. Studies on ICC populations to determine:
a) genetic component
b) relationship to ICT
c) mechanisms related to basic defect
d) methods for early diagnosis of ICC and ICT
12.2 Environmental protection
1. More research is needed to validate existing physicochemical
speciation techniques for copper and to develop improved methods.
These methods should be calibrated against suitable bioassays.
There is also a need for the development of more sensitive, rapid
bioassays for copper.
2. Predictive models should be developed for relating
bioaccumulation and toxic response to copper speciation and other
physicochemical factors that affect bioavailability and toxicity.
3. Insufficient data are available on the toxicity of copper to
benthic organisms and more studies are needed in this area.
4. Considerations should be given to the development of more
realistic soil toxicity tests that utilize "real" soils; possibly
of national relevance. Alternative and more appropriate
invertebrate test species should be investigated. Studies
correlating measures of copper bioavailability to body burden
should be undertaken.
13. PREVIOUS EVALUATIONS BY INTERNATIONAL BODIES
The International Agency for Research on Cancer evaluated copper
8-hydroxyquinoline in 1977 (IARC, 1977) and re-evaluated it in 1987
(IARC, 1987). The conclusions were that there are no data on the
carcinogenicity of copper 8-hydroxyquinoline in humans and
insufficient data in animals. It was, therefore, put into Group
3 - cannot be classified as to its carcinogenic risk to humans.
At the twenty-sixth meeting of the Joint FAO/WHO Expert Committee
on Food Additives and Food Contaminants, the previous recommendation
of 0.5 mg/kg body weight as an acceptable daily load for copper was
tentatively reconfirmed (WHO, 1982). A provisional tolerable daily
intake (PTDI) from all sources was established as 0.5 mg Cu/kg body
weight.
During the revisions of the WHO Drinking-water Guidelines
(WHO, 1989), copper was re-evaluated. Using the PTDI for copper
developed by JECFA (WHO, 1982) a provisional guideline value of 2 mg
Cu/litre was proposed (WHO, 1993).
REFERENCES
Achar ST, Raju VB, & Shriramachari S (1960) Indian childhood
cirrhosis. Trop Pediatr, 57: 744-758.
Adalsteinsson S (1994) Compensatory root growth in winter
wheat -- effects of copper exposure on root geometry and nutrient
distribution. J Plant Nutr, 17(9): 1501-1512.
Adamson M, Reiner B, Olsen JL, Goodman Z, Plotnick L, Bernardini I,
& Gahl WA (1992) Indian childhood cirrhosis in an American child.
Gastroenterology, 102(5): 1771-1777.
Adriano DC (1986) Trace elements in the terrestrial environment.
New York, Springer-Verlag.
Adriano DC ed. (1992) Biogeochemistry of trace metals. Boca Raton,
Florida, Lewis Publishers.
Agarwal K, Lahori VC, Mehta SK, Smith DG, & Bayai PC (1979)
Inheritance of Indian childhood cirrhosis. Hum Hered, 29: 82-89.
Agarwal K, Sharma A, & Talukder G (1990) Clastogenic effects of
copper sulphate on the bone marrow chromosomes of mice in vivo.
Mutat Res, 243: 1-6.
Ahsanullah M & Florence TM (1984) Toxicity of copper to the marine
amphipod Allorchestes compressa in the presence of water- and
lipid-soluble ligands. Mar Biol, 84: 41-45.
Al-Akel AS (1987) Behavioural and the physiological changes in
Oreochromis niloticus due to contamination of copper. Z Angew
Zool, 74(4): 479-487.
Alam MK & Maughan OE (1992) The effect of malathion, diazinon, and
various concentrations of zinc, copper, nickel, lead, iron, and
mercury on fish. Biol Trace Elem Res, 34(3): 225-236.
Alam I & Sadiq M (1989) Metal contamination of drinking-water from
corrosion of distribution pipes. Environ Pollut, 57: 167-178.
Alexander J & Aaseth J (1980) Biliary excretion of copper and zinc
in the rat as influenced by diethylmaleate, selenite and
diethyldithiocarbamate. Biochem Pharmacol, 29: 2129-2133.
Alfaro B & Heaton FW (1973) Relationships between copper, zinc and
iron in the plasma, soft tissue and skeleton of the rats during
copper deficiency. Br J Nutr, 29: 73-85.
Alikhan MA (1993) Differentiation in copper and nickel accumulation
in adult female and juvenile Porcellio spinicornis from
contaminated and uncontaminated sites in northeaster Ontario. Bull
Environ Contam Toxicol, 50: 922-928.
Alikhan MA, Bagatto G, & Zia S (1990) The crayfish as a biological
indicator of aquatic contamination by heavy metals. Water Res,
24: 1069-1076.
Aljajeh IA, Mughal S, Al-Tahou B, Ajrawi T, Ismail EA, & Nayak NC
(1994) Indian childhood cirrhosis-like liver disease in an Arab
child: A brief report. Virchow Arch, A424: 225-227.
Allard B, Hakansson K, Karlsson S, & Sigas E (1991) A field study
of diffusion controlled migration of copper, zinc and cadmium in a
clay formation. Water Air Soil Pollut, 57/58: 259-268.
Allen HE & Brisbin TD (1980) Prediction of bioavailability of
copper in natural waters. Thalassia Jugosl, 16: 331-334.
Allen HE & Hansen DJ (1996) The importance of trace metal
speciation to water quality criteria. Water Environ Res, 68(1):
42-54.
Allison JD, Brown DS, & Novo-Gradac KJ (1991) MINTEQA2/PRODEFA2, a
geochemical assessment model for environmental systems: version 3.0
user's manual. Washington, DC, US Environmental Protection Agency
(EPA/600/3-91/021).
Al-Rashid RA & Spangler J (1971) Neonatal copper deficiency. N Engl
J Med, 285: 841-843.
Alt ER, Sternlieb I, & Goldfischer S (1990) The cytopathology of
metal overload. Int Rev Exp Pathol, 31: 165-188.
Alva AK & Chen EQ (1995) Effects of external copper concentrations
on uptake of trace elements by citrus seedlings. Soil Sci, 159(1):
59-64.
Anderson JR, Aggett FJ, Buseck PR, Germani MS, & Shattuck TW (1988)
Chemistry of individual aerosol particles from Chandler, Arizona,
an arid urban environment. Environ Sci Technol, 22: 811-888.
Anderson BS, Middaugh DP, Hunt JW, & Turpen SL (1991) Copper
toxicity to sperm, embryos and larvae of topsmelt Atherinops
affinis, with notes on induced spawning. Mar Environ Res, 31:
17-35.
Anderson BS, Hunt JW, McNulty HR, Turpen SL, & Martin M (1994)
Off-season spawning and factors influencing toxicity test
development with topsmelt Atherinops affinis. Environ Toxicol
Chem, 13: 479-485.
Angelone M & Bini C (1992) Trace element concentrations in soils
and plants of Western Europe. In: Adriano CD ed. Biogeochemistry of
trace metals. Boca Raton, Florida, Lewis Publishers, pp 19-60.
Anke M (1991) Trace element intake (zinc, manganese, copper,
molybdenum, codine, and nickel) of humans in Thuringia and
Brandenburg of the Federal Republic of Germany. J Trace Elem
Electrolytes Health Dis, 5: 69-74.
Ankley GT, Phipps GL, Leonard EN, Benoit DA, Mattson VR, Kosian PA,
Cotter AM, Dierkkes JR, Hansen DJ, & Mahony JD (1991) Acid-volatile
sulfide as a factor mediating cadmium and nickel bioavailability in
contaminated sediments. Environ Toxicol Chem, 10: 1299-1307.
Aoyagi S & Baker DH (1994) Copper-amino acid complexes are
partially protected against inhibitory effects of L-cysteine and
L-ascorbic acid on copper absorption in chicks. J Nutr, 124(3):
388-395.
Arillo A, Calamari D, Margiocco C, Melodia F, & Mensi P (1984)
Biochemical effects of long-term exposure to cadmium and copper on
rainbow trout (Salmo gairdneri): validation of water quality
criteria. Ecotoxicol Environ Saf, 8: 106-117.
Armstrong CW, Moore LW, Hackler RL, Miller GB, & Stroube RB (1983)
An outbreak of metal fume fever: Diagnostic use of urinary copper
and zinc determinations. J Occup Med, 25: 886-888.
Arnon DI & Stout PR (1939) The essentiality of certain elements in
minute quantity for plants with special reference to copper. Plant
Physiol, 14: 371-375.
Arthur JW & Leonard EN (1970) Effects of copper on
Gammarus pseudolimnaeus, Physa integra, and Campeloma decisum
in soft water. J Fish Res Board Can, 27: 1277-1283.
Aschengrau A, Zierler S, & Cohen A (1989) Quality of community
drinking water and the occurrence of spontaneous abortion. Arch
Environ Health, 44: 283-290.
Ash CPJ & Lee DL (1980) Lead, cadmium, copper and iron in
earthworms from roadside sites. Environ Pollut, A22: 59-67.
Ashkenazi A, Levin S, Djaldetti M, Fishel E, & Benvenisti D (1973)
The syndrome of neonatal copper deficiency. Pediatrics, 52:
525-533.
Ashmead HDW, Graff DJ, & Ashmead HH (1985) Intestinal absorption of
metal ions and Chelates. Springfield, Illinois, Charles C. Thomas,
p 68.
Askari A, Wang Y, Xie Z, Huang WH, Klauning JE, & Sakari A (1990)
Superoxide dismutase activity of copper deficient cardiac myocites.
FASEB J, 4: A392.
Assaad FF & Nielsen JD (1984) A thermodynamic approach for copper
adsorption on some Danish arable soils. Acta Agric Scand, 34:
377-385.
ATSDR (1990) Toxicological profile for copper. Atlanta, Georgia,
Agency for Toxic Substances and Disease Registry (TP-90-08).
August D, Janghorbani M, & Young VR (1989) Determination of zinc
and copper absorption at three dietary Zn-Cu ratios by using stable
isotope methods in young adult and elderly subjects. Am J Clin
Nutr, 50: 1457-1463.
Aulerich RJ & Ringer RK (1976) Feeding copper sulfate: Could it
have benefits in nutrition of mink? US Fur Rancher, 56(12): 4.
Aulerich RJ, Ringer RK, Bleavins MR, & Napolitano A (1982) Effects
of supplemental dietary copper on growth, reproductive performance
and kit survival of standard dark mink and the acute toxicity of
copper to mink. J Anim Sci, 55: 337-343.
Bagatto G, Crowder AA, & Shorthouse JD (1993) Concentrations of
metals in tissues of lowbush blueberry (Vaccinium angustifolium)
near a copper-nickel smelter at Sudbury, Ontario, Canada: a factor
analytic approach. Bull Environ Contam Toxicol, 51: 600-604.
Baird DJ, Barber I, Bradley M, Soares AMVM, & Calow P (1991) A
comparative study of genotype sensitivity to acute toxic stress
using clones of Daphnia magna Straus. Ecotoxicol Environ Saf, 21:
257-265.
Baker AJM & Brooks RR (1989) Terrestrial higher plants which
hyperaccumulate metallic elements. A review of their distribution,
ecology and phytochemistry. Biorecovery, 1: 81-126.
Baker DH & Czarnecki-Maulden GL (1987) Pharmacologic role of
cysteine in ameliorating or exacerbating mineral toxicities. J
Nutr, 117: 1003-1010.
Baker EK & Harris PT (1991) Copper, lead, and zinc distribution in
the sediments of the Fly River Delta and Torres Strait. Mar Pollut
Bull, 22(12): 614-618.
Baker EK, Harris PT, & Beck RW (1990) Cu and Cd associated with
suspended particulate matter in Torres Strait. Mar Pollut Bull,
21(10): 484-486.
Baker A, Gormally S, Saxena R, Baldwin D, Drumm B, Bonham J,
Portmann B, & Mowat AP (1995) Copper-associated liver disease in
childhood. J Hepatol, 23(5): 538-543.
Baldwin S, Deaker M, & Maher W (1994) Low-volume microwave
digestion of marine biological tissues for the measurement of trace
elements. Analyst, 119: 1701-1704.
Balsberg Påhlsson A-M (1989) Toxicity of heavy metals (Zn, Cu, Cd,
Pb) to vascular plants. Water Air Soil Pollut, 47: 287-319.
Balthrop JE, Dameron CT, & Harris ED (1982) Comparison of pathways
of copper metabolism in aorta and liver. Biochem J, 204: 541-548.
Bankier A (1995) Menkes disease. J Med Genet, 32(3): 213-215.
Baranowska I, Czernicki K, & Aleksandrowicz R (1995) The analysis
of lead, cadmium, zinc, copper and nickel content in human bones
from the upper Silesian industrial district. Sci Total Environ,
159: 155-162.
Barclay SM, Aggett PJ, Lloyd DJ, & Duffty P (1991) Reduced
erythrocyte superoxide dismutase activity in low birth weight
infants given iron supplements. Pediatr Res, 29: 297-301.
Barnes G & Frieden E (1984) Ceruloplasmin receptors of
erythrocytes. Biochem Biophys Res Commun, 125: 157-162.
Batley GE, Scammell MS, & Brockbank CI (1992) The impact of the
banning of tributyltin-based antifouling paints on the Sydney rock
oyster, Saccostrea commercialis. Sci Total Environ, 122: 301-314.
Baudouin MF & Scoppa P (1974) Acute toxicity of various metals to
freshwater zooplankton. Bull Environ Contam Toxicol, 12(6):
745-751.
Bayley M, Baatrup E, Heimbach U, & Bjerregaard P (1995) Elevated
copper levels during larval development cause altered locomotor
behavior in the adult carabid beetle Pterostichus cupreus L.
(Coleoptera: Carabidae). Ecotoxicol Environ Saf, 32: 166-170.
Bearn AG (1960) A genetical analysis of thirty families with
Wilson's disease (hepatolenticular degeneration). Ann Hum Genet,
24: 33-43.
Bearn AG & Kunkel HG (1964) Localization of Cu64 in serum fractions
following oral administration: An alteration in Wilson's disease.
Proc Soc Exp Biol Med, 85: 44-48.
Beary ES, Paulsen PJ, & Fassett JD (1994) Sample preparation
approaches for isotope dilution inductively coupled plasma mass
spectrometric certification of reference materials. J Anal At
Spectrosc, 9: 1363-1369.
Beaumont AR, Tserpes G, & Budd MD (1987) Some effects of copper on
the veliger larvae of the mussel Mytilus edulis and the scallop
Pecten maximus (Mollusca, Bivalvia). Mar Environ Res, 21:
299-309.
Bechmann RK (1994) Use of life tables and LC50 tests to evaluate
chronic and acute toxicity effects of copper on the matine copepod
Tisbe furcata (Baird). Environ Toxicol Chem, 13: 1509-1517.
Becker W & Kumpulainen J (1991) Contents of essential and toxic
mineral elements in Swedish market-basket diets in 1987. Br J Nutr,
66: 151-160.
Beckett PHT & Davis RD (1977) Upper critical levels of toxic
elements in plants. New Phytol, 79: 95-106.
Beckett PHT & Davis RD (1978) The additivity of the toxic effects
of Cu, Ni and Zn in young barley. New Phytol, 81: 155-173.
Beckman BR & Zaugg WS (1988) Copper intoxication in chinook salmon
(Oncorhynchus tshawytscha) induced by natural springwater:
effects on gill Na+, K+-ATPase, hematocrit, and plasma glucose. Can
J Fish Aquat Sci, 45: 1430-1435.
Béguin-Bruhin Y, Escher F, Solms J, & Roth HR (1983) [Threshold
concentration of copper in drinking-water.] Lebensm. Wiss Technol,
16: 22-26 (in German).
Belanger SE, Farris JL, & Cherry DS (1989) Effects of diet, water
hardness, and population source on acute and chronic copper
toxicity to Ceriodaphnia dubia. Arch Environ Contam Toxicol, 18:
601-611.
Bello MA, Callejon M, Jimenez JC, Pablos F, & Ternero M (1994)
Determination of heavy metals in estuarine sediments by acid
digestion and atomic absorption spectrometry. Toxicol Environ Chem,
44: 203-210.
Benedetti I, Albano AG, & Mola L (1989) Histomorphological changes
in some organs of the brown bullhead, Ictalurus nebulosus
LeSueur, following short- and long-term exposure to copper. J Fish
Biol, 34: 273-280.
Bengtsson G, Gunnarsson T, & Rundgren S (1983) Growth changes
caused by metal uptake in a population of Onychiurus armatus
(Collembola) feeding on metal polluted fungi. Oikos, 40: 216-225.
Bengtsson G, Gunnarsson T, & Rundgren S (1986) Effects of metal
pollution on the earthworm Dendrobaena rubida (Sav.) in acidified
soils. Water Air Soil Pollut, 28: 361-383.
Benoit DA (1975) Chronic effects of copper on survival, growth, and
reproduction of the bluegill (Lepomis macrochirus). Trans Am Fish
Soc, 104: 353-358.
Berg R & Lundh S (1981) Copper contamination of drinking-water as
a cause of diarrhea in children. Halsovardskontakt, 1: 6-10.
Berger B & Dallinger R (1989) Accumulation of cadmium and copper by
the terrestrial snail arianta arbustorum L.: Kinetics and
budgets. Oecologia, 79: 60-65.
Berggren D (1992) Speciation of copper in soil solutions from
podzols and cambisols of S. Sweden. Water Air Soil Pollut, 62:
111-123.
Berk SG, Gunderson JH, & Derk LA (1985) Effects of cadmium and
copper on chemotaxis of marine and freshwater ciliates. Bull
Environ Contam Toxicol, 34: 897-903.
Besser JM, Ingersol CG, & Giesy JP (1996) Effects of spatial and
temoral variation of acid-volatile sulfide on the bioavailability
of copper and zinc in freshwater sediments. Environ Toxicol Chem,
15: 286-293.
Bettger WJ, Fish TJ, & O'dell BL (1978) Effects of copper and zinc
status of rats on erythrocyte stability and superoxide dismutase
activity. Proc Soc Exp Biol Med, 158(2): 279-282.
Beyer WN, Pattee OH, Sileo L, Hoffman DJ, & Mulhern BM (1985) Metal
contamination in wildlife living near two zinc smelters. Environ
Pollut, A38: 63-86.
Bhagwat AG & Walia BNS (1980) Indian childhood cirrhosis: A
commentary. Indian J Pediatr, 48: 433-437.
Bhave S, Pandit AN, Pradhan AM, Sidhaye DG, Kantarjian A, Williams
A, Talbot IC, & Tanner MS (1982) Paediatric liver disease in India.
Arch Dis Child, 57(12): 922-928.
Bhave SA, Sidhaye DG, Pandit AN, & Tanner MS (1983) Incidence and
clinical features of Indian childhood cirrhosis. Indian Pediatr,
20: 741-746.
Bhave SA, Pandit AN, Singh S, Walia BNS, & Tanner MS (1992) The
prevention of Indian childhood cirrhosis Ann Trop Paediatr, 12:
23-30.
Bhunya SP & Pati PC (1987) Genotoxicity of an inorganic pesticide,
copper sulphate in mouse in vivo test system. Cytologia,
52: 801-808.
Bidwell RGS (1979) Plant physiology, 2nd ed. New York, MacMillan
Publishing Company, 726 pp.
Biesinger KE & Christensen GM (1972) Effects of various metals on
survival, growth, reproduction, and metabolism of Daphnia magna.
J Fish Res Board Can, 29: 1691-1700.
Bionetics Research Lab (1968) Evaluation of carcinogenic,
teratogenic and mutagenic activities of selected pesticides and
industrial chemicals -- Volume 1: Carcinogenic study. Bionetics
Research Laboratories (Prepared for the National Cancer Institute,
Bethesda, Maryland, USA) (PB-223-159).
Blaise C, Forghani R, Legault R, Guzzo J,& Dubow MS (1994) A
bacterial toxicity assay performed with microplates,
microluminometry and Microtox reagent. Biotechniques, 16: 932-937.
Blakley BR & Hamilton DL (1985) Ceruloplasmin as an indicator of
copper status in cattle and sheep. Can J Comp Med, 49: 405-408.
Bligh SW, Boyle HA, McEwen AB, Sadler PJ, & Woodham RH (1992) 1H
NMR studies of reactions of copper complexes with human blood
plasma and urine. Biochem Pharmacol, 43: 137-145.
Bloom NS & Crecelius EA (1984) Determination of silver in sea water
by coprecipitation with cobalt pyrrolidinedithio-carbamate and
zeeman graphite furnace atomic absorption spectrometry. Anal Chim
Acta, 156: 139-145.
Bodar CWM, Zee AVD, Voogt PA, Wynne H, & Zander DI (1989) Toxicity
of heavy metals to early life stages of Daphnia magna. Ecotoxicol
Environ Saf, 17: 333-338.
Bodek I, Lyman WJ, Reehl WF, & Rosenblatt DH (1988) Environmental
inorganic chemistry: Properties, processes and estimation methods.
New York, Pergamon Press, 9 pp (SETAC Special Publications Series).
Borgmann U & Ralph KM (1984) Copper complexation and toxicity to
freshwater zooplankton. Arch Environ Contam Toxicol, 13: 403-409.
Borgmann U (1983) Metal speciation and toxicity of free metal ions
to aquatic biota. In: Nriagu JO ed. Aquatic toxicology. New York,
John Wiley & Sons Ltd, pp 47-72.
Borgmann U & Charlton CC (1984) Copper complexation and toxicity to
Daphnia in natural waters. J Great Lakes Res, 10: 393-398.
Borgmann U & Ralph KM (1983) Complexation and toxicity of copper
and the free metal bioassay technique. Water Res, 17: 1697-1703.
Borszeki J, Halmos P, Gegus E, & Karpati P (1994) Application of
pressurized sample preparation methods for the analysis of steels
and copper alloys. Talanta, 41: 1089-1093.
Bowen HJM (1985) The natural environment and the biogeochemical
cycles. In: Hutzinger D ed. Handbook of environmental chemistry.
New York, Basel, Springer-Verlag, pp 1-26.
Boyle EA, Sclater FR, & Edmond JM (1977) The distribution of
dissolved copper in the pacific. Earth Planet Sci Lett, 37: 38-54.
Bradley SB & Cox JJ (1988) The potential availability of cadmium,
copper, iron, lead, manganese, nickel and zinc in standard river
sediment (NBS 1645). Environ Technol Lett, 9: 733-739.
Bremner I (1987) Involvement of metallothionein in the hepatic
metabolism of copper: Critical review. J Nutr, 117: 19-29.
Bremner JM & Douglas LA (1971) Inhibition of urease activity in
soils. Soil Biol Biochem, 3: 297-307.
Brenner A & Harris ED (1995) A quantitative test for copper using
bichinchioninc acid. Anal Biochem, 226: 80-84.
Brewer GJ, Hill GM, Prasad AS, Cossack ZT, & Rabbani P (1983) Oral
zinc therapy for Wilson's disease. Ann Intern Med, 99: 314-320.
Bro S, Sandstrom B, & Heydorn K (1990) Intake of essential and
toxic trace elements in a random sample of Danish men as determined
by duplicate portion sampling technique. J Trace Elem Electrolytes
Health Dis, 4: 147-155.
Brooks RR, McCleave JA, & Malaisse F (1977) Copper and cobalt in
African species of Crotalaria L. Proc R Soc Ser B, 197: 231-236.
Brooks RR, Reeves RD, Morrison RS, & Malaisse F (1980)
Hyperaccumulation of copper and cobalt. A review. Bull Soc R Bot
Belg, 113: 166-172.
Brooks RR, Baker AJM, & Malaisse F (1992) Copper flowers. Natl
Geogr Res Explor, 8: 338-351.
Brown BT & Rattigan BM (1979) Toxicity of soluble copper and other
metal ions to Elodea canadensis. Environ Pollut, 20: 303-314.
Brown KW, Thomas JC, & Slowey JF (1983) The movement of metals
applied to soils in sewage effluents. Water Air Soil Pollut, 19:
43-54.
Bruland KW (1980) Oceanographic distributions of cadmium, zinc,
nickel, and copper in the North Pacific. Earth Planet Sci Lett, 47:
176-198.
Bruland KW, Coale KH, & Mart L (1985) Analysis of seawater for
dissolved cadmium copper and lead: an intercomparison of
voltammetric and atomic absorption methods. Mar Chem, 17: 285-300.
Brungs WA, Geckler JR, & Gast M (1976) Acute and chronic toxicity
of copper to the fathead minnow in a surface water of variable
quality. Water Res, 10: 37-43.
Bryan GW & Hummerstone LG (1973) Brown seaweed as an indicator of
heavy metals in estuaries in South-West England. J Mar Biol Assoc
(UK), 53: 705-720.
Bryan GW & Langston WJ (1992) Bioavailability, accumulation and
effects of heavy metals in sediments with special reference to
United Kingdom estuaries: a review. Environ Pollut, 76: 89-131.
Bubb JM & Lester JN (1994) Anthropogenic heavy metal inputs to
lowland river systems, a case study. The River Stour, UK Water Air
Soil Pollut, 78: 279-296.
Bubb JM, Rudd T, & Lester JN (1991) Distribution of heavy metals in
the river Yare and its associated broads: II. Copper and cadmium.
Sci Total Environ, 102: 169-188.
Bucholtz CF (1816) [Chemical study of the vanilla shoot
(Siliqua vanillae).] Report Pharm, 2: 253 (in German).
Buck WB, Osweiler GD, & Van Gelder GA (1976) Clinical and
diagnostic veterinary toxicology, 2nd ed. Dubuque, Iowa,
Kendell/Hunt Publishing Co., 380 pp.
Buckley JA (1983) Complexation of copper in the effluent of a
sewage-treatment plant and an estimate of its influence on toxicity
to coho salmon. Water Res, 17(12): 1929-1934.
Buckley PJM & van den Berg CMG (1986) Copper complexation profiles
in the Atlantic Ocean: A comparative study using electrochemical
and ion exchange techniques. Mar Chem, 19: 281-296.
Buckley JT, Roch M, McCarter JA, Rendell CA, & Matheson AT (1982)
Chronic exposure of coho salmon to sublethal concentrations of
copper: I. Effect on growth, on accumulation and distribution of
copper, and on copper tolerance. Comp Biochem Physiol, 72C: 15-19.
Buhl KJ & Hamilton SJ (1990) Comparative toxicity of inorganic
contaminants released by placer mining to early life stages of
salmonids. Ecotoxicol Environ Saf, 20: 325-342.
Bull PC, Thomas GR, Rommens JM, Forbes JR, & Cox DW (1993) The
Wilson disease gene is a putative copper transporting P-type ATPase
similar to the Menkes gene. Nat Genet, 5: 327-337.
Burguera JL, Burguera M, & Brunetto MR (1993) In vivo sample
uptake and on-line measurement of zinc and copper in whole blood by
microwave-assisted mineralization and flow injection AAS. At
Spectrosc, 14: 90-94.
Burki HR & Okita GT (1969) Effect of oral copper sulfate on
7,12-dimethyl-benz(alpha)anthracene carcinogenesis in mice. Br J
Cancer, 23: 591-596.
Burns LV & Parker GH (1988) Metal burdens in two species of
fiddleheads growing near the nore smelters at Sudbury, Ontario,
Canada. Bull Environ Contam Toxicol, 40: 717-723.
Burton GA (1987) Occurrence of bacterial resistance to arsenite,
copper, and selenite in adverse habitats. Bull Environ Contam
Toxicol, 39: 990-997.
Burton DT & Fisher DJ (1990) Acute toxicity of cadmium, copper,
zinc, ammonia, 3,3'-dichlorobenzidine, 2,6-dichloro-4-nitroaniline,
methylene chloride, and 2,4,6-trichlorophenol to juvenile grass
shrimp and killifish. Bull Environ Contam Toxicol, 44: 776-783.
Burton KW, Morgan E, & Roig A (1986) Interactive effects of
cadmium, copper and nickel on the growth of Sitka spruce and
studies of metal uptake from nutrient solutions. New Phytol, 103:
549-557.
Cabrera F, Soldevilla M, Cordon R, & De Arambarri P (1987) Heavy
metal pollution in the Guadiamar river and Guadalquivir estuary
(South west Spain). Chemosphere, 16(2-3): 463-468.
Callahan M, Slimak M, Gabel N, May I, Fowler C, Freed R, Jennings
P, Durfee R, Whitmore F, Maestri B, Mabey W, Holt B, & Gould C
(1979) Copper. In: Water-related environmental fate of 129 priority
pollutants. Washington, DC, US Environmental Protection Agency,
Office of Water Planning and Standards.
Calmano W, Hong J, & Förstner U (1993) Binding and mobilization of
heavy metals in contaminated sediments affected by pH and redox
potential. Water Sci Technol, 28: 223-235.
Campanella L, Ferri T, & Petronio BM (1989) Effect of speciation in
sludges on the adsorption of leached metals from soil. Sci Total
Environ, 79: 223-231.
Campbell PGC (1995) Interactions between trace metals and aquatic
organisms: a critique of the free-ion activity model. In: Tessier
A & Turner DR ed. Metal speciation and bioavailability in aquatic
systems New York, John Wiley & Sons Ltd, pp 45-102.
Camusso M, Tartari G, & Cappelletti E (1989) Seasonal trends of
copper sedimentation in Lake Orta (Italy). Sci Total Environ,
87/88: 59-75.
Cannon HL, Connally GC, Epstein JB, Parker JG, Thornton I, & Wixson
G (1978) Rocks: geological sources of most trace elements. Report
to the workshop at South Seas plantation, Captiva Islands, FL, US.
Geochem Environ, 3: 17-31.
Carbon C (1996) Good chemistry goes to waste. Chem Aust, April:
187-188.
Carlson AR, Nelson H, & Hammermeister D (1986) Development and
validation of site-specific water quality criteria for copper.
Environ Toxicol Chem, 5: 997-1012.
Carlson-Ekvall CEA & Morrison GM (1995) Toxicity of copper in the
presence of organic substances in sewage sludge. Environ Technol,
16: 243-251.
Carlton WW & Price PS (1973) Dietary copper and the induction of
neoplasms in the rat by acetylaminofluorene and
dimethylnitrosamine. Food Cosmet Toxicol, 11: 827-840.
Carry MT, Galiazzo F, Ciriolo MR, & Rotilio G (1991) Evidence of
co-regulation of Cu, Zn superoxide dismutase and metallothionein
gene expression in yeast through transcriptional control by copper
via the ACE1 factor. FEBS Lett, 2278: 263-266.
Castillo-Duran C & Uauy R (1988) Copper deficiency impairs growth
of infants recovering from malnutrition. Am J Clin Nutr, 47:
710-714.
Castillo-Duran C, Fishberg M, Valenzuela A, Egaña JI, & Uauy R
(1983) Controlled trial of copper supplementation during the
recovery from marasmus. Am J Clin Nutr, 37: 898-903.
Castillo-Duran C, Vial P, & Uauy R (1988) Trace mineral balance
during acute diarrhea in infants. J Pediatr, 113: 452-457.
Cavallo F, Gerber M, Marubini E, Richardson S, Barbieri A, Costa A,
DeCarli H, & Pujol A (1991) Zinc and copper in breast cancer: A
joint study in Northern Italy and Southern France. Cancer, 67:
738-745.
Cavell PA & Widdowson EM (1964) Intakes and excretions of iron,
copper, and zinc in the neonatal period. Arch Dis Child, 39:
496-501.
Centeno MDF, Brendonck L, & Persoone G (1993) Acute toxicity tests
with Streptocephalus proboscideus (Crustacea: Branchiopoda:
Anostraca): influence of selected environmental conditions.
Chemosphere, 27: 2213-2224.
Çetinkaya N, Çetinkaya D, & Yüce M (1988) Serum copper, zinc
levels, and copper: Zinc ratio in healthy women and women with
gynecological tumors. Biol Trace Elem Res, 18: 29-38.
Chakoumakos C, Russo RC, & Thurston RV (1979) Toxicity of copper to
cutthroat trout (Salmo clarki) under different conditions of
alkalinity, pH, and hardness. Environ Sci Technol, 13(2): 213-219.
Chakrabarti CL, Lu Y, Cheng J, Back MH, & Schroeder WH (1993)
Studies on metal speciation in the natural environment. Anal Chim
Acta, 267: 47-64.
Chakrabarti CL, Lu YJ, Gregoire DC, Back MH, & Schroeder WH (1994)
Kinetic studies of metal speciation using chelex cation exchange
resin-application to cadmium, copper, and lead speciation in river
water and snow. Environ Sci Technol, 28: 1957-1967.
Chan WH, Tank AJS, Chung DHS, & Lusis MA (1986) Concentration and
deposition of trace metals in Ontario -- 1982. Water Air Soil
Pollut, 29: 373-389.
Chandra RK (1976) ICC geneologic data, alpha-foetoprotein MbsAg &
circulating immune complexes. Trans R Soc Trop Med Hyg, 70:
296-301.
Chang F-H & Broadbent FE (1981) Influence of trace metals on carbon
dioxide evolution from a Yolo soil. Soil Sci, 132: 416-421.
Chapman GA (1978) Toxicities of cadmium, copper, and zinc to four
juvenile stages of chinook salmon and steelhead. Trans Am Fish Soc,
107(6): 841-847.
Chapman GA & Stevens DG (1978) Acutely lethal levels of cadmium,
copper, and zinc to adult male coho salmon and steelhead. Trans Am
Fish Soc, 107(6): 837-840.
Chawla V, Chandra RK, Verma IC, & Ghai OP (1973) An epidemiological
approach to Indian Childhood cirrhosis. Indian Pediatr, 10: 73-79.
Chelly J, Tumer Z, Tonnesen T, Petterson A, Ishikawa-Brush Y,
Tommerup N, Horn N, & Monaco AP (1993) Isolation of a candidate
gene for Menkes disease that encodes a potential heavy metal
binding protein see comments. Nat Genet, 3: 14-19.
Chen L, Li G, & Ren Y (1990) Reoxygenation injured of cultured
neonatal rat myocardial cells and protective effects of selenium,
copper and zinc. Zhonghua Yixue Zashi, 70: 221-223.
Chen LC, Peoples SM, & Amdur MO (1991) Pulmonary effects of sulfur
oxides on the surface of copper oxide aerosol. Am Indl Hyg Assoc J,
52: 187-191.
Chen J, Geissler C, Parpia B, Li J, & Campbell TC (1992)
Antioxidant status and cancer mortality in China. Int J Epidemiol,
21: 625-635.
Chen R, Wei L, & Huang H (1993) Mortality from lung cancer among
copper miners. Br J Ind Med, 50: 505-509.
Cheng J, Chakrabarti CL, Back MH, & Schroeder WH (1994) Chemical
speciation of Cu, Zn, Pb and Cd in rain water. Anal Chim Acta, 288:
141-156.
Chester R & Murphy KJT (1986) Oceanic sources of copper to the
Atlantic aerosol. Sci Total Environ, 49: 325-338.
Christensen ER, Scherfig J, & Dixon PS (1979) Effects of manganese,
copper and lead on Selenastrum capricornutum and
Chlorella stigmatophora. Water Res, 13: 79-92.
Christie P & Beattie JAM (1989) Grassland soil microbial biomass
and accumulation of potentially toxic metals from long-term slurry
application. J Appl Ecol, 26: 597-612.
Chugh KS, Sharma BK, Singhal PC, Das KC, & Datta BN (1977) Acute
renal failure following copper sulphate intoxication. Postgrad Med
J, 53(615): 18-23.
Chung IK & Brinkhuis BH (1986) Copper effects in early stages of
the kelp, Laminaria saccharina. Mar Pollut Bull, 17(5): 213-218.
Chuttani HK, Gupta PS, Gulati S, & Gupta DN (1965) Acute copper
sulfate poisoning. Am J Med, 39: 849-854.
Claisse D & Alzieu C (1993) Copper contamination as a result of
antifouling paint regulations? Mar Pollut Bull, 26(7): 395-397.
Clark JB (1953) The mutagenic action of various chemicals on
Micrococcus aureus. Proc Okla Acad Sci, 34: 114-118.
Clarkson DT & Hanson JB (1980) The mineral nutrition of higher
plants. Annu Rev Plant Physiol, 31: 239-298.
Claveri B, Morhain E, & Mouvet C (1994) A methodology for the
assessment of accidental copper pollution using the aquatic moss
Rhynchostegium riparioides. Chemosphere, 28: 2001-2010.
Clements WH, Cherry DS, & Cairns J Jr (1988) Structural alterations
in aquatic insect communities exposed to copper in laboratory
streams. Environ Toxicol Chem, 7: 715-752.
Clements WH, Farris JL, Cherry DS, & Cairns J (1989) The influence
of water quality on macroinvertebrate community responses to copper
in outdoor experimental streams. Aquat Toxicol, 14: 249-262.
Clements WH, Cherry DS, & Cairns J Jr (1990) Macroinvertebrate
community responses to copper in laboratory and field experimental
streams. Arch Environ Contam Toxicol, 19: 361-365.
Coale KH & Bruland KW (1988) Copper complexation in the northeast
Pacific. Limnol Oceanogr, 33: 1084-1101.
Coates RJ, Weiss NS, Daling JR, Rettmer RL, & Warnick GR (1989)
Cancer risk in relation to serum copper levels. Cancer Res, 49:
4353-4356.
Codina JC, Pérez-García A, Romero P, & De Vicente A (1993) A
comparison of microbial bioassays for the detection of metal
toxicity. Arch Environ Contam Toxicol, 25: 250-254.
Cohen JM, Kamphake LJ, Harris EK, Woodward RL (1960) Taste
threshold concentrations of metals in drinking-water. J Am Water
Works Assoc, 52: 660-670.
Cohen NL, Keen CL, Lönnerdal B, &Hurley LS (1985a) Effects of
varying dietary iron on the expression of copper deficiency in the
growing rat: anemia, ferroxidase I and II, tissue trace elements,
ascorbic acid, and exanthine dehydrogenase. J Nutr, 115: 633-649.
Cohen N, Keen CL, Hurley LS, & Lönnerdal B (1985b) Determinants of
copper-deficiency anemia in rats. J Nutr, 115: 710-725.
Collvin L (1985) The effect of copper on growth, food consumption
and food conversion of perch Perca fluviatilis L. offered maximal
food rations. Aquat Toxicol, 6: 105-113.
Collyard SA, Ankley GT, Hoke RA, & Goldenstein T (1994) Influence
of age on the relative sensitivity of Hyalella azteca to
diazinon, alkylphenol ethoxylates, copper, cadmium, and zinc. Arch
Environ Contam Toxicol, 26: 110-113.
Combs GE, Ammerman CB, Shirley RL, & Wallace HD (1966) Effect of
source and level of dietary protein on pigs fed high copper
rations. J Anim Sci, 25(3): 613-616.
Cordano A, Baertl J, & Graham GG (1964) Copper deficiency in
infants. Pediatrics, 34: 324-336.
Correa JA, González P, Sánchez P, Muñoz J, & Orellana MC (1996)
Copper-algae interactions: inheritance or adaptation? Environ Monit
Assess, 40: 41-54.
Cossu P, Pirastu M, Nucaro A, Figus A, Balestrieri A, Borrone C,
Giacchino R, Devoto M, Monni G, & Cao A (1992) prenatal diagnosis
of Wilson's disease by analysis of DNA polymorphism. N Engl J Med,
326: 57.
Cotton FA & Wilkinson G (1989) Advanced inorganic chemistry. New
York, John Wiley & Sons Ltd, pp 755-775.
Couillard Y, Ross P, & Pinel-Alloul B (1989) Acute toxicity of six
metals to the rotifer Brachionus calyciflorus, with comparisons
to other freshwater organisms. Toxicol Assess, 4: 451-462.
Cousins RJ (1985) Absorption, transport, and hepatic metabolism of
copper and zinc: Special reference to metallothionein and
ceruloplasmin. Phys Rev, 65: 238-309.
Cowgill UM & Milazzo DP (1991) Comparison of the effect of metallic
copper and copper nitrate (CU(CNO-3)2.3H2O) on Ceriodaphnia
dubia utilizing the three-brood test. Bull Environ Contam Toxicol,
46: 141-145.
Cox DW (1995) Genes of the copper pathway. Am J Hum Genet, 56:
828-834.
Crecelius EA, Hardy JT, Gibson CI, Schmidt RL, Apts CW, Gurtisen
JM, & Joyce SP (1982) Copper bioavailability to marine bivalves and
shrimp: relationship to cupric ion activity. Mar Environ Res, 6:
13-26.
Cumings JN (1948) The copper and iron content of brain and liver in
the normal and in hepato-lenticular degeneration. Brain, 71:
410-415.
Curtis MW, Copeland TL, & Ward CH (1979) Acute toxicity of 12
industrial chemicals to freshwater and saltwater organisms. Water
Res, 13: 137-141.
Cusimano RF, Brakke DF, & Chapman GA (1986) Effects of pH on the
toxicities of cadmium, copper, and zinc to steelhead trout
(Salmo gairdneri). Can J Fish Aquat Sci, 43: 1497-1503.
Dabek JT, Hyvonen-Dabek M, Harkonen M, & Adlercreutz H (1992)
Evidence for increased non-ceruloplasmin copper in early-stage
human breast cancer serum. Nutr Cancer, 17: 195-201.
Dallinger R & Wieser W (1977) The flow of copper through a
terrestrial food chain: 1.Copper and nutrition in isopods.
Oecologia, 30: 253-264.
Dallinger R & Wieser W (1984) Patterns of accumulation,
distribution and liberation of Zn, Cu, Cd and Pb in different
organs of the land snail, Helix pomatia L. Comp Biochem Physiol,
79C(1): 117-124.
Daly HR, Campbell IC, & Hart BT (1990a) Copper toxicity to
Paratya australiensis: I. Influence of nitrilotriacetic acid and
glycine. Environ Toxicol Chem, 9: 997-1006.
Daly HR, Campbell IC, & Hart BT (1990b) Copper toxicity to
Paratya australiensis: II. Influence of bicarbonate and ionic
strength. Environ Toxicol Chem, 9: 1007-1011.
Daly HR, Jones MJ, Hart BT, & Campbell IC (1990c) Copper toxicity
to Paratya australiensis: III. Influence of dissolved organic
matter. Environ Toxicol Chem, 9: 1013-1018.
Daly HR, Hart BT, & Campbell IC (1992) Copper toxicity to
Paratya australiensis: IV. Relationship with ecdysis. Environ
Toxicol Chem, 11: 881-883.
Dameron CT & Harris ED (1987a) Regulation of aortic Cu
Zn-superoxide dismutase with copper: Effects in vivo. Biochem J,
248: 663-668.
Dameron CT & Harris ED (1987b) Regulation of aortic CuZn-superoxide
dismutase with copper: Caeruloplasmin and albumin reactivate and
transfer copper to the enzyme in culture. Biochem J, 248: 669-675.
Dameron CT, Winge DR, George GN, Sansone M, Hu S, & Hamer D (1991)
A copper-thiolate polynuclear cluster in the ACE1 transcription
factor. Proc Natl Acad Sci (USA), 88: 6127-6131.
Dangel RA (1975) Study of corrosion products in the Seattle Water
Department Tolt Distribution System. Washington, DC, US
Environmental Protection Agency (EPA-670/2-75-036).
Daniel GF & Chamberlain AH (1981) Copper immobilization in fouling
diatoms. Bot Mar, 24: 229-243.
Danks DM (1988) Copper deficiency in humans. Annu Rev Nutr, 8:
235-257.
Dann T (1994) Environment Canada -- PM10 and PM2.5: Concentrations
at Canadian sites, 1984 to 1993. Ottawa, Environment Canada,
Environmental Technology Centre, 28 pp (Report series No. PMD 94-3).
Daramola JA & Oladimeji AA (1989) Accumulation of copper in
Clarias anguillaris L. and Oreochromis niloticus L. Water Air
Soil Pollut, 48: 457-461.
Dauncey MJ, Shaw JLC, & Urman J (1977) The absorption and retention
of magnesium, zinc and copper by low birth weight infants fed
pasteurized human breast milk. Pediatr Res, 11: 991-997.
Dave G (1984) Effects of copper on growth, reproduction, survival
and haemoglobin in Daphnia magna. Comp Biochem Physiol, 78C(2):
439-443.
Dave G & Xiu RQ (1991) Toxicity of mercury, copper, nickel, lead,
and cobalt to embryos and larvae of zebrafish, Brachydanio rerio.
Arch Environ Contam Toxicol, 21: 126-134.
Davidson LA, McOrmond SL, & Harris ED (1994) Characterization of a
particulate pathway for copper in K562 cells. Biochim Biophys Acta,
1221: 1-6.
Davis RD & Beckett PHT (1978) Upper critical levels of toxic
elements in plants: II. Critical levels of copper in young barley,
wheat, rape, lettuce and ryegrass, and of nickel and zinc in young
barley and ryegrass. New Phytol, 80: 23-32.
De Boer JA (1981) Nutrients. In: Lobban CS & Wynne MJ ed. The
biology of seaweeds. Oxford, London, Blackwell Scientific
Publications, pp 356-391.
Delaguardia M, Carbonell V, Moralesrubio A, & Salvador A (1993)
On-line microwave-assisted digestion of solid samples for their
flame atomic spectrometric analysis. Talanta, 40: 1609-1617.
De Nicola Giudici M & Migliore L (1988) Long term effect of cadmium
or copper on Asellus aquaticus (L.) (Crustacea, Isopoda). Vehr.
Int Verein Limnol, 23: 1660-1662.
Denizeau F & Marion M (1989) Genotoxic effects of heavy metals in
rat hepatocytes. Cell Biol Toxicol, 5: 15-25.
Denneman CAJ & Van Straalen NM (1991) The toxicity of lead and
copper in reproduction tests using the oribatid mite Platynothrus
peltifer. Pedobiologia, 35: 305-311.
Depledge MH (1989) Re-evaluation of metabolic requirements for
copper and zinc in crustaceans. Mar Environ Res, 27: 115-126.
DeVevey E, Bitton G, Rossel D, Ramos LD, & Guerrero SM (1993)
Concentration and bioavailability of heavy metals in sediments in
Lake Yojoa (Honduras). Bull Environ Contam Toxicol, 50: 253-259.
Devi VU (1987) Heavy metal toxicity to fiddler crabs, Uca
annulipes Latreille and Uca triangularis (Milne Edwards):
tolerance to copper, mercury, cadmium, and zinc. Bull Environ
Contam Toxicol, 39: 1020-1027.
de Vries DJ, Sewell RB, & Beart PM (1986) Effects of copper on
dopaminergic function in the rat corpus striatum. Exp Neurol, 91:
546-558.
De Zwart D & Sloof W (1987) Toxicity of mixtures of heavy metals
and petrochemicals to Xenopus laevis. Bull Environ Contam
Toxicol, 38: 345-351.
Dickinson NM, Turner AP, & Lepp NW (1991) Survival of trees in a
metal-contaminated environment. Water Air Soil Pollut, 57/58:
627-633.
Dieter von HH, Meyer E, & Möller R (1991) [Copper occurrence,
relevance and detection -- The drinking-water directive:
introduction and explanations for water supply services and control
authorities], 3rd ed., pp 472-491 (in German).
Dinnell PA, Link JM, Stober QJ, Letourneau MW, & Roberts WE (1989)
Comparative sensitivity of sea urchin sperm bioassays to metals and
pesticides. Arch Environ Contam Toxicol, 18: 748-755.
Dirilgen N & Inel Y (1994) Cobalt-copper and cobalt-zinc effects on
duckweed growth and metal accumulation. J Environ Sci Health, A29:
63-81.
Disilvestro RA & Harris ED (1981) A post absorption effect of
L-ascorbic acid on copper metabolism in chicks. J Nutr, 111:
1964-1968.
Di Toro R, Capotorti MG, Gialanella G, del Giudice MM, Moro R, &
Perrone L (1987) Zinc and copper status of allergic children. Acta
Paediatr Scand, 76: 612-617.
Di Toro DM, Mahony JD, Hansen DJ, Scott KJ, Hicks MB, Mayr SM, &
Redmond MS (1990) Toxicity of cadmium in sediments: the role of
acid volatile sulfide. Environ Toxicol Chem, 9: 1487-1502.
Di Toro DM, Zarba CS, Hansen DJ, Berry WJ, Swartz RC, Cowan CE,
Pavlou SP, Allen HE, Thomas NA, & Paquin PR (1991) Technical basis
for establishing sediment quality criteria for nonionic organic
chemicals by using equilibrium partitioning. Environ Toxicol Chem,
10: 1541-1583
Dodds-Smith ME, Johnson MS, & Thompson DJ (1992a) Trace metal
accumulation by the shrew Sorex araneus: I. Total body burden,
growth, and mortality. Ecotoxicol Environ Saf, 24: 102-117.
Dodds-Smith ME, Johnson MS, & Thompson DJ (1992b) Trace metal
accumulation by the shrew Sorex araneus: II. Tissue distribution in
kidney and liver. Ecotoxicol Environ Saf, 24: 118-130.
Dodge EE & Theis TL (1979) Effect of chemical speciation on the
uptake of copper by Chironomus tentans. Environ Sci Technol, 13:
1287-1288.
Doelman P & Haanstra L (1984) Short-term and long-term effects of
cadmium, chromium, copper, nickel, lead and zinc on soil microbial
respiration in relation to abiotic soil factors. Plant Soil, 79:
317-327.
Doelman P & Haanstra L (1986) Short- and long-term effects of heavy
metals on urease activity in soils. Biol Fertil Soils, 2: 213-218.
Donat JR, Lao KA, & Bruland KW (1994) Speciation of dissolved
copper and nickel in South San Francisco Bay: a multi-method
approach. Anal Chim Acta, 284: 547-571.
Donkin SG & Dusenbery DB (1993) A soil toxicity test using the
nematode Caenorhabditis elegans and an effective method of
recovery. Arch Environ Contam Toxicol, 25: 145-151.
Dörner K, Dziadzka S, Hohn A, Sievers E, Oldigs HD, Schulz-Lell G,
& Schaub J (1989) Longitudinal manganese and copper balances in
young infants and preterm infants fed on breast-milk and adapted
cow's milk formulas. Br J Nutr, 61(3): 559-572.
Dreosti IE & Record IR (1978) Lysosomal stability, superoxide
dismutase and zinc deficiency in regenerating rat liver. Br J Nutr,
40(1): 133-137.
Drummond JG, Aranyi C, Schiff LJ, Fenters JD, & Graham JA (1986)
Comparative study of various methods used for determining health
effects of inhaled sulfates. Environ Res, 41: 514-528.
Duby P (1980) Extractive metallurgy. In: Kirk-Othmer encyclopedia
of chemical technology, 3rd ed. New York, John Wiley & Sons Ltd, pp
739, 767.
Dumontet S, Dinel H, & Lévesque PEN (1992) The distribution of
pollutant heavy metals and their effect on soil respiration and
acid phosphatase activity in mineral soils of the Rouyn-Noranda
region, Québec. Sci Total Environ, 121: 231-245.
Dumontet S, Levesque M, & Mathur SP (1990) Limited downward
migration of polluted metals (Cu, Zn, Ni and Pb) in acidic virgin
peat soils near a smelter. Water Air Soil Pollut, 49: 329-342.
Dunn MA, Green MH, & Leach RM (1991) Kinetics of copper metabolism
in rats: A compartmental model. Am J Physiol, 261: E115-E125.
Dutka BJ & Kwan KK (1981) Comparison of three microbial toxicity
screening tests with the Microtox test. Bull Environ Contam
Toxicol, 27: 753-757.
Duvigneau P & Denaeyer-De Smet S (1963) Cuivre et végétation au
Katanga. Bull Soc R Bot Belg, 96: 93-231.
Ebele S, Oladimeji AA & Daramola JA (1990) Molluscicidal and
piscisidal properties of copper(II) tetraoxosulfate(VI) on
Bulinus globosus (Morelet) and Clarias anguillaris (L.). Aquat
Toxicol, 17: 231-238.
Eden A & Green HH (1939) The fate of copper in the blood stream. J
Comp Pathol Ther, 52: 301-315.
Effler SW, Litten S, Field SD, Tong-Ngork T, Hale F, Meyer M, &
Quirk M (1980) Whole lake response to low level copper sulfate
treatment. Water Res, 14: 1489-1499.
Ehrenkranz RA, Gettner PA, Nelli CM, Sherwonit EA, Williams JE,
Ting BTG, Janghorbani M (1989) Zinc and copper nutritional studies
in very low birth weight infants: comparison of stable isotopic
extrinsic tag and chemical balance methods. Pediatr Res, 26:
298-307.
Eife R, Reiter K, Sigmund B, Schramel P, Dieter HH, & Müller-Hocker
J (1991) [Childhood liver cirrhosis as a result of copper
intoxication]. Bundesgesundh. bl, 32: 327-329 (in German).
Eldad A, Wisoki M, Cohen H, Breiterman S, Chaouat M, Wexler MR, &
Ben-Bassat H (1995) Phosphorous burns: evaluation of various
modalities for primary treatment. J Burn Care Rehabil, 16: 49-55.
Ellgaard EG & Guillot JL (1988) Kinetic analysis of the swimming
behaviour of bluegill sunfish, Lepomis macrochirus Rafinesque,
exposed to copper: hypoactivity induced by sublethal
concentrations. J Fish Biol, 33: 601-608.
Elliott NG, Swain R, & Ritz DA (1985) The influence of cyclic
exposure on the accumulation of heavy metals by Mytilus edulis
planulatus (Lamarck). Mar Environ Res, 15: 17-30.
Elliott HA, Leberati MR, & Huang CP (1986) Competitive adsorption
of heavy metals by soil. J Environ Qual, 15: 214-219.
El-Sharouny HMM, Bagy MM, & El-Shanawany AA (1988) Toxicity of
heavy metals to Egyptian soil fungi. Int Biodeterior, 24: 49-64.
Epstein O (1983) Liver copper in health and disease. Postgrad Med
J, 59(suppl 4): 88-94.
Erickson RJ, Benoit DA, & Mattson VR (1987) A prototype toxicity
factors model for site-specific copper water quality criteria.
Duluth, Minnesota, US Environmental Protection Agency.
Erickson RJ, Benoit DA, Mattson VR, Nelson HP, & Leonard EN (1996)
The effects of water chemistry on the toxicity of copper to fathead
minnows. Environ Toxicol Chem, 15(2): 181-193.
Evans GW (1973) Copper homeostasis in the mammalian system. Physiol
Rev, 53: 535-569.
Evans EG, Evans GF, & Ray DB (1984) Air quality data for metals
1977 through 1979 from the Naito Air Surveillance Networks.
Research Triangle Park, North Carolina, US Environmental Protection
Agency,
Office of Research and Development Monitoring Laboratory (EPA
600/84-83-053).
Fabiano M, Baffi F, Povero P, & Frache R (1988) Particulate organic
matter and heavy metals in Lingurian open sea. Chem Ecol, 3:
313-323.
Farooqui A, Kulshreshtha K, Srivastava K, Farooqui SA, Pandey V, &
Ahmad KJ (1995) Photosynthesis, stomatal response and metal
accumulation in Cineraria maritima L. and Centauria moschata L.
grown in metal-rich soil. Sci Total Environ, 164(3): 203-207.
Farquharson C, Duncan A, & Robins SP (1989) The effects of copper
deficiency on the pyridinium crosslinks of mature collagen in the
rat skeleton and cardiovascular system. Proc Soc Exp Biol Med, 192:
166-171.
FDO (1965) Appraisal of the safety of chemicals in foods, drugs and
cosmetics. Washington, DC, Editorial Committee of the Association
of Food and Drug Officials of the United States.
Felix K, Nagel W, Hartmann HJ, & Weser U (1990) Copper transfer
through the intestinal wall. Serosal release of metallothionein.
Biol Metab, 3: 141-145.
Fergusson JE & Stewart C (1992) The transport of airborne trace
elements copper, lead, cadmium, zinc and manganese from a city into
rural areas. Sci Total Environ, 121: 247-269.
Fernandes JC & Henriques FS (1991) Biochemical, physiological, and
structural effects of excess copper in plants. Bot Rev, 57(3):
246-273.
Ferrando MD & Andreu E (1993) Feeding behavior as an index of
copper stress in Daphnia magna and Brachionus calyciflorus.
Comp Biochem Physiol, 106C(2): 327-331.
Ferrando MD, Andreu-Moliner E, & Fernández-Casalderrey A (1992)
Relative sensitivity of Daphnia magna and Brachionus
calyciflorus to five pesticides. J Environ Sci Health, B27(5):
511-522.
Ferrando MD, Janssen CR, Andreu E, & Persoone G (1993)
Ecotoxicological studies with the freshwater rotifer
Brachionus calyciflorus: III. The effects of chemicals on the
feeding behavior. Ecotoxicol Environ Saf, 26(1): 1-9.
Fewtrell L, Kay D, Jones F, Baker A, & Mowat A (1996) Copper in
drinking water -- an investigation into possible health effects.
Public Health, 110: 175-177.
Fields M, Ferreti RJ, Smith JC Jr & Reiser S (1984) The interaction
of type of dietary carbohydrates with copper deficiency. Am J Clin
Nutr, 39: 289-295.
Filipek LH, Nordstrom DK, & Ficklin WH (1987) Interaction of acid
mine drainage with waters and sediments of West Squaw Creek in the
West Shasta mining district, California. Environ Sci Technol, 21:
388-396.
Finley EB & Cerklewski FL (1983) Influence of ascorbic acid
supplementation on copper status in young adult men. Am J Clin
Nutr, 37: 553-556.
Fischer PW, Giroux A, & L'Abbé MR (1983) Effects of zinc on mucosal
copper binding and on the kinetics of copper absorption. J Nutr,
113: 462-469.
Fischer PW, L'Abbé MR, & Giroux A (1990) Effects of age, smoking,
drinking, exercise and estrogen use on indices of copper status in
healthy adults. Nutr Res, 10: 1081-1090.
Fischer JG, Tackett RL, Howerth EW, & Johnson MA (1992) Copper and
selenium deficiencies do not enhance the cardiotoxicity in rats due
to chronic doxorubicin treatment. J Nutr, 122: 2128-2137.
Fisher D (1992) Copper. In: Sullivan JB & Krieger GR ed. Hazardous
materials toxicology: Clinical principles of environmental health.
Baltimore, Maryland, Williams & Wilkins, pp 860-864.
Fjeldstad H, Hvatum OO, & Bjorndalen JE (1988) Heavy metal
pollution of ombrotrophic bogs in the Kristiansand area,
Vest-Agder, Norway. Nor J Agric Sci, 2(2): 161-177.
Flemming CA & Trevors JT (1988) Effect of copper on nitrous oxide
reduction in freshwater sediment. Water Air Soil Pollut, 40:
391-397.
Fleurent E & Levi L (1920) Sur la présence du cuivre dans
l'organisme végétal et animal. Bull Soc Chim France, 27: 440.
Florence TM (1989) Electrochemical techniques for trace element
speciation in waters. In: Batley GE ed. Trace element speciation:
Analytical methods and problems. Boca Raton, Florida, CRC Press, pp
77-116.
Florence TM, Morrison GM, & Stauber JL (1992) Determination of
trace element speciation and the role of speciation in aquatic
toxicity. Sci Total Environ, 125: 1-13.
Flynn A, Franzmann AW, & Arneson PD (1976) Molybdenum-sulfur
interactions in the utilization of marginal dietary copper in
Alaskan moose (Alces alces gigas). In: Chappel WR & Petersen KK
ed. Molybdenum in the environment -- Volume 1: The biology of
molybdenum. New York, Marcel Dekker, Inc., pp 115-124.
Flynn A, Franzmann AW, Arneson PD, & Oldemeyer JL (1977)
Indications of copper deficiency in a subpopulation of Alaskan
moose. J Nutr, 107(7): 1182-1189.
Förstner U & Wittmann GTW (1979) Metal pollution in the aquatic
environment. Berlin, Springer-Verlag.
Förstner U & Wittmann GTW (1981) Metal pollution in the aquatic
environment, 2nd ed. New York, Basel, Springer-Verlag.
Fraser WD, Taggart DP, Fell GS, Lyon TDB, Wheatley D, Garden OJ, &
Shenken A (1989) Changes in iron, zinc, and copper concentrations
in serum and in their binding to transport proteins after
cholecystectomy and cardiac surgery. Clin Chem, 35(11): 2243-2247.
Freedman JH, Ciriolo MR, & Peisach J (1989) The role of glutathione
in copper metabolism and toxicity. J Biol Chem, 264: 5598-5605.
Frenckell-Insam BAK & Hutchinson TC (1993) Occurrence of heavy
metal tolerance and co-tolerance in Deschampsia cespitosa (L.)
Beauv. from European and Canadian populations. New Phytol, 125:
555-564
Freundt KJ & Ibrahim HA (1991) Influence of Pb, Cd, Zn, Mn, Cu, Hg,
or Be salts on the glutathione S-transferases of the rat liver.
Bull Environ Contam Toxicol, 46: 618-624.
Friberg L, Nordberg GF, & Vouk VB (1979) Handbook on the toxicology
of metals. Amsterdam, Elsevier/North Holland Biomedical Press.
Frieden E & Hsieh HS (1976) The biological role of ceruloplasmin
and its oxidase activity. Adv Exp Med Biol, 74: 505-529.
Frommer DJ (1981) Urinary copper excretion and hepatic copper
concentrations in liver disease. Digestion, 21: 169-178.
Frostegård Å, Tunlid A, & Bååth E (1993) Phospholipid fatty acid
composition, biomass, and activity of microbial communities from
two soil types experimentally exposed to different heavy metals.
Appl Environ Microbiol, 59: 3605-3617.
Frydman M, Bonne-Tamir B, Farrer LA, Conneally PM, Magazanik A,
Ashbel S, & Goldwitch Z (1985) Assignment of the gene for Wilson's
disease to chromosome 13: linkage to the esterase D locus. Proc
Natl Acad Sci (USA), 82(6): 1819-1821.
Gabuchyan VV (1987) Impairment mechanism of the reproductive
function ni cuprum chloride-exposed white male rats. Gig Tr Prof
Zabol, 31(9): 28-31.
Gadh R, Tandon SN, Mathur RP, & Singh OV (1993) Speciation of
metals in Yamuna river sediments. Sci Total Environ, 136: 229-242.
Ganezer KS, Hjart ML, & Carnes WH (1976) Tensile properties of
tendon in copper deficient swine. Proc Soc Exp Biol Med, 153:
396-399.
Garcia-Sanchez F, Navas-Diaz A, & Medinilla J (1990) Mineralization
procedure for determination of copper in aerosols using photometric
method based on copper-BPKQH complex. J Assoc Off Anal Chem, 73:
764-770.
Gardner M & Ravenscroft J (1991) The behaviour of copper
complexation in rivers and estuaries: two studies in North-East
England. Chemosphere, 23: 695-713.
Gauss JD, Woods PE, Winner RW, & Skillings JH (1985) Acute toxicity
of copper to three life stages of Chironomus tentans as affected by
water hardness-alkalinity. Environ Pollut, A37: 149-157.
Geckler JR, Horning WB, Neiheisel TM, Pickering QH, Robinson EL, &
Stephan CE (1976) Validity of laboratory tests for predicting
copper toxicity in streams. Duluth, Minnesota, US Environmental
Protection Agency (EPA-600/3-76-116).
Gerdes AM, Tonnesen T, Pergament E, Sander C, Baerlocher KE, Wartha
R, Guttler F, & Horn N (1988) Variability in clinical expression of
Menkes syndrome. Eur J Pediatr, 148(2): 132-135.
Germani MS, Small M, Zoller WH, & Moyers JL (1981) Fractionation of
elements during copper smelting. Environ Sci Technol, 15: 299-305.
Gettier SW, Martens DC, & Kornegay ET (1988) Corn response to six
annual Cu-enriched pig manure applications to three soils. Water
Air Soil Pollut, 40: 409-418.
Giesy JP, Alberts JJ, & Evans DW (1986) Conditional stability
constants and binding capacities for copper (II) by dissolved
organic carbon isolated from surface waters of the southeastern
United States. Environ Toxicol Chem, 5: 139-154.
Giesy JP, Newell A, & Leversee GJ (1983) Copper speciation in soft
acid humic water: effect on copper bioaccumulation by and toxicity
to Simocephalus serrulatus. Sci Total Environ, 28: 23-36.
Gintenreiter S, Ortel J, & Nopp HJ (1993) Effects of different
dietary levels of cadmium, lead, copper, and zinc on the vitality
of the forest pest insect Lymantria dispar L. (Lymantriidae,
Lepid.). Arch Environ Contam Toxicol, 25: 62-66.
Gleason RP (1968) Exposure to copper dust. Am Ind Hyg Assoc J, 29:
461-462.
Gold LS, Sawyer CB, Magaw R, Backman GM, de Veciana M, Levinson R,
Hooper NK, Havender WR, Bernstein L, Peto R, Pike MC, & Ames BN
(1984) A carcinogenic potency database of the standardized results
of animal bioassays. Environ Health Perspect, 58: 9-319.
Goldstein S & Czapski G (1986) The role and mechanism of metal ions
and their complexes in enhancing damage in biological systems or in
protecting these systems from the toxicity of O2-. J Free Radic
Biol Med, 2(1): 3-11.
Gollan JL & Deller DJ (1973) Studies on the nature and excretion of
biliary copper in man. Clin Sci, 44: 9-15.
Gooneratne SR, Chaplin RK, Trent AM, & Christensen DA (1989) Effect
of tetrathiomolybdate administration on the excretion of copper,
zinc, iron and molybdenum in sheep bile. Br Vet J, 145: 62-72.
Gormally SM, Baker A, Portmann B, Mowat A, & Drumm B (1994) High
water copper content associated with Indian childhood cirrhosis in
European children. Gastroenterology, 106: A900 (abstract).
Gorzelska K (1989) Locally generated atmospheric trace metal
pollution in Canadian Arctic as reflected by chemistry of snowpack
samples from the Mackenzie delta region. Atmos Environ, 22:
2729-2737.
Goyer RA (1991) Toxic effects of metals. In: Andur MO, Doull J, &
Klaassen CD ed. Casarett and Doull's toxicology: The basic science
of poisons, 4th ed. Oxford, New York, Pergamon Press, chapter 10,
pp 623-680.
Graham JH, Timmer LW, & Fardelmann D (1986) Toxicity of fungicidal
copper in soil to citrus seedlings and vesicular-arbuscular
mycorrhizal fungi. Phytopathology, 76: 66-70.
Gralla EB, Thiele DJ, Silar P, & Valentine JS (1991) ACE1, a copper
dependent transcription factor, activates expression of the yeast
copper, zinc superoxide dismutase gene. Proc Natl Acad Sci (USA),
88: 8558-8562.
Grant A, Hateley JG, & Jones NV (1989) Mapping the ecological
impact of heavy metals on the estuarine polychaete Nereis
diversicolor using inherited metal tolerance. Mar Pollut Bull,
20(5): 235-238.
Grant LD, Elias R, Nicholson W, Goyer R, & Olem H (1990) Indirect
health effects associated with acidic deposition. In: State of
science and technology. National Acid Precipitation Assessment
Program (NAPAP), pp 23-33 (Report No. 23).
Greene FL, Lamb LS, Barwick M, & Pappas NJ (1987) Effect of dietary
copper on colonic tumor production and aortic integrity in the rat.
J Surg Res, 42: 503-512.
Greger JL & Mulvaney J (1985) Absorption and tissue distribution of
zinc, iron and copper by rats fed diets containing lactalbumin, soy
and supplemental sulfur-containing amino acids. J Nutr, 115:
200-210.
Greger JL, Zaikis SC, Abernathy RP, Bennett OA, & Huffman J (1978)
Zinc, nitrogen, copper, iron, and manganese balance in adolescent
females fed two levels of zinc. J Nutr, 108(9): 1449-1456.
Gregory JR, Collins DL, Davies PSW, Hughes JM, & Clarke PC (1995)
National diet and nutrition survey: children aged 1 ´ to 4 ´ years
-- Volume 1: Report of the diet and nutrition survey. London, Her
Majesty's Stationary Office (HMSO), pp 177-201.
Gross JB Jr, Miers BM, Kost LJ, Kuntz SM, & La Russo NF (1989)
Biliary copper excretion by hepatocyte lysosomes in the rat. Mayor
excretory pathway in experimental copper overload. J Clin Invest,
83: 30-39.
Groudev SN & Groudeva VI (1993) Microbial communities in four
industrial copper dump leaching operations in Bulgaria. FEMS
Microbiol Rev, 11: 261-267.
Guerihault B (1920) Sur la présence du cuivre dans les plantes et
particulièrement dans les matières alimentaires d'origine végétale.
C R Soc Biol, 171: 196.
Haanstra L & Doelman P (1984) Glutamic acid decomposition as a
sensitive measure of heavy metal pollution in soil. Soil Biol
Biochem, 16: 595-600.
Haanstra L & Doelman P (1991) An ecological dose-response model
approach to short- and long-term effects of heavy metals on
arylsulphatase activity in soil. Biol Fertil Soils, 11: 18-23.
Haas RH, Robinson A, Evans K, Lascelles PT, & Dubowitz V (1981) An
X-linked disease of the nervous system with disordered copper
metabolism and features differing from Menkes disease. Neurology,
31(7): 852-859.
Hackel H, Miller K, Elsner P, & Burg G (1991) Unusual combined
sensitization to palladium and other metals. Contact Dermatitis,
24: 131-132.
Haddad DS, Al-Alousi LA, & Kantarjian AH (1991) The effect of
copper loading on pregnant rats and their offspring. Funct Dev
Morphol, 1: 17-22.
Håkansson K, Karlsson S, & Allard B (1989) Effects of pH on the
accumulation and redistribution of metals in a polluted stream bed
sediment. Sci Total Environ, 87/88: 43-57.
Hall HC (1921) La dégénérescence hépato-lenticulaire: Maladie de
Wilson-pseudosclérose. Paris, Editions Masson, pp 190-192.
Hall A (1981) Copper accumulation in copper-tolerant and
non-tolerant populations of the marine fouling alga Ectocarpus
siliculosus (Dillw.) Lyngbze. Bot Mar 24: 223-228.
Hall A, Fielding AH, & Butler M (1979) Mechanism of copper
tolerance in the marine fouling alga Ectocarpus siliculosus:
Evidence for an exclusion mechanism. Mar. Biol., 54: 195-199
Hall WS, Bushong SJ, Hall LW, Lenkevich MJ, & Pinkney AE (1988)
Monitoring dissolved copper concentrations in Chesapeake Bay, USA.
Environ Monit Assess, 11(1): 33-42.
Hall LW, Unger MA, Ziegenfuss MC, Sullivan JA, & Bushong SJ (1992)
Butyltin and copper monitoring in a northern Chesapeake Bay marina
and river system in 1989: an assessment of tributyltin legislation.
Environ Monit Assess, 22(1) 15-38.
Hamer DH (1986) Metallothionein. Annu Rev Biochem, 55: 913-951.
Hamilton SJ & Buhl KJ (1990) Safety assessment of selected
inorganic elements to fry of chinook salmon (Oncorhynchus
tshawytscha). Ecotoxicol Environ Saf, 20: 307-324.
Hamilton EI, Minski MJ, & Cleary JJ (1972) The concentration and
distribution of some stable elements in healthy human tissues from
the United Kingdom. Sci Total Environ, 1: 341-361.
Han B-C & Hung T-C (1990) Green oysters caused by copper pollution
on the Taiwan coast. Environ Pollut, 65: 347-362.
Han B-C, Jeng W-L, Tsai Y-N, & Jeng M-S (1993) Depuration of copper
and zinc by green oysters and blue mussels of Taiwan. Environ
Pollut, 82: 93-97.
Hansen IV, Weeks JM, & Depledge MH (1995) Accumulation of copper,
zinc, cadmium and chromium by the marine sponge Halichondria
panicea Pallas and the implications for biomonitoring. Mar Pollut
Bull, 31(1-3): 133-138.
Hanson MJ & Stefan HG (1984) Side effects of 58 years of copper
sulfate treatment of the Fairmont Lakes, Minnesota. Water Resour
Bull, 20(6): 889-900.
Haraldsson C & Westerlund S (1988) Trace metals in the water
columns of the Black Sea and Framvaren Fjord. Mar Chem, 23(3-4):
417-424.
Harless E (1847) [About the blue blood of some non-vertebrate
animals and its copper content.] Muller's Arch Anat Physiol, 1847:
148 (in German).
Harris ED (1991) Copper transport: An overview. Proc Soc Exp Biol
Med, 196: 130-140.
Harris ED (1995) The iron-copper connection: the link to
ceruloplasmin grows stronger. Nutr Rev, 53: 170-173.
Harris ED & DiSilvestro RA (1981) Correlation of lysyl oxidase
activation with the p-phenylenediamine oxidase activity
(ceruloplasmin) in serum. Proc Soc Exp Biol Med, 166(4): 528-531.
Harris ZL & Gitlin JD (1996) Genetic and molecular basis for copper
toxicity. Am J Clin Nutr, 63(suppl): 836S-841S.
Harris ED & Percival SS (1991) A role for ascorbic acid in copper
transport. Am J Clin Nutr, 54: 1193S-1197S.
Harris ED, Gonnerman WA, Savage JE, & O'Dell BL (1974) Connective
tissue amine oxidase. II. Purification and partial characterization
of lysyl oxidase from chick aorta. Biochim Biophys Acta, 341(2):
332-344.
Harris ED, Blount JE, & Leach RM (1980) Localization of
lysyloxidase in hen oviduct: implications in egg shell membrane
formation and composition. Science, 208: 55-56.
Harrisson JWE, Levin SE, & Trabin B (1954) The safety and fate of
potassium sodium copper chlorophyllin and other copper compounds.
J Am Pharm Assoc, 43: 722-737.
Hart EB, Steenbock H, Waddell J, & Elvehjem CA (1928) Iron in
nutrition: VII. Copper as a supplement to iron for hemoglobin
building in the rat. J Biol Chem, 77: 797-812.
Hart BT, Currey NA, & Jones MJ (1992) Biogeochemistry and effects
of copper, manganese and zinc added to enclosures in Island
Billabong, Magela Creek, northern Australia. Hydrobiologia, 230:
93-134.
Hartmann HA & Evenson MA (1992) Deficiency of copper can cause
neuronal degeneration. Med Hypotheses, 38: 75-85.
Hartter DE & Barnea A (1988) Brain tissue accumulates 67 copper by
two ligand-dependent saturable processes. A high affinity, low
capacity and a low affinity, high capacity process. J Biol Chem,
263(2): 799-805.
Hartwell SI, Jin JH, Cherry DS, & Cairns J (1989) Toxicity versus
avoidance response of golden shiner, Notemigonus crysoleucas, to
five metals. J Fish Biol, 35: 447-456.
Haschke F, Ziegler EE, Edwards BB, & Fomon SJ (1986) Effect of iron
fortification of infant formula on trace mineral absorption. J
Pediatr Gastroenterol Nutr, 5: 768-773.
Hasegawa R, Nakaji Y, Kurokawa Y, & Tobe M (1989) Acute toxicity
tests on 113 environmental chemicals. Research Institute of the
Tohoku University, pp 10-16 (Scientific Report No. 36).
Hatakeyama S (1988) Chronic effects of Cu on reproduction of
Polypedilumium nubifer (Chironomidae) through water and food.
Ecotoxicol Environ Saf, 16: 1-10.
Havens KE (1994a) An experimental comparison of the effects of two
chemical stressors on a freshwater zooplankton assemblage. Environ
Pollut, 84: 245-251.
Havens KE (1994b) Structural and functional responses of a
freshwater plankton community to acute copper stress. Environ
Pollut, 86: 259-266.
Hayton BA, Broome HE, & Lilenbaum RC (1995) Copper
deficiency-induced anemia and neutropenia secondary to intestinal
malabsorption. Am J Hematol, 48(1): 45-47.
Haywood S (1980) The effect of excess dietary copper on the liver
and kidney of the male rat. J Comp Pathol, 90: 217-232.
Haywood S (1985) Copper toxicosis and tolerance in the rat: I.
Changes in copper content of the liver and kidney. J Pathol, 145:
149-158.
Haywood S & Comerford B (1980) The effect of excess dietary copper
on plasma enzyme activity and on the copper content of the blood of
the male rat. J Comp Pathol, 90: 233-238.
Haywood S & Loughran M (1985) Copper toxicosis and tolerance in the
rat: II. Tolerance -- a liver protective adaptation. Liver, 5:
267-275.
Heath AG (1991) Effect of water-borne copper on physiological
responses of bluegill (Lepomis macrochirus) to acute hypoxic stress
and subsequent recovery. Comp Biochem Physiol, 100C: 559-564.
Hébert CD (1993) NTP technical report on toxicity studies of cupric
sulfate (CAS No. 7758-99-8) administered in drinking water and feed
to F344/N rats and B6C3F1 mice. Research Triangle Park, North
Carolina, United States Department of Health and Human Services,
National Toxicology Program, 94 pp (NTP Toxicity Report Series No.
29; NIH Publication 93-3352).
Hébert CD, Elwell MR, Travlos GS, Fitz CJ, & Bucher JR (1993)
Subchronic toxicity of cupric sulfate administered in drinking
water and feed to rats and mice. Fundam Appl Toxicol, 21: 461-475.
Hedberg T, Vik AE, & Ferguson J ed. (1996) Report from the
International Seminar and Workshop on Internal Corrosion in Water
Distribution Systems, Göteborg, 22-27 May 1995. Göteborg, Sweden,
Göteborg University.
Hedtke SF (1984) Structure and function of copper-stressed aquatic
microcosms. Aquat Toxicol, 5: 227-244.
Helios Rybicka E, Wilson MJ, & Mchard WJ (1994) Chemical and
mineralogical forms and mobilization of copper and lead in soils
from a Cu-smelting area in Poland. J Environ Sci Health, A29(3):
531-546.
Heller RM, Kirchner SG, O'Neill JA Jr, Hough AJ Jr, Howard L,
Kramer SS, & Green HL (1978) Skeletal changes of copper deficiency
in infants receiving prolonged total parenteral nutrition. J
Pediatr, 92(6): 947-949.
Helz GR, Hugget RJ, & Hill JM (1975) Behavior of Mn, Fe, Cu, Cd,
and Pb discharged from a wastewater treatment plant into an
estuarine environment. Water Res, 9: 631-636.
Henry CL & Harrison RB (1992) Fate of trace metals in sewage sludge
compost. In: Domy CA ed. Biogeochemistry of trace metals. Boca
Raton, Florida, Lewis Publishers, pp 195-216.
Heresi G, Castillo-Durán C, Muñoz C, Arevalo M, & Schlesinger L
(1985) Phagocytosis and immunoglobulins levels in hypocupremic
infants. Nutr Res, 5: 1327-1334.
Hill R & Williams HL (1965) The effects on intensively reared lambs
of diets containing excess copper. Vet Rec, 77(36): 1043-1045.
Hirano S, Ebihara H, Sakai S, Kodama N, & Suzuki KT (1993)
Pulmonary clearance and toxicity of intratracheally instilled
cupric oxide in rats. Arch Toxicol, 67: 312-317.
Hirano S, Sakai S, Ebihara H, Kodama N, & Suzuki KT (1990)
Metabolism and pulmonary toxicity of intratracheally instilled
cupric sulfate in rats. Toxicology, 64(3): 223-233.
Holak W (1983) Determination of copper, nickel, and chromium in
foods. J Assoc Off Anal Chem, 66: 620-624.
Holdbrook JT, Smith JC Jr, & Reiser S (1989) Dietary fructose or
starch: effects on copper, zinc, iron, manganese, calcium, and
magnesium balances in humans. Am J Clin Nutr, 49: 1290-1294.
Holmgren GGS, Meyer MW, Chaney RL, & Daniels RB (1993) Cadmium,
lead, zinc, copper, and nickel in agricultural soils of the United
States of America. J Environ Qual, 22: 335-348.
Holtzman NA, Charache P, Cordano A, & Graham GG (1970) Distribution
of serum copper in copper deficiency. John Hopkins Med J, 126:
34-42.
Holwerda DA (1991)Cadmium kinetics in freshwater clams: V.
Cadmium-copper interactions in metal accumulation by Anadonta
cygnea and characterization of the metal-binding protein. Arch
Environ Contam Toxicol, 21: 432-437.
Hong S, Candelone J-P, Patterson CC, & Boultron CF (1996) History
of ancient copper smelting pollution during Roman and Medieval
times recorded in Greenland ice. Science, 272: 246-247.
Hoogenraad TU & van den Hamer CJA (1983) Three years of continuous
oral zinc therapy in tour patients with Wilson's disease. Acta
Neurol Scand, 67: 356-364.
Hopkin SP (1993) Deficiency and excess of copper in terrestrial
isopods. In: Dallinger R & Rainbow PS ed. Ecotoxicology of metals
in invertebrates. Boca Raton, Florida, Lewis Publishers, pp
359-382.
Hopkin R & Kain JM (1978) The effects of some pollutants on the
survival, growth and respiration of Laminaria hyperborea. Estuar
Coast Mar Sci, 7(6): 531-554.
Hopkin SP, Hardisty GN, & Martin MH (1986) The woodlouse
Porcellio scaber as a 'biological indicator' of zinc, cadmium,
lead and copper pollution. Environ Pollut, B11: 271-290.
Hopkin SP, Jones DT, & Dietrich D (1993) The isopod Porcellio
scaber as a monitor of the bioavailability of metals in terrestrial
ecosystems: towards a global "woodlouse watch" scheme. Sci Total
Environ, 1(suppl): 357-365.
Hopper SH & Adams HS (1958) Copper poisoning from vending machines.
Public Health Rep, 73: 910-914.
Horning WB & Neiheisel TW (1979) Chronic effect of copper on the
bluntnose minnow, Pimephales notatus (Rafinesque). Arch Environ
Contam Toxicol, 8: 545-552.
Howarth RS & Sprague JB (1978) Copper lethality to rainbow trout in
waters of various hardness and pH. Water Res, 12: 455-462.
Howeler RH (1983) [Study of some tropical plants for the diagnosis
of nutritional problems.] Cali, Colombia, International Centre for
Tropical Agriculture, 28 pp (in Spanish).
Howell JS (1958) The effect of copper acetate on
p-dimethylaminoazobenzene carcinogenesis in the rat. Br J Cancer,
12: 594-610.
Huber MC, Winter REK, & Bolla RI (1989) Effect of copper sulfate
and lead acetate on infection of pines with Bursaphelenchus
xylophilus. J Nematol, 21: 1-9.
Hunt CE & Carlton WW (1965) Cardiovascular lesions associated with
experimental copper deficiency in the rabbit. J Nutr, 87: 385-393.
Hunt CE, Carlton WW, & Newberne PM (1970) Interrelationships
between copper deficiency and dietary ascorbic acid in the rabbit.
Br J Nutr, 24: 61-69.
Hunter BA & Johnson MS (1982) Food chain relationships of copper
and cadmium in contaminated grassland ecosystems. Oikos, 38:
108-117.
Hunter BA, Johnson MS, & Thompson DJ (1987a) Ecotoxicology of
copper and cadmium in a contaminated grassland ecosystem: I. Soil
and vegetation contamination. J Appl Ecol, 24: 573-586.
Hunter BA, Johnson MS, & Thompson DJ (1987b) Ecotoxicology of
copper and cadmium in a contaminated grassland ecosystem: II.
Invertebrates. J Appl Ecol, 24: 587-599.
Hunter BA, Johnson MS, & Thompson DJ (1987c) Dynamics of metal
accumulation in the grasshopper Chorthippus brunneus in
contaminated grasslands. Arch Environ Contam Toxicol, 16: 711-716.
Hurley LS & Keen CL (1988) Fetal and neonatal development in
relation to maternal trace element nutrition: manganese, zinc, and
copper. In: Berger H ed. Vitamins and minerals in pregnancy and
lactation. New York, Raven Press Ltd, pp 215-230 (Nestle Nutrition
Workshop Series, Volume 16).
Hutchinson TH, Williams TD, & Eales GJ (1994) Toxicity of cadmium,
hexavalent chromium and copper to marine fish larvae
(Cyprinodon variegatus) and copepods (Tisbe battagliai). Mar
Environ Res, 38: 275-290.
IARC (1977) Copper 8-hydroxygquinoline. In: Some fumigants, the
herbicides 2,4-D and 2,4,5-T chlorinated dibenzodioxins and
miscellaneous industrial chemicals. Lyon, International Agency for
Research on Cancer, pp 103-110 (IARC Monographs on the Evaluation
of the Carcinogenic Risk of Chemicals to Humans, Volume 15).
IARC (1987) Overall evaluations of carcinogenicity: an updating of
IARC monographs volumes 1 to 42. Lyon, International Agency for
Research on Cancer, p 61 (IARC Monographs on the Evaluation of the
Carcinogenic Risk of Chemicals to Humans, Supplement 7).
IAT (Institute of Animal Technicians) (1963) In: Short DJ &
Woodnott DP ed. Manual of laboratory animal practice techniques.
London, Crosby Lockwood & Son Ltd.
ICME (1995) Persistence, bis-accumulation and toxicity of metals
and metal compounds. Ottawa, Canada, International Council on
Metals and the Environment, 93 pp.
ICSG (1996) World refinery production of copper. Lisbon, Portugal,
The International Copper Study Group, pp 13-15 (table 5) (Copper
Bulletin, Volume 3).
ILO (1991) Occupational exposure limits for airborne toxic
substances, 3rd ed. Geneva, International Labour Organisation
(Occupational Safety and Health Series, No. 37).
Ingersoll CG & Winner RW (1982) Effect on Daphnia pulex (De Geer)
of daily pulse exposures to copper or cadmium. Environ Toxicol
Chem, 1: 321-327.
IPCS (1994) Environmental health criteria 170: Assessing human
health risks of chemicals: Derivation of guidance values for
health-based exposure limits. Geneva, World Health Organization,
International Programme on Chemical Safety, 73 pp.
ISO (1986) Water quality -- determination of cobalt, nickel,
copper, zinc, cadmium and lead -- flame atomic absorption
spectrometric methods, 1st ed. Geneva, International Standards
Organization, 11 pp.
Isolda A & Hayasaka SS (1991) Effect of herbicide residues on
microbial processes in pond sediment. Arch Environ Contam Toxicol,
20: 81-86.
Iwata M, Hirano A, & French JH (1979) Degeneration of the
cerebellar system in X-chromosome-linked copper malabsorption. Ann
Neurol, 5(6): 542-549.
Iyer VN & Szybalski W (1958) Two simple methods for the detection
of chemical mutagens. App Microbiol, 6: 23-29.
Jacob RA, Skala JR, Omaye ST, & Turnlund JR (1987) Effect of
varying ascorbic acid intakes on copper absorption and
ceruloplasmin levels of young men. J Nutr, 117: 2109-2115.
Jacobsen T & Slotfeldt-Ellingsen D (1983) Phytic acid and metal
availability: A study of Ca and Cu binding. Cereal Chem, 60:
392-395.
Jain VK & Mohan G (1991) Serum zinc and copper in myocardial
infarction with particular reference to prognosis. Biol Trace Elem
Res, 31: 317-322.
Jain SK, Vasudevan P, & Jha NK (1989) Removal of some heavy metals
from polluted water by aquatic plants: studies on duckweed and
water velvet. Biol Wastes, 28: 115-126.
Janes N & Playle RC (1995) Modeling silver binding to the gill of
rainbow trout (Oncorhynchus mykiss). Environ Toxicol Chem, 14:
1847-1858.
Janssen MPM, Ooszrthoff C, Heijmans GJSM, & van der Voet H (1995)
The toxicity of metal salts and the population growth of the
ciliate Colpoda cucculus. Bull Environ Contam Toxicol, 54:
597-605.
Jantsch W, Kulig K, & Rumack BH (1985) Massive copper sulfate
ingestion resulting in hepatotoxicity. J Toxicol Clin Toxicol,
22: 585-588.
Jarvis SC (1978) Copper uptake and accumulation by perennial
ryegrass grown in soil and solution culture. J Sci Food Agric, 29:
12-18.
Jeng SL & Yang CP (1995) Determination of lead, cadmium, mercury
and copper concentrations in duck. Poultry Sci, 74: 187-193.
Jenne EA (1987) Sediment quality criteria for metals: IV. Surface
complexation and acidity constants for modeling cadmium and zinc
adsorption onto iron oxides. Prepared for the US Environmental
Protection Agency, Office of Water Regulations and Standards,
Criteria and Standards Division, Washington, DC.
Johansson C & Moberg LE (1991) Area ratio effects on metal ion
release from amalgam in contact with gold. Scand J Dent Res, 99:
246-253.
Johansson A, Camner P, Jarstrand C, & Wiernik A (1983) Rabbit
alveolar macrophages after inhalation of soluble cadmium, cobalt,
and copper: A comparison with the effects of soluble nickel.
Environ Res, 31: 340-354.
Johansson A, Curstedt T, Robertson B, & Camner P (1984) Lung
morphology and phospholipids after experimental inhalation of
soluble cadmium, copper, and cobalt. Environ Res, 34(2): 295-309.
Johnson MW & Gentile JH (1979) Acute toxicity of cadmium, copper,
and mercury to larval American lobster Homarus americanus. Bull
Environ Contam Toxicol, 22: 258-264.
Johnson PE & Korynta ED (1992) Effects of copper, iron, and
ascorbic acid on manganese availability to rats. Proc Soc Exp Biol
Med, 199: 470-480.
Johnson MA & Murphy CL (1988) Adverse effects of high dietary iron
and ascorbic acid on copper status in copper-deficient and
copper-adequate rats. Am J Clin Nutr, 47: 96-101.
Johnson CA, Sigg L, & Zobrist J (1987) Case studies on the chemical
composition of fogwater: Influence of local gaseous emissions.
Atmos Environ, 21: 2365-2374.
Johnson RK, Ericsson L, & Wiederholm T (1992) Ordination of
profundal zoobenthos along a trace metal pollution gradient in
northern Sweden. Water Air Soil Pollut, 65(3/4): 339-351.
Jorhem L & Sundstrom B (1993) Levels of lead, cadmium, zinc,
copper, nickel, chromium, manganese, and cobalt in food on the
Swedish market. 1983-1990. J Food Compos Anal, 6: 223-241.
Josephs HW (1931) Treatment of anemia of infancy with iron and
copper. Bull John Hopkins Hosp, 49: 246-258.
Jungmann J, Reins H-A, Lee J, Romeo A, Hassett R, Kosman D, &
Jentsch S (1993) MAC1, is a nuclear regulatory protein related to
Cu-dependent transcription factors involved in CU/Fe utilization
and stress resistance in yeast. EMBO J, 12: 5051-5056.
Juste C & Mench M (1992) Long-term application of sewage sludge and
its effects on metal uptake by crops. In: Domy CA ed.
Biogeochemistry of trace metals. Boca Raton, Florida, Lewis
Publishers, pp 159-192.
Kabata-Pendias A & Pendias H (1984) Trace elements in soils and
plants. Boca Raton, Florida, CRC Press, Inc., 315 pp.
Kaitala S (1988) Multiple toxicity and accumulation of heavy metals
in two bivalve mollusc species. Water Sci Technol, 20(6/7): 23-32.
Kalac P, Niznanská M, Bevilaqua D, & Stasková I (1996)
Concentrations of mercury, copper, cadmium and lead in fruiting
bodies of edible mushrooms in the vicinity of a mercury smelter and
a copper smelter. Sci Total Environ, 177: 251-258.
Kaler SG, Gallo LK, Proud VK, Percy AK, Mark Y, Segal NA, Goldstein
DS, Holmes CS, & Gahl WA (1994) Occipital horn syndrome and a mild
Menkes phenotype associated with splice site mutations at the MNK
locus. Nat Genet, 8: 195-202.
Kanematsu N, Hara M, & Kada T (1980) Rec assay and mutagenicity
studies on metal compounds. Mutat Res, 77: 109-116.
Karlberg A-T, Boman A, & Wahlberg JE (1983) Copper -- a rare
sensitizer. Contact Dermatitis, 9: 134-139.
Kasama T & Tanaka H (1988) Effects of copper administration on
fetal and neonatal mice. J Nutr Sci Vitam, 34: 595-605.
Kataoka M & Tavassoli M (1984) Ceruloplasmin receptors in liver
cell suspensions are limited to the endothelium. Exp Cell Res, 155:
232-240.
Kataoka M & Tavassoli M (1985) Identification of ceruloplasmin
receptors on the surface of human blood monocytes, granulocytes,
and lymphocytes. Exp Hematol, 13: 806-810.
Kawahara D, Oshima H, Kosugi H, Nakamura M, Sugai T, & Tamaki T
(1993) Further epidemiologic study of occupational contact
dermatitis in the dental clinic. Contact Dermatitis, 28: 114-115.
Kay SH, Haller WT, & Garrard LA (1984) Effects of heavy metals on
water hyacinths (Eichhornia crassipes (Mart.) Solms). Aquat
Toxicol, 5: 117-128.
Keinholz EW (1977) Effects of environmental molybdenum levels upon
wildlife. In: Chappel WR & Petersen KK ed. Molybdenum in the
environment -- Volume 2 : The geochemistry, cycling and industrial
uses of molybdenum. New York, Marcel Dekker, Inc., pp 731-737.
Kelley DS, Daudu PA, Taylor PC, Mackey BE, & Turnlund JR (1995)
Effects of low-copper diets on human immune response. Am J Clin
Nutr, 62: 412-416.
Khangarot BS (1992) Copper-induced hepatic ultrastructural
alterations in the snake-headed fish, Channa punctatus. Ecotoxicol
Environ Saf, 23: 282-293.
Khangarot BS & Ray PK (1987) Sensitivity of toad tadpoles,
Bufo melanostictus (Schneider), to heavy metals. Bull Environ
Contam Toxicol, 38: 523-527.
Khangarot BS & Ray PK (1989) Sensitivity of midge larvae of
Chironomus tentans Fabricius (Diptera Chironomidae) to heavy
metals. Bull Environ Contam Toxicol, 42: 325-330.
Kim N & Fergusson J (1993) Concentrations and sources of cadmium,
copper, lead and zinc in house dust in Christchurch, New Zealand.
Sci Total Environ, 138: 1-21.
King LD (1988) Retention of metals by several soils of the
southeastern United States. J Environ Qual, 17: 239-246.
King KA, Leleux J, & Mulhern BM (1984) Molybdenum and copper levels
in white-tailed deer near uranium mines. J Wildl Manage, 48(1):
267-270.
Kinsman GD, Howard AN, Stone DL, & Mullins PA (1990) Studies in
copper status and atheroesclerosis. Biochem Soc Trans, 18:
1186-1188.
Kirk RS & Lewis JW (1993) An evaluation of pollutant induced
changes in the gills of rainbow trout using scanning electron
microscopy. Environ Technol, 14: 577-585.
Kjaer A, Laursen K, Thormann L, Borggaard O, & Lebech PE (1993)
Copper release from copper intrauterine devices removed after up to
8 years of use. Contraception, 47: 349-358.
Klapheck S, Fliegner W, & Zimmer I (1994) Hydroxymethyl
phytochelatins (gamma glutamylcysteine)(n)-serine are metal induced
peptides of the poaceae. Plant Physiol, 104(4): 1325-1332.
Klein WJ, Metz EN, & Price AR (1972) Acute copper intoxication.
Arch Intern Med, 129: 578-582.
Klein D, Schloz P, Drasch GA, Muller-Hocker J, & Summer KH (1991)
Metallothionein, copper and zinc in fetal and neonatal human liver:
changes during development. Toxicol Lett, 56(1-2): 61-67.
Klevay LM (1975) Coronary heart disease: the zinc/copper
hypothesis. Am J Clin Nutr, 28: 764-774.
Klevay LM (1988) Dietary cholesterol lowers liver copper in
rabbits. Biol Trace Elem Res, 38: 47-54.
Klevay LM (1992) Re: Serum copper and the risk of acute myocardial
infarction: a prospective population study in Eastern Finland. Am
J Epidemiol, 135: 832-834.
Klevay LM, Inman L, Johnson LK, Lawler M, Mahalko JR, Milne DB,
Lusaski HC, Bolonchuk W, & Sandstead HH (1984) Increased
cholesterol in plasma in a young man during experimental copper
depletion. Metabolism, 33: 1112-1118.
Klevay LM, Canfield WK, & Gallagher SK (1986) Decreased glucose
tolerance in two men during experimental copper depletion. Nutr Rep
Int, 33: 371-382.
Knobeloch L, Ziarnik M, Howard J, Theis B, Farmer D, Anderson H, &
Proctor M (1994) Gastrointestinal upsets associated with ingestion
of copper-contaminated water. Environ Health Perspect, 102:
958-961.
Kodama H (1993) Recent developments in Menkes disease. J Inherit
Metab Disease, 16: 791-799.
Kok FJ, Van Duijn CM, Hofman A, Van Der Voit GB, De Wolff FA, Paays
CHC, & Valkenburg HA (1988) Serum copper and zinc and the risk of
death from cancer and cardiovascular disease. Am J Epidemiol, 128:
352-359.
Kolb M, Rach P, Schafer J, & Wild A (1992) Investigations of
oxidative UV photolysis: I. Sample preparation for the voltammetric
determination of Zn, Cd, Pb, Cu, Ni and Co in waters. Fresenius J
Anal Chem, 342: 341-349.
Konar SK & Mullick S (1993) Problems of safe disposal of petroleum
products, detergents, heavy metals and pesticides to protect
aquatic life. Sci Total Environ 2 (suppl): 989-1000.
Kosalwat P & Knight AW (1987a) Acute toxicity of aqueous and
substrate-bound copper to the midge, Chironomus decorus. Arch
Environ Contam Toxicol, 16(3): 275-282.
Kosalwat P & Knight AW (1987b) Chronic toxicity of copper to a
partial life cycle of the midge, Chironomus decorus. Arch Environ
Contam Toxicol, 16(3): 283-290.
Kraak MHS, Lavy D, Peeters WHM, & Davids C (1992) Chronic
ecotoxicity of copper and cadmium to the zebra mussel Dreissena
polymorpha. Arch Environ Contam Toxicol, 23: 363-369.
Kraak MHS, Toussaint M, Lavy D, & Davids C (1994) Short-term
effects of metals on the filtration rate of the zebra mussel
Dreissena polymorpha. Environ Pollut, 84: 139-143.
Kressner MJ, Stockert RJ, Morell AG, & Sternlieb I (1984) Origins
of biliary copper. Hepathology, 4(5): 867-870.
Krishnakumar PK, Asokan PK, & Pillai VK (1990) Physiological and
cellular responses to copper and mercury in the green mussel
Perna viridis (Linnaeus). Aquat Toxicol, 18(3): 163-174.
Krolczyk AJ, Bear CE, Lai PFH, & Schimmer BP (1995) Effects of
mutations in camp-dependent protein kinase on chloride efflux in
caco-2 human colonic carcinoma cells. J Cell Physiol, 162: 64-73.
Kruckeberg AL & Wu L (1992) Copper tolerance and copper
accumulation of herbaceous plants colonizing California copper
mines. Ecotoxicol Environ Saf, 23: 307-319.
Kumar D (1984) Genetics of Indian childhood cirrhosis. Trop Geogr
Med, 36(4): 313-316.
Kumpulainen J, Mutanen M, Paaki M, & Lehto J (1987) Validity of
calculation method in estimating mineral element concentration. Var
Foda, 39(1): 75-82.
Ladefoged O & Sturup S (1995) Copper deficiency in cattle, sheep
and horses caused by excess molybdenum from fly ash: a case report.
Vet Hum Toxicol, 37: 63-65.
Lanno RP, Slinger SJ, & Hilton JW (1985) Maximum tolerable and
toxicity levels of dietary copper in rainbow trout (Salmo
gairdneri Richardson). Aquaculture, 49: 257-268.
Larcher W (1995) Physiological plant ecology -- Ecophysiology and
stress physiology of functional groups, 3rd ed. Berlin,
Springer-Verlag.
LeBlanc GA (1982) Laboratory investigation into the development of
resistance of Daphnia magna (Straus) to environmental pollutants.
Environ Pollut, A27: 309-322.
LeBlanc GA (1985) Effects of copper on the competitive interactions
of two species of cladocera. Environ Pollut, A37: 13-25.
Lecyk M (1980) Toxicity of CuSO4 in mice embryonic development.
Zool Pol, 28: 101-105.
Lee YH & Stuebing RB (1990) Heavy metal contamination in the river
toad, Bufo juxtasper (Inger), near a copper mine in East
Malaysia. Bull Environ Contam Toxicol, 45: 272-279.
Lee SH, Lancey R, Montaser A, Madani N, & Linder MC (1993)
Ceruloplasmin and copper transport during the latter part of
gestation in the rat. Proc Soc Exp Biol Med, 203: 428-439.
Lehman AJ (1951) Chemicals in foods -- A report to the Association
of Food and Drug Officials on current developments: Part II.
Pesticides. Q Bull Assoc Food Drug Off, 15: 122-133.
Lehmann RG & Harter RD (1984) Assessment of copper-soil bond
strength by desorption kinetics. Soil Sci Soc Am J, 48: 769-772.
Leland HV, Fend SV, Dudley TL, & Carter JL (1989) Effects of copper
on species composition of benthic insects in a Sierra Nevada,
California, stream. Freshw Biol, 21: 163-179.
Lepp NW (1992) Uptake and accumulation of metals in bacteria and
fungi. In: Advances in trace substances research: Biogeochemistry
of trace metals. Boca Raton, Florida, Lewis Publishers, pp 283-289.
Levinson B, Gitschier J, Vulpe C, Whitney S, Yang S, & Packman S
(1993) Are X-linked cutis laxa and Menkes disease allelic? Nat
Genet, 3: 6.
Levy Y, Zeharia A, Grunebaum M, Nitzan M, & Steinherz R (1985)
Copper deficiency in infants fed cow milk. J Pediatr, 106: 786-788.
Lewis MA (1983) Effect of loading density on the acute toxicities
of surfactants, copper, and phenol to Daphnia magna Straus. Arch
Environ Contam Toxicol, 12: 51-55.
Lide DR & Frederikse HPR (1993) CRC handbook of chemistry and
physics, 74th ed. Boca Raton, Florida, CRC Press.
Lighthart B, Baham J, & Volk VV (1983) Microbial respiration and
chemical speciation in metal-amended soils. J Environ Qual, 12(4):
543-548.
Lim CT & Choo KE (1979) Wilson's disease in a 2 year old child. J
Singap Paediatr Soc, 21: 99-102.
Lin W, Rice MA, & Chien PK (1992) The effects of copper, cadmium
and zinc on particle filtration and uptake of glycine in the
Pacific oyster Crassostrea gigas. Comp Biochem Physiol, 103C(1):
181-187.
Lin H-C & Dunson WA (1993) The effect of salinity on the acute
toxicity of cadmium to the tropical, estuarine, hermaphroditic
fish, Rivulus marmoratus: a comparison of Cd, Cu, and Zn
tolerance with Fundulus heteroclitus. Arch Environ Contam
Toxicol, 25: 41-47.
Linder McC(1991) The biochemistry of copper. New York, Plenum
Press.
Linder MC & Hazegh-Azam M (1996) Copper biochemistry and molecular
biology. Am J Clin Nutr, 63: 797s-811s.
Linder MC, Wooten L, Cerveza P, Cotton S, Shulze R, & Lomeli N
(1998) Copper transport. Am J Clin Nutr, 67(suppl 5): 965/S-971/S.
Liu C-CF & Medeiros DM (1986) Excess diet copper increases systolic
blood pressure in rats. Biol Trace Elem Res, 9: 15-24.
Liu Y, Liu J, Iszard MB, Andrews GK, Palmiteer RD, & Klaassen CD
(1995) Transgenic mice that over-express metallothionein-I are
protected from cadmium lethality and toxicity. Toxicol Appl
Pharmacol, 135: 222-228.
Llewellyn GC, Floyd EA, Hoke GD, Weekley LB, & Kimbrough TD (1985)
Influence of dietary aflatoxin, zinc, and copper on bone size,
organ weight, and body weight in hamsters and rats. Bull Environ
Contam Toxicol, 35: 149-156.
Lo GS, Settle SL, & Steinke FH (1984) Bioavailability of copper in
isolated soybean protein using the rat as an experimental model.
J Nutr, 114: 332-340.
Lobban C, Harrison P, & Duncan M (1985) The physiological ecology
of seaweeds. Cambridge, UK, Cambridge University Press.
Logan JI, Harveyson KB, Wisdon GB, Highes AE, & Archbold GPR (1994)
Hereditary caeruloplasmin deficiency, dementia and diabetes
mellitus. Q J Med, 87: 663-670.
Logue JN, Koontz MD, & Hattwick MAW (1982) A historical prospective
mortality study of workers in copper and zinc refineries. J Occup
Med, 24: 398-408.
Lönnerdal B, Bell JG, & Keen CL (1985) Copper absorption from human
milk, cow's milk and infant formulas using a suckling rat model. Am
J Clin Nutr, 42: 836-844.
Lowe TP, May TW, Brumbaugh WG, & Kane DA (1985) National
contaminant, biomonitoring program: Concentration of seven elements
in freshwater fish 1978-1981. Arch Environ Contam Toxicol, 14:
363-388.
Lowy SL, Fisler JS, Drenick EJ, Hunt IF, & Swendseid ME (1986) Zinc
and copper nutriture in obese men receiving very low calorie diets
of soy or collagen protein. Am J Clin Nutr, 43(2): 272-287.
Lu PL, Huang KS, & Jiang SJ (1993) Determination of traces of
copper, cadmium and lead in biological and environmental samples by
flow-injection isotope dilution inductively coupled plasma mass
spectrometry. Anal Chim Acta, 284: 181-188.
Lukaski HC, Klevay LM, & Milne DB (1988) Effects of copper on human
autonomic cardiovascular function. Eur J Appl Physiol, 58: 74-80.
Lundborg M & Camner P (1984) Lysozyme levels in rabbit lung after
inhalation of nickel, cadmium, cobalt, and copper chlorides.
Environ Res, 34: 335-342.
Lussi A, Hotz P, & Schoenberg V (1992) [The release of mercury and
copper from in vivo aged amalgam fillings.] Schweiz. Mon.schr
Zahnmed, 102: 411-415 (in German).
Lydy MJ & Wissing TE (1988) Effect of sublethal concentrations of
copper on the critical thermal maxima (CTMax) of the fantail
(Etheostoma flabellare) and johnny (E. nigrum) darters. Aquat
Toxicol, 12: 311-322.
Lyle WH, Payton JE, & Hui M (1976) Haemodialysis and copper fever.
Lancet, I: 1324-1325.
Lynch SM & Strain JJ (1990) Effects of skim milk powder, whey or
casein on tissue trace element status and antioxidant enzyme
activities in rats fed control and copper-deficient diets. Nutr
Res, 10: 449-460.
Lyon DB (1984) Studies on the solubility of Ca, Mg, Zn, and Cu in
cereal products. Am J Clin Nutr, 39: 190-195.
Lyon TDB & Fell GS (1990) Isotopic composition of copper in serum
by inductively coupled plasma mass spectrometry. J Anal At
Spectrom, 5: 135-137.
Lyon TDB, Fell GS, Hutton RC, & Eaton AN (1988) Evaluation of
inductively coupled argon plasma mass spectrometry (ICP-MS) for
simultaneous multi-element trace analysis in clinical chemistry.
J Anal At Spectrom, 3: 265-271.
Lyon TDB, Fell GS, Gaffney D, McGaw BA, Russell RI, Park RHR,
Beattie AD, Curry G, Crofton RJ, Gunn I, Sturniolo GS, D'Inca R, &
Patriarca M (1995) Use of a stable copper isotope (65Cu) in the
differential diagnosis of Wilson's disease. Clin Sci, 88: 727-732.
Lyon TDB, Fletcher S, Fell GS, & Patriarca M (1996) Measurement and
application of stable copper isotopes to investigations of human
metabolism. Microchem J, 54: 236-243.
Ma W (1984) Sublethal toxic effects of copper on growth,
reproduction and litter breakdown activity in the earthworm
Lumbricus rubellus, with observations on the influence of
temperature and soil pH. Environ Pollut, A33: 207-219.
Ma W (1988) Toxicity of copper to lumbricid earthworms in sandy
agricultural soils amended with Cu-enriched organic waste
materials. Ecol Bull, 39: 53-56.
McArdle HJ (1995) The metabolism of copper during pregnancy -- a
review. Food Chem, 54: 79-84.
McArdle HJ & Erlich R (1991) Copper uptake and transfer to the
mouse fetus during pregnancy. J Nutr, 121: 208-214.
McCormick RJ, Ovecka GD, & Medeiros DM (1989) Myofibrillar and
nonmyofibrillar myocardial proteins of copper-deficient rats. J
Nutr, 119: 1683-1690.
McCullough AJ, Flemming R, & Thistle JL (1983) Diagnosis of
Wilson's disease presenting as fulminant hepatic failure.
Gastroenterology, 84: 161.
MacDonald JM, Shields JD, & Zimmer-Faust RK (1988) Acute toxicities
of eleven metals to early life-history stages of the yellow crab
Cancer anthonyi. Mar Biol, 98: 201-207.
McHargue JS (1925) The occurrence of copper, manganese, zinc,
nickel, and cobalt in soils, plants, and animals, and their
possible function as vital factors. J Agric Res, 30: 193-196.
McHargue JS (1926) Mineral constituents of the cotton plant. J Am
Soc Agron, 18: 1076-1083.
McHargue JS (1927a) The proportion and significance of copper, iron
and zinc in some mollusks and crustaceans. Trans Ky Acad Sci, 2:
46-52.
McHargue JS (1927b) Significance of the occurrence of manganese,
copper, zinc, nickel, and cobalt Kentucky blue grass. Ind Eng Chem
Res, 19: 274-276.
Mackey DJ & Higgins HW (1988) The copper-complexing capacity of
seawater. Sci Total Environ, 75: 151-167.
McKim JM & Benoit DA (1971) Effects of long-term exposures to
copper on survival, growth, and reproduction of brook trout
(Salvelinus fontinalis). J Fish Res Board Can, 28: 655-662.
McKim JM, Eaton JG, & Holcombe GW (1978) Metal toxicity of embryos
and larvae of eight species of freshwater fish: II. Copper. Bull
Environ Contam Toxicol, 19: 608-616.
McLachlan J (1973) Growth media -- marine. In: Stein JR ed.
Handbook of phycological methods, culture methods and growth
measurements. Cambridge, UK, Cambridge University Press, pp 25-51.
McLaren JW, Lam JWH, Berman SS, Akatsuka K, & Azeredo MA (1993)
On-line method for the analysis of sea-water for trace elements by
inductively coupled plasma mass spectrometry. J Anal At Spectrom,
8: 279-285.
McLaughlin JK, Chen JQ, Dosemeci M, Chen RA, Rexing SH, Wu Z, Hearl
FJ, McCawley MA, & Blot WJ (1992) A nested case-control study of
lung cancer among silica exposed workers in China. Br J Ind Med,
49: 167-171.
McLeese DW & Ray S (1986) Toxicity of CdCl2, CdEDTA, CuCl2, and
CuEDTA to marine invertebrates. Bull Environ Contam Toxicol, 36:
749-755.
McMaster D, McCrum E, Patterson CC, Kerr MM, O'Reilly D, Evans AE,
& Love AH (1992) Serum copper and zinc in random samples of the
population of Northern Ireland. Am J Clin Nutr, 56(2): 440-446.
McNulty HR, Anderson BS, Hunt JW, Turpen SL, & Singer MM (1994)
Age-specific toxicity of copper to larval topsmelt
Atherinops affinis. Environ Toxicol Chem, 13: 487-492.
MacRae RK, Smith DE, Swoboda-Colberg N, Meyer JS, & Bergmann HL (in
press) Copper binding affinity of rainbow trout
(Oncorhynchus mykiss) and brook trout (Salvelinus fontinalis)
gills. Environ Toxicol Chem.
Madoni P, Esteban G, & Gorbi G (1992) Acute toxicity of cadmium,
copper, mercury, and zinc to ciliates from activated sludge plants.
Bull Environ Contam Toxicol, 49: 900-905.
Madoni P, Davoli D, & Gorbi G (1994) Acute toxicity of lead,
chromium, and other heavy metals to ciliates from activated sludge
plants. Bull Environ Contam Toxicol, 53: 420-425.
Maessen O, Freedman B, & McCurdy R (1985) Metal mobilization in
home well water systems in Nova Scotia. J Am Water Works Assoc, 77:
73-80.
Maggiore G, Giacomo D, Sessa F, & Burgio GR (1987) Idiopathic
hepatic copper toxicosis in a child. J Pediatr Gastroenterol Nutr,
6: 908.
Malaisse F, Grégoire J, Brooks RR, Morrison RS, & Reeves RD (1978)
Aeolanthus biformifolius: a hyperaccumulator of copper from Zaïre.
Science, 199: 887-888.
Malaisse F, Grégoire J, Morrison RS, Brooks RR, & Reeves RD (1979)
Copper and cobalt in vegetation of Fungurume, Shaba Province,
Zaïre. Oikos, 33: 472-478.
Malea P, Haritonidis S, & Stratis I (1994) Bioaccumulation of
metals by Rhodophyta species at Antikyra Gulf (Greece) near an
aluminium factory. Bot Mar, 37: 505-513.
Malecki MR, Neuhauser EF, & Loehr RC (1982) The effect of metals on
the growth and reproduction of Eisenia foetida (Oligochaeta,
Lumbricidae). Pedobiologia, 24: 129-137.
Malhotra KM, Shukla GS, & Chandra SV (1982) Neurochemical changes
in rats coexposed to lead and copper. Arch Toxicol, 49: 331-336.
Malvankar PL & Shinde VM (1991) Ion-pair extraction and
determination of copper(II) and zinc(II) in environmental and
pharmaceutical samples. Analyst, 116: 1081-1084.
Manzler AD & Schreiner AW (1970) Copper-induced acute hemolytic
anemia: A new complication of hemodialysis. Ann Intern Med, 73:
409-412.
Marceau N & Aspin N (1973a) The intracellular distribution of the
radiocopper derived from ceruloplasmin and from albumin. Biochim
Biophys Acta, 328(2): 338-350.
Marceau N & Aspin N (1973b) The association of the copper derived
from ceruloplasmin with cytocuprein. Biochim Biophys Acta, 328(2):
351-358.
Marceau N, Aspin N, & Sass-Kortsak A (1970) Absorption of copper 64
from gastrointestinal tract of the rat. Am J Physiol, 218: 377-383.
MARCO (1989) Copper. Birmingham, UK, Market Analysis and Research
Company.
Marigomez JA, Angulo E, & Saez V (1986) Feeding and growth
responses to copper, zinc, mercury and lead in the terrestrial
gastropod Arion ater (Linne). J Molluscan Stud, 52: 68-78.
Marschner H (1986) Mineral nutrition of higher plants. New York,
London, Academic Press.
Martin NA (1986) Toxicity of pesticides to Allolobophora
caliginosa (Oligochaeta: Lumbricidae). N Z J Agric Res, 29:
699-706.
Martin TR & Holdich DM (1986) The acute lethal toxicity of heavy
metals to peracarid crustaceans (with particular reference to
fresh-water asellids and gammarids). Water Res, 20(9): 1137-1147.
Martin M, Hunt JW, Anderson BS, Turpen SL, & Palmer FH (1989)
Experimental evaluation of the mysid Holmesimysis costata as a
test organism for effluent toxicity testing. Environ Toxicol Chem,
8: 1003-1012.
Martin LA, McNemar A, & O'Brien EL (1994) Menkes kinky hair
disease. Am J Matern Child Nurs, 19(3): 162-164.
Martínez J, Soto Y, Vives-Rego J, & Bianchi M (1991)Toxicity of Cu,
Ni and alkylbenzene sulfonate (LAS) on the naturally occurring
bacteria in the Rhone river plume. Environ Toxicol Chem, 10:
641-647.
Marzin DR & Phi HV (1985) Study of the mutagenicity of metal
derivatives with Salmonella typhimurium TA 102. Mutat Res, 155:
49-51.
Mash DC, Pablo J, Flynn DD, Efange SM, & Weiner WJ (1990)
Characterization and distribution of transferrin receptors in the
rat brain. J Neurochem, 55: 1972-1979.
Masters BA, Kelly EJ, Quaife CJ, Brinster RL, & Palmiter RD (1994)
Targeted disruption of metallothionein I and II genes increases
sensitivity to cadmium. Proc Natl Acad Sci (USA), 91: 584-588.
Matejovic I & Durackova A (1994) Comparison of microwave digestion,
wet and dry mineralisation, and solubilisation of plant samples by
flow-injection isotope dilution inductively coupled plasma mass
spectrometry. Commun Soil Sci Plant Anal, 25: 1277-1288.
Mathur SP, Hamilton HA, & Levesque MP (1979) The mitigating effect
of residual fertilizer copper on the decomposition of an organic
soil in situ. Soil Sci Soc Am J, 43: 200-203.
Matsui S (1980) Evaluation of a Bacillus subtilis rec-assay for
the detection of mutagens which may occur in water environments.
Water Res, 14: 1613-1619.
Maund SJ, Taylor EJ, & Pascoe D (1992) Population responses of the
freshwater amphipod crustacean Gammarus pulex (L.) to copper.
Freshw Biol, 28: 29-36.
Mayer FL (1987) Acute toxicity handbook of chemicals to estuarine
organisms. Gulf Breeze, Florida, US Environmental Protection
Agency, Environmental Research Laboratory, 274 pp
(EPA/600/8-87/017).
Mayer FL & Ellersieck MR (1986) Manual of acute toxicity:
Interpretation and data base for 410 chemicals and 66 species of
freshwater animals. Washington, DC, US Department of Interior, Fish
and Wildlife Service, 506 pp (Resource Publication 160).
Mbofung CMF & Subbarau VV (1990) Trace element (zinc, copper, iron
and magnesium) concentrations in human placenta and their
relationship to birth weight of babies. Nutr Res, 10: 359-366.
Meador JP (1991) The interaction of pH, dissolved organic carbon,
and total copper in the determination of ionic copper and toxicity.
Aquat toxicol, 19: 13-32.
Medeiros DM, Milton A, Brunett E, & Stacy L (1991) Copper
supplementation effects on indicators of copper status and serum
cholesterol in adult males. Biol Trace Elem Res, 30(1): 1935.
Meissner W (1817) Sur la présence du cuivre dans les cendres des
végétaux. Ann Chim Phys, 4: 106.
Mercer JF, Livingston J, Hall B, Paynter JA, Begy C,
Chandrasekharappa S, Lockhart P, Grimes A, Bhave M, & Siemieniak D
(1993) Isolation of a partial candidate gene for Menkes disease by
positional cloning see comments. Nat Genet, 3: 20-25.
Mersch J, Morhain E, & Mouvet C (1993) Laboratory accumulation and
depuration of copper and cadmium in the freshwater mussel
Dreissena polymorpha and the aquatic moss
Rhynchostegium riparioides. Chemosphere, 27(8): 1475-1485.
Mesuere K & Fish W (1989) Behavior of runoff-derived metals in a
detention pond system. Water Air Soil Pollut, 47(´): 125-138.
Metaxas A & Lewis AG (1991) Copper tolerance of Skeletonema
costatum and Nitzschia thermalis. Aquat Toxicol, 19: 265-280.
Michalska AE & Choo KH (1993) Targeting and germ-line transmission
of a null mutation at the metallothionein I and II loci in mouse.
Proc Natl Acad Sci (USA), 90: 8088-8092.
Midorikawa T, Tanoue E, & Sugimura Y (1992) Interaction between
dissolved organic matter in seawater and copper. Sci Total Environ,
117/118: 499-507.
Migon C (1993) Riverine and atmospheric inputs of heavy metals to
the Ligurian Sea. Sci Total Environ, 138: 289-299.
Migon C, Morelli J, Nicolas E, & Copin-Montegut G (1991) Evaluation
of total atmospheric deposition of Pb, Cd, Cu and Zn to the
Ligurian Sea. Sci Total Environ, 105: 135-148.
Miller TG & Mackay WC (1980) The effects of hardness, alkalinity
and pH of test water on the toxicity of copper to rainbow trout
(Salmo gairdneri). Water Res, 14: 129-133.
Mills ES (1930) The treatment of idiopathic (hypochromic) anemia
with iron and copper. Can Med Assoc J, 22: 175-178.
Mills CF, Dalgarno AC, & Wenham G (1976) Biochemical and
pathological changes in tissues of Friesian cattle during the
experimental induction of copper deficiency. Br J Nutr, 35(3):
309-331.
Milne DB & Johnson PE (1993) Assessment of copper status: Effect of
age and gender on reference ranges in healthy adults. Clin Chem,
39: 883-887.
Milne DB, Johnson PE, Klevay LM, & Sandstead HH (1990) Effect of
copper intake on balance, absorption, and status indices of copper
in men. Nutr Res, 10: 975-986.
Minnich MM & McBride MB (1986) Effect of copper activity on carbon
and nitrogen mineralization in field-aged copper-enriched soils.
Plant Soil, 91: 231-240.
Mittal SR (1972) Oxyhaemoglobinuria following copper sulphate
poisoning: A case report and a review of the literature. Forensic
Sci, 1: 245-248.
Miyajima H, Nishimura Y, Mizoguchi K, Sakamota M, Shimizu T, &
Honda N (1987) Familial apoceruloplasmin deficiency associated with
blefarospasm and retinal degeneration. Neurology, 37: 761-767.
Moffett JM & Zika RG (1987) Photochemistry of copper complexes in
sea water. In: Zika RG & Cooper WJ ed. Photochemistry of
environmental aquatic systems. Washington, DC, American Chemical
Society, pp 116-131 (ACS Symposium Series No. 327).
Mohan P, Failla M, Bremner I, Arthur-Smith A, & Kerzner B (1995)
Biliary copper excretion in the neonatal rat: role of glutathione
and metallothionein. Hepatology, 21: 1051-1057.
Moore MN (1978) The distribution of dissolved copper in the eastern
Atlantic Ocean. Earth Planet Sci Lett, 41: 461.
Moore MV & Winner RW (1989) Relative sensitivity of
Ceriodaphnia dubia laboratory tests and pond communities of
zooplankton and benthos to chronic copper stress. Aquat Toxicol,
15: 311-330.
Moore PG, Rainbow PS, & Hayes E (1991) The beach-hopper
Orchestia gammarellus (Crustacea: Amphipoda) as a biomonitor for
copper and zinc: North Sea trials. Sci Total Environ, 106: 221-238.
Morgan JE & Morgan AJ (1988) Earthworms as biological monitors of
cadmium, copper, lead and zinc in metalliferous soils. Environ
Pollut, 54: 123-138.
Mori M, Hattori A, Sawaki M, Tsuzuki N, Sawada N, Oyamada M,
Sugawara N, & Enomoto K (1994) The LEC rat: a model for human
hepatitis, liver cancer, and much more. Am J Pathol, 144(1):
200-204.
Morita H, Ikeda S, Yamamoto K, Morita S, Yoshida K, Nomoto S, Kato
M, & Yanagisawa N (1995) Hereditary ceruloplasmin deficiency with
hemosiderosis: a clinicopathological study of a Japanese family.
Ann Neurol, 37(5): 646-656.
Moriya M, Ohta T, Watanabe K, Miyazawa T, Kato K, & Shirasu Y
(1983) Further mutagenicity studies on pesticides in bacterial
reversion assay systems. Mutat Res, 116: 185-216.
Morrison GMP & Florence TM (1989) Comparison of physicochemical
speciation procedures with metal toxicity to Chlorella
pyrenoidosa. Copper complexation capacity. Electroanalysis, 1:
107-112.
Moser H & Wieser W (1979) Copper and nutrition in Helix pomatia
(L.). Oecologia, 42: 241-251.
Mount DI (1968) Chronic toxicity of copper to fathead minnows
(Pimephales promelas, Rafinesque). Water Res, 2: 215-223.
Mount DI & Norberg TJ (1984) A seven-day life-cycle cladoceran
toxicity test. Environ. Toxicol Chem, 3: 425-434.
Mount DI & Stephen C (1969) Chronic toxicity of copper to fathead
minnow (Pimephales promelas) in soft water. J Fish Res Board Can,
26: 2449-2457.
Mount DR, Barth AK, Garrison TD, Barten KA, & Hockett JR (1994)
Dietary and waterborne exposure of rainbow trout
(Oncorhynchus mykiss) to copper, cadmium, lead and zinc using a
live diet. Environ Toxicol Chem, 13: 2031-2041.
Müller T, Feichtinger H, Berger H, & Müller W (1996) Endemic
Tyrolean infantile cirrhosis: an ecogenetic disorder. Lancet,
347(9005): 877-880.
Müller-Höcker J, Weiss M, & Meyer J (1987) Fatal copper storage
disease of the liver in a German infant resembling Indian childhood
cirrhosis. Virchows Arch A411: 379-385.
Müller-Höcker J, Meyer U, Wiebecke B, & Hubner G (1988) Copper
storage disease of the liver and chronic dietary copper
intoxication in two further German infants mimicking Indian
childhood cirrhosis. Pathol Res Pract, 183: 39-45.
Muñoz MJ, Carballo M, & Tarazona JV (1991) The effect of sublethal
levels of copper and cyanide on some biochemical parameters of
rainbow trout along subacute exposition. Comp Biochem Physiol,
100C: 577-582.
Murphy EA (1993) Effectiveness of flushing on reducing lead and
copper levels in school drinking water. Environ Health Perspect,
101: 240-241.
Murthy RC, Lal S, Saxena DK, Shukla GS, Ali MM, & Chandra SV (1981)
Effect of manganese and copper interaction on behavior and biogenic
amines in rats fed a 10% casein diet. Chem-Biol Interact, 37:
299-308.
Mussalo-Rauhamaa H, Salmela SS, Leppanen A, & Pyysalo H (1986)
Cigarettes as a source of some trace and heavy metals and
pesticides in man. Arch Environ Health, 41: 49-55.
Napolitano M, Gialanell G, Grossi GG, Durante M, Zhang YX, Lanzone
A, & Mancuso S (1994) Trace elements in amniotic fluid in different
physiopathologic conditions. Trace Elem Med, 11: 96-98.
Naveh Y, Hazzani A, & Berant M (1981) Copper deficiency with cow's
milk diet. Pediatrics, 68: 397-400.
Nayak NC & Ramalingaswamy V (1975) Indian childhood cirrhosis. Clin
Gastroenterol, 4: 333-339.
Nebeker AV, Cairns MA, & Wise CM (1984a) Relative sensitivity of
Chironomus tentans life stages to copper. Environ Toxicol Chem,
3: 151-158.
Nebeker AV, Savonen C, Baker RJ, & McCrady JK (1984b) Effects of
copper, nickel and zinc on the life cycle of the caddisfly
Clistoronia magnifica (Limnephilidae). Environ Toxicol Chem, 3:
645-649.
Nebeker AV, Stinchfield A, Savonen C, & Chapman GA (1986) Effects
of copper, nickel and zinc on three species of Oregon freshwater
snails. Environ Toxicol Chem, 5: 807-811.
Nectoux M & Bounias M (1988) Toxicologie du sulfate cuivrique chez
l'abeille: I. Nouveaux paramètres algébriques de létalité comme
alternative à la DL50. C R Séances Soc Biol, 182: 544-555.
Nell JA & Chvojka R (1992) The effect of bis-tributyltin oxide
(TBTO) and copper on the growth of juvenile Sydney rock oysters
Saccostrea commercialis (Iredale and Roughley) and Pacific
oysters Crassostrea gigas Thunberg. Sci Total Environ, 125:
193-201.
Nelson DA, Miller JE, & Calabrese A (1988) Effect of heavy metals
on bay scallops, surf clams, and blue mussels in acute and
long-term exposures. Arch Environ Contam Toxicol, 17: 595-600.
Nemcsók JG & Hughes GM (1988) The effect of copper sulphate on some
biochemical parameters of rainbow trout. Environ Pollut, 49: 77-85.
Neubecker TA & Allen HE (1983) The measurement of complexation
capacity and conditional stability constants for ligands in natural
waters--A review. Water Res, 17: 1-14.
Neuhauser EF, Malecki MR, & Loehr RC (1984) Growth and reproduction
of the earthworm Eisenia fetida after exposure to sublethal
concentrations of metals. Pedobiologia, 27: 89-97.
Neuhauser EF, Loehr RC, Milligan DL, & Malecki MR (1985) Toxicity
of metals to the earthworm Eisenia fetida. Biol Fertil Soils,
1: 149-152.
Neumann PZ & Sass-Kortsak A (1967) The state of copper in human
serum: evidence for an amino acid-bound fraction. J Clin Invest,
46(4): 646-658.
NFA (Australian National Food Authority) (1992) The 1992 Australian
market basket survey. Canberra, Australian Government Publishing
Service, 96 pp.
NFA (Australian National Food Authority) (1993) The 1992 Australian
market survey -- A total diet survey of pesticides and
contaminants. Canberra, Australian National Food Authority, 96 pp.
Nielsen FH, Gallagher SK, Johnson LK, & Nielsen EJ (1992) Boron
enhances and mimics some effects of estrogen therapy in
postmenopausal women. J Trace Elem Exp Med, 5: 237-246.
NIOSH (1981a) Health hazard evaluation report No. HHE-80-084-927,
General Electric Company, Lynn, Massachusetts. Springfield,
Virginia, US Department of Commerce, National Technical Information
Service (PB83-102848).
NIOSH (1981b) Health hazard evaluation report No. HHE-78-132-818,
Copper Division Southwire Company, Inc. Carrollton. Springfield,
Virginia, US Department of Commerce, National Technical Information
Service (PB82-188632).
NIOSH (1987) Manual of analytical methods, 3rd ed. Cincinnati,
Ohio, National Institute for Occupational Safety and Health (DHHS
Publication No. 84-100).
NIOSH (1993) Registry of toxic effects of chemical substances.
Cincinnati, Ohio, National Institute for Occupational Safety and
Health (Silverplatter, Chem-Bank, July 1993).
NIPHEP (1989) Integrated criteria document copper. Bilthoven, The
Netherlands, National Institute of Public Health and Environmental
Protection, 91 pp (Appendix to Report No. 758474 009).
Nishioka H (1975) Mutagenic activities of metal compounds in
bacteria. Mutat Res, 31: 185-189.
Nor YM (1987) Ecotoxicity of copper to aquatic biota: a review.
Environ Res, 43(1): 274-282.
Nor YM & Cheng HH (1986) Chemical speciation and bioavailability of
copper: uptake and accumulation by Eichornia. Environ Toxicol Chem,
5: 941-947.
Nordlind K & Liden S (1992) Patch test reactions to metal salts in
patients with oral mucosal lesions associated with amalgam
restorations. Contact Dermatitis, 27(3): 157-160.
NRC (National Research Council) (1980) Mineral tolerance of
domestic animals. Washington, DC, National Academy of Sciences.
Nriagu JO (1979a) Global inventory of natural and anthropogenic
emissions of trace metals to the atmosphere. Nature (Lond), 279:
409-411.
Nriagu JO ed. (1979b) Copper in the environment: Part 1. Ecological
cycling. New York, John Wiley & Sons Ltd, pp 43-75.
Nriagu JO (1989) A global assessment of natural sources of
atmospheric trace metals. Nature (Lond), 338: 47-49.
Odermatt A, Suter H, Krapf R, & Solioz M (1993) Primary structure
of two P-type ATPases involved in copper homeostasis in
Enterococcus hirae. J Biol Chem, 268: 12775-12779.
O'Donohue JW, Reid MA, Varghese A, Portmann B, & Williams R (1993)
Case report: Micronodular cirrhosis and acute liver failure due to
chronic copper self-intoxication. Eur J Gastroenterol Hepatol, 5:
561-562.
OECD (1995) Report of the OECD Workshop on Environmental
Hazard/Risk Assessment. Paris, Organisation for Economic
Co-operation and Development, 96 pp (OECD Environment Monographs
No.15; OCDE/GD(95)134).
Oestreicher P & Cousins RJ (1985) Copper and zinc absorption in the
rat: mechanism of mutual antagonism. J Nutr, 115: 159-166.
Ohi R & Lilly JR (1980) Copper kinetics in infantile hepatobiliary
disease. J Pediatr Surg, 15: 509-512.
Oikari A, Kukkonen J, & Virtanen V (1992) Acute toxicity of
chemicals to Daphnia magna in humic waters. Sci Total Environ,
117/118: 367-377.
Olin KL, Walter RM, & Keen CL (1994) Copper deficiency affects
selenoglutathione peroxidase and selenodeiodinase activities and
antioxidant defense in weanling rats. Am J Clin Nutr, 59: 654-658.
Olivier P & Marzin D (1987) Study of the genotoxic potential of 48
inorganic derivatives with the SOS chromotest. Mutat Res, 189:
263-269.
Olsen KB, Wang J, Setiadji R, & Lu JM (1994) Fiels screening of
chromium, zinc, copper, and lead in sediments by stripping
analysis. Environ Sci Technol, 28: 2074-2079.
OMME (1992) Air monitoring programme. Toronto, Canada, Province of
Ontario, Ministry of Environment and Energy (Unpublished data).
Omoto E & Tavassoli M (1990) Purification and partial
characterization of ceruloplasmin receptors from rat liver
endothelium. Arch Biochem Biophys, 282: 34-38.
O'Neill NC & Tanner MS (1989) Uptake of copper from brass vessels
by bovine milk and its relevance to Indian childhood cirrhosis. J
Pediatr Gastroenterol Nutr, 9: 167-172.
Oris JT, Winner RW, & Moore MV (1991) A four-day survival and
reproduction toxicity test for Ceriodaphnia dubia. Environ
Toxicol Chem, 10: 217-224.
Ortel J, Gintenreiter S, & Nopp H (1993) The effects of host metal
stress on a parasitoid in an insect/insect relationship
(Lymantria dispar L., Lymantriidae Lepid.- Glyptapanteles
liparidis Bouchè, Braconidae Hym.). Arch Environ Contam Toxicol,
24: 421-426.
Ottley CJ & Harrison RM (1993) Atmospheric dry deposition flux of
metallic species to the North Sea. Atmos Environ, 27A: 685-695.
Ouseph PP (1992) Dissolved and particulate trace metals in the
Cochin estuary. Mar Pollut Bull, 24(4): 186-192.
Overvad K, Wang DY, Olsen J, Allen DS, Thorling EB, Bulbrook RD, &
Hayward JL (1993) Copper in human mammary carcinogenesis: a
case-cohort study. Am J Epidemiol, 137: 409-414.
Owen CA Jr (1965) Metabolism of radio copper (Cu64) in the rat. Am
J Physiol, 209: 900-904.
Owen CA Jr (1982) Biochemical aspects of copper: Copper deficiency
and toxicity. In: Physiological aspects of copper. Park Ridge, New
Jersey, Noyes Publications.
Ozoh PTE (1992a) The effect of temperature and salinity on copper
body-burden and copper toxicity to Hediste (Nereis) diversicolor.
Environ Monit Assess, 21: 11-17.
Ozoh PTE (1992b) The importance of adult Hediste (Nereis)
diversicolor in managing heavy metal pollution in shores and
estuaries. Environ Monit Assess, 21: 165-171.
Ozoh PTE (1992c) The effects of salinity, temperature and sediment
on the toxicity of copper to juvenile Hediste (Nereis)
diversicolor (O.F. Muller). Environ Monit Assess, 21(1): 1-10.
Ozoh PTE (1994) The effect of salinity, temperature and time in the
accumulation and depuration of copper in ragworm, Hediste (Nereis)
diversicolor (O.F. Muller). Environ Monit Assess, 29: 155-166.
Ozoh PTE & Jones NV (1990) The effects of salinity and temperature
on the toxicity of copper to 1-day and 7-day-old larvae of Hediste
(Nereis) diversicolor (O.F. Muller). Ecotoxicol Environ Saf, 19:
24-32.
Pagenkopf GK (1983) Gill surface interaction model for trace metal
toxicity to fishes: Role of complexation, pH, and water hardness.
Environ Sci Technol, 17(6): 342-347.
Palanques A. & Diaz JI (1994) Anthropogenic heavy metal pollution
in the sediments of the Barcelona continental shelf (northwestern
Mediterranean). Mar Environ Res, 38: 17-31.
Palmiter RD (1993) Constitutive expression of metallothionein -- III
(MT-III), but not MT-I, inhibits growth when cells become zinc
deficient. Toxicol Appl Pharmacol, 135: 139-146.
Palmiter RD, Sandgren EP, Koeller DM, & Brinster RL (1993) Distal
regulatory elements from the mouse methallothionein locus stimulate
gene expression in transgenic mice. Mol Cell Biol, 13: 5266-5275.
Pandit AN & Bhave SA (1983) Copper and Indian childhood cirrhosis.
Indian Pediatr, 20: 893-899.
Pantani C, Ghetti PF, Cavacini A, & Muccioni P (1990) Acute
toxicity of equitoxic binary mixtures of some metals, surfactants
and pesticides to the freshwater amphipod Gammarus italicus
Goedm. Environ Technol, 11: 1143-1146.
Pantani C, Spreti N, Novelli AA, Ghirardini AV, & Ghetti PF (1995)
Effect of particulate matter on copper and surfactants' acute
toxicity to Echinogammarus tibaldii (Crustacea, Amphipoda).
Environ Technol, 16: 263-270.
Paoletti MG, Iovane E, & Cortese M (1988) Pedofauna bioindicators
and heavy metals in five agroecosystems in north-east Italy. Rev
Ecol Biol Sol, 25: 33-58.
Parekh SR & Patel BD (1972) Epidemiologic survey of Indian
childhood cirrhosis. Indian Pediatr, 9: 43-49.
Parmelee RW, Wentsel RS, Phillips CT, Simini M, & Checkai RT (1993)
Soil microcosm for testing the effects of chemical pollutants on
soil fauna communities and trophic structure. Environ Toxicol Chem,
12: 1477-1486.
Parrish CS & Uchrin CG (1990) Runoff-induced metals in Lakes Bay,
New Jersey. Environ Toxicol Chem, 9: 559-567.
Paulson PC, Pratt JR, & Cairns J (1983) Relationship of alkaline
stress and acute copper toxicity in the snail Goniobasis livescens
(Menke). Bull Environ Contam Toxicol, 31: 719-726.
Pedder SCJ & Maly EJ (1985) The effect of lethal copper solutions
on the behavior of rainbow trout, Salmo gairdneri. Arch Environ
Contam Toxicol, 14: 501-507.
Pennington JA, Young BE, Wilson DB, Johnson RD, & Vanderveen JE
(1986) Mineral content of food and total diets: the selected
minerals in food surveys 1982 to 1984. J Am Diet Assoc, 86(7):
876-891.
Pennington JA, Young BE, & Wilson DB (1989) Nutritional elements in
US diets: results from the total diet study, 1982 to 1986. J Am
Diet Assoc, 89(5): 659-664.
Percival SS (1995) Neutropenia caused by copper deficiency:
possible mechanisms of action. Nutr Rev, 53: 59-66.
Percival SS & Harris ED (1988) Specific binding of ceruloplasmin to
hemin-induced K562 cells. J Trace Elem Exp Med, 1: 63-70.
Percival SS & Harris ED (1990) Copper transport from ceruloplasmin:
characterization of the cellular uptake mechanism. Am J Physiol,
258C: 140-146.
Percival SS & Harris ED (1991) Regulation of Cu, Zn superoxide
dismutase with copper. Caeruloplasmin maintains levels of
functional enzyme activity during differentiation of K562 cells.
Biochem J, 274: 153-158.
Peres I & Pihan JC (1991a) Copper LC50 to Cyprinus carpio.
Influence of hardness, seasonal variation, proposition of maximum
acceptable toxicant concentration. Environ Technol, 12: 161-167.
Peres I & Pihan JC (1991b) Study of accumulation of copper by carp
(Cyprinus carpio L.) - adaptation analysis of bioconcentration by
the gills. Environ Technol, 12: 169-177.
Petering HG, Murthy L, Stemmer KL, Finelli VN, & Menden EE (1986)
Effects of copper deficiency on the cardiovascular system of the
rat. Biol Trace Elem Res, 9: 251-270.
Peterson RE & Bollier ME (1955) Spectrophotometric determination of
serum copper with biscyclohexanoeoxalyldihydrazone. Anal Chem,
27: 1195-1197.
Peterson DF, Koo SI, & Lee CC (1990) Interactive effects of dietary
(Cu) and carbohydrates on serum cholesterol (CH) and minerals.
FASEB J, 4: A534.
Petrukhin K, Fischer SG, & Pirastu M (1993) Mapping, cloning and
genetic characterisation of the region containing the Wilson
disease gene. Nat Genet, 5: 338.
Petruzzelli G, Szymura I, Lubrano L, & Cervelli S (1988) Retention
of Cu and Cd by soil influenced by different adsorbents.
Agrochimica, 32: 240-243.
Petruzzelli G, Lubrano L, Petronio BM, Gennaro MC, Vanni A, &
Liberatori A (1994) Soil sorption of heavy metals as influenced by
sewage sludge addition. J Environ Sci Health, A29: 31-50.
Pettersson R & Sandstrom B (1995) Copper. In: Oskarsson A ed. Risk
evaluation of essential trace elements: essential versus toxic
levels of intake. Copenhagen, Nordic Council of Ministers, pp
149-167 (Report NORD 1995:18).
Phelps HL, Hardy JT, Pearson WH, & Apts CW (1983) Clam burrowing
behaviour: inhibition by copper-enriched sediment. Mar Pollut Bull,
14(12): 452-455.
Phillips DJH (1977) The use of biological indicator organisms to
monitor trace metal pollution in marine and estuarine environments:
A review. Environ Pollut, 13: 281-317.
Phipps GL, Mattson VR, & Ankley GT (1995) Relative sensitivity of
three freshwater benthic macroinvertebrates to ten contaminants.
Arch Environ Contam Toxicol, 28: 281-286.
Pickering QH & Lazorchak JM (1995) Evaluation of the robustness of
the fathead minnow, Pimephales promelas, larval survival and
growth test, US EPA method 1000.0. Environ Toxicol Chem, 14(4):
653-659.
Pickering Q, Brungs W, & Gast M (1977) Effect of exposure time and
copper concentration on reproduction of the fathead minnow
(Pimephales promelas). Water Res, 11: 1079-1083.
Pimentel JC & Marques F (1969) "Vineyard sprayer's lung": a new
occupational disease. Thorax, 24: 678-688.
Pimentel JC & Menezes AP (1975) Liver granulomas containing copper
in vineyard sprayer's lung: A new etiology of hepatic
granulomatosis. Am Rev Respir Dis, 111: 189-195.
Pimentel JC & Menezes AP (1977) Liver disease in vineyard sprayers.
Gastroenterology, 72: 275-283.
Pissarek HP (1974) [Investigation of the anatomical changes in oats
and sunflower, caused by copper deficiency.] Z Pflanz Ernähr
Bodenk, 137: 224-234 (in German).
Plamenac P, Santic Z, Nikulin A, & Serdarevic H (1985) Cytologic
changes of the respiratory tract in vineyard spraying workers. Eur
J Respir Dis, 67: 50-55.
Playle RA (1997) Physiological and toxicological effects of metals
at gills of freshwater fish. In: Bergmann HL & Dorward-King EJ ed.
Reassessment of metals criteria for aquatic life protection
-- Priorities for research and implementation: Proceedings of the
Pelleston Workshop on Reassessment of Metals Criteria for Aquatic
Life Protection, Pensacola, Florida, 10-14 February 1996, pp
101-105 (SETAC Technical Publication Series).
Playle RC, Gensemer RW, & Dixon DG (1992) Copper accumulation on
gills of fathead minnows: influence of water hardness, complexation
and pH of the gill micro-environment. Environ Toxicol Chem, 11:
381-391.
Playle RA, Dixon DG, & Burnison K (1993a) Copper and cadmium
binding to fish gills: modification by dissolved organic carbon and
synthetic ligands. Can J Fish Aquat Sci, 50: 2667-2677.
Playle RA, Dixon DG, & Burnison K (1993b) Copper and cadmium
binding to fish gills: estimates of metal-gill stability constants
and modelling of metal accumulation. Can J Fish Aquat Sci, 50:
2678-2687.
Pocino M, Malavé I, & Baute L (1990) Zinc administration restores
the impaired immune response observed in mice receiving excess
copper by oral route. Immunopharmacol Immunotoxicol, 12: 697-713.
Pocino M, Baute L, & Malave I (1991) Influence of the oral
administration of excess copper on the immune response. Fundam Appl
Toxicol, 16: 249-256.
Pradhan AM, Talbot IC, & Tanner MS (1983) Indian childhood
cirrhosis and other cirrhosis of Indian children. Pediatr Res, 17:
435-438.
Prasad AS, Brewer GJ, Schoomaker EB, Rabbani P (1978) Hypocupremia
induced by zinc therapy. J Am Med Assoc, 1978: 2166-2168.
Prasad MPR, Krishna TP, Pasricha S, Krishnaswamy K, & Quereshi MA
(1992) Esophageal cancer and diet a case-control study. Nutr
Cancer, 18: 85-93.
Pratt WB, Omdahl JL, & Sorenson JRJ (1985) Lack of effects of
copper gluconate supplementation. Am J Clin Nutr, 42: 681-682.
Prins HW & Van den Hamer CJ (1981) Comparative studies of copper
metabolism in liver and kidney of normal and mutated brindled mice
-- with special emphasis on metallothionein. Comp Biochem Physiol,
C70(2): 255-260.
Prohaska JR & Failla ML (1993) Copper and immunity In: Klurfeld DM
ed. Human nutrition: A comprehensive treatise -- Volume 8.
Nutrition and immunology. New York, Plenum Press, pp 309-332.
Prohaska JR, Bailey WR, & Cox DA (1985) Failure of iron injection
to reverse copper dependent anemia in mice. In: Mills CF, Bremner
I, & Chesters JK ed. Trace elements in man and animals. Slough,
Bucks, UK, Commonwealth Agricultural Bureau, pp 27-32.
Prothro MY (1993) Guidance on interpretation and implementation of
aquatic life metals criteria. Washington, DC, US Environmental
Protection Agency, Office of Water Policy and Technical Guidance.
Punsar S, Erametese O, Karvonen MJ, Ryahanen A, Hilska P, & Vornamo
H (1975) A search in two Finnish male cohorts for epidemiologic
evidence of a water factor. J Chron Dis, 28: 259-287.
Rad MR, Kirchrath L, & Hollenberg CP (1994) A putative p-type
cu2+-transporting atpase gene on chromosome II of saccharomyces
cerevisiae. Yeast, 10: 1217-1225.
Ragan HA, Natch S, Lee GR, Bishop CR, & Cartwright GE (1969) Effect
of ceruloplasmin on plasma iron in copper deficient swine. Am J
Physiol, 217: 1320-1323.
Rahimi A & Bussler W (1973) [Physiological conditions for the
development of copper deficiency symptoms.] Z Pflanz Bodenk,
136: 25-32 (in German).
Rahimi A & Bussler W (1974) [Copper deficiency in higher plants and
its histochemical detection.] Landwirtsch Forsch Sonderh, 30:
101-111 (in German).
Rainbow PS (1988) The significance of trace metal requirements in
decapods. Symp Zool Soc Lond, 59: 291-313.
Rainbow PS & Abdennour C (1989) Copper and hemocyanin in the
mesopelagic decapod crustacean Systellaspis debilis. Oceanol
Acta, 12(1): 91-94.
Rainbow PS & White SL (1989) Comparative strategies of heavy metal
accumulation by crustaceans: zinc, copper and cadmium in a decapod,
an amphipod and a barnacle. Hydrobiologia, 174: 245-262.
Rainbow PS, Moore PG, & Watson D (1989) Talitrid amphipods
(Crustacea) as biomonitors for copper and zinc. Estuar Coast Shelf
Sci, 28: 567-582.
Rajalekshmi P & Mohandas A (1993) Effect of heavy metals on tissue
glycogen levels in the freshwater mussel, Lamellidens corrianus
(Lea). Sci Total Environ, 1: 617-630.
Rand GM & Petrocelli SR (1985) Fundamentals of aquatic toxicology.
New York, Hemisphere Publishing Corporation, 666 pp.
Räsänen L, Hattula ML, & Arstila AU (1977) The mutagenicity of MCPA
and its soil metabolites, chlorinated phenols, catechols and some
widely used slimicides in Finland. Bull Environ Contam Toxicol, 18:
565-571.
Rauser WE & Winterhalder EK (1985) Evaluation of copper, nickel,
and zinc tolerances in four grass species. Can J Bot, 63: 58-63.
Redpath KJ & Davenport J (1988) The effect of copper, zinc and
cadmium on the pumping rate of Mytilus edulis L. Aquat Toxicol,
13(3): 217-226.
Reed RH & Moffat L (1983) Copper toxicity and copper tolerance in
Enteromorpha compressa (L.) Grev. J Exp Mar Biol Ecol, 69(1):
85-103.
Rehwoldt R, Menapace LW, Nerrie B, & Alessandrello D (1972) The
effect of increased temperature upon the acute toxicity of some
heavy metal ions. Bull Environ Contam Toxicol, 8: 91-96.
Rehwoldt R, Lasko L, Shaw C, & Wirhowski E (1973) The acute
toxicity of some heavy metal ions toward benthic organisms. Bull
Environ Contam Toxicol, 10: 291-294.
Reilly A & Reilly C (1973) Copper-induced chlorosis in Becium
homblei (De Wild) Duvign. and Plancke. Plant Soil, 38: 671-674.
Reilly C (1967) Accumulation of copper by some Zambian plants.
Nature (Lond), 215: 667-668.
Reiser S, Smith JC, Mertz W, Holbrook JT, Scholfield DJ, Powell AS,
Canfield WK, & Canary JJ (1985) Indices in copper status in humans
consuming a typical American diet containing either fructose or
starch. Am J Clin Nutr, 42 242-251.
Reiser S, Powell A, Yang C-Y, & Canary JJ (1987) Effect of copper
intake on blood cholesterol and its lipoprotein distribution in
men. Nutr Rep Int, 36(3): 641-649.
Remoudaki E, Bergametti G, & Losno R (1991) On the dynamic of the
atmospheric input of copper and manganese into the western
Mediterranean Sea. Atmos Environ, 25A: 733-744.
Reunanen A, Knekt P, & Aaran RK (1992) Serum ceruloplasmin level
and the risk of myocardial infarction and stroke. Am J Epidemiol,
136: 1082-1090.
Reuther W & Smith PF (1952) Iron chlorosis in Florida citrus groves
in relation to certain soil constituents. Proc Fla State Hortic
Soc, 65: 62-69.
Reuther W & Smith PF (1953) Effects of high copper content of sandy
soil on growth of citrus seedlings. Soil Sci, 75: 219-224.
Richmond J, Strehlow CD, & Chalkley SR (1993) Dietary intake of Al,
Ca, Cu, Fe, Pb, and Zn in infants. Br J Biomed Sci, 50: 178-186.
Ringwood AH (1992) Comparative sensitivity of gametes and early
developmental stages of a sea urchin species (Echinometra mathaei)
and a bivalve species (Isognomon californicum) during metal
exposures. Arch Environ Contam Toxicol, 22: 288-295.
Ritchie HD, Luecke RW, Baltzer BV, Miller ER, Ullrey DE, & Hoefer
JA (1963) Copper and zinc interrelationships in the pig. J Nutr,
79: 117-123.
Robbins CT (1983) Wildlife feeding and nutrition. New York, London,
Academic Press, 343 pp.
Robbins KR & Baker DH (1980) Effect of sulfur amino acid level and
source on the performance of chicks fed high levels of copper.
Poult Sci, 59: 1246-1253.
Robson AD & Reuter DJ (1981) Diagnosis of copper deficiency and
toxicity. In: Loneragan JF, Robson AD, & Graham RD ed. Copper in
soils and plants: Proceedings of the Golden Jubilee International
Symposium, Murdoch University, Perth, Western Australia. London,
New York, Sydney, Academic Press, pp 287-312.
Rodriguez A, Soto G, Torres S, Venegas G, & Castillo-Duran C (1985)
Zinc and copper in hair and plasma of children with chronic
diarrhea. Acta Paediatr Scand, 74: 770-774.
Rogers JE & Li SW (1985) Effect of metals and other inorganic ions
on soil microbial activity: soil dehydrogenase assay as a simple
toxicity test. Bull Environ Contam Toxicol, 34: 858-865.
Román DA & Rivera L (1992) The behaviour of a Cu (II) ion selective
electrode in seawater; copper consumption capacity and copper
determinations. Mar Chem, 38: 165-184.
Romo-Kröger CM & Llona F (1993) A case of atmospheric contamination
at the slopes of the Los Andes mountain range. Atmos Environ, 27A:
401-404.
Romo-Kröger CM, Morales JR, Dinator MI, Llona F, & Eaton LC (1994)
Heavy metals in the atmosphere coming from a copper smelter in
Chile. Atmos Environ, 28: 705-711.
Rose GA & Parker GH (1983) Metal content of body tissues, diet
items, and dung of ruffed grouse near the copper-nickel smelters at
Sudbury, Ont. Can J Zool, 61: 505-511.
Rowe DW, McGoodwin EB, Martin GR, & Gahn D (1977) Decreased
lysyloxidase activity in aneurysm-rione, mottled mouse. J Biol
Chem, 252: 939-942.
Rucker RB, Parker HE, & Rogler JC (1969) Effect of copper
deficiency on chick bone collagen and selected bone enzymes. J
Nutr, 98: 57-63.
Ruiz R, Romero F, & Besga G (1991) Selective solubilization of
heavy metals in torrential river sediments. Toxicol Environ Chem,
33: 1-6.
Ruoling C & Mengxuan H (1990) A cohort study of cancer mortality in
copper miners. In Sakurai H ed. Occupational epidemiology.
Amsterdam, Elsevier Science Publishers BV, Biomedical Division, pp
75-78.
Saari JT & Johnson WT (1990) Time course of hematocrit and heart
weight changes in dietary copper deficiency. FASEB J, 4: A391.
Sahoo DK, Kar RN, & Das RP (1992) Bioaccumulation of heavy metal
ions by Bacillus circulans. Bioresour Technol, 41: 177-179.
Salim S, Farquharson J, Arneil GC, Cockburn F, Forbes GI, Logan RW,
Sherlock JC, & Wilson TS (1986) Dietary copper intake in
artificially fed infants. Arch Dis Child, 61(11): 1068-1075.
Salomons W & Eagle AM (1990) Hydrology, sedimentology and the fate
and distribution of copper in mine-related discharges in the Fly
River system, Papua New Guinea. Sci Total Environ, 97/98: 315-334.
Salonen JT, Salonen R, Korpela H, Suntioinen S, & Tuomilehto J
(1991) Serum copper and the risk of acute myocardial infarction: A
prospective population study in men in Eastern Finland. Am J
Epidemiol, 134: 268-276.
Samanidou V & Fytianos K (1990) Mobilization of heavy metals from
river sediments of northern Greece by complexing agents. Water Air
Soil Pollut, 52: 217-225.
Samanidou V, Papadoyannis I, & Vasilikiotis G (1991) Mobilization
of heavy metals from river sediments of northern Greece, by humic
substances. J Environ Sci Health, A26: 1055-1068.
Sanders JR & McGrath SP (1988) Experimental measurements and
computer predictions of copper complex formation by soluble soil
organic matter. Environ Pollut, 49: 63-76.
Sarzeau A (1830) Sur la présence du cuivre dans les végétaux et
dans le sang. J. Pharm Sci Accessoires, 16: 505-518.
Sato M & Bremner I (1984) Biliary excretion of metallothionein and
a possible degradation product in rats injected with copper and
zinc. Biochem J, 223: 475-479.
Saward D, Stirling A, & Topping G (1975) Experimental studies on
the effects of copper on a marine food chain. Mar Biol, 29:
351-361.
Sayer MDJ, Reader JP, & Morris R (1989) The effect of calcium
concentration on the toxicity of copper, lead and zinc to yolk-sac
fry of brown trout, Salmo trutta L., in soft, acid water. J Fish
Biol, 35: 323-332.
Scanferlato VS & Cairns J (1990) Effect of sediment-associated
copper on ecological structure and function of aquatic microcosms.
Aquat Toxicol, 18: 23-34.
Scarano G, Morelli E, Seritti A, & Zirino A (1990) Determination of
copper in seawater by anodic stripping voltammetry using
ethylenediamine. Anal Chem, 62: 943-948.
Schafer EW Jr & Bowles WA Jr (1985) Acute oral toxicity and
repellency of 933 chemicals to house and deer mice. Arch Environ
Contam Toxicol, 14: 111-129.
Schäfer H, Wenzel A, Fritsche U, Röderer G, & Traunspurger W (1993)
Long-term effects of selected xenobiotica on freshwater green
algae: development of a flow-through test system. Sci Total
Environ, 1(suppl): 735-740.
Schäfer H, Hettler H, Fritsche U, Pitzen G, Roderer G, & Wenzel A
(1994) Biotests using unicellular algae and ciliates for predicting
long-term effects of toxicants. Ecotoxicol Environ Saf, 27: 64-81.
Schecher WD & McAvoy DC (1992) MINEQL+: a software environment for
chemical equilibrium modeling. Comput Environ Urban Syst, 16: 65-76
Scheinberg IH & Sternlieb I (1994) Is non-Indian childhood
cirrhosis caused by excess dietary copper? Lancet, 344: 1002-1004.
Schiatz EH (1949) Metal fume fever produced by copper dust. In:
Proceedings of 9th International Congress on Industrial Medicine,
London, 13-17 September 1948. Bristol, UK, John Wright & Sons, pp
798-801.
Schilsky ML & Sternlieb I (1993) Animal models of copper toxicosis.
Adv Vet Sci Comp Med, 37: 357-377.
Schilsky ML (1994) Identification of the Wilson's gene: clues for
disease pathogenesis and the potential for molecular diagnosis.
Hepatology, 20: 529.
Schilsky ML, Scheinberg IH, & Sternlieb I (1991) Prognosis of
Wilsonian chronic active hepatitis. Gastroenterology, 100: 762.
Schilsky ML, Scheinberg IH, & Sternlieb I (1994a) Liver
transplantation for Wilson's disease: indications and outcome.
Hepatology, 9: 583.
Schilsky ML, Stockert RJ, & Sternlieb I (1994b) Pleiotropic effect
of the LEC mutation: a rodent model of Wilson's disease. Am J
Physiol, 266: G907.
Schimmelpfennig W, Dieter HH, & Tabert M (1996) Cirrhosis of the
liver in early childhood and copper content of drinking and well
water, respectively: Multi-centric retrospective clinical study on
frequency, distribution and etiology in Germany. Berlin, Institute
for Water, Soil and Air Hygiene of the Federal Environmental Agency
of Germany.
Schmidt JM (1988) Determination of the toxic limit concentration
and the 50% inhibitory concentration of sodium chloride, copper
sulfate, dodecylhydrogensulfate-sodium salt and calcium cyanamide
on the primary root seeds of Lupius albus and Cier aretinum. Z
Wasser Abwasser Forch, 21: 107-109.
Schmitt CJ & Brumbaugh WG (1990) National contaminant biomonitoring
program: Concentrations of arsenic, cadmium, copper, lead, mercury,
selenium, and zinc in US freshwater fish, 1976-1984. Arch Environ
Contam Toxicol, 19: 731-747.
Schock MR & Neff CH (1988) Trace metal contamination from brass
fittings. J Am Water Works Assoc, 7: 47-56.
Schoenemann HM, Failla ML, & Steele NC (1990) Consequences of
severe copper deficiency are independent of dietary carbohydrate in
young pigs. Am J Clin Nutr, 52: 147-154.
Schramel P, Müller-Höcker J, Meyer U, Wei M, & Eife R (1988)
Nutritional copper intoxication in three German infants with severe
liver cell damage (features of Indian childhood cirrhosis). J Trace
Elem Electrolytes Health Dis, 2: 85-89.
Schrauzer GN, White DA, & Schneider CJ (1977) Cancer mortality
correlation studies: IV: Associations with dietary intakes and
blood levels of certain trace elements, notably Seantagonists.
Bioinorg Chem, 7: 35-56.
Schreiber DR, Gordon AS, & Millero FJ (1985) The toxicity of copper
to the marine bacterium Vibrio alginolyticus. Can J Microbiol,
31: 83-87.
Schroeder WH, Dobson M, Kane DM, & Johnson ND (1987) Toxic trace
elements associated with airborne particulate matter: A review. J
Air Pollut Control Assoc, 37: 1267-1285.
Schubauer-Berigan MK, Dierkes JR, Monson PD & Ankley GT (1993)
pH-dependent toxicity of Cd, Cu, Ni and Zn to Ceriodaphnia dubia,
Pimephales promelas, Hyalella azteca and Lumbriculus
variegatus. Environ Toxicol Chem, 12: 1261-1266.
Schubert WK & Lahey ME (1959) Copper and protein depletion
complicating hypoferic anemia of infancy. Pediatrics, 24: 710-733.
Schultz CL & Hutchinson TC (1988) Evidence against a key role for
metallothionein-like protein in the copper tolerance mechanism of
Deschampsia cespitosa (L) Beauv. New Phytol, 110(2): 163-171.
Scott J, Gollan JL, Samourian S, & Sherlock S (1978) Wilson's
disease, presenting as chronic active hepatitis. Gastroenterology,
74(4): 645-651.
Scudder BC, Carter JL, & Leland HV (1988) Effects of copper on
development of the fathead minnow, Pimephales promelas
Rafinesque. Aquat Toxicol, 12: 107-124.
Scudlark JR, Conko KM, & Church TM (1994) Atmospheric wet
deposition of trace elements to Chesapeake Bay: CBAD study year 1
results. Atmos Environ, 28: 1487-1498.
Seim WK, Curtis LR, Glenn SW, & Chapman GA (1984) Growth and
survival of developing steelhead trout (Salmo gairdneri)
continuously or intermittently exposed to copper. Can J Fish Aquat
Sci, 41: 433-438.
Sela M, Tel-Or E, Fritz E, & Huttermann A (1988) Localization and
toxic effects of cadmium, copper, and uranium in Azolla. Plant
Physiol, 88: 30-36.
Semple AB, Parry WH, & Phillips DE (1960) Acute copper poisoning:
An outbreak traced to contaminated water from a corroded geyser.
Lancet, 2: 700-701.
Sethi S, Grover S, & Khodaskar MB (1993) Role of copper in Indian
childhood cirrhosis. Ann Trop Paediatr, 13: 3-6.
Shacklette HT & Boerngen JG (1984) Element concentrations in soils
and other surficial materials of the conterminous United States.
Washington, DC, US Geological Survey, 105 pp (US Geological Survey
Professional Paper No. 1270).
Shanaman JE (1972) Report of one year chronic oral toxicity of
copper gluconate (W10219A) in beagle dogs. Morris Plains, New
Jersey, Warner Lambert Research Institute (Report No. 955-0353).
Shanaman JE, Wazeter FX, & Goldenthal EI (1972) One-year chronic
oral toxicity of copper gluconate, W/02/09A, in beagle dogs. Morris
Plains, New Jersey, Warner-Lambert Research Institute (Research
Report No. 955-0353).
Shaner SW & Knight AW (1985) The role of alkalinity in the
mortality of Daphnia magna in bioassays of sediment-bound copper.
Comp Biochem Physiol, 82C: 273-277.
Shanmukhappa H & Neelakantan K (1990) Influence of humic acid on
the toxicity of copper, cadmium and lead to the unicellular alga,
Synechosystis aquatilis. Bull Environ Contam Toxicol, 44:
840-843.
Sharda B & Bhandari B (1984) Copper concentration in plasma, cells,
liver, urine, hair and nails in hepalobiliary disorders in
children. Indian Pediatr, 21: 167-171.
Sharma VK & Millero FJ (1988) Oxidation of copper(I) in seawater.
Environ Sci Technol, 22: 768-771.
Shaw JCL (1992) Copper deficiency in term and preterm infants. In:
Formon SJ & Zlotkin S ed. Nutritional anaemias. New York, Raven
Press Ltd, pp 105-119 (Nestlé Nutrition Workshop Series, Volume
30).
Shenkin A, Fraser WD, Mclelland JD, Fell GS, & Garden OJ (1987)
Maintenance of vitamin and trace element status in intravenous
nutrition using a complete nutritive mixture. J Parenter Enter
Nutr, 11(3): 238-242.
Shibu MP, Balchand AN, & Nambisan PNK (1990) Trace metal speciation
in a tropical estuary -- significance of environmental factors. Sci
Total Environ, 97/98: 267-287.
Shike M, Roulet M, Kurian R, Whitwell J, Stewart S, & Jeejeebhoy KN
(1981) Copper metabolism and requirements in total parental
nutrition. Gastroenterology, 81: 290-297.
Shiller AM & Boyle EA (1987) Variability of dissolved trace of
metals in the Mississippi River. Geochim Cosmochim Acta, 51:
3273-3277.
Sideris EG, Charalambous SC, Tsolomyty A, & Katsaros N (1988)
Mutagenesis, carcinogenesis and the metal elements -- DNA
interaction. Prog Clin Biol Res, 259: 13-25.
Silverberg BA, Stokes PM, & Ferstenberg LB (1976) Intranuclear
complexes in copper tolerant green algae. J Cell Biol, 69: 210-214.
Sinha S & Chandra P (1990) Removal of Cu and Cd from water by
Bacopa monnieri L. Water Air Soil Pollut, 51: 271-276.
Skornik WA & Brain JD (1983) Relative toxicity of inhaled metal
sulfate salts for pulmonary macrophages. Am Rev Respir Dis, 128:
297-303.
Slooff W, Cleven RFMJ, Janus JA, & Ros JPM (1989) Integrated
criteria document copper. Bilthoven, The Netherlands, National
Institute of Public Health and Environmental Protection, 147 pp
(Report No. 758474009).
Small M, Germaini MS, Small AM, Zoller WH, & Moyers JL (1981)
Airborne plume study of emissions from the processing of copper
ores in southeastern Arizona. Environ Sci Technol, 15: 293-299.
Smith CH & Bidlack WR (1980) Interrelationships of dietary ascorbic
acid and iron on the tissue distribution of ascorbic acid, iron and
copper in female guinea-pigs. J Nutr, 110: 1398-1408.
Smith MJ & Heath AG (1979) Acute toxicity of copper, chromate,
zinc, and cyanide to freshwater fish: effect of different
temperatures. Bull Environ Contam Toxicol, 22: 113-119.
Smith GJ & Rongstad OJ (1982) Small mammal heavy metal
concentrations from mined and control sites. Environ Pollut, 28A:
121-134.
Smith JD, Jordan RM, & Nelson ML (1975) Tolerance of ponies to high
levels of dietary copper. J Anim Sci, 41: 1645-1649.
Smith KL, Hann AC, & Harwood JL (1986) The subcellular localization
of absorbed copper in Fucus. Physiol Plant, 66(4): 692-698.
Smyth HF, Carpenter CP, Weil CS, Pozzani UC, Striegel JA, & Nycum
JS (1969) Range-finding toxicity data: list VII. Am Ind Hyg Assoc
J, 30: 470-476.
Snell TW & Persoone G (1989a) Acute toxicity bioassays using
rotifers: I. A test for brackish and marine environments with
Brachionus plicatilis. Aquat Toxicol, 14: 65-80.
Snell TW & Persoone G (1989b) Acute toxicity bioassays using
rotifers: II. A freshwater test with Brachionus rubens. Aquat
Toxicol, 14: 81-92.
Snell TW, Moffat BD, Janssen C, & Persoone G (1991) Acute toxicity
tests using rotifers: IV. Effects of cyst age, temperature, and
salinity on the sensitivity of Branchionus calyciflorus.
Ecotoxicol Environ Saf, 21: 308-317.
Soares HMVM, Teresa M, & Vasconcelos SD (1994) Study of the
lability of copper(II)-fulvic acid complexes by ion selective
electrodes and potentiometric stripping analysis. Anal Chim Acta,
293: 261-270.
Solioz M, Odermatt A, & Krapf R (1994) Copper pumping ATPases:
common concepts in bacteria and man. FEBS Lett, 346: 44-47.
Solomons NW (1979) On the assessment of zinc and copper nutriture
in man. Am J Clin Nutr, 32: 856-871.
Sorenson JRJ (1989) Copper complexes offer a physiological approach
to the treatment of chronic diseases. Prog Med Chem, 26: 437-568.
Sosnowski SL, Germond DJ, & Gentile JH (1979) The effect of
nutrition on the response of field populations of the calanoid
copepod Acartia tonsa to copper. Water Res, 13: 449-452.
Spitalny KC, Brondum J, Vogt RL, Sargent HE, & Kappel S (1984)
Drinking-water-induced copper intoxication in a Vermont family.
Pediatrics, 74: 1103-1106.
Spurgeon DJ, Hopkin SP, & Jones DT (1994) Effects of cadmium,
copper, lead and zinc on growth, reproduction and survival of the
earthworm Eisenia fetida (Savigny): Assessing the environmental
impact of point-source metal contamination in terrestrial
ecosystems. Environ Pollut, 84: 123-130.
Srivastava AK, Gupta BN, Bihari V, Mathur N, Gaur JS, Mahendra PN,
Kumar P, & Bharti RS (1992) Clinical studies in workers engaged in
maintenance of watermark moulds in a paper mill. Int Arch Occup
Environ Health, 64: 141-145.
Stack T, Aggett PJ, Aitken E, & Lloyd DJ (1990) Routine L-ascorbic
acid supplementation does not alter iron, copper, and zinc balance
in low-birth-weight infants fed a cow's milk formula. J Pediatr
Gastroenterol Nutr, 10: 351-356.
Stauber JL (1995) Toxicity testing using marine and freshwater
unicellular algae. Australasian J Ecotoxicol, 1: 15-24.
Stauber JL & Florence TM (1985a) The influence of iron on copper
toxicity to the marine diatom, Nitzchia closterium (Ehrenberg) W.
Smith. Aquat Toxicol, 6: 297-305.
Stauber JL & Florence TM (1985b) Interactions of copper and
manganese: a mechanism by which manganese alleviates copper
toxicity to the marine diatom, Nitzchia closterium (Ehrenberg) W.
Smith. Aquat Toxicol, 7: 241-254.
Stauber JL & Florence TM (1987) Mechanism of toxicity of ionic
copper and copper complexes to algae. Mar Biol, 94: 511-519.
Steele CW (1989) Effects of sublethal exposure to copper on diel
activity of sea catfish, Arius felis. Hydrobiologia, 178:
135-141.
Stein RS, Jenkins D, & Korns ME (1976) Death after use of cupric
sulfate as emetic. J Am Med Assoc, 235: 801.
Steinkuhler C, Sapora O, Carri MT, Nagel W, Marcocci L, Ciriolo MR,
Weser U, & Rotilio G (1991) Increase of Cu, Zn-superoxide dismutase
activity during differentiation of human K562 cells involves
activation by copper of a constantly expressed copper-deficient
protein. J Biol Chem, 266: 24580-24587.
Stenhammar L (1979) [Copper poisoning: A differential diagnosis of
diarrhoea in children.] Lakartidningen, 76(30-31): 2618-2620 (in
Swedish).
Stephenson RR (1983) Effects of water hardness, water temperature,
and size of the test organism on the susceptibility of the
freshwater shrimp, Gammarus pulex (L.) to toxicants. Bull Environ
Contam Toxicol, 31: 459-466.
Stephenson MD & Leonard GH (1994) Evidence for the decline of
silver and lead and the increase of copper from 1977 to 1990 in the
coastal marine waters.
Stern RV & Frieden E (1993) Partial purification of the rat
erythrocyte ceruloplasmin receptor monitored by an electrophoresis
mobility shift assay. Anal Biochem, 212: 221-228.
Sternlieb I (1980) Copper and the liver. Gastroenterology, 78:
1615-1628.
Sternlieb I (1990) Perspectives on Wilson's disease. Hepatology,
12: 1234.
Sternlieb I (1993) The outlook for the diagnosis of Wilson's
disease. J Hepatol, 17: 263.
Stevens MD, DiSilvestro RA, & Harris ED (1984) Specific receptor
for ceruloplasmin in membrane fragments from aortic and heart
tissues. Biochemistry, 23: 261-266.
Stevenson FJ (1986) Cycles of soil: Carbon, nitrogen, phosphorus,
sulfur, micronutrients. New York, John Wiley & Sons Ltd.
Stewart C, Norton DA, & Fergusson JE (1991) Historical monitoring
of heavy metals in kahikatea ring wood in Christchurch, New
Zealand. Sci Total Environ, 105: 171-190.
Stiff MJ (1971) The chemical states of copper in polluted fresh
water and a scheme of analysis to differential them. Water Res, 5:
585-599.
Stoner GD, Shimkin MB, Troxell MC, Thompson TL, Terry LS (1976)
Test for carcinogenicity of metallic compounds by the pulmonary
tumour response in strain A mice. Cancer Res, 36: 1744-1747.
Stouthart XJHX, Haans JLM, Lock RAC, & Wendelaar Bonga SE (1996)
Effects of water pH on copper toxicity to early life stages of the
common carp (Cyprinus carpio). Environ Toxicol Chem, 15(3):
376-383.
Strain WH, Hershey CO, McInnes S, Breslau D, Hershey LA, McKinney
BM, Varnes AW, & Khourey CJ (1984) Hazards to groundwater from acid
rain. Trace Subst Environ Health, 18: 178-184.
Streit B (1984) Effects of high copper concentrations on soil
invertebrates (earthworms and oribatid mites): experimental results
and a model. Oecologia, 64: 381-388.
Stromgren T & Nielsen MV (1991) Spawning frequency, growth and
mortality of Mytilus edulis larvae, exposed to copper and diesel
oil. Aquat Toxicol, 21: 171-180.
Sturgeon P & Brubaker C (1956) Copper deficiency in infants. Am J
Dis Child, 92: 254-265.
Suciu I, Prodan L, Lazar V, Ilea E, Cocîrla A, Olinici L, Paduraru
A, Zagreanu O, Lengyel P, Gyrffi L, & Andru D (1981) Research on
copper poisoning. Med Lav, 3: 190-197.
Sunda WG & Guillard RRL (1976) Relationship between cupric ion
activity and toxicity of copper to phytoplankton. J Mar Res, 34:
511-529.
Suttle NF & Mills CF (1966) Studies of the toxicity of copper to
pigs. I. Effects of oral supplements of zinc and iron salts on the
development of copper toxicosis. Br J Nutr, 20: 135-149.
Sutton AM, Harvie A, Cockburn A, Farquharson J, & Logan RW (1985)
Copper deficiency in the preterm infant of very low birth weight:
four cases and a reference range for plasma copper. Arch Dis Child,
60(7): 644-651.
Suzuki N, Iwata Y, & Imura H (1987) Determination of several trace
metals in seaweed by neutron activation analysis after
diethydithiocarbamate extraction and polystyrene-foam collection.
Int J Environ Anal Chem, 30: 289-297.
Sweet CW, Vermette SJ, & Landsberger S (1993) Sources of toxic
trace elements in urban air in Illinois. Environ Sci Technol, 27:
2502-2510.
Symeonidis L, McNeilly T, & Bradshaw AD (1985) Differential
tolerance of three cultivars of Agrostis capillaris L. to cadmium,
copper, lead, nickel and zinc. New Phytol, 101: 309-315.
Tachibana K (1952) Pathological transition and functional
vicissitude of liver during formation of cirrhosis by copper.
Nagoya J Med Sci, 15: 108-114.
Taggart DPP, Shenkin A, & Fell GS (1986) Observations on serum
iron, zinc, copper, and magnesium in intravenously fed patients
with chronic sepsis. Clin Nutr, 5: 139-144.
Tan WT, Tan GS, & Khan ISAN (1988) Solubilities of trace copper and
lead species and the complexing capacity of river water in the
Linggi River Basin. Environ Pollut, 52: 221-235.
Tanaka Y, Hatano S, Nishi Y, & Usui T (1980) Nutritional copper
deficiency in a Japanese infant on formula. J Pediatr, 96: 255-257.
Tanner MS, Postmann B, Mowat AP, Williams B, Pandit A, Mills C, &
Bremner I (1979) Increased hepatic copper concentration in Indian
Childhood cirrhosis. Lancet, 1: 1203-1205.
Tanner MS, Kantarjian AH, Bhave SA, & Pandit AN (1983) Early
introduction of copper-contaminated animal milk feeds as a possible
cause of Indian childhood cirrhosis. Lancet, 2: 992-995.
Tanner MS, Bhave SA, Pradhan AM, & Pandit AN (1987) Clinical trials
of penicillamine in Indian childhood liver cirrhosis. Arch Dis
Childh, 62: 118-124.
Tanzi RE, Petrukhin K, & Cherov I (1993) The Wilson gene is a
copper transporting ATPase with homology to the Menkes disease
gene. Nat Genet, 5: 344.
Tavassoli M, Kishimoto T, & Kataoka M (1986) Liver endothelium
mediates the hepatocyte's uptake of ceruloplasmin. J Cell Biol,
102: 1298-1303.
Taylor GJ & Crowder AA (1984) Copper and nickel tolerance in
Typha latifolia clones from contaminated and uncontaminated
environments. Can J Bot, 62: 1304-1308.
Taylor GJ & Foy CD (1985) Differential uptake and toxicity of ionic
and chelated copper in Triticum aestivum. Can J Bot, 63:
1271-1275.
Taylor D, Maddock BG, & Mance G (1985) The acute toxicity of nine
'grey list' metals (arsenic, boron, chromium, copper, lead, nickel,
tin, vanadium and zinc) to two marine fish species: dab
(Limanda limanda) and grey mullet (Chelon labrosus). Aquat
Toxicol, 7: 135-144.
Taylor EJ, Maund SJ, & Pascoe D (1991) Toxicity of four common
pollutants to the freshwater macroinvertebrates Chironomus
riparius Meigen (Insecta: Diptera) and Gammarus pulex (L.)
(Crustacea: Amphipoda). Arch Environ Contam Toxicol, 21: 371-376.
Thiel H & Finck A (1973) [Determination of limiting values of
optimum copper supply of oat and barley plants.] Z Pflanz Bodenk,
134: 107-125 (in German).
Thomas GR, Forbes JR, Roberts EA, Walshe JM, & Cox DW (1995) The
Wilson disease gene -- spectrum of mutations and their
consequences. Nat Genet, 9: 210-217.
Thompson JJ & Houk RS (1986) Inductively coupled plasma mass
spectrometric detection for multielement flow injection analysis
and elemental speciation by reversed-phase liquid chromatography.
Anal Chem, 58: 2541-2548.
Thorn JM, Aggett PJ, Delves HT, & Clayton BE (1978) Mineral and
trace metal supplement for use with synthetic diets based on
comminuted chicken. Arch Dis Child, 53(12): 931-938.
Thornalley PJ & Vasak M (1985) Possible role for metallothionein in
protection against radiation-induced oxidative stress. Kinetics and
mechanism of its reaction with superoxide and hydroxyl radicals.
Biochim Biophys Acta, 827(1): 36-44.
Tijero J, Guardiola E, Mirada F, & Cortijo M (1991) Effect of
Cu2+, Ni2+ and Zn2+ on an anaerobic digestion system. J Environ
Sci Health, 26: 799-811.
Timmermans KR & Walker PA (1989) The fate of trace metals during
the metamorphosis of chironomids (Diptera, Chironomidae). Environ
Pollut, 62: 73-85.
Tinker D, Romero-Chapman N, Reiser K, Hyde D, & Rucker C (1990)
Elastin metabolism during recovery from impaired cross-linking
formation. Arch Biochem Biophys, 278: 326-332.
Tinwell H & Ashby J (1990) Inactivity of copper sulphate in a mouse
bone-marrow micronucleus assay. Mutat Res, 245: 223-226.
Tomlin C ed. (1994) A world compendium -- The pesticide manual,
incorporating the agrochemicals handbook. London, Crop Protection
Publications.
Town RM & Powell HKJ (1993) Ion-selective electrode potentiometric
studies on the complexation of copper(II) by soil-derived humic
acid and fulvic acid. Anal Chim Acta, 279: 221-233.
Tubbing DMJ, Admiraal W, & Katako A (1995) Successive changes in
bacterioplankton communities in the River Rhine after copper
additions. Environ Toxicol Chem, 14(9): 1507-1512.
Tuddenham WM & Dougall PA (1978) Copper. In: Kirk-Othmer
encyclopedia of chemical technology, 3rd ed. New York, John Wiley
& Sons Ltd, pp 819-869.
Turnlund JR, Swanson CA, & King JC (1983) Copper absorption and
retention in pregnant women fed diets based on animal and plant
proteins. J Nutr, 113: 2346-2352.
Turnlund JR, King JC, Keyes WR, Gong B, & Michel MC (1984) A stable
isotope study of zinc absorption in young men: effects of phytate
and alpha-cellulose. Am J Clin Nutr, 40: 1071-1077
Turnlund JR, Keyes WR, Anderson HL, & Acord LL (1989) Copper
absorption and retention in young men at three levels of dietary
copper by use of the stable isotope 65Cu. Am J Clin Nutr, 49:
870-878.
Turnlund JR, Keens CL, & Smith RG (1990) Copper status and urinary
and salivary copper in young men at three levels of dietary copper.
Am J Clin Nutr, 51: 658-664.
Turnlund JR, Keyes WR, Hudson CA, Betschart AA, Kretsch MJ, &
Sauberlich HE (1991) A stable-isotope study of zinc, copper, and
iron absorption and retention by young women fed vitamin
B-6-deficient diets. Am J Clin Nutr, 54: 1059-1064.
Tyler LD & McBride MB (1982) Mobility and extractability of
cadmium, copper, nickel, and zinc in organic and mineral soil
columns. Soil Sci, 134: 198-205.
Tyrala EE (1986) Zinc and copper balances in preterm infants.
Pediatrics, 77: 513-517.
Uauy R, Castillo-Duran C, Fisberg M, Fernandez N, & Valenzuela A
(1985) Red cell superoxide dismutase activity as an index of human
copper nutrition. J Nutr, 115: 1650-1655.
Underwood EJ (1977) Trace elements in human and animal nutrition,
4th ed. New York, London, Academic Press, 545 pp.
Ünlü E & Gümgüm B (1993) Concentrations of copper and zinc in fish
and sediments from the Tigris River in Turkey. Chemosphere, 26(11):
2055-2061.
US EPA (1984) Ambient water quality criteria for copper.
Washington, DC, US Environmental Protection Agency, 84 pp (EPA
440/5-84-031).
US EPA (1986) Test methods for evaluating solid waste, 3rd ed.
Washington, DC, US Environmental Protection Agency, Office of Solid
Waste (Report SW-846).
US EPA (1991) Maximum contaminant levels, goals and national
primary drinking-water regulations for lead and copper, final rule.
Fed Reg, 56: 110.
US EPA (1992) Interim guidance on interpretation and implementation
of aquatic life criteria for metals. Washington, DC, US
Environmental Protection Agency.
US EPA (1995) Sampling ambient water for trace metals at EPA water
quality criteria levels: Method 1669. Washington, DC, US
Environmental Protection Agency.
V-Balogh K (1988) Heavy metal pollution from a point source
demonstrated by mussel (Unio pictorum L.) at Lake Balaton,
Hungary. Bull Environ Contam Toxicol, 41: 910-914.
Van Campen DR & Mitchell EA (1965) Absorption of Cu64, Zn65, Mo99,
and Fe59 from ligated segments of the rat gastrointestinal tract.
J Nutr, 86: 120-124.
Van den Berg CMG (1984) Organic and inorganic speciation of copper
in the Irish Sea. Mar Chem, 14: 201-212.
Van den Berg GJ & Beynen AC (1992) Influence of ascorbic acid
supplementation on copper metabolism in rats. Br J Nutr, 68:
701-715.
Van den Berg CMG, Nimmo M, Daly P, & Turner DR (1990) Effects of
the detection window on the determination of organic copper
speciation in estuarine waters. Anal Chim Acta, 232: 149-159.
Van den Berg GJ, Yu S, Lemmens AG, & Beynen AC (1994) Ascorbic acid
feeding of rats reduces copper absorption, causing impaired copper
status and depressed biliary copper excretion. Biol Trace Elem Res,
41: 47-58.
Van Gestel CAM, Van Dis WA, Van Breemen EM, & Sparenburg PM (1989)
Development of a standardized reproduction toxicity test with the
earthworm species Eisenia fetida Andrei using copper,
pentachlorophenol, and 2,4-dichloroaniline. Ecotoxicol Environ Saf,
18: 305-312.
Van Gestel CAM, Van Dis WA, Dirven-van Breemen EM, Sparenburg PM,
& Baerselman R (1991) Influence of cadmium, copper, and
pentachlorophenol on growth and sexual development of Eisenia
Andrei (Oligochaeta; Annelida). Biol Fertil Soils, 12: 117-121.
van Leeuwen CJ, Büchner JL, & van Dijk H (1988) Intermittent flow
system for population toxicity studies demonstrated with Daphnia
and copper. Bull Environ Contam Toxicol, 40: 496-502.
van Tilborg WJM (1996) 'A further look at zinc' refuted. The
Netherlands, VTBC, 107 pp (Report No. 9601).
Vardia HK, Rao PS, & Durve VS (1988) Effect of copper, cadmium and
zinc on fish-food organisms, Daphnia lumholtzi and
Cypris subglobosa. Proc Indian Acad Sci (Anim Sci), 97(2):
175-180.
Venugopal B & Luckey TD (1978) Metal toxicity in mammals -- 2. New
York, Plenum Press.
Vermeiren K, Vandecasteele C, & Dams R (1990) Determination of
trace amounts of cadmium, lead, copper and zinc in natural waters
by inductively coupled plasma atomic emission spectrometry with
thermospray nebulisation, after enrichment on Chelex-100. Analyst,
115: 17-22.
Verriopoulos G & Dimas S (1988) Combined toxicity of copper,
cadmium, zinc, lead, nickel, and chrome to the copepod Tisbe
holothuriae. Bull Environ Contam Toxicol, 41: 378-384.
Verweij W, Glazewski R, & DeHaan H (1992) Speciation of copper in
relation to its bioavailability. Chem Speciation Bioavailab, 4:
43-52
Viarengo A, Canesi L, Pertica M, Poli G, Moore MN, & Orunesu M
(1990) Heavy metal effects on lipid peroxidation in the tissues of
Mytilus galloprovincialis Lam. Comp Biochem Physiol, 97C(1):
37-42.
Viksna A, Mwiruki G, Jagner D, & Selin E (1995) Intercomparison
between energy-dispersive X-ray fluorescence and stripping
potentiometry for the determination of copper levels in human
serum. X-Ray Spectrom, 24: 76-80.
Viren JR & Silvers A (1994) Unit risk estimates for airborne
arsenic exposure: an updated view based on recent data from two
copper smelter cohorts. Regul Toxicol Pharmacol, 20: 125-138.
Visviki I & Rachlin JW (1991) The toxic action and interactions of
copper and cadmium to the marine alga Dunaliella minuta, in both
acute and chronic exposure. Arch Environ Contam Toxicol, 20:
271-275.
Visviki I & Rachlin JW (1994a) Acute and chronic exposure of
Dunaliella salina and Chlamydomonas bullosa to copper and
cadmium: Effects on growth. Arch Environ Contam Toxicol, 26:
149-153.
Visviki I & Rachlin JW (1994b) Acute and chronic exposure of
Dunaliella salina and Chlamydomonas bullosa to copper and
cadmium: Effects on ultrastructure. Arch Environ Contam Toxicol,
26: 154-162.
Vogt G & Quinitio ET (1994) Accumulation and excretion of metal
granules in the prawn, Penaeus monodon, exposed to water-borne
copper, lead, iron and calcium. Aquat Toxicol, 28: 223-241.
Vohra P, Gray GA, & Kratzer FH (1965) Phytic acid-metal complexes.
Proc Soc Exp Biol Med, 120: 447-449.
Vollkopf U & Barnes K (1995) Rapid multielement analysis of urine.
At Spectrosc, 1995: 19-21.
Vranken G, Tiré C, & Heip C (1988) The toxicity of paired metal
mixtures to the nematode Monhystera disjuncta (Bastian, 1865).
Mar Environ Res, 26: 161-179.
Vulpe C, Levinson B, Whitney S, Packman S, & Gitschier J (1993)
Isolation of a candidate gene for Menkes disease and evidence that
it encodes a copper-transporting ATPase. Nat Genet, 3(1): 7-13
(erratum in Nat Genet, 3(3):273).
Wainwright SJ & Woolhouse HW (1977) Some physiological aspects of
copper and zinc tolerance in Agrostis tenuis Sibth.: Cell
elongation and membrane damage. J Exp Bot, 28: 1029-1036.
Waldrop GL & Ettinger MJ (1990) The relationship of excess copper
accumulation by fibroblasts from the brindled mouse model of Menkes
disease to the primary defect. Biochem J, 267: 417-422.
Walker-Smith J & Blomfield J (1973) Wilson's disease or chronic
copper poisoning? Arch Dis Child, 48: 476-479.
Walsh LH, Erhardt WH, & Seibel HD (1972) Copper toxicity in
snapbeans (Phaseolus vulgaris L.). J Environ Qual, 1: 197-200.
Walsh FM, Crosson FJ, Bayley M, McReynolds J, & Pearson BJ (1977)
Acute copper intoxication: Pathophysiology and therapy with a case
report. Am J Dis Child, 131: 149-151.
Walshe JM (1995) Copper: Not too little, not too much, but just
right. J R Coll Phys (Lond), 29: 280-287
Wapnir RA & Balkman C (1992) Intestinal absorption of copper:
influence of carbohydrates. Biochem Med Metab Biol, 47: 47-53.
Wapnir RA & Lee SY (1993) Dietary regulation of copper absorption
and storage in rats: Effects of sodium, zinc and histidine-zinc. J
Am Coll Nutr, 12: 714-719.
Ward GM & Nagy JG (1976) Molybdenum and copper in Colorado forages,
molybdenum toxicity in deer, and copper supplementation in cattle.
In: Chappel WR & Petersen KK ed. Molybdenum in the environment:
Volume 1. The biology of molybdenum. New York, Marcel Dekker, Inc.,
pp 97-113.
Watton AJ & Hawkes HA (1984) The acute toxicity of ammonia and
copper to the gastropod Potamopyrgus jenkinsi (Smith). Environ
Pollut, A36: 7-29.
Weant GE (1985) Sources of copper air emissions. Research Triangle
Park, North Carolina, US Environmental Protection Agency, Air and
Energy Engineering Research Laboratory (EPA 600/2-85-046).
Weeks JM (1992a) The Talitrid amphipod (Crustacea)
Platorchestia platensis as a biomonitor of trace metals (Cu and
Zn) in Danish waters. In: Bjornestad E, Hagerman L, & Jensen K ed.
Proceedings of the 12th Baltic Marine Biologists Symposium,
Helsingor, Denmark, 25-30 August 1991. Fredensborg, Olsen & Olsen,
pp 173-178.
Weeks JM (1992b) Copper-rich granules in the ventral caeca of
Talitrid amphipods (Crustacea; Amphipoda: Talitridae). Ophelia, 36:
119-133.
Weeks JM (1993) Effects of dietary copper and zinc concentrations
on feeding rates of two species of Talitrid amphipods (Crustacea).
Bull Environ Contam Toxicol, 50: 883-890.
Weeks JM & Rainbow PS (1991) The uptake and accumulation of zinc
and copper from solution by two species of Talitrid amphipods
(Crustacea). J Mar Biol Assoc (UK), 71: 811-826.
Weeks JM & Rainbow PS (1993) The relative importance of food and
seawater as sources of copper and zinc to Talitrid amphipods
(crustacea; Amphipoda; Talitridae. J Appl Ecol, 30: 722-735.
Weeks JM, Rainbow PS, & Moore PG (1992) The loss, uptake and tissue
distribution of copper and zinc during the moult cycle in an
ecological series of Talitrid amphipods (Crustacea: Amphipoda).
Hydrobiologia, 245: 15-25.
Weeks JM, Jensen FB, & Depledge MH (1993) Acid-base status,
haemolymph composition and tissue copper accumulation in the shore
crab Carcinus maenas exposed to combined copper and salinity
stress. Mar Ecol Prog Ser, 97: 91-98.
Weiss M, Müller-Höcker J, Wiebecke B, & Belohradsky BH (1989) First
description of Indian childhood cirrhosis in a non-Indian infant in
Europe. Acta Paediatr Scand, 79: 152-156.
Welsh PG, Skidmore JF, Spry DJ, Dixon DG, Hutchinson NJ, & Hickie
BE (1993) Effect of pH and dissolved organic carbon on the toxicity
of copper to larval fathead minnow (Pimephales promelas) in
natural lake waters of law alkalinity. Can J Fish Aquat Sci, 50:
1356-1362.
Wharton DC & Rader M (1970) Rapid spectrophotometric method for
determination of micro amounts of copper in proteins. Anal Biochem,
33(2): 226-229.
White SL & Rainbow PS (1985) On the metabolic requirements for
copper and zinc in molluscs and crustaceans. Mar Environ Res, 16:
215-229.
WHO (1982) Evaluation of certain food additives and contaminants.
Twenty-sixth report of the Joint FAO/WHO Expert Committee on Food
Additives. Geneva, World Health Organization, pp 31-32 (WHO
Technical Report Series, No. 683).
WHO (1990) In: Akre J ed. Infant feeding -- the physiological
basis. Supplement to Volume 67 of WHO Bulletin, 1989. Geneva, World
Health Organization, pp 68-84.
WHO (1993) Guidelines for drinking-water quality, 2nd ed. Volume 1:
Recommendations. Geneva, World Health Organization, p 46.
WHO (1996) Copper. In: Trace elements in human nutrition and
health. Geneva, World Health Organization, chapter 7, pp 123-143.
Widdowson EM & Dickerson JWT (1964) Chemical composition of the
body. In: Comar CL & Bronner F ed. Mineral metabolism. New York,
Academic Press, vol 2, chapter 17, p 1247.
Widdowson EM, Dauncey J, & Shaw JCL (1974) Trace elements in fetal
and early postnatal development. Proc Nutr Soc, 33: 275-284.
Wieser W, Busch G, & Büchel L (1976) Isopods as indicators of the
copper content of soil and litter. Oecologia, 23: 107-114.
Williams DM (1982) Clinical significance of copper deficiency and
toxicity in the world population. In: Prasad AS ed. A clinical,
biochemical and nutritional aspects of trace elements. New York,
Alan R. Lyss, pp 277-299.
Williams DM (1983) Copper deficiency in humans. Semin Hematol,
20: 118-128.
Wilson SAK (1912) Progressive lenticular degeneration: A familial
nervous disease associated with cirrhosis of the liver. Brain,
34: 295-509.
Wilson P, Cooke M, Cawley J, Giles L, & West M (1995) Comparison of
the determination of copper, nickel and zinc in contaminated soils
by X-ray fluorescence spectrometry and inductively coupled plasma
spectrometry. X-Ray Spectrom, 24: 103-108.
Windom HL, Byrd JT, Smith RG Jr, & Huan F (1991) Inadequacy of
NASQAN data for assessing metal trends in the nation's river.
Environ Sci Technol, 25(6): 1137-1142.
Winge DR & Mehra RK (1990) Host defenses against copper toxicity.
Int Rev Exp Pathol, 31: 47-83.
Winner RA (1984) The toxicity and bioaccumulation of cadmium and
copper as affected by humic acid. Aquat Toxicol, 5: 267-274.
Winner RW (1985) Bioaccumulation and toxicity of copper as affected
by interactions between humic acid and water hardness. Water Res,
19(4): 449-455.
Winner RW & Farrell MP (1976) Acute and chronic toxicity of copper
to four species of Daphnia. J Fish Res Board Can, 33: 1685-1691.
Winner RW & Owen HA (1991a) Seasonal variability in the sensitivity
of freshwater phytoplankton communities to a chronic copper stress.
Aquat Toxicol, 19: 73-88.
Winner RW & Owen HA (1991b) Toxicity of copper to
Chlamydomonas reinhardtii (Chlorophyceae) and
Ceriodaphnia dubia (Crustacea) in relation to changes in water
chemistry of a freshwater pond. Aquat Toxicol, 21: 157-170.
Winner RW, Owen HA, & Moore MV (1990) Seasonal variability in the
sensitivity of freshwater lentic communities to a chronic copper
stress. Aquat Toxicol, 17: 75-92.
Wirth PL & Linder MC (1985) Distribution of copper among multiple
components of human serum. J Natl Cancer Inst, 75: 277-284.
Wong PK (1988) Mutagenicity of heavy metals. Bull Environ Contam
Toxicol, 40: 597-603.
Wong CK (1992) Effects of chromium, copper, nickel, and zinc on
survival and feeding of the cladoceran Moina macrocopa. Bull
Environ Contam Toxicol, 49: 593-599.
Wong MH & Bradshaw AD (1982) A comparison of the toxicity of heavy
metals, using root elongation of rye grass, Lolium perenne. New
Phytol, 91: 255-261.
Wong PK & Chang L (1991) Effects of copper, chromium and nickel on
growth, photosynthesis and chlorophyll a synthesis of
Chlorella pyrenoidosa 251. Environ Pollut, 72: 127-139.
Wong PK, Lam KC, & So CM (1993a) Removal and recovery of Cu(II)
from industrial effluent by immobilized cells of Pseudomonas putida
II-11. Appl Microbiol Biotechnol, 39: 127-131.
Wong CK, Chu KH, Tang KW, Tan TW, & Wong LJ (1993b) Effects of
chromium, copper and nickel on survival and feeding behaviour of
Metapenaeus ensis larvae and postlarvae (Decapoda: Penaeidae).
Mar Environ Res, 36: 63-78.
Wong YS, Lam EKH, & Tam NFY (1994) Physiological effects of copper
treatment and its uptake pattern in Festuca rubra cv. Merlin.
Resour Conserv Recycl, 11(1-4): 311-319
Wood AM (1983) Available copper ligands and the apparent
bioavailability of copper to natural phytoplankton assemblages. Sci
Total Environ, 28: 51-64.
Wood CM (1992) Flux measurements as indices of H+ and metal
effects on freshwater fish. Aquat Toxicol, 22: 239-264
Woolhouse HW (1983) Toxicity and tolerance in the responses of
plants to metals Chapter 7. In: Lange OC, Nobel PS, Osmond CB, &
Ziegler H ed. Encyclopedia of plant physiology. New York, Basel,
Springer-Verlag, chapter 7, pp 245-300.
Wu L & Bradshaw AD (1972) Aerial pollution and the rapid evolution
of copper tolerance. Nature (Lond), 238: 167-169.
Wu L & Kruckeberg AL (1985) Copper tolerance in two legume species
from a copper mine habitat. New Phytol, 99: 565-570.
Wu L & Lin S-L (1990) Copper tolerance and copper uptake of Lotus
purshianus (Benth.) Clem. & Clem. and its symbiotic Rhizobium loti
derived from a copper mine waste population. New Phytol, 116:
531-539.
Wu ZY, Han M, Lin ZC, & Ondov JM (1994) Chesapeake Bay atmospheric
deposition study, year 1: sources and dry deposition of selected
elements in aerosol particles. Atmos Environ, 28(8): 1471-1486.
Wurtsbaugh WA & Horne AJ (1982) Effects of copper on nitrogen
fixation and growth of blue-green algae in natural plankton
associations. Can J Fish Aquat Sci, 39: 1636-1641.
Wyllie J (1957) Copper poisoning at a cocktail party. Am J Public
Health, 47: 617.
Yang FM, Friedrichs WE, Cupples RL, Bonifacio MJ, Sanford JA,
Horton WA, & Bowman BH (1990) Human ceruloplasmin. Tissue-specific
expression of transcripts produced by alternative splicing. J Biol
Chem, 265: 10780-10785.
Yeowell HN, Marshall MK, Walker LC, Ha V, & Pinnell SR (1994)
Regulation of lysyl oxidase mRNA in dermal fibroblasts from normal
donors and patients with inherited connective tissue disorders.
Arch Biochem Biophys, 308: 299-305.
Yip R, Reeves JD, Lönnerdal B, Keen CL, & Dallman PR (1985) Does
iron supplementation compromise zinc nutrition in healthy infants?
Am J Clin Nutr, 42: 683-687.
Zabowski D & Zasoski RJ (1987) Cadmium, copper, and zinc adsorption
by a forest soil in the presence of sludge leachate. Water Air Soil
Pollut, 36: 103-113.
Zak B (1958) Simple procedure for the single sample determination
of serum copper and iron. Clin Chim Acta, 3: 328-334.
Zhang M & Florence TM (1987) A novel adsorbent for the
determination of the toxic fraction of copper in natural waters.
Anal Chim Acta, 197: 137-148.
Zhou P & Theil DJ (1991) Isolation of a metal-activated
transcription factor gene from Candida glabrata by complementation
in Saccharomyces cervisiae. Proc Natl Acad Sci (USA), 88:
6112-6116.
Zia S & Alikhan MA (1989) Copper uptake and regulation in a
copper-tolerant decapod Cambarus bartoni (Fabricius) (Decapoda,
Crustacea). Bull Environ Contam Toxicol, 42: 103-110.
Zidar BL, Shadduck RK, Zeigler Z, & Winkelstein A (1977)
Observation of the anemia and neutropenia of human copper
deficiency. Am J Hematol, 3: 177-185.
Zitko V & Carson WG (1976) A mechanism of the effects of water
hardness on the lethality of heavy metals to fish. Chemosphere, 5:
299-303.
Zoller WH, Gladney ES, & Duce RA (1974) Atmospheric concentrations
and sources of trace metals at the South Pole. Science, 183:
198-200.
Zou E & Bu S (1994) Acute toxicity of copper, cadmium, and zinc to
the water flea, Moina irrasa (Cladocera). Bull Environ Contam
Toxicol, 52: 742-748.
Zucker SD & Gollan JL (1996) Wilson's disease and hepatic copper
toxicosis. In: Zakin D & Boyer T ed. Hepatology: A textbook of
liver disease. Philadelphia, Pennsylvania, Saunders.
Zwozdziak J, Zwozdziak A, Matyniak Z, & Lisowski A (1985)
Atmospheric sulphate formation in the vicinity of a copper smelter.
Sci Total Environ, 46: 95-106.
RÉSUMÉ ET CONCLUSIONS
1. Résumé
1.1 Identité, propriétés physiques et chimiques
Le cuivre est un métal ductile et malléable, de couleur brun
rougeâtre. Il appartient au groupe IB de la Classification
périodique. Il est généralement présent dans l'environnement au
degré d'oxydation +2 mais peut également exister au degré 0,
c'est-à-dire à l'état métallique, ainsi qu'aux degrés +1 et +3.A
l'état naturel, il se présente sous la forme de sels minéraux et de
composés organiques très divers ou encore sous forme métallique. Le
métal est à peine soluble dans l'eau et les solutions salines ou
légèrement acides mais il est dissous par l'acide nitrique et
l'acide sulfurique ainsi que par les solutions basiques d'hydroxyde
ou de carbonate d'ammonium.
Le cuivre présente une forte conductivité électrique et
thermique et il est résistant à la corrosion.
1.2 Méthodes d'analyse
La grande diversité des dérivés du cuivre, qu'ils soient
minéraux ou organiques, a conduit à la mise au point de tout un
arsenal de techniques d'échantillonnage, de préparation et
d'analyse en vue du dosage de cet élément dans les échantillons
biologiques ou ceux qui proviennent de l'environnement. Il est
essentiel de mettre en oeuvre des techniques "propres" car la
contamination des échantillons par du cuivre provenant de l'air, de
la poussière, des récipients ou des réactifs est une source
importante d'erreurs d'analyse.
Le dosage colorimétrique ou gravimétrique du cuivre est bon
marché et d'exécution simple. Son intérêt se limite cependant aux
cas où il n'est pas essentiel d'avoir une sensibilité extrêmement
élevée. Pour doser de faibles concentrations de cuivre dans des
matrices diverses, on fait le plus souvent appel à la
spectrophotométrie d'absorption atomique. En opérant par la même
méthode mais avec un four à électrodes de graphite, le gain de
sensibilité est considérable par rapport à la spectrophotométrie de
flamme. En fonction du traitement préalable subi par l'échantillon
ainsi que des techniques de séparation et de concentration
utilisées, la limite de détection dans l'eau atteint environ 1
µg/litre par absorption atomique avec électrodes de graphite
(GF-AAS) et 20 µg/litre par absorption atomique classique; on a pu
aller jusqu'à 0,05-0,2 µg/g de tissu biologique par GF-AAS. On peut
parvenir à une sensibilité encore meilleure en ayant recours à des
techniques d'émission comme par exemple le plasma d'argon à
couplage inductif associé à la spectroscopie d'émission atomique ou
à la spectrométrie de masse. Il existe encore d'autres méthodes
comme la fluorescence X, l'utilisation d'électrodes à membrane
sélective ou la voltampérométrie avec redissolution anodique ou
cathodique.
1.3 Sources d'exposition humaine et environnementale
Parmi les sources d'exposition au cuivre on peut citer la
poussière soulevée par le vent, les volcans, les végétaux en
décomposition, les feux de forêt et les embruns marins. Parmi les
sources d'émission anthropogéniques, on compte les fours de fusion,
les fonderies de fonte, les centrales thermiques ainsi que les
sources de combustion telles que les installations municipales
d'incinération. Les rejets de cuivre dans le sol proviennent
essentiellement des résidus et terres de recouvrement des
exploitations minières et des boues d'égouts. Les produits
agricoles à base de cuivre représentent 2% des rejets de cuivre
dans le sol.
L'extraction, la fusion et le raffinage des minerais de cuivre
débouchent sur la fabrication d'un grand nombre de produits
industriels et commerciaux. Le cuivre est très utilisé pour la
fabrication d'ustensiles de cuisine, dans les réseaux de
distribution d'eau, ainsi que sous la forme d'engrais, de
bactéricides, d'algicides et de peintures antisalissures. Il sert
également à la préparation d'additifs pour l'alimentation des
bestiaux et de produits favorisant la croissance, et il entre dans
la composition de substances permettant de lutter contre les
maladies du bétail et de la volaille. Dans l'industrie, on
l'utilise comme activateur pour la flottation des minerais
sulfurés, pour la production d'agents de protection du bois, en
galvanoplastie, dans la fabrication des colorants azoïques, comme
mordant pour les colorants des tissus, dans le raffinage du pétrole
et enfin pour la préparation de composés divers.
1.4 Transport, distribution et transformation dans l'environnement
Le cuivre est libéré dans l'atmosphère en association avec des
particules de matière. Il s'élimine par gravité, dépôt à sec,
lessivage et entraînement par les précipitations. La vitesse
d'élimination et la distance parcourue depuis la source dépendent
des caractéristiques de cette dernière, de la granulométrie des
particules et de la vitesse du vent.
Le lessivage naturel du sol par les intempéries et les
décharges provenant de l'industrie et des stations d'épuration sont
à l'origine du cuivre présent dans l'eau. Il est également possible
que des composés cupriques soient volontairement introduits dans
l'eau pour détruire les algues. Le devenir du cuivre dans le milieu
aquatique est tributaire d'un certain nombre de processus. Il
s'agit notamment de la formation de complexes, de la sorption par
des oxydes métalliques hydratés, des argiles et des substances
organiques ou encore de la bioaccumulation. La connaissance de la
forme physicochimique sous laquelle se trouve le cuivre (l'espèce
chimique en cause) apporte plus de renseignements que la
concentration totale de l'élément. Une grande partie du cuivre
rejeté dans l'eau se trouve sous forme particulaire et il a
tendance à se déposer, à précipiter ou à s'adsorber à des matières
organiques, à des oxydes de fer et de manganèse hydratés ou aux
argiles présents dans les sédiments ou dans la couche aqueuse.
Dans l'environnement aquatique, la concentration du cuivre dépend
de facteurs tels que la dureté et l'alcalinité de l'eau, sa force
ionique, son pH et son potentiel redox, la présence de substances
complexantes, de matières en suspension et de carbone et enfin, des
interactions entre l'eau et les sédiments.
C'est dans le sol que le cuivre est rejeté en majeure partie;
les sources principales en sont les exploitations minières,
l'agriculture et les déchets solides ou les boues provenant des
stations d'épuration. La plus grande partie du cuivre déposé dans
le sol est fortement adsorbée et demeure dans les premiers
centimètres de la couche supérieure. Le cuivre s'adsorbe aux
matières organiques, aux carbonates, aux argiles ainsi qu'aux
oxydes hydratés de fer et de manganèse. C'est dans les sols sableux
acides que le lessivage est le plus important. Dans l'environnement
terrestre, un certain nombre de facteurs importants conditionnent
le devenir du cuivre. Il s'agit notamment de la nature du sol
lui-même, de la présence d'oxydes, du potentiel redox, des surfaces
porteuses de charges électriques, des matières organiques et des
échanges de cations.
Il peut y avoir bioaccumulation du cuivre présent dans
l'environnement s'il est biologiquement disponible. La valeur du
facteur de bioaccumulation varie beaucoup d'un organisme à l'autre,
mais il a tendance à être plus élevé en cas d'exposition à de
faibles concentrations. Par accumulation, il peut arriver que
certains animaux (par exemple, les bivalves) ou certaines plantes
terrestres (comme celles qui poussent sur des sols contaminés) se
chargent d'une quantité exceptionnellement élevée de cuivre.
Néanmoins, de nombreux organismes sont capables de réguler leur
concentration totale de cuivre.
1.5 Concentrations dans l'environnement et exposition humaine
La concentration du cuivre dans l'air d'un site est liée à la
proximité de sources polluantes importantes comme les fours, les
centrales électriques et les installations d'incinération. Le
cuivre étant un élément naturel, il est largement disséminé dans
l'eau. Il faut cependant être prudent lorsqu'on cherche à
interpréter la teneur en cuivre d'un environnement aquatique donné.
En effet, dans un système aquatique, la quantité de cuivre qui est
mesurée correspond généralement soit au cuivre total, soit au
cuivre dissous, ce dernier étant plus représentatif de la
biodisponibilité du métal.
En milieu rural, la concentration moyenne de fond dans l'air
va de 5 à 50 ng/m3. Dans les zones non contaminées, la
concentration est de 0,15 µg/litre dans l'eau de mer et de 1 à 20
µg/litre dans l'eau douce. Les sédiments constituent un important
réservoir et milieu récepteur pour le cuivre. La concentration de
fond dans les sédiments naturels en eau douce va de 16 à 5000 mg/kg
de poids sec. Dans les sédiments marins, la teneur en cuivre va de
2 à 740 mg/kg de poids sec. En milieu dépourvu d'oxygène, le cuivre
présent dans les sédiments est fortement lié sous la forme de
sulfure et il n'est donc
pas biodisponible. Dans des sols non contaminés, on a relevé une
concentration médiane en cuivre de 30 mg/kg (limites: 2-250 mg/kg).
Le cuivre s'accumule dans les végétaux, les invertébrés et les
poissons. La teneur de divers organismes en cuivre est plus élevée
dans les zones contaminées que dans celles qui ne le sont pas.
Chez les personnes en bonne santé qui ne sont pas soumis à une
exposition professionnelle, la principale voie d'exposition est la
voie buccale. L'apport journalier moyen par l'alimentation est de
0,9 à 2,2 mg pour un adulte. La plupart des études montrent que
dans la majorité des cas, cet apport est voisin de l'extrémité
inférieure de la fourchette. Les variations que l'on peut constater
traduisent la diversité des habitudes alimentaires et des pratiques
agricoles ou culinaires de par le monde. Parfois, l'eau de boisson
peut contribuer de façon substantielle à l'apport journalier total
de cuivre, en particulier dans les habitations dont la tuyauterie
est au contact d'une eau corrosive. Dans les habitations dont la
tuyauterie n'est pas en cuivre ou qui ne sont pas alimentées par
une eau corrosive, l'apport de cuivre par l'eau de boisson ne
dépasse que rarement 0,1 mg/jour, alors que si l'eau distribuée est
corrosive, cet apport peut excéder plusieurs mg par jour. En
général, l'apport journalier total par la voie buccale
(alimentation et eau de boisson) se situe entre 1 et 2 mg par jour,
avec des pointes occasionnelles à plus de 5 mg/jour. L'apport de
cuivre par les autres voies (respiratoire ou percutanée) est
négligeable par rapport à la voie buccale. L'inhalation de
poussières et de fumée ajoute quelque 0,3-2,0 mg de Cu par jour.
Les femmes qui portent des DIU en cuivre ne sont exposées de ce
fait qu'à un apport supplémentaire de 80 µg au maximum.
1.6 Cinétique et métabolisme chez les animaux de
laboratoire et l'Homme
L'homéostase du cuivre est liée à la dualité du cuivre,
élément à la fois essentiel et toxique. Son caractère essentiel
tient au fait qu'il intervient dans un grand nombre de protéines,
tant comme élément structural que comme catalyseur. Les mêmes
processus cellulaires de fixation et d'incorporation dans les
protéines ainsi que les sorties de cuivre se retrouvent chez tous
les mammifères et sont modulés par le métal lui-même.
Le cuivre est principalement absorbé dans les voies
digestives. Le taux de résorption du cuivre alimentaire est de 20
à 60%, le reste étant excrété dans les matières fécales. Après être
passé à travers la membrane basolatérale, le cuivre se fixe à
l'albumine qui le transporte jusqu'au foie. Cet organe joue un rôle
déterminant dans l'homéostase du cuivre. Le cuivre se répartit
ensuite en deux fractions, l'une qui est excrétée par la bile, et
l'autre qui est incorporée aux protéines intra- et
extracellulaires. La bile constitue la principale voie d'excrétion.
Le transport du cuivre vers les tissus périphériques est assuré par
l'albumine plasmatique, la céruléoplasmine et des complexes de
faible masse moléculaire.
Parmi les méthodes utilisées pour étudier l'homéostase du
cuivre chez les mammifères figurent les analyses de rations
alimentaires et les études de bilan. Il est essentiel de recourir
à des méthodes isotopiques et à des analyses biochimiques
standardisées pour bien établir l'existence de carences ou d'excès
de cuivre.
La toxicité biochimique du cuivre, lorsque la régulation
homéostatique devient inopérante, résulte de l'effet que cet
élément exerce sur la structure et la fonction des biomolécules
comme l'ADN, les membranes et les protéines, soit directement, soit
par l'intermédiaire de mécanismes faisant intervenir des radicaux
oxygénés.
1.7 Effets sur les animaux de laboratoire et les systèmes
d'épreuve in vitro
La toxicité d'une dose unique de cuivre varie largement selon
l'espèce en cause (DL50 comprise entre 15 et 1664 mg Cu/kg de poids
corporel). Parmi les sels de cuivre, ceux qui présentent une bonne
solubilité (sulfate de Cu(II), chlorure de Cu (II)), sont
généralement plus toxiques que par exemple l'hydroxyde de Cu(II) ou
l'oxyde de Cu (II), moins solubles. Des symptômes tels
qu'hémorragie gastrique, tachycardie, hypotension,crise
hémolytique, convulsions et paralysie précèdent l'issue fatale.
Pour la DL50 en exposition percutanée, on a fait état de valeurs
> 1124 et >2058 mg Cu/kg p.c. respectivement chez le rat et chez
le lapin. La CL50 pour une exposition par inhalation (durée non
précisée) a été trouvée > 1303 mg Cu/kg p.c. chez des lapins et on
a constaté une détérioration de la fonction respiratoire chez des
cobayes exposés à une dose de 1,3 mg Cu/m3 pendant 1 h.
Des rats qui avaient reçu quotidiennement pendant 15 jours 305
mg Cu/kg dans leur nourriture, sous la forme de sulfate de Cu (II),
on présenté des modifications de leurs paramètres biochimiques
sanguins accompagnées d'autres anomalies hématologiques (anémie en
particulier) et l'on a également observé des effets nocifs au
niveau du foie, des reins et des poumons. Ces effets étaient de
même nature que ceux observés chez d'autres espèces avec d'autres
dérivés du cuivre. La dose sans effet observable (NOEL) a été
évaluée dans cette étude à 23 mg Cu/kg p.c. par jour. On a
cependant relevé que les moutons étaient particulièrement sensibles
et des doses de Cu (II) réitérées correspondant à 1,5-7,5 mg Cu/kg
p.c. administrées chaque jour sous la forme de sulfate ou d'acétate
ont entraîné des lésions hépatiques progressives, une crise
hémolytique et la mort.
Exposés pendant une longue période, des rats et des souris
n'ont pas présenté de signes manifestes de toxicité autres qu'une
réduction de croissance liée à la dose, après ingestion de doses
quotidienne équivalant à 138 mg Cu/kg p.c. (rats) et 1000 mg Cu/kg
p.c. (souris). La dose sans effet nocif observable (NOAEL) a été
évaluée à 17 mg Cu/kg p.c. par jour pour les rats et à 44 et 126 mg
Cu/kg p.c. par jour, respectivement pour les souris mâles et les
souris femelles. Les effets observés consistaient notamment en une
inflammation du foie et en une dégénérescence de l'épithélium
tubulaire rénal.
Les études consacrées aux effets toxiques sur la reproduction
et le développement sont limitées. On a constaté une certaine
dégénérescence testiculaire et une réduction du poids du corps et
des organes chez des rats nouveau-nés à des doses dépassant 30 mg
Cu/kg p.c. par jour et administrées sur de longues périodes. On a
également observé des malformations foetales et autres effets
foetotoxiques à dose élevée (> 80 mg Cu/kg p.c. par jour).
Le sulfate de Cu (II) ne s'est pas révélé mutagène dans les
épreuves sur bactéries. Toutefois, on a observé une synthèse non
programmée de l'ADN qui augmentait en fonction de la dose dans des
hépatocytes de rat. Lors du test des micronoyaux sur la souris, on
a observé- dans une étude tout du moins- une augmentation
significative des cassures chromosomiques à la dose I.V. la plus
élevée (1,7 mg Cu/kg p.c.), mais aucun effet n'a été constaté lors
d'une autre étude à des doses allant jusqu'à 5,1 mg Cu/kg p.c.
Les études de neurotoxicité n'ont révélé aucun effet sur le
comportement mais des modifications neurochimiques ont été
signalées après administration par voie buccale de doses
correspondant à 20-40 mg Cu/kg p.c. par jour. D'après un nombre
limité d'études d'immunotoxicité, il y a eu une détérioration de la
fonction immunitaire humorale et à médiation cellulaire après
ingestion, avec l'eau de boisson, de doses équivalant à environ 10
mg Cu /kg p.c. par jour.
1.8 Effets sur l'Homme
Le cuivre est un élément essentiel et les effets indésirables
qui lui sont imputables peuvent provenir d'une carence comme d'un
excès. La carence en cuivre est à l'origine d'anémies, de
neutropénies et d'anomalies osseuses mais il est rare qu'elle se
manifeste cliniquement chez l'Homme. On peut faire un bilan
cuprique pour essayer de prévoir certains effets cliniques ou
encore procéder à un dosage du cuivre et de la céruléoplasmine
sériques pour évaluer une carence modérée à forte, dosage qui
n'offre toutefois pas autant de sensibilité dans le cas d'une
carence limite.
Si l'on excepte les cas d'intoxication aiguë, on n'observe
guère d'effets dans les populations normales. L'absorption d'une
dose unique d'un dérivé du cuivre soit accidentellement, soit dans
un but de suicide, donne lieu aux symptômes suivants: goût
métallique, douleurs épigastriques, céphalées, nausées,
étourdissements, vomissements et diarrhée, tachycardie, difficultés
respiratoires, anémie hémolytique, hématurie, hémorragie
gastrointestinale massive, insuffisance hépatique et rénale
aboutissant finalement à la mort. On a observé des effets
gastrointestinaux après ingestion unique ou répétée d'eau à forte
teneur en cuivre et on a fait état d'insuffisance hépatique
consécutive à l'absorption de cuivre pendant une longue période. Il
ne semble pas qu'une exposition cutanée puisse entraîner une
intoxication générale, mais le cuivre peut provoquer des réactions
allergiques chez certains individus. On a mentionné des cas de fièvre
des fondeurs consécutifs à l'inhalation, sur le lieu de travail,
d'air fortement chargé en cuivre mais, bien que d'autres effets
respiratoires aient été attribués à l'inhalation de mélanges
contenant du cuivre (par ex. bouillie bordelaise, travail à la
mine, travail auprès des fours), la responsabilité du cuivre n'a
pas été démontrée. Des ouvriers apparemment exposés à des
concentrations atmosphériques correspondant à l'absorption d'une
dose de 200 mg Cu/jour, ont présenté des signes évocateurs d'une
intoxication cuprique (par ex. élévation du Cu sérique,
hépatomégalie). Les données dont on dispose au sujet de la
cancérogénicité et des effets toxiques du cuivre sur la
reproduction sont insuffisantes pour permettre une évaluation du
risque.
On a décrit un certain nombre de groupes que des troubles de
l'homéostase cuprique semblent rendre plus sensibles que le reste
de la population à une carence ou à un excès de cuivre. Certains
troubles ont une origine génétique précise. Il s'agit notamment de
la maladie de Menkes, une carence cuprique généralement mortelle,
de la maladie de Wilson (dégénérescence hépatolenticulaire), une
pathologie qui conduit à une accumulation progressive de cuivre et
de l'acéruléoplasminémie héréditaire, qui s'accompagne des
manifestations cliniques d'une surcharge martiale. La cirrhose
infantile indienne et la cuprotoxicose idiopathique sont des
affections liées à un excès de cuivre et peut-être associées à une
sensibilité au cuivre d'origine génétique, encore que cette
hypothèse n'ait pas été indiscutablement prouvée. Il s'agit là
d'affections mortelles de la petite enfance dans lesquelles le
cuivre s'accumule dans le foie. On a pu mettre ces maladies en
parallèle avec une forte consommation de cuivre, tout du moins dans
certains cas.
Parmi les autres groupes potentiellement sensibles à l'excès
de cuivre on peut citer les personnes en hémodialyse et les malades
atteints d'une affection hépatique chronique. Parmi les groupes
exposés au risque de carence en cuivre figurent les nourrissons
(notamment les enfants de faible poids de naissance et les
prématurés, les enfants qui se remettent d'une malnutrition et les
enfants nourris exclusivement au lait de vache), les sujets
souffrant d'un syndrome de malabsorption (maladie coeliaque, sprue,
mucoviscidose) et les malades nourris exclusivement par voie
parentérale. On a également incriminé une carence en cuivre dans la
pathogénèse de certaines maladies cardiovasculaires.
1.9 Effets sur les autres êtres vivants au laboratoire et dans
leur milieu naturel
Il faut mettre en balance les effets indésirables du cuivre et
son caractère essentiel. Cet élément est en effet essentiel pour
tout les êtres vivants et il faut veiller à ce que ces organismes
reçoivent la quantité de cuivre qui correspond à leur besoins. Il
y a au moins 12 protéines importantes dont le cuivre fait partie
intégrante de la structure. Il joue un rôle essentiel dans
l'utilisation du fer pour la formation de l'hémoglobine et la
plupart des crustacés et des mollusques possèdent une protéine,
l'hémocyanine, qui contient du cuivre et représente leur principal
transporteur d'oxygène. Chez les végétaux, le cuivre entre dans la
composition de plusieurs enzymes qui interviennent dans le
métabolisme des sucres, de l'azote et de la paroi cellulaire.
Dans l'évaluation du risque imputable au cuivre, la
biodisponibilité de cet élément joue un rôle déterminant.
L'adsorption du cuivre à des particules de matière ou sa
complexation par des substances organiques peuvent en limiter
fortement l'accumulation et par voie de conséquence, les effets.
Les autres cations ainsi que le pH peuvent également avoir une
influence importante sur la biodisponibilité.
On a montré que le cuivre exerçait des effets nocifs sur la
reproduction, les paramètres biochimiques, les fonctions
physiologiques et le comportement chez divers organismes
aquatiques. Ainsi, des effets toxiques se manifestent chez ces
organismes à des concentrations ne dépassant pas 1-2 µg/litre. Il
est vrai cependant qu'il faut prendre en considération les
importantes variations de sensibilité et de biodisponibilité
interspécifiques lorsque l'on se propose d'interpréter et
d'appliquer ces données.
Dans des communautés naturelles de phytoplancton, on a
constaté que la chlorophylle a et la fixation de l'azote étaient
sensiblement réduites à des concentrations de cuivre > 20
µg/litre et que la fixation du carbone était aussi notablement
réduite à une concentration > 10 µg/litre. Pour les algues, on
a obtenue une CE50 basée sur l'inhibition de la croissance qui
allait de 47 à 120 µg Cu/litre.
Chez les invertébrés dulçaquicoles, la valeur de la CL ou de
la CE50 à 48 h varie de 5 µg Cu/litre pour une espèce de daphnie
à 5300 µg Cu/litre pour un ostracode. Dans le cas des invertébrés
marins, on a obtenu une CL50 à 96 h de 29 µg Cu/litre pour une
coquille saint-jacques et de 9400 µg Cu/litre pour les crabes du
genre Uca. La toxicité aiguë du cuivre pour les poissons d'eau
douce et les poissons de mer est très variable. Pour les poissons
d'eau douce, la valeur de la CL50 à 96 h va de 3 µg Cu/litre (ombre
arctique Thymallus signifer) à 7340 µg Cu/litre
(Lepomis machrochirus). Dans le cas des espèces marines, la Cl50 à
96 h va de 60 µg Cu/litre pour un saumon, Onchorhynchus tschawtscha, à
1400 µg Cu/litre pour le mulet.
Le cuivre joue le rôle d'oligoélément pour les plantes mais un
sol trop riche en cuivre peut se révéler extrêmement toxique. En
général, les signes d'une toxicité d'origine métallique consistent
dans l'apparition de petites feuilles chlorotiques qui tombent
prématurément. Il y a rabougrissement de la plante dont les racines
démarrent mal et ne forment pas de départs latéraux. La réduction
du développement des racines peut conduire à une moindre fixation
d'eau et de nutriments par la plante avec perturbation du
métabolisme et de la croissance. Au niveau cellulaire, le cuivre
inhibe un grand nombre d'enzymes et perturbe plusieurs processus
biochimiques (notamment la photosynthèse, la synthèse des pigments
et l'intégrité des membranes) ou physiologiques (notamment le
métabolisme des acides gras et des protéines avec également un effet
inhibiteur sur la respiration et les processus de fixation de
l'azote).
Des effets toxiques ont également été observés au laboratoire
chez des lombrics placés dans une terre riche en cuivre; le
paramètre le plus sensible qui ait été mesuré était la formation de
cocons et des effets nocifs ont été notés à des concentrations de
50-60 mg Cu/kg.
Certains effets délétères observés chez des microorganismes
terricoles ont pu être mis en corrélation avec la présence de
fortes concentrations de cuivre dues à l'épandage d'engrais à base
de cuivre ou à l'implantation de fonderies de zinc dans le
voisinage. Dans des plantations d'agrumes traitées par des
fongicides à base de cuivre, on a constaté une chlorose foliaire en
corrélation significative avec la teneur du sol en cuivre.
On a montré que dans le milieu naturel, le phytoplancton, les
invertébrés aquatiques et terrestres, de même que les poissons et
les plantes terrestres, faisaient preuve d'une certaine tolérance
au cuivre. Parmi les mécanismes invoqués pour expliquer cette
tolérance chez les plantes, on peut citer la fixation du métal à
certains composants de la paroi cellulaire, la présence d'enzymes
métallo-tolérantes, la formation de complexes avec des acides
organiques suivie d'une élimination dans la vacuole et enfin, la
combinaison avec des protéines spécialisées riches en thiols ou
avec des phytochélatines.
2. Conclusions
2.1 Santé humaine
La limite inférieure de l'intervalle de dose acceptable par
ingestion (AROI) est égale à 20 µg Cu/kg de poids corporel par
jour. Pour obtenir cette valeur, on est parti de l'apport minimal
requis pour un adulte en tenant compte des variations du taux
d'absorption, de rétention et d'accumulation du cuivre (OMS, 1996).
Pour les enfants en bas âge, ce chiffre est égal à 50 µg Cu/kg p.c.
par jour.
La limite supérieure de l'intervalle précité n'est pas connue
avec certitude chez l'adulte mais il est très probable qu'elle est
de l'ordre de quelques mg par jour et pas davantage (par quelques
on entend plus de 2 à 3 mg/jour). Cette évaluation ne repose que
sur l'étude des effets gastrointestinaux d'une consommation d'eau
contaminée par du cuivre. Il n'a pas été possible de donner une
limite supérieure plus spécifique pour un groupe quelconque de
population. Nous ne disposons que de données limitées sur la
quantité de cuivre d'origine alimentaire qui serait susceptible de
nuire à la santé.
On a estimé que les données toxicologiques obtenues sur
l'animal n'étaient d'aucun secours pour l'établissement de la
limite supérieure de l'intervalle de dose acceptable par ingestion
chez l'Homme, du fait de l'incertitude quant à l'applicabilité à
l'Homme des modèles utilisés. En outre, les méthodes auxquelles on
a habituellement recours pour évaluer l'innocuité d'une substance,
méthodes qui impliquent l'application d'un coefficient de sécurité
aux données obtenues sur l'animal, ne sauraient convenir dès lors
que l'on doit prendre en considération des caractéristiques
particulières qui sont celles d'éléments essentiels comme le
cuivre.
A la lumière des données dont on dispose sur l'exposition
humaine au cuivre dans l'ensemble du monde, mais plus spécialement
en Europe et dans les Amériques, il semble que les dangers d'une
carence en cuivre sont plus grands que ceux d'un excès de cet
élément.
2.2 Effets sur l'environnement
Pour assurer la protection des organismes aquatiques dans les
eaux où la biodisponibilité est forte, il faut que le cuivre total
en solution reste en dessous de 10 µg/litre environ, la valeur la
plus appropriée étant fonction des espèces présentes et des
conditions d'exposition du site en cause; elle devra être fixée
après étude approfondie de tous les paramètres à prendre en
considération.
En de nombreux endroits, l'existence de facteurs
physico-chimiques limitant la biodisponibilité permettra de relever
les limites de concentration. La réglementation devra prendre en
considération les espèces chimiques en présence si les auteurs de
rejets sont à même de prouver que la biodisponibilité du cuivre
dans les eaux réceptrices peut être mesurée avec une fiabilité
suffisante.
Lors des prélèvements et des analyses effectués dans
l'environnement en vue de la recherche et du dosage du cuivre, il
est essentiel d'utiliser des techniques "propres".
Etant donné que le cuivre est un élément essentiel, il faut,
lorsqu'on cherche à éviter l'absorption de quantités toxiques de
cuivre, se garder d'introduire des coefficients de sécurité qui
aboutissent finalement à des concentrations recommandées
inférieures aux teneurs naturelles.
RESUMEN Y CONCLUSIONES
1. Resumen
1.1 Identidad, propiedades físicas y químicas
El cobre es un metal de color pardo rojizo, dúctil y maleable.
Pertenece al grupo IB de la Tabla periódica. Se suele encontrar en el
medio ambiente formando compuestos con valencia 2, pero pueden existir
estados metálicos de valencia +1 y +3. Está presente en la naturaleza
en una gran variedad de sales minerales y compuestos orgánicos, y en
forma metálica. El metal es muy poco soluble en soluciones acuosas,
salinas o ligeramente ácidas, pero se puede disolver en los ácidos
nítrico y sulfúrico, así como en soluciones básicas de hidróxido o
carbonato de amonio.
El cobre posee una elevada conductividad eléctrica y térmica y es
resistente a la corrosión.
1.2 Métodos analíticos
La gran variedad de especies de cobre, inorgánicas y orgánicas,
ha dado lugar a una serie de técnicas de muestreo, preparación y
métodos analíticos para cuantificar el elemento en muestras del medio
ambiente y biológicas. La contaminación de las muestras por cobre
procedente del aire, el polvo, los recipientes o los reactivos durante
la preparación y el muestreo es una fuente importante de errores
analíticos, por lo que es fundamental el uso de técnicas "limpias".
Los métodos colorimétricos y gravimétricos para la medición del
cobre son fáciles de usar y económicos; sin embargo, su utilidad se
limita a las situaciones en las cuales no es indispensable una
sensibilidad máxima. Para la medición de concentraciones bajas de
cobre en diversas matrices, los métodos más utilizados son los de
espectrofotometría de absorción atómica. La sensibilidad aumenta
enormemente con la utilización de la espectrofotometría de absorción
atómica en electrohorno de grafito, en lugar de la de llama. En
función de los procedimientos de tratamiento previo, separación y
concentración de la muestra, se han notificado límites de detección de
alrededor 1 µg/litro en agua mediante espectrofotometría en
electrohorno de grafito y 20 µg/litro por la de llama y niveles de
0,05-0,2 µg/g de tejido con la primera. Se puede conseguir una
sensibilidad mayor mediante el uso técnicas de emisión, como las
técnicas de plasma de argon con acoplamiento inductivo de alta
temperatura, seguidas de espectroscopia de emisión atómica o
espectrometría de masas. Existen otras metodologías más sensibles y
especializadas, como la fluorescencia por rayos X, los métodos de
electrodos selectivos de iones y potenciométricos y la voltametría de
descascarillado anódico y de descascarillado catódico.
1.3 Fuentes de exposición humana y ambiental
Las fuentes naturales de exposición al cobre son el polvo
arrastrado por el viento, los volcanes, la vegetación en
descomposición, los incendios forestales y la dispersión marina. Entre
las emisiones antropogénicas cabe mencionar los hornos de fusión, las
fundiciones de hierro, las centrales eléctricas y fuentes de
combustión como los incineradores municipales. El desplazamiento
principal del cobre a la tierra se produce a partir de las escorias y
el manto de las minas de cobre y los fangos cloacales. El uso agrícola
de productos de cobre representa el 2% de la liberación de cobre al
suelo.
Los minerales de cobre se extraen, funden y refinan para la
fabricación de numerosos productos industriales y comerciales. Se
utiliza ampliamente en utensilios de cocina y sistemas de
abastecimiento de agua, así como en fertilizantes, bactericidas,
fungicidas, alguicidas y pinturas antiincrustantes. Se emplea asimismo
en aditivos de piensos y estimulantes del crecimiento, así como en la
lucha contra determinadas enfermedades del ganado vacuno y de las
aves. El cobre se utiliza en la industria como activador en la
flotación por espuma de los minerales sulfurosos, la producción de
conservantes de la madera, la galvanoplastia, la fabricación de
colorantes nitrogenados, como mordiente para tintes de tejidos, en el
refinado del petróleo y en la fabricación de los compuestos de cobre.
1.4 Transporte, distribución y transformación en el medio ambiente
El cobre se libera en la atmósfera asociado con materia
particulada. Se elimina mediante sedimentación gravitatoria,
deposición seca, arrastre y lavado por la lluvia. La velocidad de
eliminación y la distancia recorrida desde la fuente dependen de las
características de ésta, del tamaño de las partículas y de la
velocidad del viento.
El cobre se libera en el agua como consecuencia de la exposición
natural a la intemperie del suelo y los vertidos de industrias y
plantas de depuración de aguas residuales. Se pueden aplicar
compuestos de cobre de manera intencionada al agua para destruir las
algas. Hay varios procesos que influyen en el destino del cobre en el
medio acuático. Son la formación de complejos, la sorción para formar
óxidos metálicos hidratados, arcillas y materiales orgánicos y la
bioacumulación. Los datos sobre las formas fisicoquímicas del cobre
(especiación) son más informativos que las concentraciones totales de
cobre. Gran parte del cobre vertido en el agua está en forma
particulada y tiende a sedimentarse, precipitar o adsorberse en
materia orgánica, hierro hidratado, óxidos de manganeso y arcilla en
el sedimento o la columna de agua. En el medio acuático, la
concentración de cobre y su biodisponibilidad dependen de factores
como la dureza y la alcalinidad del agua, la fuerza iónica, el pH y el
potencial redox, así como de la formación de ligandos complejos, la
materia particulada y el carbón suspendidos y la interacción entre los
sedimentos y el agua.
La liberación más importante de cobre se produce hacia la tierra;
sus fuentes principales son las operaciones de extracción, la
agricultura, los residuos sólidos y los fangos procedentes de las
actividades de tratamiento. La mayor parte del cobre depositado en el
suelo se adsorbe fuertemente y se mantiene en los centímetros más
superficiales. El cobre se adsorbe en la materia orgánica, los
minerales carbonados, los minerales arcillosos, el hierro hidratado y
los óxidos de manganeso. La mayor parte de la lixiviación se produce a
partir de suelos arenosos ácidos. En el medio ambiente terrestre hay
varios factores importantes que influyen en el destino del cobre en el
suelo. Son las características del propio suelo, el pH, la presencia
de óxidos, el potencial redox, las superficies cargadas, la materia
orgánica y el intercambio de iones.
Se produce bioacumulación de cobre procedente del medio ambiente
si el cobre está biológicamente disponible. Los factores de
acumulación varían enormemente entre los distintos organismos, pero
tienden a ser más elevados a concentraciones de exposición más bajas.
La acumulación puede dar lugar a concentraciones corporales
excepcionalmente altas en algunos animales (como por ejemplo los
bivalvos) y en plantas terrestres (como las que crecen en suelos
contaminados). Sin embargo, muchos organismos son capaces de regular
su concentración interna de cobre.
1.5 Niveles medioambientales y exposición humana
La concentración de cobre en el aire depende de la proximidad del
lugar a fuentes importantes, como hornos de fusión, centrales
eléctricas e incineradores. El cobre esta ampliamente distribuido en
el agua, porque se encuentra en ella de forma natural. Sin embargo,
sus concentraciones en el medio acuático se deben interpretar con
cautela. En sistemas acuáticos, los niveles ambientales de cobre se
suelen medir como concentración total o disuelta, siendo esta última
más representativa de la biodisponibilidad del metal.
El promedio de las concentraciones básicas de cobre en el aire de
las zonas rurales oscila entre 5 y 50 ng/m3. En las zonas no
contaminadas, en el agua marina se encuentran concentraciones de 0,15
µg/litro y en el agua dulce de 1-20 µg/litro. Los sedimentos son un
depósito y una reserva importantes de este metal. Las concentraciones
básicas de cobre en sedimentos de agua dulce naturales oscilan entre
16 y 5000 mg/kg (peso seco). Las concentraciones en sedimentos marinos
varían entre 2 y 740 mg/kg (peso seco). En sedimentos anóxicos, el
cobre se une fuertemente mediante sulfuros, por lo que no está
biodisponible. Se notificaron concentraciones medias de cobre de 30
mg/kg en suelos no contaminados (intervalo de 2-250 mg/kg). Este metal
se acumula en las plantas, los invertebrados y los peces. En
organismos de lugares contaminados por cobre se han notificado
concentraciones más elevadas que en los de zonas no contaminadas.
Para las personas sanas no expuestas al cobre en el puesto de
trabajo la vía principal de exposición es la oral. La ingesta diaria
media con los alimentos oscila en las personas adultas entre 0,9 y 2,2
mg. En la mayoría de los estudios se ha encontrado que los valores de
la ingesta se sitúan en el extremo inferior del intervalo. La
variación refleja los diferentes hábitos alimentarios, así como las
distintas prácticas agrícolas y de preparación de alimentos utilizadas
en todo el mundo. En algunos casos, el agua potable puede contribuir a
un aumento importante del valor total de la ingesta diaria de cobre,
sobre todo en hogares con aguas corrosivas y tuberías de cobre. En los
hogares sin tuberías de cobre o con aguas no corrosivas, la ingesta de
cobre a partir del agua potable raramente supera el valor de 0,1
mg/día, aunque puede haber valores superiores a unos pocos mg al día a
causa de la distribución de agua corrosiva a través de tuberías de
cobre. En general, la ingesta diaria total de cobre por vía oral
(alimentos más agua potable) oscila entre 1 y 2 mg/día, aunque
ocasionalmente puede alcanzar un valor superior a 5 mg/día. Todas las
demás ingestas de cobre (inhalación y cutánea) son insignificantes en
comparación con la vía oral. La inhalación añade 0,3-2,0 µg/día
procedente del polvo y el humo. Las mujeres que utilizan DIU están
expuestas sólo a 80 µg o menos de cobre al día a partir de esta
fuente.
1.6 Cinética y metabolismo en animales de laboratorio y en
el ser humano
La homeóstasis del cobre se debe al doble carácter del elemento,
esencial y tóxico. El carácter esencial se deriva de su incorporación
específica a un gran número de proteínas con fines catalíticos y
estructurales. En los mamíferos se conservan las rutas celulares de
absorción, incorporación a las proteínas y exportación del cobre,
reguladas por el propio metal.
El cobre se absorbe fundamentalmente a través del tracto
gastrointestinal. Se absorbe del 20% al 60% del cobre procedente de
los alimentos, mientras que el resto se excreta a través de las heces.
Una vez que el metal ha atravesado la membrana basolateral, es
transportado hasta el hígado unido a la seroalbúmina. El hígado es el
órgano fundamental para la homeóstasis del cobre. El metal se reparte
entre la excreción a través de la bilis y la incorporación a proteínas
intracelulares y extracelulares. La vía de eliminación más importante
es la biliar. El transporte de cobre hasta los tejidos periféricos se
realiza a través del plasma, unido a seroalbúmina, ceruloplasmina o
complejos de bajo peso molecular.
Los métodos utilizados para estudiar la homeóstasis del cobre en
los mamíferos son el análisis de los alimentos y los estudios del
balance. Para conocer la deficiencia y el exceso de cobre son
imprescindibles los isótopos y los análisis bioquímicos normalizados
de estos procesos.
La toxicidad bioquímica del cobre, cuando supera el control
homeostático, se debe a sus efectos en la estructura y la función de
biomoléculas como el ADN, las membranas y las proteínas, directamente
o mediante mecanismos con intervención de radicales de oxígeno.
1.7 Efectos en los animales de laboratorio y en los sistemas
de prueba in vitro
La toxicidad de una dosis oral única de cobre varía enormemente
entre las especies (DL50 de 15-1664 mg de Cu/kg de peso corporal).
Las sales más solubles de cobre (sulfato de cobre (II) y cloruro de
cobre (II)) son generalmente más tóxicas que las menos solubles
(hidróxido de cobre (II), óxido de cobre (II)). La muerte se produce
tras la aparición de hemorragia gástrica, taquicardia, hipotensión,
crisis hemolítica, convulsiones y parálisis. Se notificaron valores de
la DL50 para la exposición cutánea > 1124 y > 2058 mg de Cu/kg de
peso corporal en ratas y conejos, respectivamente. La DL50 por
inhalación (duración de la exposición no especificada) fue >1303 mg
de Cu/kg de peso corporal en conejos, y en los cobayas expuestos a
concentraciones de 1,3 mg de Cu/m3 durante una hora se observó
insuficiencia respiratoria.
Las ratas que recibieron 305 mg de Cu/kg al día por vía oral con
los alimentos en forma de sulfato de cobre (II) durante 15 días
mostraron alteraciones de la bioquímica sanguínea y los datos
hematológicos (particularmente anemia) y efectos secundarios en el
hígado, el riñón y los pulmones. Los efectos fueron cualitativamente
semejantes a los de otros compuestos de cobre y en otras especies. La
concentración sin efectos observados (NOEL) en este estudio fue de 23
mg de Cu/kg de peso corporal al día. Sin embargo, las ovejas fueron
particularmente sensibles, y dosis repetidas de 1,5-7,5 mg de Cu/kg de
peso corporal al día en forma de sulfato de cobre (II) o acetato de
cobre (II) produjeron lesiones hepáticas progresivas, crisis
hemolítica y por último la muerte.
La exposición prolongada de ratas y ratones no puso de manifiesto
signos evidentes de toxicidad, salvo una reducción del crecimiento
relacionada con la dosis tras la ingestión de 138 mg de Cu/kg de peso
corporal al día (ratas) y 1000 mg de Cu/kg de peso corporal al día
(ratones). La concentración sin efectos adversos observados (NOAEL)
fue de 17 mg de Cu/kg de peso corporal al día en ratas y de 44 y 126
mg de Cu/kg de peso corporal al día en ratones machos y hembras,
respectivamente. Los efectos fueron la inflamación del hígado y la
degeneración del epitelio tubular del riñón
Los estudios de la toxicidad reproductiva y en el desarrollo
fueron limitados. Se observó cierta degeneración testicular y una
reducción del peso del cuerpo y de los órganos al nacer en ratas
tratadas con dosis superiores a 30 mg de Cu/kg de peso corporal al día
durante períodos prolongados de tiempo y efectos fetotóxicos y
malformaciones con concentraciones altas (>80 mg de Cu/kg de peso
corporal al día).
El sulfato de cobre (II) no fue mutagénico en valoraciones
realizadas con bacterias. Sin embargo, se observó un aumento
relacionado con la dosis de la síntesis de ADN no programado en
hepatocitos de rata. En el ensayo del micronúcleo, un estudio puso de
manifiesto un aumento significativo de las fracturas cromosómicas con
la dosis intravenosa más alta (1,7 mg de Cu/kg de peso corporal al
día), pero en otro estudio realizado con dosis intravenosas de hasta
5,1 mg de Cu/kg de peso corporal al día no se observó ningún efecto.
Los estudios de neurotoxicidad no han puesto de manifiesto
efectos en el comportamiento, pero se han notificado cambios
neuroquímicos tras la administración oral de 20-40 mg de Cu/kg de peso
corporal al día. En un número limitado de estudios de inmunotoxicidad
se ha observado un trastorno de la función inmunitaria humoral y
mediada por células en ratones después de la ingesta oral con agua de
bebida de unos 10 mg de Cu/kg de peso corporal al día.
1.8 Efectos en el ser humano
El cobre es un elemento esencial y hay efectos perjudiciales para
la salud relacionados tanto con su deficiencia como con su exceso. La
deficiencia de cobre está asociada con anemia, neutropenia y anomalías
óseas, pero la deficiencia clínicamente manifiesta es relativamente
poco frecuente en el ser humano. Se pueden utilizar los datos del
balance para prever los efectos clínicos, mientras que las
concentraciones de cobre en el suero y en la ceruloplasmina son
medidas útiles de la deficiencia entre moderada y grave, pero son
medidas menos sensibles de la deficiencia marginal.
Excepto en el caso de accidentes agudos ocasionales de
intoxicación por cobre, se han observado pocos efectos en la población
normal. Se han notificado efectos de una exposición única tras la
ingestión oral con fines suicidas o accidental consistentes en sabor
metálico, dolor epigástrico, dolor de cabeza, náuseas,
desvanecimiento, vómitos y diarrea, taquicardia, dificultad
respiratoria, anemia hemolítica, hematuria, hemorragia
gastrointestinal masiva, insuficiencia hepática y renal y la muerte.
También se han presentado efectos gastrointestinales por una ingestión
única y repetida de agua de bebida con altas concentraciones de cobre
y se ha notificado insuficiencia hepática tras la ingestión crónica de
cobre. La exposición cutánea no se ha asociado con la toxicidad
sistémica, pero el cobre puede inducir respuestas alérgicas en
personas sensibles. Se han notificado casos de fiebre de los
fundidores debidos a la inhalación de concentraciones elevadas en el
aire en el puesto trabajo y, aunque se han atribuido otros efectos
respiratorios a la exposición a mezclas que contenían cobre (por
ejemplo, caldo bordelés, extracción y fundición), no se ha demostrado
la función del cobre. Los trabajadores aparentemente expuestos a
concentraciones elevadas en el aire que daban lugar a una ingesta
estimada de 200 mg de Cu/día mostraron signos que parecían indicar una
intoxicación por cobre (por ejemplo, concentraciones elevadas de cobre
en el suero, hepatomegalia). Los datos disponibles sobre la toxicidad
reproductiva y la carcinogenicidad son inadecuados para la evaluación
del riesgo.
Se describen varios grupos en los cuales los trastornos aparentes
de la homeóstasis del cobre producen una sensibilidad mayor al déficit
o el exceso de cobre que en la población general. Algunos trastornos
tienen una base genética bien definida. Entre éstos figuran la
enfermedad de Menkes, manifestación de la deficiencia de cobre
generalmente fatal; la enfermedad de Wilson (degeneración
hepatolenticular), enfermedad que lleva a una acumulación progresiva
de cobre; y la aceruloplasminemia hereditaria, con síntomas clínicos
de sobrecarga de hierro. La cirrosis infantil india y la toxicosis
idiopática por cobre son enfermedades relacionadas con el exceso de
cobre que pueden estar asociadas con una sensibilidad al cobre de base
genética, aunque esto no se ha demostrado de manera inequívoca. Estas
son enfermedades hepáticas fatales en la primera infancia, en las que
el cobre se acumula en el hígado. Las incidencias de las enfermedades
estaban relacionadas con un ingestión elevada de cobre, por lo menos
en algunos casos.
Otros grupos potencialmente sensibles al exceso de cobre son los
pacientes sometidos a hemodiálisis y las personas con enfermedades
hepáticas crónicas. Los grupos con riesgo de deficiencia de cobre
incluyen los niños pequeños (en particular los recién nacidos de bajo
peso al nacer/prematuros, los niños que se están recuperando de una
malnutrición, los niños pequeños alimentados exclusivamente con leche
de vaca), las personas con síndrome de mala absorción (por ejemplo
enfermedad celíaca, esprue, fibrosis cística) y los pacientes
totalmente dependientes de una nutrición parenteral. Se ha relacionado
la deficiencia de cobre con la patogénesis de las enfermedades
cardiovasculares.
1.9 Efectos en otros organismos en el laboratorio y en el
medio ambiente
Hay que buscar un equilibrio entre los efectos adversos del cobre
y su carácter esencial. El cobre es un elemento esencial para toda la
biota, y hay que tener cuidado para asegurar que queden cubiertas las
necesidades nutricionales de cobre de los organismos. Este elemento
forma parte integrante de la estructura de 12 proteínas importantes
por lo menos. Es imprescindible para la utilización del hierro en la
formación de la hemoglobina; en la mayor parte de los crustáceos y
moluscos la principal proteína sanguínea transportadora de oxígeno es
la hemocianina, en cuya estructura figura el cobre. En las plantas, el
cobre forma parte de varias enzimas que intervienen en el metabolismo
de los hidratos de carbono, del nitrógeno y de la pared celular.
Un factor decisivo en la evaluación del peligro del cobre es su
biodisponibilidad. La adsorción de cobre en las partículas y la
formación de complejos con la materia orgánica puede limitar mucho el
grado de acumulación del metal y sus efectos. Su biodisponibilidad
puede verse afectada también en gran medida por la presencia de otros
cationes y por el pH.
Se ha demostrado que el cobre tiene efectos adversos en la
reproducción, la bioquímica, la fisiología y el comportamiento de
diversos organismos acuáticos. Se ha observado que concentraciones de
cobre de apenas 1-2 µg/litro tienen efectos perjudiciales en
organismos acuáticos; sin embargo, en la interpretación y aplicación
de esta información se deben considerar grandes variaciones debidas a
la sensibilidad y la biodisponibilidad de las especies.
En las comunidades naturales de fitoplancton se observó una
reducción significativa de la clorofila á y de la fijación del
nitrógeno con concentraciones de cobre > 20 µg/litro, y la fijación
del carbono disminuyó de manera considerable con concentraciones >
10 µg/litro. La CE50 (72 horas) para las algas, basada en la
inhibición del crecimiento, oscila entre 47 y 120 µg de Cu/litro.
En los invertebrados de agua dulce, la C(E)L50 a las 48 horas
oscila entre 5 µg de Cu/litro para una especie de dáfnidos y 5300 µg
de Cu/litro para un ostrácodo. La CL50 a las 96 horas en los
invertebrados marinos varía entre 29 µg de Cu/litro para el peine
caletero y 9600 µg de Cu/litro para el cangrejo violinista. La
toxicidad aguda del cobre para los peces de agua dulce y marinos es
enormemente variable. En los primeros, la CL50 oscila entre 3 µg de
Cu/litro (tímalo ártico) y 7340 µg de Cu/litro para
Lepomis macrochirus. En los segundos, la CL50 a las 96 horas oscila
entre 60 µg de Cu/litro para el salmón real y 1400 µg de Cu/litro para
el mujol.
Aunque las plantas necesitan cobre como elemento traza, la
concentración elevada de este metal en el suelo puede ser muy tóxica.
En general, los síntomas visibles de la toxicidad metálica son las
hojas cloróticas pequeñas y la caída temprana de las hojas. También se
produce un retraso del crecimiento y la iniciación de las raíces y el
desarrollo de las laterales son escasos. El reducido crecimiento de
las raíces puede dar lugar a una menor absorción de agua y de
nutrientes, y esto provoca alteraciones en el metabolismo y retraso
del crecimiento. A nivel celular, el cobre inhibe un gran número de
enzimas e interfiere con varios aspectos de la bioquímica vegetal (por
ejemplo la fotosíntesis, la síntesis de pigmentos y la integridad de
la membrana) y la fisiología (en particular interfiere con los ácidos
grasos y el metabolismo de las proteínas e inhibe la respiración y los
procesos de fijación del nitrógeno).
Se han observado efectos tóxicos en estudios de laboratorio
realizados con lombrices de tierra expuestas a cobre en el suelo; la
formación del cocón es el parámetro más sensible medido, con efectos
adversos importantes en presencia de 50-60 µg de Cu/litro.
En la naturaleza, los efectos adversos en los microorganismos del
suelo se han relacionado con concentraciones más elevadas de cobre en
zonas tratadas con fertilizantes que contenían este elemento y en
lugares cercanos a fundiciones de cobre-zinc. En las zonas citrícolas
en las cuales se han aplicado fungicidas con cobre se ha observado que
la clorosis foliar está fuertemente relacionada con las
concentraciones de cobre en el suelo.
Se ha demostrado tolerancia al cobre en el medio ambiente para el
fitoplancton, los invertebrados acuáticos y terrestres, los peces y
las plantas terrestres. Los mecanismos de tolerancia propuestos en las
plantas comprenden la unión del metal al material de la pared celular,
la presencia de enzimas tolerantes al metal, la formación de complejos
con ácidos orgánicos y la consiguiente eliminación en las vacuolas y
la unión a proteínas específicas ricas en grupos tiol o a
fitoquelatinas.
2. Conclusiones
2.1 Salud humana
El límite inferior de la gama aceptable de ingesta oral (AROI) es
de 20 µg/kg de peso corporal al día. Esta cifra se obtiene a partir de
las necesidades basales de una persona adulta con un margen para tener
en cuenta las variaciones en la absorción, retención y almacenamiento
del cobre (OMS, 1996). En la infancia, esta cifra es de 50 µg/kg de
peso corporal.
El límite superior de la AROI en las personas adultas es
incierto, pero muy probablemente es del orden de varios, pero no
muchos, mg por día (por varios se entiende más de 2-3 mg/día). Esta
evaluación se basa únicamente en los estudios de los efectos
gastrointestinales del agua de bebida contaminada por cobre. No se
pudo confirmar un valor más específico para el límite superior de la
AROI con respecto a ningún sector de la población general. Es limitada
la información disponible sobre el nivel de ingestión del cobre en los
alimentos capaz de provocar efectos adversos para la salud.
Los datos disponibles sobre la toxicidad en los animales no se
consideraron de ayuda para establecer el límite superior de la AROI,
debido a la incertidumbre acerca del modelo apropiado para el ser
humano. Además, la metodología tradicional para la evaluación de la
inocuidad, basada en la aplicación de factores de incertidumbre a los
datos de los animales, no aborda de manera adecuada las
características especiales de elementos esenciales como el cobre.
De los datos disponibles sobre la exposición humana en todo el
mundo, pero particularmente en Europa y en las Américas, se deduce que
la deficiencia en la ingesta de cobre representa un riesgo de efectos
en la salud mayor que el debido a un exceso.
2.2 Efectos en el medio ambiente
La protección de la vida acuática en las aguas con una elevada
biodisponibilidad exigirá el mantenimiento de la concentración total
de cobre disuelto en un valor inferior a 10 µg/litro; sin embargo, el
límite adecuado de la concentración depende de la biota y de las
condiciones de exposición en los lugares que despiertan preocupación y
se debe establecer en función de una nueva evaluación de todos los
datos pertinentes.
En muchos lugares, los factores fisicoquímicos que limitan la
biodisponibilidad permitirán valores de cobre más elevados. En los
criterios reglamentarios se debe tener en cuenta la especiación del
cobre si los autores de los vertidos pueden demostrar que se puede
medir de forma fidedigna la biodisponibilidad del cobre en las aguas
receptoras.
En el muestreo y el análisis del cobre en el medio ambiente es
fundamental la utilización de técnicas "limpias".
Habida cuenta de que el cobre es un elemento esencial, no se
deben incorporar a los procedimientos para impedir niveles tóxicos de
este metal factores de inocuidad que den lugar a concentraciones
recomendadas inferiores a los niveles naturales.