
INTERNATIONAL PROGRAMME ON CHEMICAL SAFETY
ENVIRONMENTAL HEALTH CRITERIA 101
METHYLMERCURY
This report contains the collective views of an international group of
experts and does not necessarily represent the decisions or the stated
policy of the United Nations Environment Programme, the International
Labour Organisation, or the World Health Organization.
Published under the joint sponsorship of
the United Nations Environment Programme,
the International Labour Organisation,
and the World Health Organization
World Health Organization
Geneva, 1990
The International Programme on Chemical Safety (IPCS) is a
joint venture of the United Nations Environment Programme, the
International Labour Organisation, and the World Health
Organization. The main objective of the IPCS is to carry out and
disseminate evaluations of the effects of chemicals on human health
and the quality of the environment. Supporting activities include
the development of epidemiological, experimental laboratory, and
risk-assessment methods that could produce internationally
comparable results, and the development of manpower in the field of
toxicology. Other activities carried out by the IPCS include the
development of know-how for coping with chemical accidents,
coordination of laboratory testing and epidemiological studies, and
promotion of research on the mechanisms of the biological action of
chemicals.
WHO Library Cataloguing in Publication Data
Methylmercury.
(Environmental health criteria ; 101)
1.Methylmercury compounds 2. Mercury poisoning
I.Series
ISBN 92 4 157101 2 (NLM Classification: QV 293)
ISSN 0250-863X
The World Health Organization welcomes requests for permission
to reproduce or translate its publications, in part or in full.
Applications and enquiries should be addressed to the Office of
Publications, World Health Organization, Geneva, Switzerland, which
will be glad to provide the latest information on any changes made
to the text, plans for new editions, and reprints and translations
already available.
(c) World Health Organization 1990
Publications of the World Health Organization enjoy copyright
protection in accordance with the provisions of Protocol 2 of the
Universal Copyright Convention. All rights reserved.
The designations employed and the presentation of the material
in this publication do not imply the expression of any opinion
whatsoever on the part of the Secretariat of the World Health
Organization concerning the legal status of any country, territory,
city or area or of its authorities, or concerning the delimitation
of its frontiers or boundaries.
The mention of specific companies or of certain manufacturers'
products does not imply that they are endorsed or recommended by the
World Health Organization in preference to others of a similar
nature that are not mentioned. Errors and omissions excepted, the
names of proprietary products are distinguished by initial capital
letters.
CONTENTS
ENVIRONMENTAL HEALTH CRITERIA FOR METHYLMERCURY
1. SUMMARY AND CONCLUSIONS
1.1. Identity, physical and chemical properties, analytical
methods
1.2. Sources of human and environmental exposure
1.3. Environmental transport, distribution, and transformation
1.4. Environmental levels and human exposure
1.5. Kinetics and metabolism
1.6. Effects on experimental animals and in vitro systems
1.7. Effects on man - mechanism of action
1.8. Conclusions
2. IDENTITY, PHYSICAL AND CHEMICAL PROPERTIES, ANALYTICAL METHODS
2.1. Identity
2.2. Physical and chemical properties
2.3. Conversion factors
2.4. Analytical methods
2.4.1. Sampling
2.4.2. Analytical procedures
2.4.3. Quality control and quality assurance
3. SOURCES OF HUMAN AND ENVIRONMENTAL EXPOSURE
3.1. Natural occurrence
3.2. Man-made sources
3.3. Uses
4. ENVIRONMENTAL TRANSPORT, DISTRIBUTION, AND TRANSFORMATION
4.1. Transport and distribution between media
4.2. Biotransformation
4.3. Interaction with other physical, chemical, or biological
factors
5. ENVIRONMENTAL LEVELS AND HUMAN EXPOSURE
5.1. Environmental levels
5.1.1. Air
5.1.2. Water
5.1.3. Food
5.2. General population exposure
5.2.1. Estimated daily intakes
6. KINETICS AND METABOLISM
6.1. Absorption
6.2. Distribution
6.3. Metabolic transformation
6.4. Elimination and excretion
6.5. Retention and turnover
6.6. Reference or normal levels in indicator media
6.7. Reaction with body components
7. EFFECTS ON ORGANISMS IN THE ENVIRONMENT
8. EFFECTS ON EXPERIMENTAL ANIMALS AND IN VITRO TEST SYSTEMS
8.1. Neurotoxicity and nephrotoxicity
8.2. Reproduction, embryotoxicity, and teratogenicity
8.3. Mutagenicity and related end-points
8.4. Carcinogenicity
8.5. Special studies
8.6. Factors modifying toxicity; toxicity of metabolites
9. EFFECTS ON MAN
9.1. General population exposure
9.1.1. Effects on adults
9.1.1.1 Effects on the nervous system
9.1.1.2 Effects on non-nervous tissue
9.1.2. Effects on developing tissues
9.1.2.1 Effects on the nervous system
9.2. Occupational exposure
9.3. Mechanisms of toxicity
9.3.1. The mature organism
9.3.1.1 Mechanism of selective damage
9.3.1.2 The latent period
9.3.1.3 Cellular and molecular mechanisms
9.3.2. Developing tissues
9.3.3. Summary
9.4. Dose-effect and dose-response relationships in human beings
9.4.1. Adult exposure
9.4.1.1 The Minamata and Niigata outbreaks
9.4.1.2 The Iraqi outbreak
9.4.1.3 Exposed populations in Canada
9.4.1.4 Other fish-eating populations
9.4.1.5 Special groups
9.4.1.6 Summary
9.4.2. Prenatal exposure
9.4.2.1 Iraq
9.4.2.2 Canada
9.4.2.3 New Zealand
9.4.2.4 Summary
10. EVALUATION OF HUMAN HEALTH RISKS
10.1. Exposure levels and routes
10.2. Toxic effects
10.2.1. Adults
10.2.2. Prenatal exposure
10.3. Conclusions
11. RECOMMENDATIONS
11.1. Gaps in knowledge
11.2. Preventive measures
12. PREVIOUS EVALUATIONS BY INTERNATIONAL BODIES
REFERENCES
APPENDIX
WHO TASK GROUP ON ENVIRONMENTAL HEALTH CRITERIA FOR METHYLMERCURY
Dr L. Albert, Centro de Ecodesarrollo, Xalapa, Vera Cruz,
Mexico
Dr L. Amin-Zaki, Al-Damluji Clinic, Al-Nasr Street, Abu
Dhabi, United Arab Emirates
Professor S. Araki, Kumamoto University Medical School,
First Department of Internal Medicine, Kumamoto, Japan
Professor M. Berlin, Department of Environmental Medicine,
University of Lund, Lund, Sweden ( Chairman )
Dr P.M. Bolger, Food and Drug Administration, Public
Health Service, Center for Food Safety and Applied
Nutrition, Division of Toxicological Review,
Washington, DC, USA
Dr T. Clarkson, The University of Rochester, Environmental
Health Sciences Center, Rochester, New Yorka
Dr D. Dimitroff, Health and Welfare Canada, Environmental
Health Services, Medical Services Branch, Ottawa,
Ontario, Canada
Dr L. Magos, Medical Research Council, MRC Toxicology
Unit, Carshalton, Surrey, United Kingdom ( Rapporteur )
Dr D. Marsh, The University of Rochester, Department of
Neurology, Rochester, New York, USA
Dr J. Piotrowski, Medical Academy in Lodz, Institute of
Environmental Research and Bioanalysis, Lodz, Poland
Professor A. Renzoni, Department of Environmental Biology,
University of Siena, Siena, Italy
Dr C. Shamlaye, Ministry of Health & Social Services,
Botanical Gardens, Republic of Seychellesa
Dr P. Stegnar, "Josef Stefan" Institute, Department of
Nuclear Chemistry, Ljubljana, Yugoslavia
Professor S. Yamaguchi, Institute of Community Medicine,
University of Tsukuba, Tsukuba City, Japan ( Vice-
Chairman )
Observers
Dr M. Ancora, Centro Italiano Studi e Indagini, Piazza
Capranica, Rome, Italy
Professor M. Fujiki, Institute of Community Medicine,
University of Tsukuba, Tsukuba City, Japan
Miss M. Horvat, "Josef Stefan" Institute, Department of
Nuclear Chemistry, Ljubljana, Yugoslavia
Professor A. Igata, Kagoshima University, Kagoshima City,
Japana
Professor C. Maltoni, Institute of Oncology, Bologna,
Italy
Professor A.A.G. Tomlinson, IBE-Rome Research Area, Rome,
Italy
Secretariat
Dr G.C. Becking, International Programme on Chemical
Safety, Interregional Research Unit, World Health
Organization, Research Triangle Park, North Carolina,
USA ( Secretary )
Dr L.J. Saliba, WHO/EURO Project Office, Mediterranean
Action Plan, Athens, Greece
a Invited but unable to attend.
NOTE TO READERS OF THE CRITERIA DOCUMENTS
Every effort has been made to present information in
the criteria documents as accurately as possible without
unduly delaying their publication. In the interest of all
users of the environmental health criteria documents,
readers are kindly requested to communicate any errors
that may have occurred to the Manager of the International
Programme on Chemical Safety, World Health Organization,
Geneva, Switzerland, in order that they may be included in
corrigenda, which will appear in subsequent volumes.
* * *
A detailed data profile and a legal file can be
obtained from the International Register of Potentially
Toxic Chemicals, Palais des Nations, 1211 Geneva 10,
Switzerland (Telephone No. 7988400 - 7985850).
ENVIRONMENTAL HEALTH CRITERIA FOR METHYLMERCURY
A WHO Task Group on Environmental Health Criteria for
Methylmercury met in Bologna, Italy, at the Provincia from
5 to 9 June 1989. The meeting was sponsored by the Italian
Ministry of the Environment and organized locally by the
Institute of Oncology and Environmental Sciences with the
assistance of the Provincial Government. Dr C. Maltoni,
Director of the Institute, welcomed the participants on
behalf of the host institution and the local governments,
and Dr M. Ancora, C.I.S.I., spoke on behalf of the Minis-
try of the Environment. Dr M. Mercier, Manager, IPCS,
addressed the meeting on behalf of the three cooperating
organizations of the IPCS (ILO/UNEP/WHO), reviewing the
accomplishments of the Programme over the last few years.
The Task Group made minor revisions to the draft
document and made an evaluation of the human health risks
from exposure to methylmercury.
The efforts of DR T. CLARKSON, University of
Rochester, Rochester, New York, USA, who prepared the
first two drafts of this document, and all others who
helped in its preparation and finalization are gratefully
acknowledged. Dr G. Becking and Dr P.G. Jenkins, both
members of the IPCS Central Unit, were responsible for the
overall scientific content and technical editing,
respectively.
* * *
Financial support for the meeting was provided by the
Ministry of the Environment of Italy, and the Centro
Italiano Studi e Indagini and the Institute of Oncology,
Bologna, contributed to the organization and provision of
meeting facilities.
1. SUMMARY AND CONCLUSIONS
This monograph focuses on the risks to human health
from compounds of monomethylmercury and examines the data
that have become available since the publication of En-
vironmental Health Criteria 1: Mercury (WHO, 1976b). The
environmental effects of mercury are discussed in Environ-
mental Health Criteria 86: Mercury - Environmental Aspects
(WHO, 1989a).
1.1 Identity, Physical and Chemical Properties, Analytical Methods
The solubility of methylmercury compounds in water
varies greatly and depends on the nature of the anion.
Most are soluble in water but much less soluble in non-
polar solvents. They generally have appreciable vapour
pressures at room temperature. Mercurials, including
alkylmercurials, exhibit high affinities for sulfhydryl
groups.
Blood samples for analysis should be taken by veni-
puncture, avoiding devices using mercury-containing pre-
servatives. Current methods are capable of measuring mer-
cury in 1- to 5-ml samples of whole blood, even in the
case of non-exposed individuals. Hair is useful in
assessing exposure to methylmercury in the diet and may be
sampled as single or bunched strands. The single-strand
procedure requires both sensitive analytical methods and
the determination of the growth phase of the hair.
The method of choice for determining total mercury in
environmental and biological samples is flameless atomic
absorption spectroscopy (detection limits, 0.5-4.0 ng/g).
Neutron activation analysis serves as a sensitive refer-
ence method. Gas chromatography is used to determine meth-
ylmercury directly (detection limit, 1.0 ng/g sample).
1.2 Sources of Human and Environmental Exposure
Environmental methylmercury arises largely, if not
solely, from the methylation of inorganic mercury. The
major source of atmospheric mercury is the natural
degassing of the earth's crust, amounting to 2700-6000
tonnes per year. Deposition of atmospheric mercury,
leaching from rocks, and anthropogenic sources all add to
the mercury burden in bodies of water, but the exact
contribution of each source is indeterminable.
About 10 000 tonnes of mercury per year are mined,
subject to considerable year-to-year variation. Other im-
portant man-made sources are fossil fuels combustion,
smelting of sulfide ores, production of cement, and refuse
incineration. The total man-made global release of mercury
to the atmosphere is approximately 2000-3000 tonnes per
year, i.e., less than the natural emissions. Man-made
emissions pose the greatest risk when they are released in
confined areas.
Mercury continues to be used in the production of
caustic soda and chlorine, and it is widely used in the
electrical industry for lamps, controls, rectifiers, bat-
teries and switches, as well as in the dental profession.
Environmental losses can also occur from its continued use
in antifouling and mildew-proofing paints, in seed dress-
ings, and in the extraction of gold.
1.3 Environmental Transport, Distribution, and Transformation
There is a well recognized global cycle for mercury,
whereby emitted mercury vapour is converted to soluble
forms (e.g., Hg++) and deposited by rain onto soil and
water. Mercury vapour has an atmospheric residence time of
between 0.4 and 3 years, whereas soluble forms have resi-
dence times of a few weeks. Transport in soil and water is
thus limited, and it is likely that deposition will occur
within a short distance.
The change in speciation of mercury from inorganic to
methylated forms is the first step in the aquatic bioac-
cumulation process. Methylation can occur non-enzymically
or through microbial action. Once methylmercury is
released, it enters the food chain by rapid diffusion and
tight binding to proteins. As a result of food-chain bio-
magnification, highest levels are found in the tissues of
such predatory species as freshwater trout, pike, walleye,
bass and ocean tuna, swordfish, and shark. The bioconcen-
tration factor, i.e., the ratio of the concentration of
methylmercury in fish tissue to that in water, is usually
between 10 000 and 100 000. Levels of selenium in the
water may affect the availability of mercury for uptake
into aquatic biota. Reports from Sweden and Canada suggest
that methylmercury concentrations in fish may increase
following the construction of artificial water reser-
voirs.
1.4 Environmental Levels and Human Exposure
The general population is primarily exposed to methyl-
mercury through the diet. However, air and water, de-
pending upon the level of contamination, can contribute
significantly to the daily intake of total mercury. In
most foodstuffs, mercury is largely in the inorganic form
and below the limit of detection (20 µg mercury/kg fresh
weight). However, fish and fish products are the dominant
source of methylmercury in the diet, and levels greater
than 1200 µg/kg have been found in the edible portions
of shark, swordfish, and Mediterranean tuna. Similar
levels have been found in pike, walleye, and bass taken
from polluted fresh waters.
It has been estimated that humans have a daily intake
of about 2.4 µg methylmercury from all sources, and a
daily uptake of approximately 2.3 µg. The total daily
intake of all forms of mercury from all sources has been
estimated to be 6.7 µg, with an added burden of 3.8 to
21 µg of mercury vapour from dental amalgams, if present.
The level of mercury in fish, even for humans consuming
only small amounts (10-20 g of fish/day), can markedly
affect the intake of methylmercury. The consumption of
200 g of fish containing 500 µg mercury/kg will result
in the intake of 100 µg mercury (predominantly methyl-
mercury). This amount is one-half of the recommended pro-
visional tolerable weekly intake (WHO 1989b).
1.5 Kinetics and Metabolism
Methylmercury in the human diet is almost completely
absorbed into the bloodstream and distributed to all tis-
sues within about 4 days. However, maximum levels in the
brain are only reached after 5-6 days. In humans, blood to
hair ratios are about 1:250, with appreciable individual
variation. Similarly, large individual differences are
seen in cord to maternal blood mercury ratios, the levels
generally being higher in cord blood. Species differences
exist in the distribution of methylmercury between red
blood cells and plasma (about 20:1 in humans, monkeys, and
guinea-pigs, 7:1 in mice, and >100:1 in rats).
Methylmercury is converted to inorganic mercury in
experimental animals and humans. The duration of the ex-
posure and the interval after its cessation, determine the
fraction of total mercury present in tissues in the
Hg++ form. In humans, after high oral intakes of methyl-
mercury for 2 months, the following values were reported
(percentage of total mercury in tissues as inorganic mer-
cury): whole blood, 7%; plasma, 22%; breast milk, 39%;
urine, 73%; liver, 16-40%.
The rate of excretion of mercury in both laboratory
animals and humans is directly proportional to the simul-
taneous body burden and can be described by a single-
compartment model with a biological half-time, in fish-
eating humans, of 39-70 days (average approximately 50
days). Lactating females have significantly shorter half-
times for mercury excretion than non-lactating ones.
Mercury half-times in hair closely follow those in
blood but with wider variation (35-100 days, average 65
days). Suckling mice are incapable of excreting methylmer-
cury, but they abruptly change to the adult rate of ex-
cretion at the end of the suckling period.
In the case of continuous exposure, a single-compart-
ment model with a 70-day half-time predicts that the
whole-body steady state (where intake equals excretion)
will be attained within approximately one year and that
the maximum amount accumulated will be 100 times the aver-
age daily intake. The validity of the single-compartment
model is supported by the reasonable agreement between
predicted and observed blood concentrations of methylmer-
cury in single-dose tracer studies, single-dose fish
intake experiments, and studies involving the extended
controlled intake of methylmercury from fish. It is also
supported by results from the longitudinal hair analysis
of individuals with very high intakes of methylmercury.
Mean reference values for total mercury in commonly
used indicator media are: whole blood, 8 µg/litre; hair,
2 µg/g; urine, 4 µg/litre, and placenta, 10 µg/kg wet
weight. Long-term fish consumption is the major determi-
nant of methylmercury and, usually, total mercury levels
in blood. For example, in communities in which there is a
long-term daily consumption of 200 µg mercury/day from
fish, blood mercury levels are approximately 200 µg/litre
and corresponding hair levels about 250 times higher
(50 µg/g hair).
1.6 Effects on Experimental Animals and In Vitro Systems
In every animal species studied, the nervous system is
a target of methylmercury, fetuses appearing to be at
higher risk than adults. Concerning effects on the nervous
system, animal studies reported since 1976 provide further
support to the mechanistic models used to evaluate the
available data in humans (summarized in section 1.7).
Methylmercury is fetoxic in mice (single dose of
2.5-7.5 mg/kg); teratogenic in rats, and adversely
affects the behaviour of monkey offspring (mercury doses
of 50-70 µg/kg per day before and during pregnancy). It
also affects spermatogenesis in mice (1 mg mercury/kg as
methylmercury).
1.7 Effects on Man - Mechanism of Action
The effects of methylmercury on adults differ both
qualitatively and quantitatively from the effects seen
after prenatal or, possibly, early postnatal exposures.
Thus, effects on the mature human being will be considered
separately from the effects on developing tissues.
The clinical and epidemiological evidence indicates
that prenatal life is more sensitive to the toxic effects
of methylmercury than is adult life. The inhibition of
protein synthesis is one of the earliest detectable bio-
chemical effects in the adult brain, though the sequence
of events leading to overt damage is not yet understood.
Methylmercury can also react directly with important
receptors in the nervous system, as shown by its effect on
acetylcholine receptors in the peripheral nerves. In the
case of prenatal exposure, the effects of methylmercury
seem to be quite different and of a much more general
basic nature. It affects normal neuronal development,
leading to altered brain architecture, heterotopic cells,
and decreased brain size. Methylmercury may also be
exerting an effect, perhaps through inhibition of the
microtubular system, on cell division during critical
stages in the formation of the central nervous system.
Since 1976, a wealth of data has been reported on
dose-effect and dose-response relationships in humans. It
has been derived from in-depth studies on populations
exposed to methylmercury through mass poisonings or
through the consumption of fish containing varying levels
of methylmercury. Again, prenatal and adult data will be
considered separately in view of the differences, both
qualitative and quantitative, in effects and dose-response
relationships.
In adults, the reported relationships between
response and body burden (hair or blood mercury concen-
trations) are essentially the same as those reported in
Environmental Health Criteria 1: Mercury (WHO, 1976b).
No adverse effects have been detected with long-term daily
methylmercury intakes of 3-7 µg/kg body weight (hair
mercury concentrations of approximately 50-125 µg/g).
Pregnant women may suffer effects at lower methylmercury
exposure levels than non-pregnant adults, suggesting a
greater risk for pregnant women.
Severe derangement of the developing central nervous
system can be caused by prenatal exposure to methylmer-
cury. The lowest level (maximum maternal hair mercury
concentration during pregnancy) at which severe effects
were observed was 404 µg/g in the Iraqi outbreak and the
highest no-observed-effect level for severe effects was
399 µg/g. Fish-eating populations in Canada and New
Zealand have also been studied for prenatal effects, but
exposure levels were far below those that caused effects
in Iraq and no severe cases were seen.
Evidence of psychomotor retardation (delayed achieve-
ment of developmental milestones, a history of seizures,
abnormal reflexes) was seen in the Iraqi outbreak at
maternal hair levels below those associated with severe
effects. The extrapolation of data suggested that one of
these effects (motor retardation) rose above the back-
ground frequency at maternal hair levels of 10-20 µg/g.
The Canadian study reported that abnormal muscle tone or
reflexes were positively associated with maternal hair
levels in boys but not in girls (the highest maternal hair
level during pregnancy was 23.9 µg/g). The New Zealand
study reported evidence of developmental retardation
(according to the Denver Test) in 4-year-old children at
average maternal hair mercury levels during pregnancy
within the range of 6-86 µg/g (the second highest value
was 19.6 µg/g). The New Zealand mercury values should be
multiplied by 1.5 to convert to maximum maternal hair
levels in pregnancy.
1.8 Conclusions
The general population does not face a significant
health risk from methylmercury. Certain groups with a high
fish consumption may attain a blood methylmercury level
(about 200 µg/litre, corresponding to 50 µg/g of hair)
associated with a low (5%) risk of neurological damage to
adults.
The fetus is at particular risk. Recent evidence shows
that at peak maternal hair mercury levels above 70 µg/g
there is a high risk (more than 30%) of neurological dis-
order in the offspring. A prudent interpretation of the
Iraqi data implies that a 5% risk may be associated with a
peak mercury level of 10-20 µg/g in maternal hair.
There is a need for epidemiological studies on chil-
dren exposed in utero to levels of methylmercury that re-
sult in peak maternal hair mercury levels below 20 µg/g,
in order to screen for those effects only detectable by
available psychological and behavioural tests.
2. IDENTITY, PHYSICAL AND CHEMICAL PROPERTIES, ANALYTICAL METHODS
2.1 Identity
The primary constituent is the element mercury (CAS
registry number 7439-97-6), which has a relative atomic
mass of 200.59. In the inorganic form, mercury exists in
three oxidation states: Hg° (metallic); Hg2++ (mercu-
rous); and Hg++ (mercuric). The mercurous and mercuric
states can form numerous inorganic and organic chemical
compounds. The organic forms are those in which mercury
is attached covalently to at least one carbon atom.
This monograph focuses on the risk to human health of
the compounds of monomethylmercury. The generic term
"methylmercury" is used throughout this text to rep-
resent monomethylmercury compounds. In many cases the
exact identity of these compounds is not known except that
the methylmercury cation, CH3Hg+, is associated either
with a simple anion, like chloride, or a large molecule
(e.g., a protein) with negative and positive charges.
Other physical and chemical forms of mercury are dis-
cussed in this monograph where they are relevant to the
full evaluation of the risks to human health of methylmer-
cury: for example, the atmospheric transport of elemental
mercury vapour (Hg°), its deposition and oxidation in
natural waters, and the subsequent methylation of inor-
ganic mercury (Hg++).
2.2 Physical and Chemical Properties
In its elemental form, mercury at room temperature is
a heavy silvery liquid. At 20 °C the specific gravity of
the metal is 13.456 and the vapour pressure is 0.16 Pa
(0.0012 mmHg). Thus the saturated atmosphere at 20 °C con-
tains mercury vapour at a concentration of approximately
15 mg/m3. This concentration is over 200 fold greater
than the currently accepted concentrations for occu-
pational exposure.
It is of interest that certain forms of mercury, such
as the methyl and ethyl derivatives, have appreciable
vapour pressure at room temperature. Thus, the vapour
pressure of methylmercuric chloride is 1.13 Pa (0.0085
mmHg) and the vapour pressure of dimethylmercury is sev-
eral times greater. Mercurials differ greatly in their
solubilities. Solubility in water increases in the order:
mercurous chloride; elemental mercury; methylmercuric
chloride; mercuric chloride. Certain species of mercury
are soluble in non-polar solvents. These include elemen-
tal mercury and the halide compounds of alkylmercurials.
From the biochemical point of view the most important
chemical property of mercuric mercury and alkylmercurials
is their high affinity for sulfhydryl groups.
2.3 Conversion Factors
1 ppm = 1 mg/kg = 1 µg/g = 1 ng/mg
1 ppb = 1 µg/kg = 1 ng/g
1 µmol mercury 1 µmol methylmercury 200 µg
mercury
2.4 Analytical Methods
2.4.1 Sampling
Many different sampling procedures are used in the
measurement of mercury. Procedures for environmental
sampling in air, water, soil, and aquatic and animals
species are beyond the scope of this monograph. Since its
purpose is to evaluate the risks to human health, only the
sampling of human indicator media and tissues will be con-
sidered.
Blood samples should be taken by venipuncture, the
most convenient method being the use of heparinized
"Vacutainers"a. Some commercial containers may contain
a mercury compound added as a preservative. It is wise to
analyse each commercial batch for mercury before use. The
sample should be refrigerated but not frozen, as it is
sometimes useful to measure mercury in plasma and red
cells separately. The analysis should be carried out as
soon as possible to avoid haemolysis of the sample. If
the sample has clotted or if extensive haemolysis has
occurred, the sample should be homogenized before aliquots
are taken for analysis. Current methods are capable of
measuring mercury in 1- to 5-ml samples of whole blood
even in the case of non-exposed individuals.
Urine sampling is not useful for individuals exposed
to methylmercury, because little is excreted by this
route. Hair samples are important in assessing exposure
to methylmercury in the diet. Methylmercury in non-occu-
pationally exposed individuals is incorporated into hair
at the time the hair is formed, the methylmercury concen-
tration in newly formed hair being proportional to its
simultaneous concentration in blood. Once incorporated
into the hair strand, its concentration remains unchanged.
Thus, longitudinal analysis along a strand of hair pro-
vides a recapitulation of previous blood levels. Since
hair grows at about 1 cm per month, recapitulation is
possible over several months or years, depending on the
length of the hair sample.
a Trade name of heparinized test-tube manufactured by
Becton & Dickinson, USA, and used for blood sample
collection.
There are two sampling methods, single strands and
bunched strands. The former requires a more sensitive
method and the determination of the growth phase (anaphase
and telophase) of each strand by the microscopic examin-
ation of the hair root. However, most methods require at
least 1 mg hair and, preferably, about 10 mg. Thus, if the
hair is measured in 1-cm lengths, it is necessary to have
about 50 strands. The best sampling procedure is to locate
50 strands of the longest hair on the head, hold them in
place with a haemostat, and cut them as close to the scalp
as possible with surgical scissors. The strands are tied
with a cotton thread before the haemostat is released to
ensure that the individual strands remain in the same
alignment. The tied bunch of hair may be stored in a plas-
tic bag or envelope until it is analysed. Bunch analysis
tends to underestimate peak concentrations due to the
different growth rates of individual hairs and to mechan-
ical displacement of individual strands during collection
and subsequent handling (Giovanoli-Jakubczak & Berg, 1974;
Cox et al., in press). Single-strand analysis can give a
more precise temporal recapitulation and avoids certain
artifacts found in bunched-strand analysis. Agreement
between concentrations of mercury in individual hair
strands collected from the same person at the same time is
within 10%. Nevertheless it is wise to collect more than
one strand to guard against accidental contamination or
breakage.
2.4.2 Analytical procedures
The methods summarized in Table 1 have been selected
from a large number of publications. They are typical of
the various methods available for analysis of total mer-
cury and its inorganic or organic species.
All represent a considerable improvement on the orig-
inal "dithizone" method. This method was widely used up
to the introduction of atomic absorption in the late
1960s. Basically it involved the formation of a coloured
complex with dithizone after all the mercury in the sample
had been converted to Hg++ compounds by oxidation in
strong acids. After neutralization of excess oxidant with
a reducing agent, usually hydroxylamine, the coloured com-
plex was extracted into a non-polar solvent. After washing
the extract, the colour intensity was measured on a spec-
trophotometer and the amount of mercury estimated from a
standard curve. The limit of detection was of the order
of 1-10 µg mercury so that large quantities of sample
were required for such media as blood and hair.
The neutron activation procedure is regarded as the
most accurate and sensitive procedure and is usually used
as the reference method (WHO, 1976b). The "Magos" selec-
tive atomic-absorption method (Magos, 1971; Magos and
Clarkson, 1972) has found wide application. It can deter-
mine both total and inorganic mercury and, by difference,
organic mercury. The apparatus is inexpensive, portable,
and does not require sophisticated facilities.
The gas chromatography method is usually used when
there is a need to selectively measure methylmercury or
other organic species. It has been widely used for the
measurement of methylmercury in fish tissues. An alterna-
tive approach is the separation of methylmercury from in-
organic mercury by volatilization (Zelenko & Kosta, 1973),
ion exchange (May et al., 1987), or distillation (Horvat
et al., 1988a), and the estimation of the separated
methylmercury by non-selective methods (e.g., atomic ab-
sorption).
Table 1. Analytical methods for the determination of total inorganic
and methylmercury
---------------------------------------------------------------------------------------------------------
Media Speciation Analytical Method Detection Comments References
Limit
(ng mercury/
g)
---------------------------------------------------------------------------------------------------------
Food, tissues total mercury atomic absorption 2.0 method has many Hatch & Ott
adaptations (1969)
(see Peter &
Strunc, 1984)
Blood, urine, total mercury atomic absorption 0.5 also estimates Magos &
hair, tissues inorganic mercury organic mercury Clarkson (1972)
as difference
between total
and inorganic
Blood, urine, total mercury atomic absorption 2.5 automated form of Farant et al.
hair, tissues inorganic mercury the Magos Method (1981)
Blood, urine, total mercury atomic absorption 4.0 automated form of Coyle & Hartley
hair, tissues inorganic mercury the Magos Method (1981)
Food, tissues, methylmercury gas chromatography 1.0 based on the Von Burg et al.
biological fluids electron-capture original method (1974)
of Westoo (1968) Cappon & Smith
(1978)
All media total mercury neutron activation 0.1 reference method Kosta & Byrne
(1969)
Byrne & Kosta
(1974)
---------------------------------------------------------------------------------------------------------------------------------------------
The estimation of total mercury in a single strand of
hair by X-ray fluorescence has been described by Jaklevic
et al. (1978).
Emulsion autoradiography has been widely used in ex-
perimental studies of tissue deposition of the radioiso-
topes of mercury. However it should be noted that photo-
graphic emulsions are also sensitive to non-radioactive
inorganic forms of mercury (Rodier & Kates, 1988).
It is necessary to note that, since methylmercury is
not a sample contaminant, external contamination does not
interfere with methylmercury-specific methods. Greater
care is required when the method is sensitive to inorganic
mercury contamination (Mushak, 1987).
2.4.3 Quality control and quality assurance
The analysis of most samples of hair or blood involves
very small quantities of mercury (in the ng or even sub-ng
ranges). Therefore, considerable attention should be paid
to procedures that will ensure accurate analytical data.
The general considerations of quality control and quality
assurance have been discussed at a recent WHO-sponsored
conference on Biological Monitoring of Toxic Metals
(Friberg, 1988). A Global Environmental Monitoring System
(GEMS) programme has been described in which a new ap-
proach to interlaboratory comparisons has been success-
fully introduced on an international basis. Specific
quality-control programmes for mercury using the GEMS
approach have been described by Friberg (1983) and Lind et
al. (1988a).
3. SOURCES OF HUMAN AND ENVIRONMENTAL EXPOSURE
3.1 Natural Occurrence
As the predominant, if not only, source of environ-
mental methylmercury is the methylation of inorganic mer-
cury, we need to examine the environmental movement of the
inorganic species if we are to understand the origins of
human exposure to methylmercury. Thus, this section deals
largely with the environmental aspects of elemental mer-
cury vapour and inorganic compounds of mercury.
The major natural sources of mercury (Fig. 1) are
degassing of the earth's crust, emissions from volcanoes,
and evaporation from natural bodies of water (National
Academy of Sciences, 1978; Nriagu, 1979; Lindqvist et al.,
1984). The most recent estimates indicate that natural
emissions amount to 2700-6000 tonnes per year (Lindberg et
al., 1987).
The earth's crust is also an important source of mer-
cury for bodies of natural water. Some of this mercury is
undoubtedly of natural origin, but some may have been
deposited from the atmosphere and may, ultimately, have
been generated by human activities (Lindqvist et al.,
1984). Thus it is difficult to assess quantitatively the
relative contributions of natural and anthropogenic mer-
cury to run-off from land to natural bodies of water.
3.2 Man-Made Sources
The world-wide mining of mercury is estimated to yield
about 10 000 tonnes/year, but this figure varies consider-
ably from year to year, depending on the commercial value
of the metal. Mining activities also result in losses of
mercury through the dumping of mine tailings and direct
discharges to the atmosphere. The Almaden mercury mine in
Spain, which accounts for 90% of the total output of the
European Community, was expected to produce 1380 tonnes in
1987 (Seco, 1987). Other important man-made sources are
the combustion of fossil fuels, the smelting of metal
sulfide ores, the production of cement, and refuse incin-
eration. Using Sweden as a specific example (Swedish
Environmental Protection Board, 1986), the mercury
emissions to the atmosphere in 1984 were (in kg/year):
incineration of household waste (3300); smelting (900);
chloralkali industry (400); crematories (300); mining
(200); combustion of coal and peat (200); other sources
(200).
 The total man-made global release to the atmosphere
has been estimated to be 2000-3000 tonnes/year (Lindberg
et al., 1987; Pacyna, 1987). It should be stressed that
there are considerable uncertainties in the estimated
fluxes of mercury in the environment and in its
speciation. Concentrations in the unpolluted atmosphere
and in natural bodies of water are so low as to be near
the limit of detection of current analytical methods, even
for the determination of total mercury.
Anthropogenic releases of mercury into confined areas
can be the source of high toxicity risk even though these
releases may be small relative to global emissions. The
point is relevant to the contamination of Minamata Bay and
the Agano River in Niigata, Japan, as well as to inadver-
tent poisoning via contaminated bread in Iraq.
3.3 Uses
A major use of mercury is as a cathode in the elec-
trolysis of sodium chloride solution to produce caustic
soda and chlorine gas. Quantities of the order of 10
tonnes of liquid metal are used in each manufacturing
plant. In most industrialized nations, stringent pro-
cedures have been taken to reduce losses of mercury. Mer-
cury is widely used in the electrical industry (lamps, arc
rectifiers, and mercury battery cells), in control instru-
ments in the home and industry (switches, thermostats,
barometers), and in other laboratory and medical instru-
ments. It is also widely used in the dental profession
for tooth amalgam fillings. In certain countries, liquid
metallic mercury is still used in gold extraction. Mercury
compounds continue to be used in anti-fouling and mildew-
proofing paints and to control fungal infections of seeds,
bulb plants, and vegetation. WHO has warned against the
use of alkylmercury compounds in seed dressing (WHO,
1976a). Methylmercury compounds are still used in labora-
tory-based research, and so the possibility of occu-
pational exposures remains (Junghans, 1983).
4. ENVIRONMENTAL TRANSPORT, DISTRIBUTION, AND TRANSFORMATION
4.1 Transport and Distribution Between Media
Human exposure to mercury should first be viewed in
the context of the world-wide circulation of this highly
mobile metal (Fig. 1). The vapour of metallic mercury,
hereinafter referred to as mercury vapour or Hg°, is
released into the atmosphere from a number of natural
sources (section 3.1). Man-made emissions, mainly from the
combustion of fossil fuels, form about 25% of the total
emissions to the atmosphere. However, the anthropogenic
contribution is greater in the northern than in the
southern hemisphere and becomes the major form of emission
in heavily industrialized areas, such as western Europe.
The distribution constants of various mercury compounds
between air and water are given in Table 2. Clearly,
Hg° and dimethylmercury ((CH3)2Hg), as a result of
their air/water distribution coefficients, are most likely
to be found in the atmosphere.
Table 2. Experimentally determined distribution constants
for some compounds of relevance for the mercury cyclea
----------------------------------------------------------
Compound HgX (air)/ Temperature Cl-
HgX (water) (°C) ionic strength
(v/v) (mol)
----------------------------------------------------------
Hg° 0.29 20 0
(CH3)2Hg 0.31 25 0
(CH3)2Hg 0.15 0 0
CH3HgCl 1.9 x 10⁻⁵ 25 0.7
CH3HgCl 1.6 x 10⁻⁵ 15 1
CH3HgCl 0.9 x 10⁻⁵ 10 0.2 x 10⁻³
Hg(OH)2 3.2 x 10⁻⁶ 25 0.2 x 10⁻³
Hg(OH)2 1.6 x 10⁻⁶ 10 0.2 x 10⁻³
HgCl2 2.9 x 10⁻⁸ 25 0.2 x 10⁻³
HgCl2 1.2 x 10⁻⁸ 10 0.2 x 10⁻³
----------------------------------------------------------
a Adapted from: Lindqvist et al. (1984).
The solubility of mercury vapour in water is not high
enough to account for the concentrations of mercury found
in rain water. Thus, Lindqvist et al. (1984) suggested
that a small fraction of mercury vapour is converted to a
water-soluble species, probably Hg++, which is deposited
on land and water in rain. However, the putative water-
soluble forms have yet to be positively identified. Par-
ticulate forms account for less than 1% of total mercury
in the atmosphere but may make an important contribution
to mercury in rain water. The residence time of mercury
vapour is estimated to be between 0.4 and 3 years, and as
a consequence, mercury vapour is globally distributed. The
soluble form is assumed to have a residence time of the
order of weeks, and therefore the distance over which it
may be transported is limited. The extremely low concen-
trations in the atmosphere (section 5.1.1) present formi-
dable difficulties both in the analysis of total mercury
and in the identification and measurement of chemical and
physical species. For example, methylmercury compounds
have been reported in the air above polluted areas in the
USA (WHO, 1976b), but their presence in unpolluted air
still needs to be confirmed. Shimojo et al. (1976) found
methyl donors in car exhaust gases, but not methylmercury
in the ambient air.
Mercury deposited on land and open water is, in part,
re-emitted to the atmosphere as Hg°. This emission,
deposition, and re-emission ("ping-pong" effect) creates
difficulties in tracing the movement of mercury to its
source. The bottom sediment of the oceans is thought to
be the ultimate sink where mercury is deposited in the
form of the highly insoluble mercuric sulfide.
Recently, an expert group suggested that atmospheric
mercury vapour could be taken up directly by plant foliage
and that this might be an important pathway to watersheds
in highly forested areas (Lindberg et al., 1987).
4.2 Biotransformation
Despite the uncertainties concerning speciation, the
global cycle of mercury is believed to involve almost
exclusively the inorganic forms. These forms do not ac-
cumulate in human food chains except in uncommon items,
such as mushrooms (Minagawa et al., 1980). The change in
speciation from inorganic to methylated forms is the first
crucial step in the aquatic bioaccumulation process.
Methylation takes place mostly on sediments in fresh and
ocean waters but also in columns of fresh and sea waters
(Lindberg et al., 1987). Fish intestinal contents (Rudd et
al., 1980) and the outer slime of fish have also been
found to methylate inorganic mercury (McKone et al., 1971;
Jernelov, 1972; Rudd et al., 1980).
The mechanism of synthesis of methylmercury compounds
(both CH3Hg+ and (CH3)2Hg) is now well understood
(Wood & Wang, 1983). Methylation of inorganic mercury
involves the non-enzymic methylation of Hg++ by methyl
cobalamine compounds (analogues of vitamin B12) that are
produced as a result of bacterial synthesis. However,
other pathways, both enzymic and non-enzymic, may play a
role (Beijer & Jernelov, 1979). Factors affecting the
aquatic methylation of mercury have been described by
Fujiki & Tajuma (1975).
Microorganisms have also been isolated that carry out
the reverse reactions:
CH3Hg+ -> Hg++ -> Hg°
The enzymology of CH3Hg+ hydrolysis and mercuric
ion reduction is now understood in some detail (Silver,
1984; Begley et al., 1986), as is the oxidation of mercury
vapour to Hg++ by an enzyme that is critical to the oxy-
gen cycle (catalase). These oxidation-reduction and
methylation-demethylation reactions are assumed to be
widespread in the environment, and each ecosystem attains
its own steady state with respect to the individual
species of mercury. However, owing to the bioaccumulation
of methylmercury, methylation is more prevalent in the
aquatic environment than demethylation.
Once methylmercury is released from microorganisms, it
enters the food chain by rapid diffusion and tight binding
to proteins in aquatic biota. The results of a field study
on the entry of methylmercury to the tuna food chain in
the Mediterranean Sea fits the diffusion model (Bernhard
et al., 1982).
Methylmercury is rapidly accumulated by most aquatic
biota and attains its highest concentration in the tissues
of fish at the top of the aquatic food chain (Bernhard et
al., 1982). Thus, large predatory species, such as trout,
pike, walleye, and bass in fresh water and tuna, sword-
fish, and shark in ocean water, contain considerably
higher levels than non-predatory species (Table 3). The
ratio of the concentration of methylmercury in fish tissue
to that in water can be extremely large, usually of the
order of 10 000 to 100 000 (US EPA, 1980). However, it
should be noted that these bioconcentration ratios are not
the result of partition between water and tissue but of
biomagnification through the food chain. In addition to
the influence of trophic level or species, factors such as
the age of the fish, microbial activity and mercury in
sediment (upper layer), dissolved organic content (humic
content), salinity, pH, and redox potential all affect the
levels of methylmercury in fish (WHO, 1989a). Methylmer-
cury in freshwater fish is also affected by the catchment
area of the lake and by recent flooding or diversion of
rivers (see section 4.3).
4.3 Interaction with Other Physical, Chemical, or Biological Factors
Following the identification of point sources of mer-
cury pollution in the 1960s (Swedish Expert Group, 1971),
it was discovered in the early 1970s that numerous lakes
in Sweden had increased levels of methylmercury in pike,
even though these lakes had not been subjected to any
direct discharge of mercury. It was suggested by Hultberg
& Hasselrot (1981) that three explanations should be
considered:
- mercury discharged into the atmosphere is washed down
by precipitation or is deposited (in the dry form) in
the lake;
- acid precipitation causes the release of natural mer-
cury or mercury deposited earlier by air that had been
trapped;
- acidity in lakes induces a change in the biological
dynamics of the lakes, which results in a re-distri-
bution of mercury in the ecologic system.
The long-distance transport of mercury and the poten-
tial role of acidification have become major factors con-
cerning future human exposure to methylmercury. Low pH
favours both the direct uptake of methylmercury through
the gills of fish and dietary uptake due to increased
mercury accumulation by organisms in lower trophic levels
(Wiener, 1987; Xun & Campbell, 1987). According to
Hultberg and Hasselrot (1981), an increase in acidity of
one pH unit in a lake increases the mercury content in
pike by approximately 0.14 mg/kg wet weight. Wiener (1987)
reported that a change of pH from 6.1 to 5.6 increased the
mercury concentration in 1-year-old yellow perch from
0.11 ± 0.002 (SEM) mg/g to 0.138 ± 0.003 mg/kg within one
calendar year. The causal relationship between reduction
in pH and elevated mercury levels in edible tissues of
fish has not been established. Possible mechanisms
include:
- changes in population dynamics (a switch by pike from
consumption of roach to consumption of perch);
- a reduction in the total biomass where most of the
methylmercury is found (the growth of fish may be
retarded and, for a given size, the mercury concen-
tration will be higher);
- a low pH favours monomethyl versus dimethyl mercury;
the latter is less avidly accumulated by fish;
- a low pH may elute more mercury from sediments or
soils;
- as pH falls, the ratio of methylation to demethyl-
ation reactions increases, thus favouring an increase
in the net production of methylmercury (Ramlal et al.,
1986);
- Bjornberg et al. (1988) proposed that the concen-
tration of the sulfide ion in water determines the
bioavailability of inorganic mercury (Hg++) and,
therefore, the extent of methylation and uptake by
aquatic organisms. A reduction in pH will reduce the
concentration of the sulfide ion making more Hg++
available for methylation.
Table 3. The range of published average values of methylmercury (mg mercury/kg
wet weight) in the muscle tissue of various species of fisha,b
----------------------------------------------------------------------------------
Species Atlantic Pacific Indian Mediterranean
Ocean Ocean Ocean Sea
----------------------------------------------------------------------------------
Non-predators
Mackerel 0.07 - 0.2 0.16 - 0.25 0.005 0.24
Sardine 0.03 - 0.06 0.03 0.006 0.15
Unspecified number of
edible species 0.08 - 0.27 0.07 - 0.09 0.02 - 0.16 0.1 - 0.3
Predators
Tuna 0.3 - 0.8 0.3 0.064 - 0.4 1.2
Swordfish 0.8 - 1.3 1.6 - 1.8
Shark, dogfish, ray 1.0 0.7 - 1.1 0.004 - 1.5 1.8
----------------------------------------------------------------------------------
a Data from: US Department of Commerce (1978).
b Where an analysis of methylmercury was not available, the data on total mercury has been used instead.
Extensive investigations have been made in Canada in
recent years to explain why methylmercury levels increase
in fish when bodies of fresh water are relocated or
redirected (Ramlal et al., 1985; Stokes & Wren, 1987). It
is proposed that the redirecting of rivers and the forma-
tion of reservoirs for hydroelectric production results in
large quantities of organic material in the water, which
serves as a food source for microorganisms. The resulting
increase in microbial activity leads to an increase in the
production of methylmercury from inorganic mercury nat-
urally present in the sediment (Furutani & Rudd, 1980;
Ramlal et al., 1986). This process is sustained by the
repeated raising and lowering of water levels to maintain
hydroelectric production, because the shorelines continue
to be eroded and more vegetation enters the water. It is
likely that future environmental impact statements will
have to take into account this newly discovered source of
methylmercury when hydroelectric schemes are planned.
As noted by Bjornberg et al. (1988), "many biologi-
cal, chemical and physical factors are linked to each
other in the limnic ecosystem" and "many of these
factors seem to be of importance for the Hg content of
fish". Thus "it is not difficult to understand why it
has been considered hard to find simple mechanisms
explaining why certain lakes have a high mercury content
in fish and others have not". They propose that the
"central piece in the puzzle" is the critical influence
of the sulfide ion, which forms the highly insoluble mer-
curic sulfide with Hg++ (Ks = l0-52).
The solubility product of mercury selenide, HgSe, is
even lower (Ks = 10-58). Thus, studies made on a
Canadian lake that had received a large discharge of inor-
ganic mercury from a paper pulp factory suggest that the
addition of selenite can reduce the availability of mer-
cury for uptake into aquatic biota (Turner & Rudd, 1983).
Studies on Swedish lakes confirm these findings (Björnberg
et al., 1988). In these studies the selenium level was
raised artificially from 0.4 to 2.4 µg/litre over a 1- to
2-year period, and the mean levels of mercury fell from
1.5 to 0.70 mg/kg in pike and from 0.56 to 0.16 mg/kg in
perch. Such levels of selenium are below drinking-water
standards.
5. ENVIRONMENTAL LEVELS AND HUMAN EXPOSURE
5.1 Environmental Levels
There is considerable variation in mercury levels in
those media that are the source of human exposure and,
consequently, in their contribution to the toxicity risk.
Non-occupational groups are primarily exposed through the
diet. Although intake of the methylated form is of primary
interest, levels of other species are summarized so as to
provide a measure of total mercury intake.
5.1.1 Air
Concentrations of total mercury in the atmosphere of
the northern hemisphere have recently been estimated at 2
ng/m3, those in the southern hemisphere being half this
value. Values in urban areas are usually higher (e.g.,
10 ng/m3) (Lindqvist et al., 1984). Schroeder & Jackson
(1987) found values in the range 3-27 ng/m3 (mean, 9
ng/m3) in rural areas of Canada and 5-15 ng/m3 (mean,
11 ng/m3) in urban areas. In Sweden, urban levels appear
to be slightly lower (range, 0.8-13.2 ng/m3; mean,
4 ng/m3).
Dental mercury fillings are reported to release mer-
cury vapour into the oral cavity (Clarkson et al., 1988).
The resulting concentrations in intra-oral air can sub-
stantially exceed those found in the ambient atmosphere,
especially after of period of chewing. Estimates of pul-
monary absorption indicate that approximately 3000-17 000
ng mercury vapour enter the systemic circulation daily
from this exposure. As tobacco leaves contain mercury,
smoking may also contribute to inhalation exposure (Suzuki
et al., 1976).
As discussed in section 4.1, the major form of mercury
in air is believed to be elemental mercury vapour. How-
ever, the presence of methylmercury compounds in the ambi-
ent atmosphere has been reported (Johnson & Braman, 1974).
Recent data from the vicinity of Toronto, Canada, indi-
cated the following average composition (as percentage of
total mercury): Hg°, 75%; Hg++, 5%; and CH3Hg+, 20%
(Schroeder & Jackson, 1987). The particulate fraction of
mercury in air (as a percentage of total mercury) is
usually 4% or less (Lindqvist et al., 1984). The way in
which the "soluble fraction" of mercury in air (section
4.1) relates to these recent findings on individual chemi-
cal species is still unclear.
5.1.2 Water
Concentrations of total mercury in natural water are
so low that accurate analysis is still a major problem.
Values for rain water are usually within the range 5-100
ng/litre, but mean values as low as 1 ng/litre have been
reported. The most recent data (Fig. 1) indicate lower
values than those previously recorded (WHO, 1976b).
Representative values for dissolved total mercury are:
open ocean, 0.5-3 ng/litre; coastal sea water, 2-15
ng/litre; freshwater rivers and lakes, 1-3 ng/litre. The
concentration range for mercury in drinking-water is the
same as in rain, with an average of about 25 ng/litre
(Lindqvist et al., 1984).
The chemical speciation of mercury in water is still
not completely defined. Mercury in ocean waters exists
mainly in the form of Hg++ complexed with chloride ions.
Speciation in fresh water is poorly understood. In a con-
taminated lake system in Canada, methylmercury was found
to constitute a varying proportion of total mercury,
depending on the lake that was being tested, but, overall,
accounted for approximately 1-6% of the total mercury
(Canada-Ontario Steering Committee, 1983).
5.1.3 Food
Concentrations of mercury in most foodstuffs (WHO,
1976b; US EPA, 1984; Piotrowski & Inskip, 1981) are often
below the reported limit of detection (usually 20 µg/kg
fresh weight). Fish and fish products are the dominant
source of methylmercury in food. The highest concen-
trations are found in both freshwater and marine fish at
the highest trophic levels (Table 4). For example, shark
and swordfish have average values of total mercury in
edible tissues above 1200 µg/kg, whereas anchovies and
smelt have average values below 85 µg/kg. Most other
foodstuffs have average values below 20 µg/kg, with
mercury mainly in the inorganic form (Cappon, 1981;
Gartrell et al., 1985a,b, 1986). Cappon (1987) reported
mercury levels in vegetables.
5.2 General Population Exposure
5.2.1 Estimated daily intakes
The human intake of the three major forms of mercury
present in the environment is summarized in Table 4. The
intake of mercury from the ambient atmosphere has been
estimated by assuming that the concentration of total
mercury is 2 ng/m3 and that 75% is present as elemental
mercury vapour, 5% as inorganic mercury compounds, and 20%
as methylmercury. The daily intake of each form of mercury
was estimated by assuming a daily ventilation of 20 m3,
and the amount absorbed was estimated by assuming that 80%
of the inhaled elemental vapour, 50% of the inorganic mer-
cury compounds, and 80% of the methylmercury was absorbed
across the pulmonary membranes (WHO, 1976b).
Mercury intake from drinking-water was estimated by
assuming a daily water intake of 2 litres, an average
concentration of 25 ng/litre, and that all the mercury is
in the inorganic form. Methylmercury has been found in a
few samples taken from bodies of natural water, but there
have been no reports of methylmercury in drinking-water.
The intake of species of mercury in the diet was the
most difficult to estimate. Total mercury intake from all
foodstuffs in Belgium was 13 µg/day, compared with an
intake from fish alone of 2.9 µg/day (Fouassin & Fondu,
1978). Also in Belgium, Buchet et al. (1983) measured a
daily intake from all foodstuffs of 6.5 µg mercury.
The intake of total dietary mercury (µg/day) measured
during a market basket survey (1984-1986) of the Food and
Drug Administration (FDA) in the USA (Shibko, 1988),
according to age group was: 0.31 (6-11 months); 0.90 (2
years); 1.76 (16 years, females); 1.84 (14-16 years,
males); 2.32 (25-30 years, females); 3.01 (25-30 years,
males); 2.29 (60-65 years, females) and 2.52 (60-65 years,
males). It is of interest that when these intake rates are
converted to µg/day per kg body weight, the values fall
in a much more narrow range from 0.04 to 0.09. In fact
values for all the age groups except the two-year-olds
fall between 0.044 and 0.054 µg/day per kg.
Table 4. Estimated average daily intake and retention (ug/day) of total
mercury and mercury compounds in the general population not occupationally
exposed to mercurya
--------------------------------------------------------------------------
Exposure Elemental Inorganic mercury Methylmercury
mercury vapour compounds
--------------------------------------------------------------------------
Air 0.030 (0.024) 0.002 (0.001) 0.008 (0.0064)
Food
Fish 0 0.600 (0.042) 2.4 (2.3)
Non-fish 0 3.6 (0.25) 0
Drinking-water 0 0.050 (0.0035) 0
Dental amalgams 3.8-21 (3 - 17) 0 0
Total 3.9-21 (3.1 - 17) 4.3 (0.3) 2.41 (2.31)
--------------------------------------------------------------------------
a See text for assumptions underlying the calculations of average daily
intake and retention. Values given are the estimated average daily
intake; the figures in parentheses represent the estimated amount
retained in the body of an adult. Values are quoted to 2 significant
figures.
In Poland, the average daily dietary intake of mercury
(estimated in 2134 duplicate portions) was 5.08 µg/day in
the age group l-6 years, 5.43 µg/day in the age group
6-18 years, and 15.8 µg/day in adults (Szprengier-
Juszkiewicz, 1988). Owing to the low fish consumption
(6.76 kg/year) and low mercury concentration in market
fish (65 µg/kg), only 7% of the dietary intake derived
from fish (Nabrzyski and Gajewska, 1984). Bernhard &
Andreae (1984) estimated the world-wide mercury intake
from seafood to be 2 µg/day, which is equivalent to a
daily intake of 20 g seafood with a mercury concentration
of 0.1 mg/kg. This agrees with estimates by a United
Nations expert group (GESAMP, 1986). It should be pointed
out that the individual variation in intake is large and
that significant proportions of national populations have
a mercury intake via seafood many times higher than the
average (GESAMP, 1986).
For the purpose of estimating the average daily intake
of total mercury and various mercury compounds (Table 4),
it was assumed that the daily intake of total mercury from
fish and fish products is 3 µg and that 20% of this is in
the form of inorganic mercury compounds (i.e., 0.6 µg/day)
and 80% is methylmercury (i.e., 2.4 µg/day). The intake
of total mercury from non-fish sources was calculated as
the difference between the average total dietary intake
and the intake from fish. The average total dietary intake
in the Belgium studies was (6.5 + 13)/2 = 9.75 µg/day,
whereas the corresponding value for a 70-kg adult in the
USA can be estimated from the FDA market basket survey as
3.5 µg. Taking the average of the Belgian and USA
figures, the dietary intake of total mercury is estimated
as (9.75 + 3.5)/2 = 6.6 µg/day. By subtracting from this
figure the intake of methylmercury from fish (2.4 µg/day),
the estimated total dietary intake of inorganic mercury is
4.2 µg/day. All the mercury from non-fish sources was
assumed to be in the inorganic form. The amounts absorbed
across the gastrointestinal tract were estimated on the
assumption that 7% of the inorganic and 95% of the methyl
species were absorbed (section 6).
The estimated dietary intake of inorganic mercury of
4.3 µg/day is the least reliable of the estimates in
Table 4. Data are not available on the species of mercury
in most foodstuffs. In addition, the figures for dietary
intake of total mercury come from only two countries -
Belgium and the USA.
Table 4 portrays the relative magnitude of the contri-
butions from various media. It is clear that fish and fish
products are the dominant source of human exposure to
methylmercury, even when low fish consumption is assumed
(as in Table 4). Daily methylmercury intake can vary over
a wide range, depending on the amount of fish consumed and
the methylmercury concentration in the fish (Table 5). A
number of communities have been identified where individu-
al intakes exceeded 200 µg mercury/day (WHO, 1976b,
1980; Turner et al., 1980; GESAMP, 1986). As it is assumed
that 80% of this mercury is methylmercury and that 95% of
the methylmercury is absorbed, the absorbed amount of
methylmercury (>153 µg/day) will, in these cases, domi-
nate the daily mercury exposure (Table 4). On the basis of
general population surveys of fish consumption, it was
estimated that in Australia 0.9% of the population eat
more than 1000 g fish/week and that this corresponded to
about 20 µg mercury/day (WGMF, 1980). In the USA,
surveys of fish consumption (US Dept. Commerce, 1978)
were used to estimate that, with no regulatory control of
the mercury content of marketed fish, 99.81% of all
respondents had an upper limit mercury intake lower than
their personal allowable daily intake (based on 30 µg
mercury/day for a 70-kg person) at a 95% level. An action
level of 1 mg mercury/kg in fish for regulatory control
would increase this percentage to 99.87% and an action
level of 0.5 mg mercury/kg would increase it to 99.89%.
Dental mercury amalgams account for the major back-
ground intake of mercury vapour (Clarkson et al., 1988).
It is possible that mercury liberated from the amalgam can
dissolve in the saliva as inorganic mercury, but there are
no published reports on this possibility. A detailed dis-
cussion of the release of mercury from dental amalgams
will be found in the Environmental Health Criteria mono-
graph on Inorganic Mercury, which is due to be published
in 1990.
Table 5. Intake of methylmercury (ug/day) from
fish with various methylmercury levels
and at various rates of fish consumptiona
------------------------------------------------
Consumption Level of methylmercury in fish
of fish (ug/kg fresh weight)b
(g/day) 200 500 1000 2000 5000
------------------------------------------------
5 1 2.5 5 10 25
20 4 10 20 40 100
100 20 50 100 200 500
300 60 150 300 600 1000
1000c 200 500 1000 2000 5000
------------------------------------------------
a Adapted from: WHO (1980).
b For methylmercury concentration in fish see
Table 3.
c Data from GESAMP (1986) indicate that maximum
intakes may equal 1000 g/day.
6. KINETICS AND METABOLISM
A considerable amount of information was available on
the metabolism of methylmercury at the time when Environ-
mental Health Criteria 1: Mercury was published (WHO,
1976b). This section will briefly review the information
in that document and quote more recent data where appro-
priate.
6.1 Absorption
Methylmercury in the diet is almost completely ab-
sorbed into the bloodstream (WHO, 1976b). Animals studies
(Walsh, 1982) indicate that age, including neonatal stage,
has no effect on the efficiency of gastrointestinal ab-
sorption, which is usually in excess of 90% of the oral
intake. Data on rats indicate rapid and virtually complete
absorption of inhaled methylmercury vapour into the blood-
stream (Fang, 1980).
6.2 Distribution
Methylmercury is distributed in the bloodstream to all
tissues. Distribution is completed within about 4 days in
human beings (Kershaw et al., 1980), but the time after a
single dose for maximum levels to be reached in the brain
is one or two days longer than for other tissues (Berlin,
1986). At this time, the total brain contains approxi-
mately 6% of the dose (Kershaw et al., 1980), which is
very near to 10% of the body burden (WHO, 1976b). These
blood and brain values correspond to a six times higher
concentration in the brain than in blood (Berlin, 1986).
There are significant species differences in brain-to-
blood ratios. After the prolonged administration of
methylmercury, brain-to-blood ratios are between 3 and 6
in squirrel monkeys (Berlin, 1986) but somewhat lower in
macaque monkeys (Evans et al., 1977). The ratio is gener-
ally low in non-primate animals, except in pigs (where it
is 3.3); it is 1.5 in guinea-pigs, 1.2 in mice, and 0.06
in rats (Magos, 1987). Sex differences in distribution and
retention have been reported in rats dosed with methylmer-
cury (Magos et al., 1981; Thomas et al., 1986) and in both
adult (Hirayama & Yasutake, 1986) and prenatally exposed
mice (Inouye et al., 1986).
There are also species differences in the distribution
of methylmercury between erythrocytes and plasma. After
the ingestion by human volunteers of fish containing
methylmercury, the background-corrected erythrocyte-to-
plasma methylmercury concentration ratio was about 20
(Kershaw et al., 1980). The ratio is approximately the
same in monkeys and guinea-pigs, 7 in mice, and more than
100 in rats (Magos, 1987).
The blood-to-hair ratio in humans is about 1 to 250,
but appreciable individual differences have been found
(Table 6). Similarly, large individual differences exist
in the ratio of cord blood to maternal blood concen-
tration. Cord blood usually has somewhat higher methylmer-
cury concentration than maternal blood (WHO, 1976b). Thus,
in a group of Japanese women the average ratio of cord
blood to maternal blood methylmercury concentration ranged
from 0.8 to 2.8, with a mean of 1.65 (Suzuki et al.,
1984b). The results of studies on rats (Ohsawa et al.,
1981) and pigs (Kelman et al., 1980, 1982) indicate that
placental transport of methylmercury into the fetus
increases dramatically towards the end of pregnancy.
6.3 Metabolic Transformation
Methylmercury is converted to inorganic mercury, as-
sumed to be Hg++, in mammals (WHO, 1976b). The fraction
of total mercury present in the tissues as Hg++ depends
on the duration of exposure to methylmercury and the time
after cessation of exposure.
The percentage of total mercury present as Hg++ in
the tissues and body fluids of people exposed to high oral
daily intakes of methylmercury for about 2 months in the
Iraqi outbreak were: whole blood, 7%; plasma, 22%; breast
milk, 39%; and urine, 73% (Amin-Zaki et al., 1976; Magos
et al., 1976; WHO, 1976b). Measurements of liver tissues
from fatalities in Iraq revealed that 16-40% was present
as inorganic mercury. Unfortunately, no other tissues were
available for analysis. There is a possibility that
exposure to other mercury compounds may have occurred in
some members of the Iraqi population.
Table 6. Relationship between mercury concentrations in the blood and
hair of people with long-term exposure to methylmercury from fish
-----------------------------------------------------------------------------------------------
Country Number of Whole blood Hair Linear Reference
subjects (x) (y) regression
(µg/litre) (mg/kg)
-----------------------------------------------------------------------------------------------
Canada 339 1 - 60 1 - 150 y = 0.30x + 0.5 Phelps et al. (1980)
Japan 45 2 - 800 20 - 325 y = 0.25x + 0 WHO (1976b)
Netherlands 47 1 - 40 0 - 13 y = 0.26x + 0 Den Tonkelaar et al.
(1974)
Sweden 12 4 - 650 1 - 180 y = 0.28x - 1.3 WHO (1976b)
51 4 - 110 1 - 30 y = 0.23x + 0.6 WHO (1976b)
50 5 - 270 1 - 56 y = 0.14x + 1.5 WHO (1976b)
60 44 - 550 1 - 142 y = 0.23x - 3.6 WHO (1976b)
United Kingdom 173 0.4 - 26 0.1 - 11 y = 0.25x + 0.6 Haxton et al. (1979)
98 1.1 - 42 0.2 - 21 y = 0.37x + 0.7 Sherlock et al. (1982)
Yugoslavia 38 1.2 - 9.6 0.4 - 3.0 y = 0.34x - 22 Horvat et al. (1986b)
-----------------------------------------------------------------------------------------------
In Canadian Indians repeatedly exposed to methylmer-
cury in fish during the summer season every year, inor-
ganic mercury accounted for about 5% of total mercury in
whole blood and about 20% in samples of head hair (Phelps
et al., 1980). Brain mercury levels were measured in one
Indian who had died of natural causes 2 years after having
a high blood level (approximately 600 µg/litre). Most of
the mercury in the brain tissue was in the inorganic form,
but, at the time of his death, the total mercury in the
brain had fallen to near background levels (Wheatley et
al., 1979).
Following the outbreak in Minamata, Japan, in 1956,
tissues from a number of early fatalities were analysed
(Tsubaki & Takahashi, 1986). Death occurred between 19
and 100 days after the onset of symptoms. Tissues were
also analysed from people who died from 1 to 17 years
after the onset of symptoms. Samples were analysed
initially by the dithizone colorimetric procedure in
1956-1960 and again in 1973-1983 by atomic absorption for
total mercury and by gas chromatography for methylmercury.
In this study, atomic absorption generally gave higher
values for total mercury than the dithizone method. The
methylmercury concentration was always less than that of
total mercury, usually less than 50%, and in a few cases
less than 10%. The chemical nature of the mercury not
accounted for as methylmercury was not determined. It may,
in whole or in part, have been methylmercury that could
not be extracted in the gas chromatographic procedure, or
it may have been inorganic mercury.
Speciation of mercury in human brain has been studied
by Friberg et al. (1986) and Nylander et al. (1987). An
average of 80% of the mercury in the occipital lobe cortex
of autopsy cases in Sweden was found to be inorganic
mercury (3-22 ng/g wet weight). Exposure to mercury from
dental fillings could explain the high proportion of
inorganic mercury in some cases but not in all.
There is considerable evidence indicating the presence
of inorganic mercury in the tissues of animals dosed with
methylmercury (WHO, 1976b). Magos & Butler (1972) showed
that during long-term daily dosing, the fraction of inor-
ganic mercury in rat tissues tended to approach a constant
value, which was different for each tissue. The kidney and
liver had the highest fractions, while the brain had one
of the lowest. Speciation of mercury in the brain of
monkeys exposed to methylmercury for several years was
studied by Lind et al. (1988b). At the end of the exposure
period, 10-30% of the brain mercury was in the inorganic
form while in monkeys sacrificed 0.5-2 years after the
same treatment, about 90% was in the inorganic form. Simi-
lar observation was reported by Kawasaki et al. (1986),
but in the cerebrum a substantially higher proportion of
the total mercury was methylmercury than in the cerebellum
(See also WHO, 1976b). It is clear that the proportion of
inorganic mercury found at any time in a particular tissue
will be determined by a number of processes, e.g., the
relative rates of uptake and loss of inorganic mercury and
methylmercury and the extent of biotransformation (if any)
in that tissue. Studies by Suda & Takahashi (1986) indi-
cate that macrophage cells, such as those present in the
spleen, are capable of converting methylmercury to inor-
ganic mercury. The reaction may involve the production of
oxygen free-radicals. At present there are no definitive
data that prove that demethylation actually takes place in
brain tissue, but persuasive arguments have been presented
by Lind et al. (1988b).
The conversion of methylmercury to Hg++ may be a key
step in the processes of excretion. The faecal pathway
accounts for about 90% of the total elimination of mercury
in man and other mammals after exposure to methylmercury
(WHO, 1976b). Virtually all the mercury in human faeces
is in the inorganic form (Turner et al., 1975). The pro-
cess of faecal elimination begins with the biliary
secretion of both methylmercury and Hg++, complexed
mainly, if not entirely, with glutathione (GHS) (Refsvik &
Norseth, 1975) or other sulfhydryl peptides (Norseth &
Clarkson, 1971; Ohsawa & Magos, 1974). Inorganic mercury
is poorly absorbed across the intestinal wall (WHO, 1976b)
so that most (approximately 90%) of the inorganic mercury
secreted in bile passes directly into the faeces. Methyl-
mercury secreted into the intestinal contents is in large
part reabsorbed into the bloodstream and may subsequently
contribute to biliary secretion, thereby forming a
secretion-reabsorption cycle (Norseth & Clarkson, 1971).
This cycle (also called enterohepatic circulation) in-
creases the amount of methylmercury passing through the
intestinal contents and thus provides a continuous supply
of methylmercury to serve as a substrate for the intesti-
nal microflora. These microorganisms are capable of con-
verting methylmercury to inorganic mercury, which then
becomes the major contributor to total faecal elimination
in the rat (Rowland et al., 1980). Presumably about 10% of
the inorganic mercury produced by the intestinal micro-
flora is absorbed into the bloodstream and contributes to
the inorganic mercury concentrations in tissues, plasma,
bile, breast milk, and urine. This intestinal microbio-
logical activity may explain the influence of diet on
methylmercury elimination rates in rats (Rowland et al.,
1984, 1986), and the absence of demethylating intestinal
microflora may be the reason for the low rate of faecal
elimination of mercury in suckling mice (Rowland et al,
1983).
To what extent this model of enterohepatic circulation
and intestinal conversion to inorganic mercury applies to
humans is not yet known. Considerable species differences
exist in rates of biliary excretion (Naganuma & Imura,
1984). Though the species variation in the secretion of
methylmercury does not entirely correspond to the biliary
excretion of GSH, high GSH secretion (rat, mice, and ham-
ster) is associated (on a group basis) with high methyl-
mercury secretion and low GSH secretion (guinea-pig and
rabbit) with low methylmercury secretion (Stein et al.,
1988).
Animal studies suggest that multigeneration exposure
to methylmercury may change tissue distribution and metab-
olism (Yamamoto et al., 1986).
6.4 Elimination and Excretion
The rate of excretion of mercury in both humans and
laboratory animals dosed with methylmercury is directly
proportional to the simultaneous body burden, and there-
fore may be described by a single biological half-time
(WHO, 1976b). The reason is that methylmercury is so
mobile in the body that the excretion process is the rate-
limiting step. Data on biological half-times in human
beings were summarized in Environmental Health Criteria 1:
Mercury (WHO 1976b). Kershaw et al. (1980) and Sherlock et
al. (1984) reported half-times of 52 (39-67) and 50
(42-70) days in blood, close to the valves found earlier
in people who ate fish or had consumed contaminated bread
(WHO, 1976b). The whole-body half-times, determined in
volunteers given a single tracer dose, have an average
value of about 70 days and a range of 52-93 days. Only 20
subjects have been studied to date. Biological half-times
in blood and hair have been measured both in volunteers
given carefully measured doses and, after cessation of
exposure, in individuals exposed as a result of accidental
intake or high fish consumption. Observations on volun-
teers reveal values for blood half-time close to 50 days
and a range of 39-70 days. Results from single tracer
doses agree well with those from volunteers given measured
doses in fish. It is clear that the blood half-times over-
lap those for the whole body, but the average value is
lower. A shorter blood half-time would account for the
observation that the amount of methylmercury in blood
constitutes a decreasing fraction of the body burden with
time after a single tracer dose (Miettinen, 1973). Lac-
tating women have significantly shorter half-times (aver-
age value, 42 days) than non-lactating women (average
value, 79 days), an observation confirmed by animals
studies (Greenwood et al., 1978).
Observations on both volunteers and environmentally
exposed people indicate that half-times in hair closely
follow those in blood (Amin-Zaki et al., 1976; Kershaw et
al., 1980; Hislop et al., 1983). However, hair half-times
tend to have a wider range; for example, Al-Shahristani &
Shihab (1974) reported a bimodal distribution in 48 Iraqi
subjects, 90% having a half-time of 35-100 days and the
other 10% a half-time of 110-120 days. It is possible, but
not proven, that analytical artifacts may contribute to
the wider range seen with hair (WHO, 1980). In any case,
data from animals point to the importance of sex, age, and
genetically determined individual differences (Hirayama &
Yasutake, 1986).
Animal data indicate major ontogenic effects on bio-
logical half-times (Doherty et al., 1977). Suckling mice
are completely unable to excrete methylmercury. At the end
of the suckling period, excretion abruptly switches on at
the adult rate. Observations on infant monkeys confirm
this finding (Lok, 1983). Likewise, biliary secretion of
methylmercury in suckling animals is virtually absent and
assumes the adult rate after weaning. It is of interest
that biliary secretion of glutathione (GHS) shows parallel
ontogenic changes (Ballatori & Clarkson, 1985). Microflora
also have greatly diminished capacity to demethylate
methylmercury during the suckling period (Rowland et al.,
1983). In view of the failure of infant animals to excrete
methylmercury, human infants may also have a diminished
excretion. Unfortunately, no direct observations have yet
been reported.
6.5 Retention and Turnover
The evidence summarized in section 6.4 indicates that
the accumulation and excretion of methylmercury in humans,
measured in terms of hair or blood levels, can be rep-
resented by a single-compartment model. The accumulation
phase in the whole body or in a tissue compartment is
described by the equation:
A = ( a / b )(1-exp(- b x t )) (equation 1)
where A = the accumulated amount
a = the amount taken up by the body (or organ)
daily
b = the elimination constant
t = time
The elimination constant is related to the biological
half-time ( T´) by the expression:
T´ = ln2/ b (equation 2)
and a is related to the daily dietary intake ( d ) by the
expression:
a = f x d (equation 3)
where f is the fraction of the daily intake taken up by
the body (or organ).
At a steady state, the accumulated amount ( A ) is
given by:
A = a / b (equation 4)
while the steady-state mercury concentration in blood
(C) in µg/litre is related to the average daily dietary
intake (in µg mercury) as follows:
0.95 x 0.05 x d
C = f x d / b = ---------------- = 0.95 x d (equation 5)
0.01 days-1 x 5 litres
assuming that 0.95 of the intake is absorbed, that 0.05 of
the absorbed amount goes to the blood compartment, that
the blood volume is 5 litres, and that the elimination
constant is 0.01 days-1.
Sherlock et al. (1984) tested the validity of equation
1 by measuring blood mercury concentrations during a 100-
day period of methylmercury intake and a 100-day period
after intake ceased in 20 volunteers who consumed measured
daily amounts of methylmercury in fish. Close agreement
was found between predicted and observed values.
Equation 1 predicts that a steady state in which in-
take equals excretion will be attained in about 5 half-
times. Thus, in adult humans, the whole body would attain
a steady state in about one year (5 x 70 days = 350 days).
Thus, an important prediction of the single-compartment
model is that constant dietary exposure to methylmercury
for a period of several years should not result in any
greater accumulation than after one year of exposure.
Equation 4 predicts that the maximum amount accumu-
lated in the whole body of adult humans will be 100 times
the average daily intake. In fact, steady blood levels may
also be calculated from equations 2, 3, and 4, using the
kinetic parameters to the single-compartment model listed
in Table 7.
It is of interest to compare this predicted relation-
ship with those observed in field studies on populations
believed to have attained a steady state from long-term
dietary exposure to methylmercury in fish (Table 7). The
coefficients relating long-term dietary intake to steady-
state blood concentration are all lower than the predicted
value of 0.95 calculated in equation 5 above. The reasons
for this discrepancy are not yet fully understood. The
measurement of dietary intake in populations with uncon-
trolled intakes is liable to considerable error (Turner et
al., 1980). However, this would not explain the consist-
ently lower values from field studies. It is more likely
that these populations were not in true steady state,
since intake is frequently seasonal in fish-eating popu-
lations. The fact that close agreement is seen between
single-dose tracer studies, single-dose methylmercury in-
take from fish, extended controlled intake from fish, and
longitudinal hair analysis of individuals with very high
intakes lends support to the validity of the single-com-
partment model and the values of the kinetic parameters
listed in Table 8. Sherlock and Quinn (1988) presented a
more detailed discussion of the differences between con-
trolled and uncontrolled studies on the relationship
between blood concentration and intake of methylmercury.
Table 7. Relationship between steady-state blood concentrations and average daily intake of
methylmercury in fish consumers and predicted relationships from experimental data
---------------------------------------------------------------------------------------------
Number of Duration of Average mercury Steady-state blood Reference
subjects exposure intake (µg/day per concentration
70 kg body weight) (ug mercury/litre)
(x) (y)
---------------------------------------------------------------------------------------------
Observed relationship
32 years 0 - 800 y = 0.7x + 1 WHO (1976b)
165 years 0 - 400 y = 0.3x + 5 WHO (1976b)
20 years 0 - 800 y = 0.8x + 1 WHO (1976b)
725 years 0 - 800 y = 0.5x + 4 WHO (1976b)
22 years 0 - 800 y = 0.5x + 10 WHO (1976b)
Predicted relationship
15 1 dose tracer y = 1x WHO (1976b)
30 1 - 2 months 0 - 2340 y = 0.8x WHO (1976b)
5 1 dose 1400 y = 1x Kershaw et al. (1980)
20 100 days 0 - 230 y = 0.8x Sherlock et al. (1984)
---------------------------------------------------------------------------------------------
It should be emphasized that this model refers to the
"average" adult human with a body weight of 70 kg. The
gastrointestinal absorption rate for methylmercury is high
(about 95%) and is not known to vary with age, but the
energy intake varies greatly with age and this tends to
make children and teenagers more vulnerable to high in-
takes of methylmercury.
The one compartment model is a useful working model
for comparing blood or hair levels to daily intakes of
methylmercury. Clearly this model is only an approximation
to the more complex kinetics of mercury distribution and
metabolism. For example, determination of mercury in hair
and blood will not produce information concerning small
compartments in the body. Methylmercury is slowly trans-
formed to inorganic mercury, a process which is known to
follow multiphasic kinetics (Berlin, 1986).
6.6 Reference or Normal Levels in Indicator Media
Reference values in non-exposed populations for con-
centrations of total mercury in commonly used indicator
media are given in Table 9. The mean concentration in
whole blood is probably about 8 µg/litre, in hair about
2 µg/g, in urine 4 µg/litre, and in the placenta about
10 µg/g wet weight.
Table 8. Principal kinetic parameters in the single-compartment model for
methylmercury in adult human beings
----------------------------------------------------------------------------
Number Type of Dose Number Compartment Reference
of subject (µg of ----------------------------
subjects mercury doses Whole body Blood
/kg) ----------------------------
f T´ f T´
(days) (days)
----------------------------------------------------------------------------
3 adult tracer 1 0.95 72 - - WHO
(1976b)
15 adult tracer 0.94 76 0.07 50 WHO
(1976b)
5 adult 20 1 - - 0.05a 52 Kershaw
et al.
(1980)
5 adult 3.3 100 - - 0.05a 53 Sherlock
et al.
(1984)
5 adult 1.5 100 - - 0.055a 51 Sherlock
et al.
(1984)
4 adult 100 100 - - 0.057a 48 Sherlock
et al.
(1984)
5 adult 0.6 100 - - 0.064a 46 Sherlock
et al.
(1984)
----------------------------------------------------------------------------
a Calculations were made from concentrations in blood. The value of f
(fraction of dose which reached the compartment) was calculated assuming
blood volume of 5 litres in a 70-kg adult.
Table 9. Concentrations of mercury in indicator media in non-exposed populationsa
-----------------------------------------------------------------------------------------
Country Indicator No. of Mercury concentrationb Reference
media Subjects Mean Range
-----------------------------------------------------------------------------------------
Belgium placenta 474 15 1.1 - 103 Roels et al. (1978)c
whole blood 497 13d 0.1 - 47d Lauwerys et al. (1978)
Italy whole blood 80 20 0 - 46 Pallotti et al. (1979)
Japan maternal blood 11 6.6 2.0 - 16.4 Suzuki et al. (1984b)
umbilical blood 7 8.9 3.1 - 20.6 Suzuki et al. (1984b)
New Guinea hair 40 4.5 0.9 - 12.1 Suzuki et al. (1988)
Norway urine 103 4d 0.6 - 24d Lie et al. (1982)
Poland whole blood 270 11.3d 2.5 - 24d Szucki & Kurys (1982)
hair 505 2.2 0.02-10 Szucki & Kurys (1982)
Maternal hair
(scalp) 141 1.9 0.02 - 41 Sikorski et al. (1986)
(pubic) 141 1.0 ND-32 Sikorski et al. (1986)
Neonatal hair 141 0.11 ND-0.62 Sikorski et al. (1986)
Swedene hair 18 0.4 Ohlander et al. (1985)
hair 41 0.53 Forhammer et al. (1984)
United whole blood 88 8.8d,f 1.1 - 42d Sherlock et al. (1982)
Kingdom urine 77 2.4g ND - 8g Taylor & Marks (1973)
USA whole blood 210 8.1h 0 - 50h Gowdy et al. (1977)
whole blood 25 3.4 0 - 7i Kuhnert et al. (1981)
placenta 25 6.7j 0 - 13i Kuhnert et al. (1981)
Yugoslavia hair 34 1.5 0.4 - 3.3 Horvat et al. (1988b)
maternal blood 34 3.7d 1.2 - 9.6d Horvat et al. (1988b)
umbilical blood 34 7.7d 1.2 - 21d Horvat et al. (1988b)
placenta 34 13 2.8 - 37 Horvat et al. (1988b)
Northern hair 312 3.1 0 - 9 Airey (1983)
hemispherek
Northern hair 4603 2.3 0 - 5 Airey (1983)
hemisphere
Southern hair 1449 1.7 0.8 - 2.5 Airey (1983)
hemisphere
-----------------------------------------------------------------------------------------
a No known occupational exposure; fish consumption usually less than one meal per week.
b The units for mercury concentrations are: µg/kg for placenta, mg/kg for hair, and
µg/kg for blood and urine, unless otherwise stated. ND = not detectable.
c This reference contains data on levels published prior to 1976.
d µg/litre
e Pregnant women.
f Values are for adults
g µg/g creatinine
h Values after exclusion of 9 samples >50µg/kg as outliers; without the exclusion
the mean was 14.2 and range 0-298 µg/kg.
i Range estimated as twice the standard deviation.
j The placentae were perfused to remove blood before analysis.
k North of 22° latitude.
Additional data on levels in indicator media in dif-
ferent populations are given in the following references:
Belgium (Buchet et al., 1978), Canada (Galster, 1976;
Kershaw et al., 1980; Phelps et al., 1980; McKeown-Eyssen
& Ruedy, 1983a; McKeown-Eyssen et al., 1983; Valciukas et
al., 1986), Federal Republic of Germany (Lommel et al.,
1985), Finland (Mykkanen et al., 1986), Greenland (Hansen
et al., 1984), Iceland (Johannesson et al.,1981), Italy
(Capelli et al., 1986), the East Pacific area (Yamaguchi
et al., 1977), Japan (Suzuki et al., 1984a), New Guinea
(Kyle & Ghani, 1982a,b; 1983), New Zealand (Kjellstrom et
al., 1982), Seychelles (Matthews, 1983), Spain (Gonzalez
et al., 1985), and Sweden (Skerfving, 1974). Intake of
methylmercury is reflected in elevated levels in whole
blood and in erythrocytes (approximately 95% of blood
mercury is in the erythrocytes). Animal studies indicate
that, at non-toxic levels, blood methylmercury concen-
tration is a good index of brain mercury concentration
(Berlin, 1976).
Urine and blood concentrations correlate with mercury
vapour levels only after long-term exposures (Smith et
al., 1970). Blood levels rise and fall sharply during and
after short-term exposures (Cherian et al., 1978).
Hair levels may be increased as a result of direct
adsorption of mercury vapour onto the hair strands. Airey
(1983) reported that the average hair mercury levels in
the northern hemisphere are higher than in the southern
hemisphere (Table 9).
Long-term fish consumption determines almost com-
pletely the concentrations of methylmercury and, usually,
total mercury in blood. Thus, reference values must take
into account fish consumption. In communities with high
fish consumption rates, individuals with long-term intakes
of 200 µg mercury/day will have blood levels in the range
of 200 µg mercury/litre.
Hair concentrations of methylmercury are proportional
to blood concentrations at the time of formation of the
hair strand (Table 6). In general, the concentration in
hair is 250 times the simultaneous concentration in blood.
Once mercury is incorporated into a hair strand, that hair
mercury concentration remains unchanged. Thus, longitudi-
nal measurement of mercury in hair provides a recapitu-
lation of methylmercury levels in blood. Airey (1983)
presented a comprehensive evaluation of mercury levels in
hair. The author found that mean hair mercury concen-
trations corresponded to fish consumption patterns as
follows: once or less a month, 1.4 µg/g; once every 2
weeks, 1.9 µg/g; once a week, 2.5 µg/g; and once or
more a day, 11.6 µg/g. Owing to their higher-than-
average fish consumption, fisherman may have higher-than-
average methylmercury concentrations in their hair. For
example, in three Mediterranean countries, (Greece, Italy,
and Yugoslavia) 33% of 212 fishermen but only 0.33% of 918
other residents had methylmercury levels in hair above
10 µg/g (WHO/FAO/UNEP, 1989). These data support the
conclusion that long-term fish intake determines methyl-
mercury levels in hair and also in blood.
6.7 Reaction with Body Components
Information on the binding of methylmercury to tissue
ligands other than haemoglobin is sparse. Methylmercury is
believed to bind to cystinyl residues in the haemoglobin
molecule. The number and position of these residues in the
amino acid chains differ in haemoglobin from different
species (Doi & Kobayashi, 1982, Doi & Tagawa, 1983).
Methylmercury is complexed to glutathione (GHS) in both
human and animal erythrocytes (Naganuma et al., 1980).
The only known exception is rat erythrocytes where practi-
cally all methylmercury is bound to haemoglobin (Doi &
Tagawa, 1983). Methylmercury complexes may also be
involved in the urinary excretion of methylmercury (Mulder
& Kostyniak, 1985a,b). Animal data indicate that methyl-
mercury complexes also exist in brain tissue (Thomas &
Smith, 1979; Berlin et al., 1975), bile (Refsvik &
Norseth, 1975), liver (Omata et al., 1978), and probably
in kidney tissue (Richardson & Murphy, 1975). Complexes of
methylmercury with GHS and possibly other low molecular-
weight thiols play a role in blood transport and tissue
distribution (Hirayama, 1980; Thomas & Smith, 1982) and in
biliary secretion (Ballatori & Clarkson, 1985; Urano et
al., 1988). Glutathione-S-transferase (ligandin) may be
involved in the biliary secretion process (Refsvik,
1984a,b; Magos et al., 1985b), but evidence is still
equivocal (Gregus & Varga, 1985). The activity of hepatic
y -glutamyltransferase may also affect methylmercury
secretion in bile (Stein et al., 1988). According to in
vitro studies, the transport of methylmercury across cell
membranes appears to be a diffusional process involving an
unchanged complex of methylmercury chloride (Lakowicz &
Anderson, 1980; Bienvenue et al., 1984). However, the
relevance of these findings to in vivo transport across
membranes is not clear. Due to the high affinity of the
methylmercury cation for sulfhydryl groups, it is unlikely
that methylmercury chloride will be present in significant
amounts in plasma or other biological fluids. Amino acid
complexes may be involved in membrane transport of
methylmercury (Hirayama, 1980, 1985; Aschner & Clarkson,
1987; Watanabe et al., 1988).
The administration of selenium compounds to animals
protects against the toxic effects of methylmercury
(Ganther et al., 1972; Iwata et al., 1973). It alters the
tissue distribution and excretion of methylmercury
(Ganther, 1978, Prohaska & Ganther, 1977) and also the
inorganic-to-methyl mercury ratio in tissues (Komsta-
Szumska & Miller, 1984; Brzeznicka & Chmielnicka, 1985a).
In spite of the protective effect, selenite increases the
brain concentration of methylmercury (Magos & Webb, 1977;
Brzeznicka & Chmielnicka 1985b). The methylmercury cation
has a high affinity for selenides and diselenides (Sugiura
et al., 1978), the latter being formed by the reductive
metabolism of selenite (Hsieh & Ganther, 1975; Ganther,
1979). It has been reported that (CH3Hg)2Se can be
formed both in vitro and in vivo (Magos et al., 1979;
Naganuma & Imura, 1980; Masukawa et al., 1982). To what
extent the formation of this compound explains the altered
tissue distribution of methylmercury is not yet clear.
Selenium may also divert mercury from its endogenous
binding sites, but Thomas & Smith (1984) were not able to
find evidence for this. Maternal administration of
selenium to mice causes a specific alteration in the form
of selenium in fetal liver, as indicated by gel filtration
chromatography. This change was not found in maternal
liver or kidney or in the placenta (Nishikido et al.,
1988b).
7. EFFECTS ON ORGANISMS IN THE ENVIRONMENT
Data concerning the effects of methylmercury on organ-
isms in the environment are discussed in Environmental
Health Criteria 86: Mercury - Environmental Aspects (WHO,
1989a).
8. EFFECTS ON EXPERIMENTAL ANIMALS AND IN VITRO TEST SYSTEMS
Methylmercury is a systemic poison and, depending on
the dose and the length of exposure period, can affect
various organ systems and functions. However, in every
species the main target is the nervous system and one of
the earliest objective clinical signs is ataxia. The sig-
nificance of effects on animals is confounded by well-
established species differences in both the localization
of nervous system damage and in accompanying clinical and
pathological changes (Berlin, 1986). Another common target
is the fetus. As methylmercury is capable of corrosive
action, it can damage any tissue (skin, eye, upper part of
the digestive tract) if presented in sufficiently high
concentrations (WHO, 1976b).
8.1 Neurotoxicity and Nephrotoxicity
The effects of methylmercury given in a single lethal
dose is uncharacteristic. After intraperitoneal adminis-
tration, rats showed respiratory and vascular disorders
and hamsters became comatose (Hoskins & Hupp, 1978),
whereas after oral administration to pigs, central nervous
system depression, ending in coma, was preceded by diar-
rhoea and vomiting (Piper et al., 1971). Rats surviving
an LD50 dose showed general debilitation with weight
loss, but did not develop specific motorial changes, while
a squirrel monkey that had survived the severe acute
effects of a single dose (6.4 mg/kg) became uncoordinated
by 22 days and blind at 24 days (Hoskins and Hupp, 1978).
The cause of weight loss is anorexia. The anorexic
effect shows significant species differences. Anorexia
precedes the clinical signs of nervous system injury in
rodents treated daily with methylmercury (Magos, 1982).
In cats (Davies & Nielsen, 1977) and dogs (Davies et al.,
1977), anorexia and gait disorder ("bunny-hopping")
occur simultaneously. In the squirrel monkey only severe
methylmercury intoxication is associated with weight loss
(Evans et al., 1977).
Studies on the neurotoxicity of methylmercury were
reviewed by WHO (1976b). This review called attention to
species differences in blindness and the involvement of
peripheral nerves. Blindness may be caused in man,
monkeys, and pigs, but not in cats. In rats, the initial
damage appears in the dorsal root ganglions and associated
peripheral nerves, while in monkeys the cerebral cortex is
the first target. One of the most common lesions of the
central nervous system is in the granular layer of the
cerebellum. This type of damage has been observed in man
(Takeuchi & Eto, 1975) and also in rats, cats, hens
(Chang, 1977), dogs (Davies et al., 1977), calves
(Herigstad et al., 1972), guinea-pigs (Falk et al., 1974),
and rabbits (Jacobs et al., 1977), but not in pigs (Davies
et al., 1976) or monkeys (Chang, 1977; Mottet et al.,
1987). Female rats, which accumulate higher concentrations
of methylmercury in their brain than males, also develop
more severe cerebellar lesions (Magos et al., 1981).
These experimental studies (see also Mitsumori et al.,
1984 and Munro et al., 1980) confirmed clinical findings
in human beings of irreversible damage to the nervous
system. Other experimental studies carried out since the
publication of Environmental Health Criteria 1: Mercury
(WHO, 1976b), which focused on the mechanism of toxicity,
are reported in section 9.3.1.3.
Renal damage is one of the most frequently described
non-neural effect of methylmercury. This damage may be
caused by inorganic mercury split from methylmercury. In
rats, treatment with methylmercury caused renal damage
ranging from ultrastructural changes to the degeneration
of the distal convoluted tubules (see WHO, 1976b). Male
rats are more sensitive to the renotoxic effect of methyl-
mercury than females (Munro et al., 1980). Renal damage
was also observed in other experimental species. In most
of the dogs that showed clinical and histological signs of
methylmercury-induced neurotoxicity, there were also signs
of renal necrosis, desquamation, and regeneration (Davies
et al., 1977). In the kidneys of methylmercury-intoxicated
guinea-pigs, only swelled epithelial cells in the proximal
tubules were reported (Falk et al., 1974). In cats (Davies
& Nielsen, 1977) and pigs (Davies et al., 1976), only
hyalin and cellular casts were seen. Though treatment of
six monkeys ( Macaca mulatta ) with daily doses of methyl-
mercury (80-120 µg mercury/kg in apple juice) for 3.5-12
months did not affect the general health status adversely,
it caused ultrastructural changes in the kidneys (Chen et
al., 1983). These changes included intracytoplasmic vacu-
oles and electron-dense inclusion bodies. In the same
studies, degenerative changes in the Paneth cells of
intestines were also observed. These changes were most
pronounced in animals killed immediately after exposure
(see also Mottet et al., 1987).
8.2 Reproduction, Embryotoxicity, and Teratogenicity
Methylmercury added in vitro to a suspension of sperm
from untreated monkeys ( Macaca fasicularis ) at 9-15 µg/ml
decreased sperm motility but did not decrease oxygen con-
sumption (Mohamed et al. 1986a,b). In fact, oxygen con-
sumption was increased at the 15 µg/ml concentration when
sperm motility was almost zero. Further studies with
specific inhibitors revealed that mitochondrial energy
production was not affected by mercury. The authors
suggested that the primary effect was on the dynein/micro-
tubule sliding assembly.
Lee & Dixon (1975) reported damage to spermatogenesis
in mice given a methylmercury dose of 1 mg mercury/kg,
much lower doses giving rise to neurological effects. No
special susceptibility to sterility, resulting from pre-
natal exposure, could be detected in mice (Gates et al.,
1986).
When female mice were given a single intraperitoneal
injection of methylmercury chloride (2.5, 5, or 7.5 mg/kg
body weight) prior to mating, dose-related increases in
pre- and early post-implantation fetal losses were
recorded (Verschaeve & Leonard, 1984). This observation
could have a genetic cause or result from physiological
effects on the mother.
Gunderson et al. (1986) treated 11 monkeys ( Macaca
fasicularis ) with daily oral doses of methylmercury in
apple juice (50-70 µg/kg per day) before and during preg-
nancy. The mean blood levels during pregnancy, measured in
each trimester and at delivery, were within the range of
1080-1330 µg/litre, with maximum values within the range
of 1510-1840 µg/litre. The mean blood levels of the
offspring at birth were 1690 µg/litre (range, 880-
2460 µg/litre). When tested 190 days post-conception, the
mean blood levels had fallen to 1040 µg/litre. The ex-
posed animals showed recognition deficits (compared with
10 untreated controls) when administered an adaptation of
a standardized test of visual recognition memory. The same
blood mercury concentration (600-2000 µg/litre) in preg-
nant squirrel monkeys exposed to methylmercury resulted in
a 22.5% (mean of six results) reduction in the cerebral
weight of fetuses (Logdberg et al, 1988). Three months
treatment with daily oral doses of methylmercuric hydrox-
ide (50 or 90 µg/kg) increased the frequency of repro-
ductive failure (i.e., non-conception, abortion) in non-
human primates and decreased the birth weight of their
offspring (Burbacher et al., 1984). Offspring from treated
animals directed significantly less attention to novel
stimuli than did controls.
At doses which are not toxic to the rat dam, prenatal
exposure produced hydrocephalus, decreased thickness of
the cerebral cortex in the parietal section, increased
thickness of the hippocampus in the occipital region
(Kutscher et al., l985), and delayed ossification
(Chmielnicka et al., 1985). A variety of structural
changes, detectable at both the light and electron micro-
scopic levels, were also observed by Reuhl et al.,
(1981a,b). Similar effects have been noted in prenatally
exposed mice where the development of communicating
hydrocephalus was associated causally with aqueductal
stenosis (Choi et al., 1988).
Prenatal exposure at doses not affecting the mother is
known to produce abnormal behaviour in the offspring of
several animal species (Spyker et al., 1972; Bornhausen et
al., 1980; Zimmer et al., 1980; Shimai & Satoh, 1985;
Elsner et al., 1988). The behavioural effects may be the
consequence of an effect on neurotransmitters in the
brain. Thus a single dose of 5.0 mg mercury/kg, given as
methylmercury on postnatal day 2, resulted in increased
serotonin concentration and movement and postural dis-
orders by day 22-24 (O'Kusky et al., 1988). In addition,
Bartolome et al. (1982) showed both acute and long-lasting
effects on the maturation of central catecholamine neuro-
transmitter systems following early postnatal exposure.
Eccles & Annau (1982a,b) demonstrated altered behavioural
sensitivity to amphetamine in adult offspring, and Cuomo
et al. (1984) showed alterations in response to apomorph-
ine.
Prenatal exposure of rodents can produce a variety of
effects on non-nervous tissues. It is well known that the
administration of large doses of methylmercury to pregnant
rodents produces cleft palate (e.g., Lee et al., 1979;
Harper et al., 1981). Prenatal exposure of rats can pro-
duce renal functional abnormalities detectable in off-
spring at 42 days of age (Smith et al., 1983; Slotkin et
al. 1986).
8.3 Mutagenicity and Related End-Points
Methylmercury is capable of causing chromosome damage
in cell cultures (Morimoto et al., 1982; Curle et al.,
1983), in the golden hamster (Watanabe et al., 1982;
Gilbert et al., l983), and in ovulating Syrian hamsters
(Mailhes, 1983). It can induce histone protein pertur-
bations (Gruenwedel & Diaham, 1982) and influence factors
regulating the nucleolus-organizing activity (Verschaeve
et al., 1983). The mutagenic response of V79 Chinese ham-
ster cells to methylnitrosourea is enhanced by methylmer-
cury (Onfelt & Jenssen, 1982). Methylmercury has been
reported to interfere with gene expression in in vitro
cultures of glioma cells at low concentrations (0.05-
0.1 µmol/litre) (Ramanujam & Prasad, 1979). The induc-
tion of non-disjunction and sex-linked recessive lethal
mutations was found in Drosophila melanogaster treated
with methylmercury. Tolerance to methylmercury was corre-
lated with the uptake of mercury and not with the rate of
excretion (Magnusson & Ramel, 1986).
8.4 Carcinogenicity
Methylmercury has been reported to produce renal car-
cinomas in mice given diets containing methylmercury
chloride (15 mg/kg) for about one year (Mitsumori et al.,
1981). Animals given 30 mg/kg died from neurotoxicity
after 6 months. Nixon et al. (1979) found that prenatal
exposure to methylmercury increased the incidence in rats
of neural tumours caused by sodium nitrite and ethylurea.
The mothers had been exposed since weaning to 10 mg
methylmercury/kg diet. These are the only reports of
potential carcinogenicity. Blakley (1984) administered
methylmercury chloride to Swiss mice (0.2, 0.5, or 2
mg/litre drinking-water) for 15 weeks and gave them a
single dose (1.5 mg/kg) of urethane by intraperitoneal
injection at the end of the third week. Methylmercury
produced a dose-related increase in the size of lung aden-
omas induced by urethane. However, only the highest dose
(2 mg/kg) increased the incidence of adenomas. No effects
on weight gain or water consumption related to methylmer-
cury treatment were seen.
8.5 Special Studies
Kato et al. (1981) reported that the detection of
electro-oculographic changes in monkeys is one of the most
sensitive indices of methylmercury effects. Using high
doses of methylmercury, Wassick & Yonovitz (1985) demon-
strated auditory deficits over a 4- to 78-kHz frequency
range in mice. Methylmercury is known to affect auditory
performance in human beings (section 9.1).
Methylmercury has been found to depress both primary
and secondary immune responses in rodents (Koller & Roan,
1980; Koller et al., 1980). Other effects reported in ani-
mal studies include impairment of adrenal and testicular
function in rats (Burton & Meikle, 1980), impairment of
thyroid function in mice (Kawada et al., 1980), and im-
pairment of sleep-walking rhythms in rats (Arito et al.,
1983). Effects of methylmercury on glucose transport,
glucose metabolism, and blood flow in the central nervous
system were described by Hargreaves et al. (1986).
Long-term treatment of Brown-Norway rats produces
proteinuria (Bernaudin et al., 1981). This strain is
genetically susceptible to immune-mediated renal damage
produced by inorganic mercury.
8.6 Factors Modifying Toxicity; Toxicity of Metabolites
Several substances have been found to affect the
chronic toxicity of methylmercury. Of these, selenium,
usually administered to animals as sodium selenite, has
been the most widely studied, following the first report
by Ganther et al. (1972). In general, selenium has a
protective action in that it delays the onset of
methylmercury toxicity or reduces the severity of its
effects (Chang & Suber, 1982). Simultaneous administration
of sodium selenite to mice during pregnancy was found to
protect the offspring from effects on developmental
reflexes caused by a 6 mg/kg dose of methylmercury given
on day 9 (Satoh et al., 1985). In mice given selenium
(11.6 nmol/ml in the drinking-water) before and after
gestation, the incidence of methylmercury-induced resorp-
tion was increased. The incidence of cleft palate in mice
was not affected by excess selenium (Nobunaga et al.,
1979) nor by selenium deficiency (Nishikido et al.,
1988a), but selenium deficiency enhanced the fetal tox-
icity of methylmercury (Nishikido et al., 1987).
Another antioxidant, vitamin E, has also been found
to be protective against methylmercury toxicity in both
normal and selenium-deficient rats (Chang et al., 1978;
Welsh, 1979). The antioxidant N,N'-diphenyl-p-phenyly-
lenediamine, however, was more protective than vitamin E.
The latter also protected against the in vitro damage
caused by methylmercury to chromosomes in human blood
cells (Morimoto et al., 1982), hamster fibroblast cells
(Gilbert et al., 1983), and glioma cells (Prasad &
Ramanujam, 1980). Phospholipids have been reported to
protect against the in vitro action of methylmercury on
rat liver enzymes (Magnaval & Batti, 1980). The signifi-
cance of these findings to human health is not clear, as
high doses were used and methylmercury poisoning in
rodents may not be the same as in human beings. Moreover
selenite only delays the onset of methylmercury intoxi-
cation (Chang & Suber, 1982) and is not the form of
selenium found in human diets. Though selenium in marine
food may have the same protective action as selenite
(Newberne et al., 1972; Ohi et al., 1980; Thrower &
Andrewartha, 1981), the bioavailability of biological
selenium for reaction with mercury is less than that of
selenite (Magos et al., 1984) and its potential, free from
other dietary effects, to delay the onset of methylmercury
intoxication has not been proved.
Ethanol has been found to potentiate the effects of
methylmercury in rats (Turner et al., 1981). This single
finding should be investigated further, preferentially in
primates, as it could have considerable public health sig-
nificance.
Yamini & Sleight (1984) found that guinea-pigs on a
diet deficient in vitamin C suffered more severe neuro-
logical damage when exposed to 44 mg methylmercury/kg in
their diet for 20 days than controls fed a diet with
adequate vitamin C.
It has been postulated that methylmercury might pro-
duce its effects via cleavage of the mercury-carbon bond
(Ganther, 1978). This could produce free radicals, causing
lipid peroxidation. This might explain the protective
action of vitamin E and selenium. Inorganic mercury
released from methylmercury might be the actual toxic
species. However ethylmercury, which decomposes faster and
raises inorganic mercury concentration in the brain to a
higher level than does methylmercury, produces less brain
damage at equal doses (Magos et al., 1985a).
9. EFFECTS ON MAN
9.1 General Population Exposure
The effects of methylmercury on the adult differ both
quantitatively and qualitatively from effects seen after
prenatal and, possibly, postnatal exposure. Thus, effects
on adults will be treated separately from effects on
developing tissues.
9.1.1 Effects on adults
The effects of methylmercury on adult human beings
have been thoroughly described in Environmental Health
Criteria 1: Mercury (WHO, 1976b). They will be summarized
here with relevant new material added as appropriate.
9.1.1.1 Effects on the nervous system
The nervous system is the principal target tissue for
the effects of methylmercury on adult human beings. The
sensory, visual, and auditory functions, together with
those of the brain areas, especially the cerebellum, con-
cerned with coordination, are the most common functions to
be affected. The earliest effects are non-specific symp-
toms, such as complaints of paraesthesia, malaise, and
blurred vision. Subsequently, signs appear such as concen-
tric constriction of the visual field, deafness, dysar-
thria, and ataxia. In the worst cases, the patient may go
into a coma and ultimately die. In less severe cases, some
degree of recovery in each symptom occurs; this is
believed to be a functional recovery that depends on the
compensatory function of the central nervous system. The
subjective complaint of paraesthesia was found to be a
permanent symptom in patients exposed in the Japanese
outbreak, whereas in the Iraqi outbreak, paraesthesia was
transient in many cases. The reason for this difference
is not known.
At high doses, methylmercury affects the peripheral
nervous system (Rustam et al., 1975). In Iraq, patients
had symptoms of neuromuscular weakness that could be
ameliorated by treatment with acetylcholinesterase inhibi-
tors.
Methylmercury poisoning has several important fea-
tures:
- a long latent period usually lasting several months;
- damage almost exclusively limited to the nervous sys-
tem, especially the central nervous system;
- areas of damage to the brain are highly localized
(focal), e.g., in the visual cortex and the granular
layer of the cerebellum, especially in the infolded
regions (sulci);
- effects in severe cases are irreversible due to de-
struction of neuronal cells;
- the earliest effects are non-specific subjective com-
plaints, such as paraesthesia, blurred vision, and
malaise.
9.1.1.2 Effects on non-nervous tissue
The only effect on human beings not involving the ner-
vous system is the claim that chromosome damage is associ-
ated with long-term exposure to methylmercury (Wulf et
al., 1986). No further reports have appeared on this sub-
ject since the review in Environmental Health Criteria 1:
Mercury (WHO, 1976b).
9.1.2 Effects on developing tissues
9.1.2.1 Effects on the nervous system
Observations on both human subjects and animals indi-
cate that the developing central nervous system is more
sensitive to damage from methylmercury than the adult ner-
vous system. The first indications arose from the outbreak
of methylmercury poisoning in Minamata, Japan, in the
1950s, when it was found that mothers who were slightly
poisoned gave birth to infants with severe cerebral palsy.
Subsequent studies on experimental animals confirmed the
increased sensitivity of the fetus. The Iraqi outbreak in
1971-1972 resulted in cases of severe damage to the cen-
tral nervous system in infants prenatally exposed. More
recent follow-up studies in Iraq indicated a milder syn-
drome at lower dose levels (Marsh et al., 1980). In fact,
it has been possible to demonstrate a relationship between
the maximum hair level in the mothers during pregnancy
and the frequency of abnormalities in their infants (Marsh
et al., 1981).
The clinical picture is dose dependent. In those in-
fants who have been exposed to high maternal blood levels
of methylmercury, the picture is of cerebral palsy indis-
tinguishable from that caused by other factors. Microceph-
aly, hyperreflexia, and gross motor and mental impairment,
sometimes associated with blindness or deafness, is the
main pattern (for review, see WHO, 1976b). Milder degrees
of the affliction are not easy to diagnose during the
first few months of life, but they later become clear.
Patients show mainly psychomotor impairment and persist-
ence of pathological reflexes (Marsh et al., 1977, 1980,
1981; McKeown-Eyssen et al., 1983). Milder cases have
findings quite similar to the findings in the minimal
brain damage syndrome.
Post-mortem observations in Japan indicated that
damage is generalized throughout the brain in the case of
prenatal exposure, in contrast to adult exposure where
focal lesions are predominant. The Japanese cases of pre-
natal poisoning indicated disturbed development in the
cytoarchitecture of the brain and the brain size was dim-
inished in severe cases. Similar pathological findings
were reported on autopsies of two prenatally exposed Iraqi
infants (Choi et al., 1978). The pathological findings in
these studies were attributed to incomplete and abnormal
migration of neuronal cells to the cerebellar and cerebral
cortices (section 9.3.2).
9.2 Occupational Exposure
This type of exposure was reviewed in Environmental
Health Criteria 1: Mercury (WHO, 1976b). No new infor-
mation has become available. In fact, occupational ex-
posure results in effects similar to those reviewed in
section 9.1 (e.g., Hunter & Russell, 1954).
9.3 Mechanisms of Toxicity
Section 9 is concerned with effects on human beings.
However, in discussing mechanisms of methylmercury tox-
icity, animal and other experimental data are used where
they throw light on how damage is inflicted on the human
organism.
9.3.1 The mature organism
9.3.1.1 Mechanism of selective damage
The mechanism of selective damage is not well under-
stood. In a review of publications, Syversen (1982)
claimed that the selective effects relate to the ability
of certain cells in the central nervous system to repair
the damage initially inflicted by methylmercury. Thus,
those cells capable of repairing injury survive, whereas
those cells that lack the facility to repair the damage
are the ones that are destroyed. For example, the small
granule cells in the cerebellum lack the repair capacity
and are the first cells in that area of the brain to
succumb. Jacobs et al. (1977) noted that the small neurons
in the central nervous system appear to be especially vul-
nerable. Such cells have very little cytoplasm and only
limited protein synthetic machinery to carry out repair.
On the other hand, Berlin (1986) has proposed that selec-
tive damage results from the inter-neuronal axonal trans-
port of methylmercury. Thus, the sensory centres, e.g., in
the visual cortex, are affected because axonal transport
is in the afferent direction leading to a local accumu-
lation of methylmercury. The motor systems are relatively
unaffected by methylmercury because axonal transport is
in the efferent direction leading to removal of mercury
from the motor areas.
9.3.1.2 The latent period
The reason for the long latent period is not under-
stood. The mean latent period ranged from 16 to 38 days
in Iraq, and, in many cases, initial symptoms appeared
after the cessation of intake of contaminated bread. In
the Japanese outbreaks, it was difficult to determine the
exact latent period because in many cases the starting
point of intake was unclear. However, in some cases in
Japan, a very long latent period (up to several years) was
reported (WHO, 1980). Included in these cases were some
patients who showed only slight signs and symptoms but who
later developed the clinical features of severe poisoning
after they had stopped eating the polluted fish. In the
same period of time, the other patients showed relative
improvement or progression. A latent period of several
years may be partially explained by psychogenic overlay,
which modifies the symptoms, or by sub-clinical lesions,
which may be revealed by the aging factor. However, slow
accumulation in the brain of methylmercury (or of inor-
ganic mercury split off from the methylmercury) cannot be
the explanation.
9.3.1.3 Cellular and molecular mechanisms
Since the publication of Environmental Health Criteria
1: Mercury (WHO, 1976b), numerous studies on the mechanism
of action at the cellular and molecular levels have been
reported (Clarkson, 1983; Berlin, 1986). Inhibition of
protein synthesis in target nerve cells is a well docu-
mented effect in animals that appears before the first
clinical signs of intoxication (Yoshino et al., 1966;
Carmichael et al., 1975; Omata et al., 1980, 1982;
Syversen, 1982; Fair et al., 1987). It occurs also in
vitro before other cellular functions are affected (Nakada
et al., 1980; Sarafian et al., 1984).
Verity and his colleagues (Cheung & Verity, 1985;
Sarafian & Verity, 1985, 1986) have identified the step in
protein synthesis that is most sensitive to methylmercury.
The peptide-elongation process can be affected at high
levels of methylmercury, but the first stage of synthesis,
associated with transfer RNA, may be the most sensitive.
It appears that the inhibition of protein synthesis is
general; there is no selective inhibition of formation of
any special proteins or group of proteins.
The reason for the special sensitivity of protein
synthesis to methylmercury is not known. Jacobs et al.
(1977) noted that the mammalian ribosome contains 120
sulfhydryl groups, of which about half are exposed and
reactive during peptide formation, and that the chain-
initiation factor is strongly inhibited by sulfhydryl
reagents, at least in the case of bacteria. They suggested
that the sulfhydryl groups of active ribosomes are more
vulnerable than those in other proteins, where disulfide
bridge formation may predominate. Methylmercury also
interferes with lipids (Nakada & Imura, 1983; Ando et al.,
1985), myelin (Ganser & Kirschner, 1985), mitochondrial
DNA synthesis (Miller et al., 1985), and glutathione per-
oxidase (Hirota et al., 1980).
Effects on neurotransmitters and receptors (Kobayashi
et al., 1979, 1981; Concas et al., 1983), lipids
(Macfarlane, 1981; Rebel et al., 1983; Leblanc et al.,
1984), adenyl cyclase activity (Spuhler & Prasad, 1980),
membrane structure (Kasuya, 1980), and on the integrity of
microtubules have been reported in a variety of experimen-
tal systems (Araki et al., 1981; Nakada & Imura, 1982;
Sager et al., 1981a,b). Methylmercury inhibits amino acid
transport in rat brain microvessels at concentrations
similar to those known to cause toxicity in humans
(Tayarani et al., 1988). Changes in glucose transport
across the blood-brain barrier in rats have been observed
in the latent period before overt signs of methylmercury
intoxication appear (Hargreaves et al., 1986). When given
systemically, methylmercury accelerates axonal transport
of proteins in the optic nerve (Aschner, 1986). However,
when it is given by intra-ocular injection, methylmercury
inhibits protein transport along the optic nerve (Aschner
et al., 1986). The relevance of the above findings to the
pathogenesis of methylmercury poisoning is still a matter
of speculation.
Perhaps more firmly established is the connection be-
tween muscular weakness seen in severe cases of poisoning
in the Iraqi outbreak and the inhibition of acetylcholine
transmission at the neuromuscular junction (Von Burg &
Landry, 1976; Shamoo et al., 1976; Atchison & Narahashi,
1982; Quandt et al., 1982; Atchison, 1986). The stimu-
latory action of methylmercury on the miniature endplate
potentials of the neuromuscular junction appears to result
from the loss of calcium ions from the nerve terminal
mitochondria (Levesque & Atchison, 1988).
9.3.2 Developing tissues
Post-mortem observations derived from the Japanese and
Iraqi outbreaks suggested that the severe prenatal effects
seen resulted from incomplete and abnormal migration of
neuronal cells to the cerebellar and cerebral cortices. In
support of their autopsy findings indicating abnormal
neuronal migration, Choi et al. (1979) noted that methyl-
mercury inhibited the in vitro migration and movement of
cultured human cells. Changes in astrocyte membranes and
in motility were also observed in cultures when methylmer-
cury was added (Choi & Lapham, 1980). The ability of
methylmercury to damage astrocytes in vitro was confirmed
by findings of decreased DNA synthesis (Choi et al., 1980;
Choi & Kim, 1984). The toxic effect on astrocytes may be
relevant to the pathological picture, since these cells
are believed to play a role in supporting normal neuronal
migration in the developing brain (Choi & Lapham, 1976).
More recently, Peckham & Choi (1986) showed that methyl-
mercury alters the anionic surface charge on cultured
fetal mouse astrocytes. Cell-to-cell recognition processes
were found to be affected in aggregates of mouse cerebel-
lar cells (Jacobs et al., 1986). The authors suggested
that the mechanism involved depressed synthesis of
specific proteins followed by alterations in microtu-
bules.
A second general mechanism by which brain development
could be impaired is the inhibition of cell division (Chen
et al., 1979; Sager et al., 1982, 1983; Rodier et al.,
1984; Slotkin et al., 1985; Howard & Mottet, 1986; Vogel
et al., 1986). Inhibition of cell proliferation probably
explains the production of cleft palates in rats (Lee et
al., 1979; Olson & Massaro, 1980), although this effect
has not been seen in humans. Methylmercury is known to
inhibit cell division by causing metaphase arrest, similar
to that observed with colchicine, presumably by disruption
of the mitotic spindle (Onfelt, 1983). Both spindle micro-
tubules (Miura et al., 1978) and cytoplasmic microtubules
in cultured rat glioma cells (Imura et al., 1980; Miura &
Imura, 1987) and human fibroblasts (Sager et al., 1983)
are disrupted by methylmercury. Damage to the microtubule
system appears to underly the toxic effects of methylmer-
cury on lymphocytes (Brown et al., 1988). Sager & Matheson
(1988) have shown that disassembly of microtubules pre-
cedes changes in other elements. In vitro polymerization
of microtubules is also inhibited by methylmercury (Abe et
al., 1975; Imura et al., 1980; Sager et al., 1983; De
Saint-Georges et al., 1984; Miura et al., 1984). The
effect on microtubules appears to be selective and does
not involve other components of the cytoskeleton (e.g.,
vimentin or actin filaments) (Sager, 1988). Vogel et al.
(1985) suggested that methylmercury binds to free sulf-
hydryl groups on the ends and on the surface of microtu-
bules.
Sager et al. (1982, 1984) hypothesized that methylmer-
cury might arrest the division of immature neurons at
critical stages of brain development. They administered
methylmercury to newborn mice at a time when the external
granule layer (EGL) of the cerebellar cortex was rapidly
dividing. They found fewer granule cells in the treated
animals as well as a decrease in the percentage of late
mitotic figures. This incomplete mitosis may have been
responsible for the decreased cell numbers.
Destruction or arrest of neuron growth during the
development of the central nervous system may be an im-
portant general mechanism in the pathobiology of prenatal
damage (Rodier, 1977). The deranged cell migration
reported by Choi et al. (1978) and the arrested cell div-
ision found by Sager et al. (1984) might both be an
expression of the action of methylmercury on microtubules
and thus be consistent with the hypothesis that microtu-
bule protein is an important molecular target for methyl-
mercury in the developing brain.
Enzymes associated with myelin formation have been
found to be affected in the early postnatal period in rats
(Grundt & Neskovic, 1985). Morphological de-differen-
tiation of cultured brain cells has been shown to occur
after addition of methylmercury (Grundt et al., 1981,
1982). These effects occur at lower methylmercury levels
than those affecting energy metabolism (Grundt & Bakken,
1986).
Choi et al. (1981) noted incomplete arborization of
the dendritic tree of Purkinje cells in mice dosed with
methylmercury in the early postnatal period.
9.3.3 Summary
In summary, the clinical and epidemiological evidence
indicates that prenatal life is more sensitive to the toxic
effects of methylmercury than is adult life. The inhibition of
protein synthesis is one of the earliest detectable biochemical
effects in the adult brain, though the sequence of events
leading to overt damage is not yet understood. Methylmercury
can also react directly with important receptors in the nervous
system, as shown by its effect on the acetylcholine receptor in
the peripheral nerves. Concerning prenatal exposure, the
effects of methylmercury seem to be quite different and of a
much more general basic nature. It affects normal neuronal
development and leads to altered brain architecture, hetero-
topic cells, and decreased brain size. Methylmercury may also
be exerting an effect, perhaps through inhibition of the micro-
tubular system, on cell division during critical stages of
formation of the central nervous system.
9.4 Dose-Effect and Dose-Response Relationships in Human Beings
The relationships between concentrations in indicator
media (e.g., blood and hair) or body burdens and the mag-
nitude of an effect or frequency of an effect (response)
were discussed in Environmental Health Criteria 1: Mercury
(WHO, 1976b) using data from the Japanese and Iraqi out-
breaks. They will be summarized here and considered in
conjunction with studies reported subsequently. Other
extensive and detailed reviews have been published since
1976 (Tsubaki & Irukayama, 1977; Inskip & Piotrowski,
1985; Tsubaki & Takahashi, 1986).
Prenatal and adult exposures will be treated separ-
ately in view of the differences, both qualitative and
quantitative, in effects and dose-response relationships.
9.4.1 Adult exposure
This section will examine new data published since
1976 and include a re-analysis of samples of hair, brain,
and other tissues obtained from patients in Minamata and
Niigata, Japan, the clinical follow-up of individuals
exposed to methylmercury in Niigata, a new analysis of the
Iraqi data, and reports on high fish consumers in Canada
and elsewhere.
9.4.1.1 The Minamata and Niigata outbreaks
Many of the original samples collected in Minamata and
Niigata, Japan, had been analysed by the dithizone pro-
cedure. Previous risk estimates were based on blood and
hair mercury levels measured by this procedure. Tsubaki
et al. (1978) reported on the repeat analysis of a hair
sample from the patient in Niigata with the lowest hair
mercury concentration at the onset of symptoms
(52 µg/g). Re-analysis by atomic absorption yielded a
value of 82.6 µg/g. Other hair samples collected from
Niigata yielded values of about 100 µg/g for the onset of
symptoms. As for blood samples, none were available for
re-analysis by atomic absorption. The patient with the
lowest blood level had a concentration of just below
200 µg/litre when extrapolated to time of onset of
symptoms. However, the extrapolation used in Environmental
Health Criteria 1: Mercury (WHO, 1976b) was based on a few
points only, and the statistical uncertainty in the
extrapolated value was high. Furthermore, the hair samples
from the same patient indicated that the blood concen-
tration was probably higher. Other blood samples extrapo-
lated to values above 300 µg/litre. Further evidence by
Tsubaki et al. (1978) indicates that hair and blood mer-
cury levels at the onset of symptoms may not have been the
true maximum values in these patients. Analyses of hair
samples from Niigata indicate that the mercury concen-
trations may have attained peak values about 2 months
before the onset of symptoms. A stringent government
warning against the consumption of contaminated fish was
issued by June 1965; in many patients, symptoms appeared
about 2 months later (WHO, 1980).
Such evidence indicates that previous evaluations of
the earlier data from Niigata may have underestimated the
blood and hair concentrations associated with poisoning in
the most sensitive patient and, therefore, overestimated
the risk of poisoning. However, it should be noted that
the atomic absorption method does need not always yield
higher results than the dithizone method. Tsubaki et al.
(1978) quote data from two hair samples in which agreement
between the two results was excellent. Furthermore, the
brain and other tissues were preserved for many years
before the atomic absorption measurements were made
(1973), whereas the dithizone method was used on fresh
tissue (1956-1960).
Information from the clinical follow-up from Niigata
(Tsubaki & Irukayama, 1977; Tsubaki et al., 1978) suggests
that there may be a latent period of several years between
peak mercury concentrations and onset of symptoms. Such a
latent period was reported in four patients whose maximum
hair concentrations were in the range of 50-300 mg/kg, as
measured by atomic absorption (Tsubaki et al., 1978). The
results of studies on primates indicate latent periods of
up to 1 year under conditions of continuous exposure.
These latent periods are apparently dose dependent in ani-
mals (Evans et al., 1977). A relationship between length
of latent period and maximum hair concentrations was not
apparent in the few Niigata cases. The delayed cases were
mild, showing non-specific symptoms, so that cases of
methylmercury poisoning could not be diagnosed with com-
plete certainty. Follow-up studies examining mortality
patterns in the Minamata population, including both
poisoning cases and controls, did not reveal any clear
pattern of mercury-related deaths (Tamashiro et al., 1984,
1986, 1987).
9.4.1.2 The Iraqi outbreak
This outbreak of mass poisoning took place in the
winter of 1971-1972 (Bakir et al., 1973; Kazantzis et al.,
1976a,b; Al-Mufti et al., 1976; Greenwood, 1985). Seed
grain treated with a methylmercury fungicide was used to
prepare homemade bread in rural communities throughout the
country. Consumption probably began in October-November,
1971, and the first cases of severe poisoning were admit-
ted to hospital at the end of December, 1971. Total hospi-
tal admissions rose to just over 6000, with most of these
occurring in January, 1972. Over 400 deaths attributed to
methylmercury were recorded in hospital. Both sexes and
all ages were affected. Individual exposure ranged from
a low non-toxic intake (when a few contaminated loaves
were consumed) to prolonged daily intake (1-2 months),
which in some cases produced severe signs of poisoning.
The first effects were complaints of paraesthesia or
malaise, followed by signs of ataxia, constriction of
visual fields, and hearing loss. Some people experienced
muscular weakness, which improved after treatment with an
acetylcholinesterase inhibitor. Changes in peripheral
nerve velocity were recorded in some severe cases. How-
ever, most of the signs and symptoms were attributed to
damage to the central nervous system. Effects on non-
nervous tissue appeared to be absent or negligible.
Early in the outbreak, it was noted that some pre-
natally exposed infants showed signs of severe cerebral
palsy similar to the cases reported in the Minamata out-
break (Amin-Zaki et al., 1974). Later, more subtle effects
on the developing nervous system were detected (Marsh et
al., 1980). Fig. 2, reproduced from Environmental Health
Criteria 1: Mercury (WHO, 1976b), demonstrates both dose-
effect and dose-response relationships. For any given sign
or symptom, e.g., paraesthesia, there is a background
frequency indicated by the line parallel to the horizontal
axis. Two scales are given for the horizontal axis because
two different methods were used to estimate the maximum
body burden. At higher values of the body burden, the
frequency of response rises in proportion to the logarithm
of the body burden (the horizontal axis has a logarithmic
scale). The two lines (the horizontal and sloped line)
form the shape of a "hockey stick", and this type of
dose-response analysis is referred to by this name.
The body burden corresponding to the point of inter-
section of the two lines in the "hockey stick" was
referred to as a "practical threshold" by the authors
(Bakir et al., 1973). This threshold increases with
increasing severity of the effects. Thus, using the upper
scale in Fig. 2, the threshold for paraesthesia occurs at
a body burden of about 25 mg, for ataxia at about 50 mg,
for dysarthria at about 90 mg, for hearing loss at about
180 mg, and for death at over 200 mg.
The dose-response relationship is illustrated by the
"hockey-stick" line for each sign and symptom. Thus, the
increase in frequency of paraesthesia increases in pro-
portion to the log of the maximum body burden above the
practical threshold. This increase is assumed to be caused
by methylmercury. In fact, the only proof that methylmer-
cury produced certain effects in this population is that:
(a) these effects followed a known high exposure to
methylmercury; (b) the frequency and severity of these
effects increased with increasing exposure to methylmer-
cury; (c) these effects are similar to those seen in other
outbreaks of methylmercury poisoning; and (d) the major
signs have been reproduced in some animal models.
The total man-made global release to the atmosphere
has been estimated to be 2000-3000 tonnes/year (Lindberg
et al., 1987; Pacyna, 1987). It should be stressed that
there are considerable uncertainties in the estimated
fluxes of mercury in the environment and in its
speciation. Concentrations in the unpolluted atmosphere
and in natural bodies of water are so low as to be near
the limit of detection of current analytical methods, even
for the determination of total mercury.
Anthropogenic releases of mercury into confined areas
can be the source of high toxicity risk even though these
releases may be small relative to global emissions. The
point is relevant to the contamination of Minamata Bay and
the Agano River in Niigata, Japan, as well as to inadver-
tent poisoning via contaminated bread in Iraq.
3.3 Uses
A major use of mercury is as a cathode in the elec-
trolysis of sodium chloride solution to produce caustic
soda and chlorine gas. Quantities of the order of 10
tonnes of liquid metal are used in each manufacturing
plant. In most industrialized nations, stringent pro-
cedures have been taken to reduce losses of mercury. Mer-
cury is widely used in the electrical industry (lamps, arc
rectifiers, and mercury battery cells), in control instru-
ments in the home and industry (switches, thermostats,
barometers), and in other laboratory and medical instru-
ments. It is also widely used in the dental profession
for tooth amalgam fillings. In certain countries, liquid
metallic mercury is still used in gold extraction. Mercury
compounds continue to be used in anti-fouling and mildew-
proofing paints and to control fungal infections of seeds,
bulb plants, and vegetation. WHO has warned against the
use of alkylmercury compounds in seed dressing (WHO,
1976a). Methylmercury compounds are still used in labora-
tory-based research, and so the possibility of occu-
pational exposures remains (Junghans, 1983).
4. ENVIRONMENTAL TRANSPORT, DISTRIBUTION, AND TRANSFORMATION
4.1 Transport and Distribution Between Media
Human exposure to mercury should first be viewed in
the context of the world-wide circulation of this highly
mobile metal (Fig. 1). The vapour of metallic mercury,
hereinafter referred to as mercury vapour or Hg°, is
released into the atmosphere from a number of natural
sources (section 3.1). Man-made emissions, mainly from the
combustion of fossil fuels, form about 25% of the total
emissions to the atmosphere. However, the anthropogenic
contribution is greater in the northern than in the
southern hemisphere and becomes the major form of emission
in heavily industrialized areas, such as western Europe.
The distribution constants of various mercury compounds
between air and water are given in Table 2. Clearly,
Hg° and dimethylmercury ((CH3)2Hg), as a result of
their air/water distribution coefficients, are most likely
to be found in the atmosphere.
Table 2. Experimentally determined distribution constants
for some compounds of relevance for the mercury cyclea
----------------------------------------------------------
Compound HgX (air)/ Temperature Cl-
HgX (water) (°C) ionic strength
(v/v) (mol)
----------------------------------------------------------
Hg° 0.29 20 0
(CH3)2Hg 0.31 25 0
(CH3)2Hg 0.15 0 0
CH3HgCl 1.9 x 10⁻⁵ 25 0.7
CH3HgCl 1.6 x 10⁻⁵ 15 1
CH3HgCl 0.9 x 10⁻⁵ 10 0.2 x 10⁻³
Hg(OH)2 3.2 x 10⁻⁶ 25 0.2 x 10⁻³
Hg(OH)2 1.6 x 10⁻⁶ 10 0.2 x 10⁻³
HgCl2 2.9 x 10⁻⁸ 25 0.2 x 10⁻³
HgCl2 1.2 x 10⁻⁸ 10 0.2 x 10⁻³
----------------------------------------------------------
a Adapted from: Lindqvist et al. (1984).
The solubility of mercury vapour in water is not high
enough to account for the concentrations of mercury found
in rain water. Thus, Lindqvist et al. (1984) suggested
that a small fraction of mercury vapour is converted to a
water-soluble species, probably Hg++, which is deposited
on land and water in rain. However, the putative water-
soluble forms have yet to be positively identified. Par-
ticulate forms account for less than 1% of total mercury
in the atmosphere but may make an important contribution
to mercury in rain water. The residence time of mercury
vapour is estimated to be between 0.4 and 3 years, and as
a consequence, mercury vapour is globally distributed. The
soluble form is assumed to have a residence time of the
order of weeks, and therefore the distance over which it
may be transported is limited. The extremely low concen-
trations in the atmosphere (section 5.1.1) present formi-
dable difficulties both in the analysis of total mercury
and in the identification and measurement of chemical and
physical species. For example, methylmercury compounds
have been reported in the air above polluted areas in the
USA (WHO, 1976b), but their presence in unpolluted air
still needs to be confirmed. Shimojo et al. (1976) found
methyl donors in car exhaust gases, but not methylmercury
in the ambient air.
Mercury deposited on land and open water is, in part,
re-emitted to the atmosphere as Hg°. This emission,
deposition, and re-emission ("ping-pong" effect) creates
difficulties in tracing the movement of mercury to its
source. The bottom sediment of the oceans is thought to
be the ultimate sink where mercury is deposited in the
form of the highly insoluble mercuric sulfide.
Recently, an expert group suggested that atmospheric
mercury vapour could be taken up directly by plant foliage
and that this might be an important pathway to watersheds
in highly forested areas (Lindberg et al., 1987).
4.2 Biotransformation
Despite the uncertainties concerning speciation, the
global cycle of mercury is believed to involve almost
exclusively the inorganic forms. These forms do not ac-
cumulate in human food chains except in uncommon items,
such as mushrooms (Minagawa et al., 1980). The change in
speciation from inorganic to methylated forms is the first
crucial step in the aquatic bioaccumulation process.
Methylation takes place mostly on sediments in fresh and
ocean waters but also in columns of fresh and sea waters
(Lindberg et al., 1987). Fish intestinal contents (Rudd et
al., 1980) and the outer slime of fish have also been
found to methylate inorganic mercury (McKone et al., 1971;
Jernelov, 1972; Rudd et al., 1980).
The mechanism of synthesis of methylmercury compounds
(both CH3Hg+ and (CH3)2Hg) is now well understood
(Wood & Wang, 1983). Methylation of inorganic mercury
involves the non-enzymic methylation of Hg++ by methyl
cobalamine compounds (analogues of vitamin B12) that are
produced as a result of bacterial synthesis. However,
other pathways, both enzymic and non-enzymic, may play a
role (Beijer & Jernelov, 1979). Factors affecting the
aquatic methylation of mercury have been described by
Fujiki & Tajuma (1975).
Microorganisms have also been isolated that carry out
the reverse reactions:
CH3Hg+ -> Hg++ -> Hg°
The enzymology of CH3Hg+ hydrolysis and mercuric
ion reduction is now understood in some detail (Silver,
1984; Begley et al., 1986), as is the oxidation of mercury
vapour to Hg++ by an enzyme that is critical to the oxy-
gen cycle (catalase). These oxidation-reduction and
methylation-demethylation reactions are assumed to be
widespread in the environment, and each ecosystem attains
its own steady state with respect to the individual
species of mercury. However, owing to the bioaccumulation
of methylmercury, methylation is more prevalent in the
aquatic environment than demethylation.
Once methylmercury is released from microorganisms, it
enters the food chain by rapid diffusion and tight binding
to proteins in aquatic biota. The results of a field study
on the entry of methylmercury to the tuna food chain in
the Mediterranean Sea fits the diffusion model (Bernhard
et al., 1982).
Methylmercury is rapidly accumulated by most aquatic
biota and attains its highest concentration in the tissues
of fish at the top of the aquatic food chain (Bernhard et
al., 1982). Thus, large predatory species, such as trout,
pike, walleye, and bass in fresh water and tuna, sword-
fish, and shark in ocean water, contain considerably
higher levels than non-predatory species (Table 3). The
ratio of the concentration of methylmercury in fish tissue
to that in water can be extremely large, usually of the
order of 10 000 to 100 000 (US EPA, 1980). However, it
should be noted that these bioconcentration ratios are not
the result of partition between water and tissue but of
biomagnification through the food chain. In addition to
the influence of trophic level or species, factors such as
the age of the fish, microbial activity and mercury in
sediment (upper layer), dissolved organic content (humic
content), salinity, pH, and redox potential all affect the
levels of methylmercury in fish (WHO, 1989a). Methylmer-
cury in freshwater fish is also affected by the catchment
area of the lake and by recent flooding or diversion of
rivers (see section 4.3).
4.3 Interaction with Other Physical, Chemical, or Biological Factors
Following the identification of point sources of mer-
cury pollution in the 1960s (Swedish Expert Group, 1971),
it was discovered in the early 1970s that numerous lakes
in Sweden had increased levels of methylmercury in pike,
even though these lakes had not been subjected to any
direct discharge of mercury. It was suggested by Hultberg
& Hasselrot (1981) that three explanations should be
considered:
- mercury discharged into the atmosphere is washed down
by precipitation or is deposited (in the dry form) in
the lake;
- acid precipitation causes the release of natural mer-
cury or mercury deposited earlier by air that had been
trapped;
- acidity in lakes induces a change in the biological
dynamics of the lakes, which results in a re-distri-
bution of mercury in the ecologic system.
The long-distance transport of mercury and the poten-
tial role of acidification have become major factors con-
cerning future human exposure to methylmercury. Low pH
favours both the direct uptake of methylmercury through
the gills of fish and dietary uptake due to increased
mercury accumulation by organisms in lower trophic levels
(Wiener, 1987; Xun & Campbell, 1987). According to
Hultberg and Hasselrot (1981), an increase in acidity of
one pH unit in a lake increases the mercury content in
pike by approximately 0.14 mg/kg wet weight. Wiener (1987)
reported that a change of pH from 6.1 to 5.6 increased the
mercury concentration in 1-year-old yellow perch from
0.11 ± 0.002 (SEM) mg/g to 0.138 ± 0.003 mg/kg within one
calendar year. The causal relationship between reduction
in pH and elevated mercury levels in edible tissues of
fish has not been established. Possible mechanisms
include:
- changes in population dynamics (a switch by pike from
consumption of roach to consumption of perch);
- a reduction in the total biomass where most of the
methylmercury is found (the growth of fish may be
retarded and, for a given size, the mercury concen-
tration will be higher);
- a low pH favours monomethyl versus dimethyl mercury;
the latter is less avidly accumulated by fish;
- a low pH may elute more mercury from sediments or
soils;
- as pH falls, the ratio of methylation to demethyl-
ation reactions increases, thus favouring an increase
in the net production of methylmercury (Ramlal et al.,
1986);
- Bjornberg et al. (1988) proposed that the concen-
tration of the sulfide ion in water determines the
bioavailability of inorganic mercury (Hg++) and,
therefore, the extent of methylation and uptake by
aquatic organisms. A reduction in pH will reduce the
concentration of the sulfide ion making more Hg++
available for methylation.
Table 3. The range of published average values of methylmercury (mg mercury/kg
wet weight) in the muscle tissue of various species of fisha,b
----------------------------------------------------------------------------------
Species Atlantic Pacific Indian Mediterranean
Ocean Ocean Ocean Sea
----------------------------------------------------------------------------------
Non-predators
Mackerel 0.07 - 0.2 0.16 - 0.25 0.005 0.24
Sardine 0.03 - 0.06 0.03 0.006 0.15
Unspecified number of
edible species 0.08 - 0.27 0.07 - 0.09 0.02 - 0.16 0.1 - 0.3
Predators
Tuna 0.3 - 0.8 0.3 0.064 - 0.4 1.2
Swordfish 0.8 - 1.3 1.6 - 1.8
Shark, dogfish, ray 1.0 0.7 - 1.1 0.004 - 1.5 1.8
----------------------------------------------------------------------------------
a Data from: US Department of Commerce (1978).
b Where an analysis of methylmercury was not available, the data on total mercury has been used instead.
Extensive investigations have been made in Canada in
recent years to explain why methylmercury levels increase
in fish when bodies of fresh water are relocated or
redirected (Ramlal et al., 1985; Stokes & Wren, 1987). It
is proposed that the redirecting of rivers and the forma-
tion of reservoirs for hydroelectric production results in
large quantities of organic material in the water, which
serves as a food source for microorganisms. The resulting
increase in microbial activity leads to an increase in the
production of methylmercury from inorganic mercury nat-
urally present in the sediment (Furutani & Rudd, 1980;
Ramlal et al., 1986). This process is sustained by the
repeated raising and lowering of water levels to maintain
hydroelectric production, because the shorelines continue
to be eroded and more vegetation enters the water. It is
likely that future environmental impact statements will
have to take into account this newly discovered source of
methylmercury when hydroelectric schemes are planned.
As noted by Bjornberg et al. (1988), "many biologi-
cal, chemical and physical factors are linked to each
other in the limnic ecosystem" and "many of these
factors seem to be of importance for the Hg content of
fish". Thus "it is not difficult to understand why it
has been considered hard to find simple mechanisms
explaining why certain lakes have a high mercury content
in fish and others have not". They propose that the
"central piece in the puzzle" is the critical influence
of the sulfide ion, which forms the highly insoluble mer-
curic sulfide with Hg++ (Ks = l0-52).
The solubility product of mercury selenide, HgSe, is
even lower (Ks = 10-58). Thus, studies made on a
Canadian lake that had received a large discharge of inor-
ganic mercury from a paper pulp factory suggest that the
addition of selenite can reduce the availability of mer-
cury for uptake into aquatic biota (Turner & Rudd, 1983).
Studies on Swedish lakes confirm these findings (Björnberg
et al., 1988). In these studies the selenium level was
raised artificially from 0.4 to 2.4 µg/litre over a 1- to
2-year period, and the mean levels of mercury fell from
1.5 to 0.70 mg/kg in pike and from 0.56 to 0.16 mg/kg in
perch. Such levels of selenium are below drinking-water
standards.
5. ENVIRONMENTAL LEVELS AND HUMAN EXPOSURE
5.1 Environmental Levels
There is considerable variation in mercury levels in
those media that are the source of human exposure and,
consequently, in their contribution to the toxicity risk.
Non-occupational groups are primarily exposed through the
diet. Although intake of the methylated form is of primary
interest, levels of other species are summarized so as to
provide a measure of total mercury intake.
5.1.1 Air
Concentrations of total mercury in the atmosphere of
the northern hemisphere have recently been estimated at 2
ng/m3, those in the southern hemisphere being half this
value. Values in urban areas are usually higher (e.g.,
10 ng/m3) (Lindqvist et al., 1984). Schroeder & Jackson
(1987) found values in the range 3-27 ng/m3 (mean, 9
ng/m3) in rural areas of Canada and 5-15 ng/m3 (mean,
11 ng/m3) in urban areas. In Sweden, urban levels appear
to be slightly lower (range, 0.8-13.2 ng/m3; mean,
4 ng/m3).
Dental mercury fillings are reported to release mer-
cury vapour into the oral cavity (Clarkson et al., 1988).
The resulting concentrations in intra-oral air can sub-
stantially exceed those found in the ambient atmosphere,
especially after of period of chewing. Estimates of pul-
monary absorption indicate that approximately 3000-17 000
ng mercury vapour enter the systemic circulation daily
from this exposure. As tobacco leaves contain mercury,
smoking may also contribute to inhalation exposure (Suzuki
et al., 1976).
As discussed in section 4.1, the major form of mercury
in air is believed to be elemental mercury vapour. How-
ever, the presence of methylmercury compounds in the ambi-
ent atmosphere has been reported (Johnson & Braman, 1974).
Recent data from the vicinity of Toronto, Canada, indi-
cated the following average composition (as percentage of
total mercury): Hg°, 75%; Hg++, 5%; and CH3Hg+, 20%
(Schroeder & Jackson, 1987). The particulate fraction of
mercury in air (as a percentage of total mercury) is
usually 4% or less (Lindqvist et al., 1984). The way in
which the "soluble fraction" of mercury in air (section
4.1) relates to these recent findings on individual chemi-
cal species is still unclear.
5.1.2 Water
Concentrations of total mercury in natural water are
so low that accurate analysis is still a major problem.
Values for rain water are usually within the range 5-100
ng/litre, but mean values as low as 1 ng/litre have been
reported. The most recent data (Fig. 1) indicate lower
values than those previously recorded (WHO, 1976b).
Representative values for dissolved total mercury are:
open ocean, 0.5-3 ng/litre; coastal sea water, 2-15
ng/litre; freshwater rivers and lakes, 1-3 ng/litre. The
concentration range for mercury in drinking-water is the
same as in rain, with an average of about 25 ng/litre
(Lindqvist et al., 1984).
The chemical speciation of mercury in water is still
not completely defined. Mercury in ocean waters exists
mainly in the form of Hg++ complexed with chloride ions.
Speciation in fresh water is poorly understood. In a con-
taminated lake system in Canada, methylmercury was found
to constitute a varying proportion of total mercury,
depending on the lake that was being tested, but, overall,
accounted for approximately 1-6% of the total mercury
(Canada-Ontario Steering Committee, 1983).
5.1.3 Food
Concentrations of mercury in most foodstuffs (WHO,
1976b; US EPA, 1984; Piotrowski & Inskip, 1981) are often
below the reported limit of detection (usually 20 µg/kg
fresh weight). Fish and fish products are the dominant
source of methylmercury in food. The highest concen-
trations are found in both freshwater and marine fish at
the highest trophic levels (Table 4). For example, shark
and swordfish have average values of total mercury in
edible tissues above 1200 µg/kg, whereas anchovies and
smelt have average values below 85 µg/kg. Most other
foodstuffs have average values below 20 µg/kg, with
mercury mainly in the inorganic form (Cappon, 1981;
Gartrell et al., 1985a,b, 1986). Cappon (1987) reported
mercury levels in vegetables.
5.2 General Population Exposure
5.2.1 Estimated daily intakes
The human intake of the three major forms of mercury
present in the environment is summarized in Table 4. The
intake of mercury from the ambient atmosphere has been
estimated by assuming that the concentration of total
mercury is 2 ng/m3 and that 75% is present as elemental
mercury vapour, 5% as inorganic mercury compounds, and 20%
as methylmercury. The daily intake of each form of mercury
was estimated by assuming a daily ventilation of 20 m3,
and the amount absorbed was estimated by assuming that 80%
of the inhaled elemental vapour, 50% of the inorganic mer-
cury compounds, and 80% of the methylmercury was absorbed
across the pulmonary membranes (WHO, 1976b).
Mercury intake from drinking-water was estimated by
assuming a daily water intake of 2 litres, an average
concentration of 25 ng/litre, and that all the mercury is
in the inorganic form. Methylmercury has been found in a
few samples taken from bodies of natural water, but there
have been no reports of methylmercury in drinking-water.
The intake of species of mercury in the diet was the
most difficult to estimate. Total mercury intake from all
foodstuffs in Belgium was 13 µg/day, compared with an
intake from fish alone of 2.9 µg/day (Fouassin & Fondu,
1978). Also in Belgium, Buchet et al. (1983) measured a
daily intake from all foodstuffs of 6.5 µg mercury.
The intake of total dietary mercury (µg/day) measured
during a market basket survey (1984-1986) of the Food and
Drug Administration (FDA) in the USA (Shibko, 1988),
according to age group was: 0.31 (6-11 months); 0.90 (2
years); 1.76 (16 years, females); 1.84 (14-16 years,
males); 2.32 (25-30 years, females); 3.01 (25-30 years,
males); 2.29 (60-65 years, females) and 2.52 (60-65 years,
males). It is of interest that when these intake rates are
converted to µg/day per kg body weight, the values fall
in a much more narrow range from 0.04 to 0.09. In fact
values for all the age groups except the two-year-olds
fall between 0.044 and 0.054 µg/day per kg.
Table 4. Estimated average daily intake and retention (ug/day) of total
mercury and mercury compounds in the general population not occupationally
exposed to mercurya
--------------------------------------------------------------------------
Exposure Elemental Inorganic mercury Methylmercury
mercury vapour compounds
--------------------------------------------------------------------------
Air 0.030 (0.024) 0.002 (0.001) 0.008 (0.0064)
Food
Fish 0 0.600 (0.042) 2.4 (2.3)
Non-fish 0 3.6 (0.25) 0
Drinking-water 0 0.050 (0.0035) 0
Dental amalgams 3.8-21 (3 - 17) 0 0
Total 3.9-21 (3.1 - 17) 4.3 (0.3) 2.41 (2.31)
--------------------------------------------------------------------------
a See text for assumptions underlying the calculations of average daily
intake and retention. Values given are the estimated average daily
intake; the figures in parentheses represent the estimated amount
retained in the body of an adult. Values are quoted to 2 significant
figures.
In Poland, the average daily dietary intake of mercury
(estimated in 2134 duplicate portions) was 5.08 µg/day in
the age group l-6 years, 5.43 µg/day in the age group
6-18 years, and 15.8 µg/day in adults (Szprengier-
Juszkiewicz, 1988). Owing to the low fish consumption
(6.76 kg/year) and low mercury concentration in market
fish (65 µg/kg), only 7% of the dietary intake derived
from fish (Nabrzyski and Gajewska, 1984). Bernhard &
Andreae (1984) estimated the world-wide mercury intake
from seafood to be 2 µg/day, which is equivalent to a
daily intake of 20 g seafood with a mercury concentration
of 0.1 mg/kg. This agrees with estimates by a United
Nations expert group (GESAMP, 1986). It should be pointed
out that the individual variation in intake is large and
that significant proportions of national populations have
a mercury intake via seafood many times higher than the
average (GESAMP, 1986).
For the purpose of estimating the average daily intake
of total mercury and various mercury compounds (Table 4),
it was assumed that the daily intake of total mercury from
fish and fish products is 3 µg and that 20% of this is in
the form of inorganic mercury compounds (i.e., 0.6 µg/day)
and 80% is methylmercury (i.e., 2.4 µg/day). The intake
of total mercury from non-fish sources was calculated as
the difference between the average total dietary intake
and the intake from fish. The average total dietary intake
in the Belgium studies was (6.5 + 13)/2 = 9.75 µg/day,
whereas the corresponding value for a 70-kg adult in the
USA can be estimated from the FDA market basket survey as
3.5 µg. Taking the average of the Belgian and USA
figures, the dietary intake of total mercury is estimated
as (9.75 + 3.5)/2 = 6.6 µg/day. By subtracting from this
figure the intake of methylmercury from fish (2.4 µg/day),
the estimated total dietary intake of inorganic mercury is
4.2 µg/day. All the mercury from non-fish sources was
assumed to be in the inorganic form. The amounts absorbed
across the gastrointestinal tract were estimated on the
assumption that 7% of the inorganic and 95% of the methyl
species were absorbed (section 6).
The estimated dietary intake of inorganic mercury of
4.3 µg/day is the least reliable of the estimates in
Table 4. Data are not available on the species of mercury
in most foodstuffs. In addition, the figures for dietary
intake of total mercury come from only two countries -
Belgium and the USA.
Table 4 portrays the relative magnitude of the contri-
butions from various media. It is clear that fish and fish
products are the dominant source of human exposure to
methylmercury, even when low fish consumption is assumed
(as in Table 4). Daily methylmercury intake can vary over
a wide range, depending on the amount of fish consumed and
the methylmercury concentration in the fish (Table 5). A
number of communities have been identified where individu-
al intakes exceeded 200 µg mercury/day (WHO, 1976b,
1980; Turner et al., 1980; GESAMP, 1986). As it is assumed
that 80% of this mercury is methylmercury and that 95% of
the methylmercury is absorbed, the absorbed amount of
methylmercury (>153 µg/day) will, in these cases, domi-
nate the daily mercury exposure (Table 4). On the basis of
general population surveys of fish consumption, it was
estimated that in Australia 0.9% of the population eat
more than 1000 g fish/week and that this corresponded to
about 20 µg mercury/day (WGMF, 1980). In the USA,
surveys of fish consumption (US Dept. Commerce, 1978)
were used to estimate that, with no regulatory control of
the mercury content of marketed fish, 99.81% of all
respondents had an upper limit mercury intake lower than
their personal allowable daily intake (based on 30 µg
mercury/day for a 70-kg person) at a 95% level. An action
level of 1 mg mercury/kg in fish for regulatory control
would increase this percentage to 99.87% and an action
level of 0.5 mg mercury/kg would increase it to 99.89%.
Dental mercury amalgams account for the major back-
ground intake of mercury vapour (Clarkson et al., 1988).
It is possible that mercury liberated from the amalgam can
dissolve in the saliva as inorganic mercury, but there are
no published reports on this possibility. A detailed dis-
cussion of the release of mercury from dental amalgams
will be found in the Environmental Health Criteria mono-
graph on Inorganic Mercury, which is due to be published
in 1990.
Table 5. Intake of methylmercury (ug/day) from
fish with various methylmercury levels
and at various rates of fish consumptiona
------------------------------------------------
Consumption Level of methylmercury in fish
of fish (ug/kg fresh weight)b
(g/day) 200 500 1000 2000 5000
------------------------------------------------
5 1 2.5 5 10 25
20 4 10 20 40 100
100 20 50 100 200 500
300 60 150 300 600 1000
1000c 200 500 1000 2000 5000
------------------------------------------------
a Adapted from: WHO (1980).
b For methylmercury concentration in fish see
Table 3.
c Data from GESAMP (1986) indicate that maximum
intakes may equal 1000 g/day.
6. KINETICS AND METABOLISM
A considerable amount of information was available on
the metabolism of methylmercury at the time when Environ-
mental Health Criteria 1: Mercury was published (WHO,
1976b). This section will briefly review the information
in that document and quote more recent data where appro-
priate.
6.1 Absorption
Methylmercury in the diet is almost completely ab-
sorbed into the bloodstream (WHO, 1976b). Animals studies
(Walsh, 1982) indicate that age, including neonatal stage,
has no effect on the efficiency of gastrointestinal ab-
sorption, which is usually in excess of 90% of the oral
intake. Data on rats indicate rapid and virtually complete
absorption of inhaled methylmercury vapour into the blood-
stream (Fang, 1980).
6.2 Distribution
Methylmercury is distributed in the bloodstream to all
tissues. Distribution is completed within about 4 days in
human beings (Kershaw et al., 1980), but the time after a
single dose for maximum levels to be reached in the brain
is one or two days longer than for other tissues (Berlin,
1986). At this time, the total brain contains approxi-
mately 6% of the dose (Kershaw et al., 1980), which is
very near to 10% of the body burden (WHO, 1976b). These
blood and brain values correspond to a six times higher
concentration in the brain than in blood (Berlin, 1986).
There are significant species differences in brain-to-
blood ratios. After the prolonged administration of
methylmercury, brain-to-blood ratios are between 3 and 6
in squirrel monkeys (Berlin, 1986) but somewhat lower in
macaque monkeys (Evans et al., 1977). The ratio is gener-
ally low in non-primate animals, except in pigs (where it
is 3.3); it is 1.5 in guinea-pigs, 1.2 in mice, and 0.06
in rats (Magos, 1987). Sex differences in distribution and
retention have been reported in rats dosed with methylmer-
cury (Magos et al., 1981; Thomas et al., 1986) and in both
adult (Hirayama & Yasutake, 1986) and prenatally exposed
mice (Inouye et al., 1986).
There are also species differences in the distribution
of methylmercury between erythrocytes and plasma. After
the ingestion by human volunteers of fish containing
methylmercury, the background-corrected erythrocyte-to-
plasma methylmercury concentration ratio was about 20
(Kershaw et al., 1980). The ratio is approximately the
same in monkeys and guinea-pigs, 7 in mice, and more than
100 in rats (Magos, 1987).
The blood-to-hair ratio in humans is about 1 to 250,
but appreciable individual differences have been found
(Table 6). Similarly, large individual differences exist
in the ratio of cord blood to maternal blood concen-
tration. Cord blood usually has somewhat higher methylmer-
cury concentration than maternal blood (WHO, 1976b). Thus,
in a group of Japanese women the average ratio of cord
blood to maternal blood methylmercury concentration ranged
from 0.8 to 2.8, with a mean of 1.65 (Suzuki et al.,
1984b). The results of studies on rats (Ohsawa et al.,
1981) and pigs (Kelman et al., 1980, 1982) indicate that
placental transport of methylmercury into the fetus
increases dramatically towards the end of pregnancy.
6.3 Metabolic Transformation
Methylmercury is converted to inorganic mercury, as-
sumed to be Hg++, in mammals (WHO, 1976b). The fraction
of total mercury present in the tissues as Hg++ depends
on the duration of exposure to methylmercury and the time
after cessation of exposure.
The percentage of total mercury present as Hg++ in
the tissues and body fluids of people exposed to high oral
daily intakes of methylmercury for about 2 months in the
Iraqi outbreak were: whole blood, 7%; plasma, 22%; breast
milk, 39%; and urine, 73% (Amin-Zaki et al., 1976; Magos
et al., 1976; WHO, 1976b). Measurements of liver tissues
from fatalities in Iraq revealed that 16-40% was present
as inorganic mercury. Unfortunately, no other tissues were
available for analysis. There is a possibility that
exposure to other mercury compounds may have occurred in
some members of the Iraqi population.
Table 6. Relationship between mercury concentrations in the blood and
hair of people with long-term exposure to methylmercury from fish
-----------------------------------------------------------------------------------------------
Country Number of Whole blood Hair Linear Reference
subjects (x) (y) regression
(µg/litre) (mg/kg)
-----------------------------------------------------------------------------------------------
Canada 339 1 - 60 1 - 150 y = 0.30x + 0.5 Phelps et al. (1980)
Japan 45 2 - 800 20 - 325 y = 0.25x + 0 WHO (1976b)
Netherlands 47 1 - 40 0 - 13 y = 0.26x + 0 Den Tonkelaar et al.
(1974)
Sweden 12 4 - 650 1 - 180 y = 0.28x - 1.3 WHO (1976b)
51 4 - 110 1 - 30 y = 0.23x + 0.6 WHO (1976b)
50 5 - 270 1 - 56 y = 0.14x + 1.5 WHO (1976b)
60 44 - 550 1 - 142 y = 0.23x - 3.6 WHO (1976b)
United Kingdom 173 0.4 - 26 0.1 - 11 y = 0.25x + 0.6 Haxton et al. (1979)
98 1.1 - 42 0.2 - 21 y = 0.37x + 0.7 Sherlock et al. (1982)
Yugoslavia 38 1.2 - 9.6 0.4 - 3.0 y = 0.34x - 22 Horvat et al. (1986b)
-----------------------------------------------------------------------------------------------
In Canadian Indians repeatedly exposed to methylmer-
cury in fish during the summer season every year, inor-
ganic mercury accounted for about 5% of total mercury in
whole blood and about 20% in samples of head hair (Phelps
et al., 1980). Brain mercury levels were measured in one
Indian who had died of natural causes 2 years after having
a high blood level (approximately 600 µg/litre). Most of
the mercury in the brain tissue was in the inorganic form,
but, at the time of his death, the total mercury in the
brain had fallen to near background levels (Wheatley et
al., 1979).
Following the outbreak in Minamata, Japan, in 1956,
tissues from a number of early fatalities were analysed
(Tsubaki & Takahashi, 1986). Death occurred between 19
and 100 days after the onset of symptoms. Tissues were
also analysed from people who died from 1 to 17 years
after the onset of symptoms. Samples were analysed
initially by the dithizone colorimetric procedure in
1956-1960 and again in 1973-1983 by atomic absorption for
total mercury and by gas chromatography for methylmercury.
In this study, atomic absorption generally gave higher
values for total mercury than the dithizone method. The
methylmercury concentration was always less than that of
total mercury, usually less than 50%, and in a few cases
less than 10%. The chemical nature of the mercury not
accounted for as methylmercury was not determined. It may,
in whole or in part, have been methylmercury that could
not be extracted in the gas chromatographic procedure, or
it may have been inorganic mercury.
Speciation of mercury in human brain has been studied
by Friberg et al. (1986) and Nylander et al. (1987). An
average of 80% of the mercury in the occipital lobe cortex
of autopsy cases in Sweden was found to be inorganic
mercury (3-22 ng/g wet weight). Exposure to mercury from
dental fillings could explain the high proportion of
inorganic mercury in some cases but not in all.
There is considerable evidence indicating the presence
of inorganic mercury in the tissues of animals dosed with
methylmercury (WHO, 1976b). Magos & Butler (1972) showed
that during long-term daily dosing, the fraction of inor-
ganic mercury in rat tissues tended to approach a constant
value, which was different for each tissue. The kidney and
liver had the highest fractions, while the brain had one
of the lowest. Speciation of mercury in the brain of
monkeys exposed to methylmercury for several years was
studied by Lind et al. (1988b). At the end of the exposure
period, 10-30% of the brain mercury was in the inorganic
form while in monkeys sacrificed 0.5-2 years after the
same treatment, about 90% was in the inorganic form. Simi-
lar observation was reported by Kawasaki et al. (1986),
but in the cerebrum a substantially higher proportion of
the total mercury was methylmercury than in the cerebellum
(See also WHO, 1976b). It is clear that the proportion of
inorganic mercury found at any time in a particular tissue
will be determined by a number of processes, e.g., the
relative rates of uptake and loss of inorganic mercury and
methylmercury and the extent of biotransformation (if any)
in that tissue. Studies by Suda & Takahashi (1986) indi-
cate that macrophage cells, such as those present in the
spleen, are capable of converting methylmercury to inor-
ganic mercury. The reaction may involve the production of
oxygen free-radicals. At present there are no definitive
data that prove that demethylation actually takes place in
brain tissue, but persuasive arguments have been presented
by Lind et al. (1988b).
The conversion of methylmercury to Hg++ may be a key
step in the processes of excretion. The faecal pathway
accounts for about 90% of the total elimination of mercury
in man and other mammals after exposure to methylmercury
(WHO, 1976b). Virtually all the mercury in human faeces
is in the inorganic form (Turner et al., 1975). The pro-
cess of faecal elimination begins with the biliary
secretion of both methylmercury and Hg++, complexed
mainly, if not entirely, with glutathione (GHS) (Refsvik &
Norseth, 1975) or other sulfhydryl peptides (Norseth &
Clarkson, 1971; Ohsawa & Magos, 1974). Inorganic mercury
is poorly absorbed across the intestinal wall (WHO, 1976b)
so that most (approximately 90%) of the inorganic mercury
secreted in bile passes directly into the faeces. Methyl-
mercury secreted into the intestinal contents is in large
part reabsorbed into the bloodstream and may subsequently
contribute to biliary secretion, thereby forming a
secretion-reabsorption cycle (Norseth & Clarkson, 1971).
This cycle (also called enterohepatic circulation) in-
creases the amount of methylmercury passing through the
intestinal contents and thus provides a continuous supply
of methylmercury to serve as a substrate for the intesti-
nal microflora. These microorganisms are capable of con-
verting methylmercury to inorganic mercury, which then
becomes the major contributor to total faecal elimination
in the rat (Rowland et al., 1980). Presumably about 10% of
the inorganic mercury produced by the intestinal micro-
flora is absorbed into the bloodstream and contributes to
the inorganic mercury concentrations in tissues, plasma,
bile, breast milk, and urine. This intestinal microbio-
logical activity may explain the influence of diet on
methylmercury elimination rates in rats (Rowland et al.,
1984, 1986), and the absence of demethylating intestinal
microflora may be the reason for the low rate of faecal
elimination of mercury in suckling mice (Rowland et al,
1983).
To what extent this model of enterohepatic circulation
and intestinal conversion to inorganic mercury applies to
humans is not yet known. Considerable species differences
exist in rates of biliary excretion (Naganuma & Imura,
1984). Though the species variation in the secretion of
methylmercury does not entirely correspond to the biliary
excretion of GSH, high GSH secretion (rat, mice, and ham-
ster) is associated (on a group basis) with high methyl-
mercury secretion and low GSH secretion (guinea-pig and
rabbit) with low methylmercury secretion (Stein et al.,
1988).
Animal studies suggest that multigeneration exposure
to methylmercury may change tissue distribution and metab-
olism (Yamamoto et al., 1986).
6.4 Elimination and Excretion
The rate of excretion of mercury in both humans and
laboratory animals dosed with methylmercury is directly
proportional to the simultaneous body burden, and there-
fore may be described by a single biological half-time
(WHO, 1976b). The reason is that methylmercury is so
mobile in the body that the excretion process is the rate-
limiting step. Data on biological half-times in human
beings were summarized in Environmental Health Criteria 1:
Mercury (WHO 1976b). Kershaw et al. (1980) and Sherlock et
al. (1984) reported half-times of 52 (39-67) and 50
(42-70) days in blood, close to the valves found earlier
in people who ate fish or had consumed contaminated bread
(WHO, 1976b). The whole-body half-times, determined in
volunteers given a single tracer dose, have an average
value of about 70 days and a range of 52-93 days. Only 20
subjects have been studied to date. Biological half-times
in blood and hair have been measured both in volunteers
given carefully measured doses and, after cessation of
exposure, in individuals exposed as a result of accidental
intake or high fish consumption. Observations on volun-
teers reveal values for blood half-time close to 50 days
and a range of 39-70 days. Results from single tracer
doses agree well with those from volunteers given measured
doses in fish. It is clear that the blood half-times over-
lap those for the whole body, but the average value is
lower. A shorter blood half-time would account for the
observation that the amount of methylmercury in blood
constitutes a decreasing fraction of the body burden with
time after a single tracer dose (Miettinen, 1973). Lac-
tating women have significantly shorter half-times (aver-
age value, 42 days) than non-lactating women (average
value, 79 days), an observation confirmed by animals
studies (Greenwood et al., 1978).
Observations on both volunteers and environmentally
exposed people indicate that half-times in hair closely
follow those in blood (Amin-Zaki et al., 1976; Kershaw et
al., 1980; Hislop et al., 1983). However, hair half-times
tend to have a wider range; for example, Al-Shahristani &
Shihab (1974) reported a bimodal distribution in 48 Iraqi
subjects, 90% having a half-time of 35-100 days and the
other 10% a half-time of 110-120 days. It is possible, but
not proven, that analytical artifacts may contribute to
the wider range seen with hair (WHO, 1980). In any case,
data from animals point to the importance of sex, age, and
genetically determined individual differences (Hirayama &
Yasutake, 1986).
Animal data indicate major ontogenic effects on bio-
logical half-times (Doherty et al., 1977). Suckling mice
are completely unable to excrete methylmercury. At the end
of the suckling period, excretion abruptly switches on at
the adult rate. Observations on infant monkeys confirm
this finding (Lok, 1983). Likewise, biliary secretion of
methylmercury in suckling animals is virtually absent and
assumes the adult rate after weaning. It is of interest
that biliary secretion of glutathione (GHS) shows parallel
ontogenic changes (Ballatori & Clarkson, 1985). Microflora
also have greatly diminished capacity to demethylate
methylmercury during the suckling period (Rowland et al.,
1983). In view of the failure of infant animals to excrete
methylmercury, human infants may also have a diminished
excretion. Unfortunately, no direct observations have yet
been reported.
6.5 Retention and Turnover
The evidence summarized in section 6.4 indicates that
the accumulation and excretion of methylmercury in humans,
measured in terms of hair or blood levels, can be rep-
resented by a single-compartment model. The accumulation
phase in the whole body or in a tissue compartment is
described by the equation:
A = ( a / b )(1-exp(- b x t )) (equation 1)
where A = the accumulated amount
a = the amount taken up by the body (or organ)
daily
b = the elimination constant
t = time
The elimination constant is related to the biological
half-time ( T´) by the expression:
T´ = ln2/ b (equation 2)
and a is related to the daily dietary intake ( d ) by the
expression:
a = f x d (equation 3)
where f is the fraction of the daily intake taken up by
the body (or organ).
At a steady state, the accumulated amount ( A ) is
given by:
A = a / b (equation 4)
while the steady-state mercury concentration in blood
(C) in µg/litre is related to the average daily dietary
intake (in µg mercury) as follows:
0.95 x 0.05 x d
C = f x d / b = ---------------- = 0.95 x d (equation 5)
0.01 days-1 x 5 litres
assuming that 0.95 of the intake is absorbed, that 0.05 of
the absorbed amount goes to the blood compartment, that
the blood volume is 5 litres, and that the elimination
constant is 0.01 days-1.
Sherlock et al. (1984) tested the validity of equation
1 by measuring blood mercury concentrations during a 100-
day period of methylmercury intake and a 100-day period
after intake ceased in 20 volunteers who consumed measured
daily amounts of methylmercury in fish. Close agreement
was found between predicted and observed values.
Equation 1 predicts that a steady state in which in-
take equals excretion will be attained in about 5 half-
times. Thus, in adult humans, the whole body would attain
a steady state in about one year (5 x 70 days = 350 days).
Thus, an important prediction of the single-compartment
model is that constant dietary exposure to methylmercury
for a period of several years should not result in any
greater accumulation than after one year of exposure.
Equation 4 predicts that the maximum amount accumu-
lated in the whole body of adult humans will be 100 times
the average daily intake. In fact, steady blood levels may
also be calculated from equations 2, 3, and 4, using the
kinetic parameters to the single-compartment model listed
in Table 7.
It is of interest to compare this predicted relation-
ship with those observed in field studies on populations
believed to have attained a steady state from long-term
dietary exposure to methylmercury in fish (Table 7). The
coefficients relating long-term dietary intake to steady-
state blood concentration are all lower than the predicted
value of 0.95 calculated in equation 5 above. The reasons
for this discrepancy are not yet fully understood. The
measurement of dietary intake in populations with uncon-
trolled intakes is liable to considerable error (Turner et
al., 1980). However, this would not explain the consist-
ently lower values from field studies. It is more likely
that these populations were not in true steady state,
since intake is frequently seasonal in fish-eating popu-
lations. The fact that close agreement is seen between
single-dose tracer studies, single-dose methylmercury in-
take from fish, extended controlled intake from fish, and
longitudinal hair analysis of individuals with very high
intakes lends support to the validity of the single-com-
partment model and the values of the kinetic parameters
listed in Table 8. Sherlock and Quinn (1988) presented a
more detailed discussion of the differences between con-
trolled and uncontrolled studies on the relationship
between blood concentration and intake of methylmercury.
Table 7. Relationship between steady-state blood concentrations and average daily intake of
methylmercury in fish consumers and predicted relationships from experimental data
---------------------------------------------------------------------------------------------
Number of Duration of Average mercury Steady-state blood Reference
subjects exposure intake (µg/day per concentration
70 kg body weight) (ug mercury/litre)
(x) (y)
---------------------------------------------------------------------------------------------
Observed relationship
32 years 0 - 800 y = 0.7x + 1 WHO (1976b)
165 years 0 - 400 y = 0.3x + 5 WHO (1976b)
20 years 0 - 800 y = 0.8x + 1 WHO (1976b)
725 years 0 - 800 y = 0.5x + 4 WHO (1976b)
22 years 0 - 800 y = 0.5x + 10 WHO (1976b)
Predicted relationship
15 1 dose tracer y = 1x WHO (1976b)
30 1 - 2 months 0 - 2340 y = 0.8x WHO (1976b)
5 1 dose 1400 y = 1x Kershaw et al. (1980)
20 100 days 0 - 230 y = 0.8x Sherlock et al. (1984)
---------------------------------------------------------------------------------------------
It should be emphasized that this model refers to the
"average" adult human with a body weight of 70 kg. The
gastrointestinal absorption rate for methylmercury is high
(about 95%) and is not known to vary with age, but the
energy intake varies greatly with age and this tends to
make children and teenagers more vulnerable to high in-
takes of methylmercury.
The one compartment model is a useful working model
for comparing blood or hair levels to daily intakes of
methylmercury. Clearly this model is only an approximation
to the more complex kinetics of mercury distribution and
metabolism. For example, determination of mercury in hair
and blood will not produce information concerning small
compartments in the body. Methylmercury is slowly trans-
formed to inorganic mercury, a process which is known to
follow multiphasic kinetics (Berlin, 1986).
6.6 Reference or Normal Levels in Indicator Media
Reference values in non-exposed populations for con-
centrations of total mercury in commonly used indicator
media are given in Table 9. The mean concentration in
whole blood is probably about 8 µg/litre, in hair about
2 µg/g, in urine 4 µg/litre, and in the placenta about
10 µg/g wet weight.
Table 8. Principal kinetic parameters in the single-compartment model for
methylmercury in adult human beings
----------------------------------------------------------------------------
Number Type of Dose Number Compartment Reference
of subject (µg of ----------------------------
subjects mercury doses Whole body Blood
/kg) ----------------------------
f T´ f T´
(days) (days)
----------------------------------------------------------------------------
3 adult tracer 1 0.95 72 - - WHO
(1976b)
15 adult tracer 0.94 76 0.07 50 WHO
(1976b)
5 adult 20 1 - - 0.05a 52 Kershaw
et al.
(1980)
5 adult 3.3 100 - - 0.05a 53 Sherlock
et al.
(1984)
5 adult 1.5 100 - - 0.055a 51 Sherlock
et al.
(1984)
4 adult 100 100 - - 0.057a 48 Sherlock
et al.
(1984)
5 adult 0.6 100 - - 0.064a 46 Sherlock
et al.
(1984)
----------------------------------------------------------------------------
a Calculations were made from concentrations in blood. The value of f
(fraction of dose which reached the compartment) was calculated assuming
blood volume of 5 litres in a 70-kg adult.
Table 9. Concentrations of mercury in indicator media in non-exposed populationsa
-----------------------------------------------------------------------------------------
Country Indicator No. of Mercury concentrationb Reference
media Subjects Mean Range
-----------------------------------------------------------------------------------------
Belgium placenta 474 15 1.1 - 103 Roels et al. (1978)c
whole blood 497 13d 0.1 - 47d Lauwerys et al. (1978)
Italy whole blood 80 20 0 - 46 Pallotti et al. (1979)
Japan maternal blood 11 6.6 2.0 - 16.4 Suzuki et al. (1984b)
umbilical blood 7 8.9 3.1 - 20.6 Suzuki et al. (1984b)
New Guinea hair 40 4.5 0.9 - 12.1 Suzuki et al. (1988)
Norway urine 103 4d 0.6 - 24d Lie et al. (1982)
Poland whole blood 270 11.3d 2.5 - 24d Szucki & Kurys (1982)
hair 505 2.2 0.02-10 Szucki & Kurys (1982)
Maternal hair
(scalp) 141 1.9 0.02 - 41 Sikorski et al. (1986)
(pubic) 141 1.0 ND-32 Sikorski et al. (1986)
Neonatal hair 141 0.11 ND-0.62 Sikorski et al. (1986)
Swedene hair 18 0.4 Ohlander et al. (1985)
hair 41 0.53 Forhammer et al. (1984)
United whole blood 88 8.8d,f 1.1 - 42d Sherlock et al. (1982)
Kingdom urine 77 2.4g ND - 8g Taylor & Marks (1973)
USA whole blood 210 8.1h 0 - 50h Gowdy et al. (1977)
whole blood 25 3.4 0 - 7i Kuhnert et al. (1981)
placenta 25 6.7j 0 - 13i Kuhnert et al. (1981)
Yugoslavia hair 34 1.5 0.4 - 3.3 Horvat et al. (1988b)
maternal blood 34 3.7d 1.2 - 9.6d Horvat et al. (1988b)
umbilical blood 34 7.7d 1.2 - 21d Horvat et al. (1988b)
placenta 34 13 2.8 - 37 Horvat et al. (1988b)
Northern hair 312 3.1 0 - 9 Airey (1983)
hemispherek
Northern hair 4603 2.3 0 - 5 Airey (1983)
hemisphere
Southern hair 1449 1.7 0.8 - 2.5 Airey (1983)
hemisphere
-----------------------------------------------------------------------------------------
a No known occupational exposure; fish consumption usually less than one meal per week.
b The units for mercury concentrations are: µg/kg for placenta, mg/kg for hair, and
µg/kg for blood and urine, unless otherwise stated. ND = not detectable.
c This reference contains data on levels published prior to 1976.
d µg/litre
e Pregnant women.
f Values are for adults
g µg/g creatinine
h Values after exclusion of 9 samples >50µg/kg as outliers; without the exclusion
the mean was 14.2 and range 0-298 µg/kg.
i Range estimated as twice the standard deviation.
j The placentae were perfused to remove blood before analysis.
k North of 22° latitude.
Additional data on levels in indicator media in dif-
ferent populations are given in the following references:
Belgium (Buchet et al., 1978), Canada (Galster, 1976;
Kershaw et al., 1980; Phelps et al., 1980; McKeown-Eyssen
& Ruedy, 1983a; McKeown-Eyssen et al., 1983; Valciukas et
al., 1986), Federal Republic of Germany (Lommel et al.,
1985), Finland (Mykkanen et al., 1986), Greenland (Hansen
et al., 1984), Iceland (Johannesson et al.,1981), Italy
(Capelli et al., 1986), the East Pacific area (Yamaguchi
et al., 1977), Japan (Suzuki et al., 1984a), New Guinea
(Kyle & Ghani, 1982a,b; 1983), New Zealand (Kjellstrom et
al., 1982), Seychelles (Matthews, 1983), Spain (Gonzalez
et al., 1985), and Sweden (Skerfving, 1974). Intake of
methylmercury is reflected in elevated levels in whole
blood and in erythrocytes (approximately 95% of blood
mercury is in the erythrocytes). Animal studies indicate
that, at non-toxic levels, blood methylmercury concen-
tration is a good index of brain mercury concentration
(Berlin, 1976).
Urine and blood concentrations correlate with mercury
vapour levels only after long-term exposures (Smith et
al., 1970). Blood levels rise and fall sharply during and
after short-term exposures (Cherian et al., 1978).
Hair levels may be increased as a result of direct
adsorption of mercury vapour onto the hair strands. Airey
(1983) reported that the average hair mercury levels in
the northern hemisphere are higher than in the southern
hemisphere (Table 9).
Long-term fish consumption determines almost com-
pletely the concentrations of methylmercury and, usually,
total mercury in blood. Thus, reference values must take
into account fish consumption. In communities with high
fish consumption rates, individuals with long-term intakes
of 200 µg mercury/day will have blood levels in the range
of 200 µg mercury/litre.
Hair concentrations of methylmercury are proportional
to blood concentrations at the time of formation of the
hair strand (Table 6). In general, the concentration in
hair is 250 times the simultaneous concentration in blood.
Once mercury is incorporated into a hair strand, that hair
mercury concentration remains unchanged. Thus, longitudi-
nal measurement of mercury in hair provides a recapitu-
lation of methylmercury levels in blood. Airey (1983)
presented a comprehensive evaluation of mercury levels in
hair. The author found that mean hair mercury concen-
trations corresponded to fish consumption patterns as
follows: once or less a month, 1.4 µg/g; once every 2
weeks, 1.9 µg/g; once a week, 2.5 µg/g; and once or
more a day, 11.6 µg/g. Owing to their higher-than-
average fish consumption, fisherman may have higher-than-
average methylmercury concentrations in their hair. For
example, in three Mediterranean countries, (Greece, Italy,
and Yugoslavia) 33% of 212 fishermen but only 0.33% of 918
other residents had methylmercury levels in hair above
10 µg/g (WHO/FAO/UNEP, 1989). These data support the
conclusion that long-term fish intake determines methyl-
mercury levels in hair and also in blood.
6.7 Reaction with Body Components
Information on the binding of methylmercury to tissue
ligands other than haemoglobin is sparse. Methylmercury is
believed to bind to cystinyl residues in the haemoglobin
molecule. The number and position of these residues in the
amino acid chains differ in haemoglobin from different
species (Doi & Kobayashi, 1982, Doi & Tagawa, 1983).
Methylmercury is complexed to glutathione (GHS) in both
human and animal erythrocytes (Naganuma et al., 1980).
The only known exception is rat erythrocytes where practi-
cally all methylmercury is bound to haemoglobin (Doi &
Tagawa, 1983). Methylmercury complexes may also be
involved in the urinary excretion of methylmercury (Mulder
& Kostyniak, 1985a,b). Animal data indicate that methyl-
mercury complexes also exist in brain tissue (Thomas &
Smith, 1979; Berlin et al., 1975), bile (Refsvik &
Norseth, 1975), liver (Omata et al., 1978), and probably
in kidney tissue (Richardson & Murphy, 1975). Complexes of
methylmercury with GHS and possibly other low molecular-
weight thiols play a role in blood transport and tissue
distribution (Hirayama, 1980; Thomas & Smith, 1982) and in
biliary secretion (Ballatori & Clarkson, 1985; Urano et
al., 1988). Glutathione-S-transferase (ligandin) may be
involved in the biliary secretion process (Refsvik,
1984a,b; Magos et al., 1985b), but evidence is still
equivocal (Gregus & Varga, 1985). The activity of hepatic
y -glutamyltransferase may also affect methylmercury
secretion in bile (Stein et al., 1988). According to in
vitro studies, the transport of methylmercury across cell
membranes appears to be a diffusional process involving an
unchanged complex of methylmercury chloride (Lakowicz &
Anderson, 1980; Bienvenue et al., 1984). However, the
relevance of these findings to in vivo transport across
membranes is not clear. Due to the high affinity of the
methylmercury cation for sulfhydryl groups, it is unlikely
that methylmercury chloride will be present in significant
amounts in plasma or other biological fluids. Amino acid
complexes may be involved in membrane transport of
methylmercury (Hirayama, 1980, 1985; Aschner & Clarkson,
1987; Watanabe et al., 1988).
The administration of selenium compounds to animals
protects against the toxic effects of methylmercury
(Ganther et al., 1972; Iwata et al., 1973). It alters the
tissue distribution and excretion of methylmercury
(Ganther, 1978, Prohaska & Ganther, 1977) and also the
inorganic-to-methyl mercury ratio in tissues (Komsta-
Szumska & Miller, 1984; Brzeznicka & Chmielnicka, 1985a).
In spite of the protective effect, selenite increases the
brain concentration of methylmercury (Magos & Webb, 1977;
Brzeznicka & Chmielnicka 1985b). The methylmercury cation
has a high affinity for selenides and diselenides (Sugiura
et al., 1978), the latter being formed by the reductive
metabolism of selenite (Hsieh & Ganther, 1975; Ganther,
1979). It has been reported that (CH3Hg)2Se can be
formed both in vitro and in vivo (Magos et al., 1979;
Naganuma & Imura, 1980; Masukawa et al., 1982). To what
extent the formation of this compound explains the altered
tissue distribution of methylmercury is not yet clear.
Selenium may also divert mercury from its endogenous
binding sites, but Thomas & Smith (1984) were not able to
find evidence for this. Maternal administration of
selenium to mice causes a specific alteration in the form
of selenium in fetal liver, as indicated by gel filtration
chromatography. This change was not found in maternal
liver or kidney or in the placenta (Nishikido et al.,
1988b).
7. EFFECTS ON ORGANISMS IN THE ENVIRONMENT
Data concerning the effects of methylmercury on organ-
isms in the environment are discussed in Environmental
Health Criteria 86: Mercury - Environmental Aspects (WHO,
1989a).
8. EFFECTS ON EXPERIMENTAL ANIMALS AND IN VITRO TEST SYSTEMS
Methylmercury is a systemic poison and, depending on
the dose and the length of exposure period, can affect
various organ systems and functions. However, in every
species the main target is the nervous system and one of
the earliest objective clinical signs is ataxia. The sig-
nificance of effects on animals is confounded by well-
established species differences in both the localization
of nervous system damage and in accompanying clinical and
pathological changes (Berlin, 1986). Another common target
is the fetus. As methylmercury is capable of corrosive
action, it can damage any tissue (skin, eye, upper part of
the digestive tract) if presented in sufficiently high
concentrations (WHO, 1976b).
8.1 Neurotoxicity and Nephrotoxicity
The effects of methylmercury given in a single lethal
dose is uncharacteristic. After intraperitoneal adminis-
tration, rats showed respiratory and vascular disorders
and hamsters became comatose (Hoskins & Hupp, 1978),
whereas after oral administration to pigs, central nervous
system depression, ending in coma, was preceded by diar-
rhoea and vomiting (Piper et al., 1971). Rats surviving
an LD50 dose showed general debilitation with weight
loss, but did not develop specific motorial changes, while
a squirrel monkey that had survived the severe acute
effects of a single dose (6.4 mg/kg) became uncoordinated
by 22 days and blind at 24 days (Hoskins and Hupp, 1978).
The cause of weight loss is anorexia. The anorexic
effect shows significant species differences. Anorexia
precedes the clinical signs of nervous system injury in
rodents treated daily with methylmercury (Magos, 1982).
In cats (Davies & Nielsen, 1977) and dogs (Davies et al.,
1977), anorexia and gait disorder ("bunny-hopping")
occur simultaneously. In the squirrel monkey only severe
methylmercury intoxication is associated with weight loss
(Evans et al., 1977).
Studies on the neurotoxicity of methylmercury were
reviewed by WHO (1976b). This review called attention to
species differences in blindness and the involvement of
peripheral nerves. Blindness may be caused in man,
monkeys, and pigs, but not in cats. In rats, the initial
damage appears in the dorsal root ganglions and associated
peripheral nerves, while in monkeys the cerebral cortex is
the first target. One of the most common lesions of the
central nervous system is in the granular layer of the
cerebellum. This type of damage has been observed in man
(Takeuchi & Eto, 1975) and also in rats, cats, hens
(Chang, 1977), dogs (Davies et al., 1977), calves
(Herigstad et al., 1972), guinea-pigs (Falk et al., 1974),
and rabbits (Jacobs et al., 1977), but not in pigs (Davies
et al., 1976) or monkeys (Chang, 1977; Mottet et al.,
1987). Female rats, which accumulate higher concentrations
of methylmercury in their brain than males, also develop
more severe cerebellar lesions (Magos et al., 1981).
These experimental studies (see also Mitsumori et al.,
1984 and Munro et al., 1980) confirmed clinical findings
in human beings of irreversible damage to the nervous
system. Other experimental studies carried out since the
publication of Environmental Health Criteria 1: Mercury
(WHO, 1976b), which focused on the mechanism of toxicity,
are reported in section 9.3.1.3.
Renal damage is one of the most frequently described
non-neural effect of methylmercury. This damage may be
caused by inorganic mercury split from methylmercury. In
rats, treatment with methylmercury caused renal damage
ranging from ultrastructural changes to the degeneration
of the distal convoluted tubules (see WHO, 1976b). Male
rats are more sensitive to the renotoxic effect of methyl-
mercury than females (Munro et al., 1980). Renal damage
was also observed in other experimental species. In most
of the dogs that showed clinical and histological signs of
methylmercury-induced neurotoxicity, there were also signs
of renal necrosis, desquamation, and regeneration (Davies
et al., 1977). In the kidneys of methylmercury-intoxicated
guinea-pigs, only swelled epithelial cells in the proximal
tubules were reported (Falk et al., 1974). In cats (Davies
& Nielsen, 1977) and pigs (Davies et al., 1976), only
hyalin and cellular casts were seen. Though treatment of
six monkeys ( Macaca mulatta ) with daily doses of methyl-
mercury (80-120 µg mercury/kg in apple juice) for 3.5-12
months did not affect the general health status adversely,
it caused ultrastructural changes in the kidneys (Chen et
al., 1983). These changes included intracytoplasmic vacu-
oles and electron-dense inclusion bodies. In the same
studies, degenerative changes in the Paneth cells of
intestines were also observed. These changes were most
pronounced in animals killed immediately after exposure
(see also Mottet et al., 1987).
8.2 Reproduction, Embryotoxicity, and Teratogenicity
Methylmercury added in vitro to a suspension of sperm
from untreated monkeys ( Macaca fasicularis ) at 9-15 µg/ml
decreased sperm motility but did not decrease oxygen con-
sumption (Mohamed et al. 1986a,b). In fact, oxygen con-
sumption was increased at the 15 µg/ml concentration when
sperm motility was almost zero. Further studies with
specific inhibitors revealed that mitochondrial energy
production was not affected by mercury. The authors
suggested that the primary effect was on the dynein/micro-
tubule sliding assembly.
Lee & Dixon (1975) reported damage to spermatogenesis
in mice given a methylmercury dose of 1 mg mercury/kg,
much lower doses giving rise to neurological effects. No
special susceptibility to sterility, resulting from pre-
natal exposure, could be detected in mice (Gates et al.,
1986).
When female mice were given a single intraperitoneal
injection of methylmercury chloride (2.5, 5, or 7.5 mg/kg
body weight) prior to mating, dose-related increases in
pre- and early post-implantation fetal losses were
recorded (Verschaeve & Leonard, 1984). This observation
could have a genetic cause or result from physiological
effects on the mother.
Gunderson et al. (1986) treated 11 monkeys ( Macaca
fasicularis ) with daily oral doses of methylmercury in
apple juice (50-70 µg/kg per day) before and during preg-
nancy. The mean blood levels during pregnancy, measured in
each trimester and at delivery, were within the range of
1080-1330 µg/litre, with maximum values within the range
of 1510-1840 µg/litre. The mean blood levels of the
offspring at birth were 1690 µg/litre (range, 880-
2460 µg/litre). When tested 190 days post-conception, the
mean blood levels had fallen to 1040 µg/litre. The ex-
posed animals showed recognition deficits (compared with
10 untreated controls) when administered an adaptation of
a standardized test of visual recognition memory. The same
blood mercury concentration (600-2000 µg/litre) in preg-
nant squirrel monkeys exposed to methylmercury resulted in
a 22.5% (mean of six results) reduction in the cerebral
weight of fetuses (Logdberg et al, 1988). Three months
treatment with daily oral doses of methylmercuric hydrox-
ide (50 or 90 µg/kg) increased the frequency of repro-
ductive failure (i.e., non-conception, abortion) in non-
human primates and decreased the birth weight of their
offspring (Burbacher et al., 1984). Offspring from treated
animals directed significantly less attention to novel
stimuli than did controls.
At doses which are not toxic to the rat dam, prenatal
exposure produced hydrocephalus, decreased thickness of
the cerebral cortex in the parietal section, increased
thickness of the hippocampus in the occipital region
(Kutscher et al., l985), and delayed ossification
(Chmielnicka et al., 1985). A variety of structural
changes, detectable at both the light and electron micro-
scopic levels, were also observed by Reuhl et al.,
(1981a,b). Similar effects have been noted in prenatally
exposed mice where the development of communicating
hydrocephalus was associated causally with aqueductal
stenosis (Choi et al., 1988).
Prenatal exposure at doses not affecting the mother is
known to produce abnormal behaviour in the offspring of
several animal species (Spyker et al., 1972; Bornhausen et
al., 1980; Zimmer et al., 1980; Shimai & Satoh, 1985;
Elsner et al., 1988). The behavioural effects may be the
consequence of an effect on neurotransmitters in the
brain. Thus a single dose of 5.0 mg mercury/kg, given as
methylmercury on postnatal day 2, resulted in increased
serotonin concentration and movement and postural dis-
orders by day 22-24 (O'Kusky et al., 1988). In addition,
Bartolome et al. (1982) showed both acute and long-lasting
effects on the maturation of central catecholamine neuro-
transmitter systems following early postnatal exposure.
Eccles & Annau (1982a,b) demonstrated altered behavioural
sensitivity to amphetamine in adult offspring, and Cuomo
et al. (1984) showed alterations in response to apomorph-
ine.
Prenatal exposure of rodents can produce a variety of
effects on non-nervous tissues. It is well known that the
administration of large doses of methylmercury to pregnant
rodents produces cleft palate (e.g., Lee et al., 1979;
Harper et al., 1981). Prenatal exposure of rats can pro-
duce renal functional abnormalities detectable in off-
spring at 42 days of age (Smith et al., 1983; Slotkin et
al. 1986).
8.3 Mutagenicity and Related End-Points
Methylmercury is capable of causing chromosome damage
in cell cultures (Morimoto et al., 1982; Curle et al.,
1983), in the golden hamster (Watanabe et al., 1982;
Gilbert et al., l983), and in ovulating Syrian hamsters
(Mailhes, 1983). It can induce histone protein pertur-
bations (Gruenwedel & Diaham, 1982) and influence factors
regulating the nucleolus-organizing activity (Verschaeve
et al., 1983). The mutagenic response of V79 Chinese ham-
ster cells to methylnitrosourea is enhanced by methylmer-
cury (Onfelt & Jenssen, 1982). Methylmercury has been
reported to interfere with gene expression in in vitro
cultures of glioma cells at low concentrations (0.05-
0.1 µmol/litre) (Ramanujam & Prasad, 1979). The induc-
tion of non-disjunction and sex-linked recessive lethal
mutations was found in Drosophila melanogaster treated
with methylmercury. Tolerance to methylmercury was corre-
lated with the uptake of mercury and not with the rate of
excretion (Magnusson & Ramel, 1986).
8.4 Carcinogenicity
Methylmercury has been reported to produce renal car-
cinomas in mice given diets containing methylmercury
chloride (15 mg/kg) for about one year (Mitsumori et al.,
1981). Animals given 30 mg/kg died from neurotoxicity
after 6 months. Nixon et al. (1979) found that prenatal
exposure to methylmercury increased the incidence in rats
of neural tumours caused by sodium nitrite and ethylurea.
The mothers had been exposed since weaning to 10 mg
methylmercury/kg diet. These are the only reports of
potential carcinogenicity. Blakley (1984) administered
methylmercury chloride to Swiss mice (0.2, 0.5, or 2
mg/litre drinking-water) for 15 weeks and gave them a
single dose (1.5 mg/kg) of urethane by intraperitoneal
injection at the end of the third week. Methylmercury
produced a dose-related increase in the size of lung aden-
omas induced by urethane. However, only the highest dose
(2 mg/kg) increased the incidence of adenomas. No effects
on weight gain or water consumption related to methylmer-
cury treatment were seen.
8.5 Special Studies
Kato et al. (1981) reported that the detection of
electro-oculographic changes in monkeys is one of the most
sensitive indices of methylmercury effects. Using high
doses of methylmercury, Wassick & Yonovitz (1985) demon-
strated auditory deficits over a 4- to 78-kHz frequency
range in mice. Methylmercury is known to affect auditory
performance in human beings (section 9.1).
Methylmercury has been found to depress both primary
and secondary immune responses in rodents (Koller & Roan,
1980; Koller et al., 1980). Other effects reported in ani-
mal studies include impairment of adrenal and testicular
function in rats (Burton & Meikle, 1980), impairment of
thyroid function in mice (Kawada et al., 1980), and im-
pairment of sleep-walking rhythms in rats (Arito et al.,
1983). Effects of methylmercury on glucose transport,
glucose metabolism, and blood flow in the central nervous
system were described by Hargreaves et al. (1986).
Long-term treatment of Brown-Norway rats produces
proteinuria (Bernaudin et al., 1981). This strain is
genetically susceptible to immune-mediated renal damage
produced by inorganic mercury.
8.6 Factors Modifying Toxicity; Toxicity of Metabolites
Several substances have been found to affect the
chronic toxicity of methylmercury. Of these, selenium,
usually administered to animals as sodium selenite, has
been the most widely studied, following the first report
by Ganther et al. (1972). In general, selenium has a
protective action in that it delays the onset of
methylmercury toxicity or reduces the severity of its
effects (Chang & Suber, 1982). Simultaneous administration
of sodium selenite to mice during pregnancy was found to
protect the offspring from effects on developmental
reflexes caused by a 6 mg/kg dose of methylmercury given
on day 9 (Satoh et al., 1985). In mice given selenium
(11.6 nmol/ml in the drinking-water) before and after
gestation, the incidence of methylmercury-induced resorp-
tion was increased. The incidence of cleft palate in mice
was not affected by excess selenium (Nobunaga et al.,
1979) nor by selenium deficiency (Nishikido et al.,
1988a), but selenium deficiency enhanced the fetal tox-
icity of methylmercury (Nishikido et al., 1987).
Another antioxidant, vitamin E, has also been found
to be protective against methylmercury toxicity in both
normal and selenium-deficient rats (Chang et al., 1978;
Welsh, 1979). The antioxidant N,N'-diphenyl-p-phenyly-
lenediamine, however, was more protective than vitamin E.
The latter also protected against the in vitro damage
caused by methylmercury to chromosomes in human blood
cells (Morimoto et al., 1982), hamster fibroblast cells
(Gilbert et al., 1983), and glioma cells (Prasad &
Ramanujam, 1980). Phospholipids have been reported to
protect against the in vitro action of methylmercury on
rat liver enzymes (Magnaval & Batti, 1980). The signifi-
cance of these findings to human health is not clear, as
high doses were used and methylmercury poisoning in
rodents may not be the same as in human beings. Moreover
selenite only delays the onset of methylmercury intoxi-
cation (Chang & Suber, 1982) and is not the form of
selenium found in human diets. Though selenium in marine
food may have the same protective action as selenite
(Newberne et al., 1972; Ohi et al., 1980; Thrower &
Andrewartha, 1981), the bioavailability of biological
selenium for reaction with mercury is less than that of
selenite (Magos et al., 1984) and its potential, free from
other dietary effects, to delay the onset of methylmercury
intoxication has not been proved.
Ethanol has been found to potentiate the effects of
methylmercury in rats (Turner et al., 1981). This single
finding should be investigated further, preferentially in
primates, as it could have considerable public health sig-
nificance.
Yamini & Sleight (1984) found that guinea-pigs on a
diet deficient in vitamin C suffered more severe neuro-
logical damage when exposed to 44 mg methylmercury/kg in
their diet for 20 days than controls fed a diet with
adequate vitamin C.
It has been postulated that methylmercury might pro-
duce its effects via cleavage of the mercury-carbon bond
(Ganther, 1978). This could produce free radicals, causing
lipid peroxidation. This might explain the protective
action of vitamin E and selenium. Inorganic mercury
released from methylmercury might be the actual toxic
species. However ethylmercury, which decomposes faster and
raises inorganic mercury concentration in the brain to a
higher level than does methylmercury, produces less brain
damage at equal doses (Magos et al., 1985a).
9. EFFECTS ON MAN
9.1 General Population Exposure
The effects of methylmercury on the adult differ both
quantitatively and qualitatively from effects seen after
prenatal and, possibly, postnatal exposure. Thus, effects
on adults will be treated separately from effects on
developing tissues.
9.1.1 Effects on adults
The effects of methylmercury on adult human beings
have been thoroughly described in Environmental Health
Criteria 1: Mercury (WHO, 1976b). They will be summarized
here with relevant new material added as appropriate.
9.1.1.1 Effects on the nervous system
The nervous system is the principal target tissue for
the effects of methylmercury on adult human beings. The
sensory, visual, and auditory functions, together with
those of the brain areas, especially the cerebellum, con-
cerned with coordination, are the most common functions to
be affected. The earliest effects are non-specific symp-
toms, such as complaints of paraesthesia, malaise, and
blurred vision. Subsequently, signs appear such as concen-
tric constriction of the visual field, deafness, dysar-
thria, and ataxia. In the worst cases, the patient may go
into a coma and ultimately die. In less severe cases, some
degree of recovery in each symptom occurs; this is
believed to be a functional recovery that depends on the
compensatory function of the central nervous system. The
subjective complaint of paraesthesia was found to be a
permanent symptom in patients exposed in the Japanese
outbreak, whereas in the Iraqi outbreak, paraesthesia was
transient in many cases. The reason for this difference
is not known.
At high doses, methylmercury affects the peripheral
nervous system (Rustam et al., 1975). In Iraq, patients
had symptoms of neuromuscular weakness that could be
ameliorated by treatment with acetylcholinesterase inhibi-
tors.
Methylmercury poisoning has several important fea-
tures:
- a long latent period usually lasting several months;
- damage almost exclusively limited to the nervous sys-
tem, especially the central nervous system;
- areas of damage to the brain are highly localized
(focal), e.g., in the visual cortex and the granular
layer of the cerebellum, especially in the infolded
regions (sulci);
- effects in severe cases are irreversible due to de-
struction of neuronal cells;
- the earliest effects are non-specific subjective com-
plaints, such as paraesthesia, blurred vision, and
malaise.
9.1.1.2 Effects on non-nervous tissue
The only effect on human beings not involving the ner-
vous system is the claim that chromosome damage is associ-
ated with long-term exposure to methylmercury (Wulf et
al., 1986). No further reports have appeared on this sub-
ject since the review in Environmental Health Criteria 1:
Mercury (WHO, 1976b).
9.1.2 Effects on developing tissues
9.1.2.1 Effects on the nervous system
Observations on both human subjects and animals indi-
cate that the developing central nervous system is more
sensitive to damage from methylmercury than the adult ner-
vous system. The first indications arose from the outbreak
of methylmercury poisoning in Minamata, Japan, in the
1950s, when it was found that mothers who were slightly
poisoned gave birth to infants with severe cerebral palsy.
Subsequent studies on experimental animals confirmed the
increased sensitivity of the fetus. The Iraqi outbreak in
1971-1972 resulted in cases of severe damage to the cen-
tral nervous system in infants prenatally exposed. More
recent follow-up studies in Iraq indicated a milder syn-
drome at lower dose levels (Marsh et al., 1980). In fact,
it has been possible to demonstrate a relationship between
the maximum hair level in the mothers during pregnancy
and the frequency of abnormalities in their infants (Marsh
et al., 1981).
The clinical picture is dose dependent. In those in-
fants who have been exposed to high maternal blood levels
of methylmercury, the picture is of cerebral palsy indis-
tinguishable from that caused by other factors. Microceph-
aly, hyperreflexia, and gross motor and mental impairment,
sometimes associated with blindness or deafness, is the
main pattern (for review, see WHO, 1976b). Milder degrees
of the affliction are not easy to diagnose during the
first few months of life, but they later become clear.
Patients show mainly psychomotor impairment and persist-
ence of pathological reflexes (Marsh et al., 1977, 1980,
1981; McKeown-Eyssen et al., 1983). Milder cases have
findings quite similar to the findings in the minimal
brain damage syndrome.
Post-mortem observations in Japan indicated that
damage is generalized throughout the brain in the case of
prenatal exposure, in contrast to adult exposure where
focal lesions are predominant. The Japanese cases of pre-
natal poisoning indicated disturbed development in the
cytoarchitecture of the brain and the brain size was dim-
inished in severe cases. Similar pathological findings
were reported on autopsies of two prenatally exposed Iraqi
infants (Choi et al., 1978). The pathological findings in
these studies were attributed to incomplete and abnormal
migration of neuronal cells to the cerebellar and cerebral
cortices (section 9.3.2).
9.2 Occupational Exposure
This type of exposure was reviewed in Environmental
Health Criteria 1: Mercury (WHO, 1976b). No new infor-
mation has become available. In fact, occupational ex-
posure results in effects similar to those reviewed in
section 9.1 (e.g., Hunter & Russell, 1954).
9.3 Mechanisms of Toxicity
Section 9 is concerned with effects on human beings.
However, in discussing mechanisms of methylmercury tox-
icity, animal and other experimental data are used where
they throw light on how damage is inflicted on the human
organism.
9.3.1 The mature organism
9.3.1.1 Mechanism of selective damage
The mechanism of selective damage is not well under-
stood. In a review of publications, Syversen (1982)
claimed that the selective effects relate to the ability
of certain cells in the central nervous system to repair
the damage initially inflicted by methylmercury. Thus,
those cells capable of repairing injury survive, whereas
those cells that lack the facility to repair the damage
are the ones that are destroyed. For example, the small
granule cells in the cerebellum lack the repair capacity
and are the first cells in that area of the brain to
succumb. Jacobs et al. (1977) noted that the small neurons
in the central nervous system appear to be especially vul-
nerable. Such cells have very little cytoplasm and only
limited protein synthetic machinery to carry out repair.
On the other hand, Berlin (1986) has proposed that selec-
tive damage results from the inter-neuronal axonal trans-
port of methylmercury. Thus, the sensory centres, e.g., in
the visual cortex, are affected because axonal transport
is in the afferent direction leading to a local accumu-
lation of methylmercury. The motor systems are relatively
unaffected by methylmercury because axonal transport is
in the efferent direction leading to removal of mercury
from the motor areas.
9.3.1.2 The latent period
The reason for the long latent period is not under-
stood. The mean latent period ranged from 16 to 38 days
in Iraq, and, in many cases, initial symptoms appeared
after the cessation of intake of contaminated bread. In
the Japanese outbreaks, it was difficult to determine the
exact latent period because in many cases the starting
point of intake was unclear. However, in some cases in
Japan, a very long latent period (up to several years) was
reported (WHO, 1980). Included in these cases were some
patients who showed only slight signs and symptoms but who
later developed the clinical features of severe poisoning
after they had stopped eating the polluted fish. In the
same period of time, the other patients showed relative
improvement or progression. A latent period of several
years may be partially explained by psychogenic overlay,
which modifies the symptoms, or by sub-clinical lesions,
which may be revealed by the aging factor. However, slow
accumulation in the brain of methylmercury (or of inor-
ganic mercury split off from the methylmercury) cannot be
the explanation.
9.3.1.3 Cellular and molecular mechanisms
Since the publication of Environmental Health Criteria
1: Mercury (WHO, 1976b), numerous studies on the mechanism
of action at the cellular and molecular levels have been
reported (Clarkson, 1983; Berlin, 1986). Inhibition of
protein synthesis in target nerve cells is a well docu-
mented effect in animals that appears before the first
clinical signs of intoxication (Yoshino et al., 1966;
Carmichael et al., 1975; Omata et al., 1980, 1982;
Syversen, 1982; Fair et al., 1987). It occurs also in
vitro before other cellular functions are affected (Nakada
et al., 1980; Sarafian et al., 1984).
Verity and his colleagues (Cheung & Verity, 1985;
Sarafian & Verity, 1985, 1986) have identified the step in
protein synthesis that is most sensitive to methylmercury.
The peptide-elongation process can be affected at high
levels of methylmercury, but the first stage of synthesis,
associated with transfer RNA, may be the most sensitive.
It appears that the inhibition of protein synthesis is
general; there is no selective inhibition of formation of
any special proteins or group of proteins.
The reason for the special sensitivity of protein
synthesis to methylmercury is not known. Jacobs et al.
(1977) noted that the mammalian ribosome contains 120
sulfhydryl groups, of which about half are exposed and
reactive during peptide formation, and that the chain-
initiation factor is strongly inhibited by sulfhydryl
reagents, at least in the case of bacteria. They suggested
that the sulfhydryl groups of active ribosomes are more
vulnerable than those in other proteins, where disulfide
bridge formation may predominate. Methylmercury also
interferes with lipids (Nakada & Imura, 1983; Ando et al.,
1985), myelin (Ganser & Kirschner, 1985), mitochondrial
DNA synthesis (Miller et al., 1985), and glutathione per-
oxidase (Hirota et al., 1980).
Effects on neurotransmitters and receptors (Kobayashi
et al., 1979, 1981; Concas et al., 1983), lipids
(Macfarlane, 1981; Rebel et al., 1983; Leblanc et al.,
1984), adenyl cyclase activity (Spuhler & Prasad, 1980),
membrane structure (Kasuya, 1980), and on the integrity of
microtubules have been reported in a variety of experimen-
tal systems (Araki et al., 1981; Nakada & Imura, 1982;
Sager et al., 1981a,b). Methylmercury inhibits amino acid
transport in rat brain microvessels at concentrations
similar to those known to cause toxicity in humans
(Tayarani et al., 1988). Changes in glucose transport
across the blood-brain barrier in rats have been observed
in the latent period before overt signs of methylmercury
intoxication appear (Hargreaves et al., 1986). When given
systemically, methylmercury accelerates axonal transport
of proteins in the optic nerve (Aschner, 1986). However,
when it is given by intra-ocular injection, methylmercury
inhibits protein transport along the optic nerve (Aschner
et al., 1986). The relevance of the above findings to the
pathogenesis of methylmercury poisoning is still a matter
of speculation.
Perhaps more firmly established is the connection be-
tween muscular weakness seen in severe cases of poisoning
in the Iraqi outbreak and the inhibition of acetylcholine
transmission at the neuromuscular junction (Von Burg &
Landry, 1976; Shamoo et al., 1976; Atchison & Narahashi,
1982; Quandt et al., 1982; Atchison, 1986). The stimu-
latory action of methylmercury on the miniature endplate
potentials of the neuromuscular junction appears to result
from the loss of calcium ions from the nerve terminal
mitochondria (Levesque & Atchison, 1988).
9.3.2 Developing tissues
Post-mortem observations derived from the Japanese and
Iraqi outbreaks suggested that the severe prenatal effects
seen resulted from incomplete and abnormal migration of
neuronal cells to the cerebellar and cerebral cortices. In
support of their autopsy findings indicating abnormal
neuronal migration, Choi et al. (1979) noted that methyl-
mercury inhibited the in vitro migration and movement of
cultured human cells. Changes in astrocyte membranes and
in motility were also observed in cultures when methylmer-
cury was added (Choi & Lapham, 1980). The ability of
methylmercury to damage astrocytes in vitro was confirmed
by findings of decreased DNA synthesis (Choi et al., 1980;
Choi & Kim, 1984). The toxic effect on astrocytes may be
relevant to the pathological picture, since these cells
are believed to play a role in supporting normal neuronal
migration in the developing brain (Choi & Lapham, 1976).
More recently, Peckham & Choi (1986) showed that methyl-
mercury alters the anionic surface charge on cultured
fetal mouse astrocytes. Cell-to-cell recognition processes
were found to be affected in aggregates of mouse cerebel-
lar cells (Jacobs et al., 1986). The authors suggested
that the mechanism involved depressed synthesis of
specific proteins followed by alterations in microtu-
bules.
A second general mechanism by which brain development
could be impaired is the inhibition of cell division (Chen
et al., 1979; Sager et al., 1982, 1983; Rodier et al.,
1984; Slotkin et al., 1985; Howard & Mottet, 1986; Vogel
et al., 1986). Inhibition of cell proliferation probably
explains the production of cleft palates in rats (Lee et
al., 1979; Olson & Massaro, 1980), although this effect
has not been seen in humans. Methylmercury is known to
inhibit cell division by causing metaphase arrest, similar
to that observed with colchicine, presumably by disruption
of the mitotic spindle (Onfelt, 1983). Both spindle micro-
tubules (Miura et al., 1978) and cytoplasmic microtubules
in cultured rat glioma cells (Imura et al., 1980; Miura &
Imura, 1987) and human fibroblasts (Sager et al., 1983)
are disrupted by methylmercury. Damage to the microtubule
system appears to underly the toxic effects of methylmer-
cury on lymphocytes (Brown et al., 1988). Sager & Matheson
(1988) have shown that disassembly of microtubules pre-
cedes changes in other elements. In vitro polymerization
of microtubules is also inhibited by methylmercury (Abe et
al., 1975; Imura et al., 1980; Sager et al., 1983; De
Saint-Georges et al., 1984; Miura et al., 1984). The
effect on microtubules appears to be selective and does
not involve other components of the cytoskeleton (e.g.,
vimentin or actin filaments) (Sager, 1988). Vogel et al.
(1985) suggested that methylmercury binds to free sulf-
hydryl groups on the ends and on the surface of microtu-
bules.
Sager et al. (1982, 1984) hypothesized that methylmer-
cury might arrest the division of immature neurons at
critical stages of brain development. They administered
methylmercury to newborn mice at a time when the external
granule layer (EGL) of the cerebellar cortex was rapidly
dividing. They found fewer granule cells in the treated
animals as well as a decrease in the percentage of late
mitotic figures. This incomplete mitosis may have been
responsible for the decreased cell numbers.
Destruction or arrest of neuron growth during the
development of the central nervous system may be an im-
portant general mechanism in the pathobiology of prenatal
damage (Rodier, 1977). The deranged cell migration
reported by Choi et al. (1978) and the arrested cell div-
ision found by Sager et al. (1984) might both be an
expression of the action of methylmercury on microtubules
and thus be consistent with the hypothesis that microtu-
bule protein is an important molecular target for methyl-
mercury in the developing brain.
Enzymes associated with myelin formation have been
found to be affected in the early postnatal period in rats
(Grundt & Neskovic, 1985). Morphological de-differen-
tiation of cultured brain cells has been shown to occur
after addition of methylmercury (Grundt et al., 1981,
1982). These effects occur at lower methylmercury levels
than those affecting energy metabolism (Grundt & Bakken,
1986).
Choi et al. (1981) noted incomplete arborization of
the dendritic tree of Purkinje cells in mice dosed with
methylmercury in the early postnatal period.
9.3.3 Summary
In summary, the clinical and epidemiological evidence
indicates that prenatal life is more sensitive to the toxic
effects of methylmercury than is adult life. The inhibition of
protein synthesis is one of the earliest detectable biochemical
effects in the adult brain, though the sequence of events
leading to overt damage is not yet understood. Methylmercury
can also react directly with important receptors in the nervous
system, as shown by its effect on the acetylcholine receptor in
the peripheral nerves. Concerning prenatal exposure, the
effects of methylmercury seem to be quite different and of a
much more general basic nature. It affects normal neuronal
development and leads to altered brain architecture, hetero-
topic cells, and decreased brain size. Methylmercury may also
be exerting an effect, perhaps through inhibition of the micro-
tubular system, on cell division during critical stages of
formation of the central nervous system.
9.4 Dose-Effect and Dose-Response Relationships in Human Beings
The relationships between concentrations in indicator
media (e.g., blood and hair) or body burdens and the mag-
nitude of an effect or frequency of an effect (response)
were discussed in Environmental Health Criteria 1: Mercury
(WHO, 1976b) using data from the Japanese and Iraqi out-
breaks. They will be summarized here and considered in
conjunction with studies reported subsequently. Other
extensive and detailed reviews have been published since
1976 (Tsubaki & Irukayama, 1977; Inskip & Piotrowski,
1985; Tsubaki & Takahashi, 1986).
Prenatal and adult exposures will be treated separ-
ately in view of the differences, both qualitative and
quantitative, in effects and dose-response relationships.
9.4.1 Adult exposure
This section will examine new data published since
1976 and include a re-analysis of samples of hair, brain,
and other tissues obtained from patients in Minamata and
Niigata, Japan, the clinical follow-up of individuals
exposed to methylmercury in Niigata, a new analysis of the
Iraqi data, and reports on high fish consumers in Canada
and elsewhere.
9.4.1.1 The Minamata and Niigata outbreaks
Many of the original samples collected in Minamata and
Niigata, Japan, had been analysed by the dithizone pro-
cedure. Previous risk estimates were based on blood and
hair mercury levels measured by this procedure. Tsubaki
et al. (1978) reported on the repeat analysis of a hair
sample from the patient in Niigata with the lowest hair
mercury concentration at the onset of symptoms
(52 µg/g). Re-analysis by atomic absorption yielded a
value of 82.6 µg/g. Other hair samples collected from
Niigata yielded values of about 100 µg/g for the onset of
symptoms. As for blood samples, none were available for
re-analysis by atomic absorption. The patient with the
lowest blood level had a concentration of just below
200 µg/litre when extrapolated to time of onset of
symptoms. However, the extrapolation used in Environmental
Health Criteria 1: Mercury (WHO, 1976b) was based on a few
points only, and the statistical uncertainty in the
extrapolated value was high. Furthermore, the hair samples
from the same patient indicated that the blood concen-
tration was probably higher. Other blood samples extrapo-
lated to values above 300 µg/litre. Further evidence by
Tsubaki et al. (1978) indicates that hair and blood mer-
cury levels at the onset of symptoms may not have been the
true maximum values in these patients. Analyses of hair
samples from Niigata indicate that the mercury concen-
trations may have attained peak values about 2 months
before the onset of symptoms. A stringent government
warning against the consumption of contaminated fish was
issued by June 1965; in many patients, symptoms appeared
about 2 months later (WHO, 1980).
Such evidence indicates that previous evaluations of
the earlier data from Niigata may have underestimated the
blood and hair concentrations associated with poisoning in
the most sensitive patient and, therefore, overestimated
the risk of poisoning. However, it should be noted that
the atomic absorption method does need not always yield
higher results than the dithizone method. Tsubaki et al.
(1978) quote data from two hair samples in which agreement
between the two results was excellent. Furthermore, the
brain and other tissues were preserved for many years
before the atomic absorption measurements were made
(1973), whereas the dithizone method was used on fresh
tissue (1956-1960).
Information from the clinical follow-up from Niigata
(Tsubaki & Irukayama, 1977; Tsubaki et al., 1978) suggests
that there may be a latent period of several years between
peak mercury concentrations and onset of symptoms. Such a
latent period was reported in four patients whose maximum
hair concentrations were in the range of 50-300 mg/kg, as
measured by atomic absorption (Tsubaki et al., 1978). The
results of studies on primates indicate latent periods of
up to 1 year under conditions of continuous exposure.
These latent periods are apparently dose dependent in ani-
mals (Evans et al., 1977). A relationship between length
of latent period and maximum hair concentrations was not
apparent in the few Niigata cases. The delayed cases were
mild, showing non-specific symptoms, so that cases of
methylmercury poisoning could not be diagnosed with com-
plete certainty. Follow-up studies examining mortality
patterns in the Minamata population, including both
poisoning cases and controls, did not reveal any clear
pattern of mercury-related deaths (Tamashiro et al., 1984,
1986, 1987).
9.4.1.2 The Iraqi outbreak
This outbreak of mass poisoning took place in the
winter of 1971-1972 (Bakir et al., 1973; Kazantzis et al.,
1976a,b; Al-Mufti et al., 1976; Greenwood, 1985). Seed
grain treated with a methylmercury fungicide was used to
prepare homemade bread in rural communities throughout the
country. Consumption probably began in October-November,
1971, and the first cases of severe poisoning were admit-
ted to hospital at the end of December, 1971. Total hospi-
tal admissions rose to just over 6000, with most of these
occurring in January, 1972. Over 400 deaths attributed to
methylmercury were recorded in hospital. Both sexes and
all ages were affected. Individual exposure ranged from
a low non-toxic intake (when a few contaminated loaves
were consumed) to prolonged daily intake (1-2 months),
which in some cases produced severe signs of poisoning.
The first effects were complaints of paraesthesia or
malaise, followed by signs of ataxia, constriction of
visual fields, and hearing loss. Some people experienced
muscular weakness, which improved after treatment with an
acetylcholinesterase inhibitor. Changes in peripheral
nerve velocity were recorded in some severe cases. How-
ever, most of the signs and symptoms were attributed to
damage to the central nervous system. Effects on non-
nervous tissue appeared to be absent or negligible.
Early in the outbreak, it was noted that some pre-
natally exposed infants showed signs of severe cerebral
palsy similar to the cases reported in the Minamata out-
break (Amin-Zaki et al., 1974). Later, more subtle effects
on the developing nervous system were detected (Marsh et
al., 1980). Fig. 2, reproduced from Environmental Health
Criteria 1: Mercury (WHO, 1976b), demonstrates both dose-
effect and dose-response relationships. For any given sign
or symptom, e.g., paraesthesia, there is a background
frequency indicated by the line parallel to the horizontal
axis. Two scales are given for the horizontal axis because
two different methods were used to estimate the maximum
body burden. At higher values of the body burden, the
frequency of response rises in proportion to the logarithm
of the body burden (the horizontal axis has a logarithmic
scale). The two lines (the horizontal and sloped line)
form the shape of a "hockey stick", and this type of
dose-response analysis is referred to by this name.
The body burden corresponding to the point of inter-
section of the two lines in the "hockey stick" was
referred to as a "practical threshold" by the authors
(Bakir et al., 1973). This threshold increases with
increasing severity of the effects. Thus, using the upper
scale in Fig. 2, the threshold for paraesthesia occurs at
a body burden of about 25 mg, for ataxia at about 50 mg,
for dysarthria at about 90 mg, for hearing loss at about
180 mg, and for death at over 200 mg.
The dose-response relationship is illustrated by the
"hockey-stick" line for each sign and symptom. Thus, the
increase in frequency of paraesthesia increases in pro-
portion to the log of the maximum body burden above the
practical threshold. This increase is assumed to be caused
by methylmercury. In fact, the only proof that methylmer-
cury produced certain effects in this population is that:
(a) these effects followed a known high exposure to
methylmercury; (b) the frequency and severity of these
effects increased with increasing exposure to methylmer-
cury; (c) these effects are similar to those seen in other
outbreaks of methylmercury poisoning; and (d) the major
signs have been reproduced in some animal models.
 This cause-effect relationship is most difficult to
establish at body burdens close to threshold levels. Here,
the only effect may be the patient's complaint of paraes-
thesia. This is a non-specific end-point that has a
variety of causes other than methylmercury. The overall
conclusion depends on a group-based statistical associ-
ation between paraesthesia and exposure to methylmercury.
Fig. 2 shows that the practical threshold value for par-
aesthesia is a body burden of 25-40 mg mercury. Using the
metabolic model discussed in section 6, the body burden of
25-40 mg mercury is equivalent to a blood level of 250-
400 µg/litre. This range of blood values compares favour-
ably with the lowest-observed-effect level in Niigata. The
"hockey-stick" analysis depicted in Fig. 2 implies the
existence of a population threshold for the neurological
effects of methylmercury in adults. Though the true popu-
lation threshold cannot be determined, "the practical
threshold" serves as an estimate of the population
threshold.
A re-analysis of Iraqi data has been published by
Nordberg & Strangert (1976, 1978, 1982). This analysis
assumed a continuous distribution of individual thresholds
superimposed on a background frequency for such symptoms
as paraesthesia. The analysis also took into account the
inter-individual variation in whole-body biological half-
times. The half-time was used together with other par-
ameters of the metabolic model for methylmercury to esti-
mate blood concentrations that would result from long-term
daily intake of methylmercury. In turn, the blood levels
can be related to the maximum body burdens by the distri-
bution parameters presented in section 6. Thus, these two
distributions of thresholds and biological half-times were
combined to give an overall estimate of the risk of par-
aesthesia for a given steady-state daily intake of methyl-
mercury. The results are presented in Fig. 3. The calcu-
lations indicate that an intake of 50 µg/day in an adult
would involve a risk of about 0.3% of the symptoms of par-
aesthesia, whereas an intake of 200 µg/day would involve
a risk of about 8%. As pointed out by Nordberg & Strangert
(1976, 1978, 1982), the background frequency of these non-
specific symptoms, such as paraesthesia, plays a key role
in determining the accuracy of the estimates of response
of low frequencies. From the same Iraqi data, the authors
estimated the background frequency of paraesthesia to be
6.3%. However, there is considerable uncertainty in deter-
mining the precise value of the background frequency, and
this uncertainty becomes the dominant cause of error at
low rates of exposure.
This cause-effect relationship is most difficult to
establish at body burdens close to threshold levels. Here,
the only effect may be the patient's complaint of paraes-
thesia. This is a non-specific end-point that has a
variety of causes other than methylmercury. The overall
conclusion depends on a group-based statistical associ-
ation between paraesthesia and exposure to methylmercury.
Fig. 2 shows that the practical threshold value for par-
aesthesia is a body burden of 25-40 mg mercury. Using the
metabolic model discussed in section 6, the body burden of
25-40 mg mercury is equivalent to a blood level of 250-
400 µg/litre. This range of blood values compares favour-
ably with the lowest-observed-effect level in Niigata. The
"hockey-stick" analysis depicted in Fig. 2 implies the
existence of a population threshold for the neurological
effects of methylmercury in adults. Though the true popu-
lation threshold cannot be determined, "the practical
threshold" serves as an estimate of the population
threshold.
A re-analysis of Iraqi data has been published by
Nordberg & Strangert (1976, 1978, 1982). This analysis
assumed a continuous distribution of individual thresholds
superimposed on a background frequency for such symptoms
as paraesthesia. The analysis also took into account the
inter-individual variation in whole-body biological half-
times. The half-time was used together with other par-
ameters of the metabolic model for methylmercury to esti-
mate blood concentrations that would result from long-term
daily intake of methylmercury. In turn, the blood levels
can be related to the maximum body burdens by the distri-
bution parameters presented in section 6. Thus, these two
distributions of thresholds and biological half-times were
combined to give an overall estimate of the risk of par-
aesthesia for a given steady-state daily intake of methyl-
mercury. The results are presented in Fig. 3. The calcu-
lations indicate that an intake of 50 µg/day in an adult
would involve a risk of about 0.3% of the symptoms of par-
aesthesia, whereas an intake of 200 µg/day would involve
a risk of about 8%. As pointed out by Nordberg & Strangert
(1976, 1978, 1982), the background frequency of these non-
specific symptoms, such as paraesthesia, plays a key role
in determining the accuracy of the estimates of response
of low frequencies. From the same Iraqi data, the authors
estimated the background frequency of paraesthesia to be
6.3%. However, there is considerable uncertainty in deter-
mining the precise value of the background frequency, and
this uncertainty becomes the dominant cause of error at
low rates of exposure.
 The re-analysis by Nordberg & Strangert is in agree-
ment with the conclusions of Environmental Health Criteria
1: Mercury (WHO, 1976b) that the prevalence of the
earliest effects could be expected to be approximately 5%
in the adult population following a long-term daily
methylmercury intake of 3-7 µg mercury/kg body weight.
Such a long-term daily intake should give rise to blood
concentrations of approximately 200 µg mercury/litre and
maximum hair concentrations of about 50 µg mercury/g. It
should be noted that estimates of the frequency of paraes-
thesia below daily intakes of about 200 µg are extrapol-
ations beyond the observed data and assume the absence of
a population threshold.
9.4.1.3 Exposed populations in Canada
More recently, clinical and epidemiological assess-
ments have become available from studies of Canadian
Indian population groups exposed seasonally over a long
period of time to methylmercury through fish consumption.
The levels of exposure, as determined by the analysis of
blood and hair samples (or both), were generally lower
than those in the diagnosed cases of poisoning studied in
Iraq and in the Niigata epidemic in Japan. The highest
blood level of mercury recorded in Canada was
660 µg/litre (Wheatly, 1979).
Harada et al. (1976) clinically examined 89 residents
of two Indian reservations who had been exposed to methyl-
mercury by ingestion of contaminated fish. They found a
number of signs and symptoms that have been associated
with methylmercury intoxication. However, as the authors
pointed out, the signs and symptoms were relatively mild
and many of them were thought to be due to other factors.
In the absence of controls, it is difficult to evaluate
the possible role of methylmercury in the clinical
findings reported in this study.
A report of the Medical Services Branch of the Depart-
ment of National Health and Welfare, Canada, recorded the
clinical examination of 84 subjects who had a history of
blood mercury levels above 100 µg/litre (Wheatley,
1979). Mild symptoms and signs were found that could be
attributed to possible methylmercury exposure, but the
causal relationship between exposure and effects was un-
certain. However, of the 84 subjects examined, 11 cases
were found where such an association could not be
excluded.
A major epidemiological study was carried out on Cree
Indians from northwestern Quebec, Canada, exposed to
methylmercury in fish (McKeown-Eyssen & Ruedy, 1983a,b).
The authors claimed to find an association in adult men
and women between a set of neurological abnormalities and
the estimated exposure to methylmercury. However, it
should be pointed out that this association was seen by
only four of seven observers who reviewed videotaped
recordings of the neurological screening tests. The
severity of these neurological abnormalities is described
as mild or questionable. It was not possible to estimate
any threshold body burden or hair levels because this
population had been exposed possibly for most of their
lives and, therefore, peak values in previous years were
unknown. However, observations on this population over
several years indicated maximum blood concentrations below
600 µg/litre. On examining the reports from these
studies, a WHO expert group (WHO, 1980) pointed to the
potential importance of the long duration of exposure in
the Canadian Indians and raised the possibility that this
might be the first example of an endemic disease due to
exposure to methylmercury.
9.4.1.4 Other fish-eating populations
In addition to the extensive Canadian studies men-
tioned above, some other reports have been published since
1976 on the blood or hair mercury levels in populations
exposed to methylmercury through fish (Bacci et al., 1976;
WHO, 1976b; Riolfatti, 1977 ; Haxton et al., 1979; Turner
et al., 1980; Valciukas et al., 1986). Taking all reports
into consideration, it seems that about 100 adults, who
were exposed to methylmercury in fish, have been ident-
ified outside Japan or Iraq as having had blood levels
above 200 µg/litre. In none of these cases has a diag-
nosis of Minamata disease been made, but it is possible
that some may have suffered mild methylmercury poisoning.
Even if it is assumed that none of these people suffered
any adverse effects from the exposure, such a negative
finding is still consistent (95% confidence level) with
the maximum risk for paraesthesia of about 3%.
9.4.1.5 Special groups
The above-mentioned risk estimates may not apply to
pregnant women. Some severe cases of poisoning among preg-
nant women exposed to high doses were reported in Iraq
(WHO, 1980). At lower doses, transient paraesthesia and
other mild symptoms have been reported (Tsubaki &
Irukayama, 1977; Marsh et al., 1977, 1980, 1981). Maternal
paraesthesia coincided with peak hair concentrations of
methylmercury (Marsh et al., 1987). These observations
suggest a greater risk for pregnant women than for non-
pregnant women.
9.4.1.6 Summary
The overall conclusion is that the reported relationships
between response and body burden, hair, or blood mercury
concentrations are essentially the same as those reported in
Environmental Health Criteria 1: Mercury (WHO, 1976b). It is
possible that the latent period after cessation of exposure
may extend to one year or thereabouts. Pregnant women may
exhibit paraesthesia at lower methylmercury exposure levels
than non-pregnant women, suggesting a greater risk for pregnant
women.
9.4.2 Prenatal exposure
In contrast to the adult exposure situation, a con-
siderable amount of new data has been published on dose-
response relationships for human prenatal exposure. In
1976, when Environmental Health Criteria 1: Mercury (WHO,
1976b) was published, it was known that prenatal exposure
could cause fetotoxic effects in human beings. In the
Minamata outbreak, 23 children believed to be exposed in
utero had severe cerebral involvement (palsy and retar-
dation), whereas their mothers had mild manifestations or
none at all (Takeuchi, 1977). Mercury levels in the
mothers during pregnancy were not recorded (WHO, 1976b).
There were no reports of prenatal poisonings in the
Niigata outbreak. Psychological studies carried out in the
Minamata area with children from elementary schools and
junior high schools did not reveal major defects of IQ,
compared with children from a control area (Harada &
Moriyama, 1977). However, data on maternal exposure were
not available. In another study from Minamata there was a
correlation between mercury levels in umbilical blood and
the occurrence of mental retardation in children (Harada
et al., 1977).
Studies of prenatal exposure to methylmercury based on
populations in Canada, Iraq, and New Zealand have now been
published.
9.4.2.1 Iraq
Since the publication of WHO (1976b), results have
been obtained from a clinical follow-up study on 29
infant-mother pairs in Iraq (Marsh et al., 1977, 1980).
These reports described psychomotor retardation in infants
caused by prenatal exposure (social bias excluded). A re-
lationship was noted between maximum hair concentrations,
measured in 1-cm segments during pregnancy, and the fre-
quency of neurological effects in the infants. These ef-
fects included delayed achievement of developmental mile-
stones with or without neurological signs. The infants
were 4´-5 years of age at the time of last examination.
At hair mercury levels below 180 mg/kg, the infants
showed minimal clinical neurological signs, but there was
clear evidence of effects on psychomotor function, such as
delayed walking or talking (Marsh et al., 1977). The fol-
lowing criteria were adopted for developmental abnormali-
ties:
"motor retardation if the child was not walking at
18 months, speech retardation if not talking by 24
months, mental retardation or seizures (or convulsive-
like attacks) according to the history provided by the
mother, and neurological signs by agreement of the two
examiners. No standards are available for head circum-
ference or height of Iraqi children, so these factors
were evaluated in terms of standard deviations below
the mean for the group".
Subsequently, a more complete report (Marsh et al.,
1981) became available on 84 infant-mother pairs, includ-
ing the 29 pairs described above. The peak maternal hair
levels ranged from 0.4 to 640 mg/kg. Severe neurological
deficits were observed in five children. These severe ef-
fects are illustrated by the case report of one of these
children. At the age of 4 years and 9 months, the child
was blind and deaf and was unable to stand, walk, or talk.
Tonic neck responses were present. All limbs showed an
increase in tone and deep tendon reflexes with extensor
plantar responses and abnormal posture of the wrist.
Microcephaly was present, with a head circumference of
43 cm. The boy's height was 98 cm (Marsh et al., 1977).
These severely affected children had been exposed to
peak maternal levels during the second trimester of preg-
nancy. These findings agree with a histopathological re-
port of Choi et al. (1978), who found evidence of abnormal
neuronal migration in the brain of Iraqi victims exposed
maximally in the third and fourth months of pregnancy.
This is known to be the critical period for neuronal mi-
gration (Sidman & Rakic, 1973).
These reports (Marsh et al., 1977, 1981) were based on
the analysis of 1-cm segments of hair bundles. Peak hair
concentrations probably underestimated the actual peak
blood concentrations due to misalignment of hair strands
during collection and to the differences in growth rates
of individual strands (for further discussion, see
Giovanoli-Jakubczak & Berg, 1974). Furthermore, the ana-
lytical methods used in the hair analysis had a recovery
of 73 ± 10% (Wigfield et al., 1981).
Analysis of these Iraqi hair samples has been repeated
using single-strand sampling and X-ray fluorescence giving
complete recovery (Jaklevic et al., 1978). Detailed re-
sults from the Iraqi outbreak have been reported by Marsh
et al. (1987) are given in the Appendix. The effects in
mothers during pregnancy were mild and transient, the most
frequent symptom being paraesthesia. Symptoms were re-
ported by the mother more frequently as exposure level
increased. The severity of effects in the mother was much
less than that in her offspring. Two of the mothers of the
four most severely affected infants (pair numbers 45, 56,
68, and 70) recalled no symptoms, and the others com-
plained only of transient paraesthesia during pregnancy.
This confirmed the findings of Harada (1968) on infant-
mother pairs in the Minamata outbreak.
According to Marsh et al. (1987), the physical examin-
ation of the children included:
"observation, measurement of head circumference and
body length, cranial nerve signs, speech, involuntary
movements, strength, deep tendon reflexes, plantar
responses, coordination, dexterity, primitive re-
flexes, sensation, posture, and ability to sit, stand,
walk, and run. A scoring system was adopted. When the
neurological examination result was absolutely normal,
the score was 0. In attempting to identify minimal
signs, points were awarded for borderline findings
such as possibly increased reflexes. Scores of 0-3
indicated no definite abnormality. The highest score
in the most severely affected child was 11. The neuro-
logical score was limited to signs found on examin-
ation, and points were not awarded for features of
retardation reported by the mother".
Four cases received a neurological score of 11. The
evidence is strong that these were severe cases of pre-
natal methylmercury poisoning. The lowest-observed maxi-
mum maternal hair level for these severe cases was 404 mg
mercury/kg (mother-infant pair number 56). However, none
of these observed symptoms were specific to prenatal
methylmercury poisoning. The possibility of confounding
factors was considered by the authors:
"Maternal alcohol consumption was not a problem. They
followed the Moslem precept to avoid alcohol, so the
fetal alcohol syndrome was not a consideration. None
of them smoked. The absence of antenatal medical
supervision was uniform, so that no prescription medi-
cation were taken and non-prescription medications
were rarely available. There were no drug-induced
fetotoxic effects to account for. These were agricul-
tural communities with little socio-economic variation
and no evidence of malnutrition".
The evidence that such non-specific symptoms were
caused by methylmercury is based on a statistical corre-
lation of the frequency of these symptoms with methylmer-
cury exposure and the absence of confounding factors. This
was the first report of a milder syndrome of prenatal
methylmercury poisoning, as opposed to the severe cases
discussed above.
An example of one such statistical correlation is
given in Fig. 4. The frequency of a symptom of motor
retardation (delayed onset of walking) is plotted against
the logarithm of the maximum maternal hair concentration
during pregnancy. The continuous line in Fig. 4a gives the
best fit to the data calculated according to a non-
parametric model. The frequency of response increases
smoothly from virtually zero at a maternal hair mercury
level of 5 mg/kg to approximately 70% at the highest con-
centration. The shaded area is made up of individual 95%
confidence limits for the individual response frequencies.
The narrow confidence limits at the lowest hair levels
(about 1 mg/kg) indicate a low background response fre-
quency of less than 5%. Marsh et al. (1987) noted that, in
five European countries, 10% of infants were not walking
by the age of 16 months and 5% of a sample of infants in
Paris, France, were not walking by 18 months, this being
the criterium used in their study.
Fig. 4. The relationship between the maximal maternal hair concentrations
during pregnancy and the frequency of cases of motor retardation in
offspring. Calculated from data in the Appendix according to the
method of Cox et al. (1989).
The re-analysis by Nordberg & Strangert is in agree-
ment with the conclusions of Environmental Health Criteria
1: Mercury (WHO, 1976b) that the prevalence of the
earliest effects could be expected to be approximately 5%
in the adult population following a long-term daily
methylmercury intake of 3-7 µg mercury/kg body weight.
Such a long-term daily intake should give rise to blood
concentrations of approximately 200 µg mercury/litre and
maximum hair concentrations of about 50 µg mercury/g. It
should be noted that estimates of the frequency of paraes-
thesia below daily intakes of about 200 µg are extrapol-
ations beyond the observed data and assume the absence of
a population threshold.
9.4.1.3 Exposed populations in Canada
More recently, clinical and epidemiological assess-
ments have become available from studies of Canadian
Indian population groups exposed seasonally over a long
period of time to methylmercury through fish consumption.
The levels of exposure, as determined by the analysis of
blood and hair samples (or both), were generally lower
than those in the diagnosed cases of poisoning studied in
Iraq and in the Niigata epidemic in Japan. The highest
blood level of mercury recorded in Canada was
660 µg/litre (Wheatly, 1979).
Harada et al. (1976) clinically examined 89 residents
of two Indian reservations who had been exposed to methyl-
mercury by ingestion of contaminated fish. They found a
number of signs and symptoms that have been associated
with methylmercury intoxication. However, as the authors
pointed out, the signs and symptoms were relatively mild
and many of them were thought to be due to other factors.
In the absence of controls, it is difficult to evaluate
the possible role of methylmercury in the clinical
findings reported in this study.
A report of the Medical Services Branch of the Depart-
ment of National Health and Welfare, Canada, recorded the
clinical examination of 84 subjects who had a history of
blood mercury levels above 100 µg/litre (Wheatley,
1979). Mild symptoms and signs were found that could be
attributed to possible methylmercury exposure, but the
causal relationship between exposure and effects was un-
certain. However, of the 84 subjects examined, 11 cases
were found where such an association could not be
excluded.
A major epidemiological study was carried out on Cree
Indians from northwestern Quebec, Canada, exposed to
methylmercury in fish (McKeown-Eyssen & Ruedy, 1983a,b).
The authors claimed to find an association in adult men
and women between a set of neurological abnormalities and
the estimated exposure to methylmercury. However, it
should be pointed out that this association was seen by
only four of seven observers who reviewed videotaped
recordings of the neurological screening tests. The
severity of these neurological abnormalities is described
as mild or questionable. It was not possible to estimate
any threshold body burden or hair levels because this
population had been exposed possibly for most of their
lives and, therefore, peak values in previous years were
unknown. However, observations on this population over
several years indicated maximum blood concentrations below
600 µg/litre. On examining the reports from these
studies, a WHO expert group (WHO, 1980) pointed to the
potential importance of the long duration of exposure in
the Canadian Indians and raised the possibility that this
might be the first example of an endemic disease due to
exposure to methylmercury.
9.4.1.4 Other fish-eating populations
In addition to the extensive Canadian studies men-
tioned above, some other reports have been published since
1976 on the blood or hair mercury levels in populations
exposed to methylmercury through fish (Bacci et al., 1976;
WHO, 1976b; Riolfatti, 1977 ; Haxton et al., 1979; Turner
et al., 1980; Valciukas et al., 1986). Taking all reports
into consideration, it seems that about 100 adults, who
were exposed to methylmercury in fish, have been ident-
ified outside Japan or Iraq as having had blood levels
above 200 µg/litre. In none of these cases has a diag-
nosis of Minamata disease been made, but it is possible
that some may have suffered mild methylmercury poisoning.
Even if it is assumed that none of these people suffered
any adverse effects from the exposure, such a negative
finding is still consistent (95% confidence level) with
the maximum risk for paraesthesia of about 3%.
9.4.1.5 Special groups
The above-mentioned risk estimates may not apply to
pregnant women. Some severe cases of poisoning among preg-
nant women exposed to high doses were reported in Iraq
(WHO, 1980). At lower doses, transient paraesthesia and
other mild symptoms have been reported (Tsubaki &
Irukayama, 1977; Marsh et al., 1977, 1980, 1981). Maternal
paraesthesia coincided with peak hair concentrations of
methylmercury (Marsh et al., 1987). These observations
suggest a greater risk for pregnant women than for non-
pregnant women.
9.4.1.6 Summary
The overall conclusion is that the reported relationships
between response and body burden, hair, or blood mercury
concentrations are essentially the same as those reported in
Environmental Health Criteria 1: Mercury (WHO, 1976b). It is
possible that the latent period after cessation of exposure
may extend to one year or thereabouts. Pregnant women may
exhibit paraesthesia at lower methylmercury exposure levels
than non-pregnant women, suggesting a greater risk for pregnant
women.
9.4.2 Prenatal exposure
In contrast to the adult exposure situation, a con-
siderable amount of new data has been published on dose-
response relationships for human prenatal exposure. In
1976, when Environmental Health Criteria 1: Mercury (WHO,
1976b) was published, it was known that prenatal exposure
could cause fetotoxic effects in human beings. In the
Minamata outbreak, 23 children believed to be exposed in
utero had severe cerebral involvement (palsy and retar-
dation), whereas their mothers had mild manifestations or
none at all (Takeuchi, 1977). Mercury levels in the
mothers during pregnancy were not recorded (WHO, 1976b).
There were no reports of prenatal poisonings in the
Niigata outbreak. Psychological studies carried out in the
Minamata area with children from elementary schools and
junior high schools did not reveal major defects of IQ,
compared with children from a control area (Harada &
Moriyama, 1977). However, data on maternal exposure were
not available. In another study from Minamata there was a
correlation between mercury levels in umbilical blood and
the occurrence of mental retardation in children (Harada
et al., 1977).
Studies of prenatal exposure to methylmercury based on
populations in Canada, Iraq, and New Zealand have now been
published.
9.4.2.1 Iraq
Since the publication of WHO (1976b), results have
been obtained from a clinical follow-up study on 29
infant-mother pairs in Iraq (Marsh et al., 1977, 1980).
These reports described psychomotor retardation in infants
caused by prenatal exposure (social bias excluded). A re-
lationship was noted between maximum hair concentrations,
measured in 1-cm segments during pregnancy, and the fre-
quency of neurological effects in the infants. These ef-
fects included delayed achievement of developmental mile-
stones with or without neurological signs. The infants
were 4´-5 years of age at the time of last examination.
At hair mercury levels below 180 mg/kg, the infants
showed minimal clinical neurological signs, but there was
clear evidence of effects on psychomotor function, such as
delayed walking or talking (Marsh et al., 1977). The fol-
lowing criteria were adopted for developmental abnormali-
ties:
"motor retardation if the child was not walking at
18 months, speech retardation if not talking by 24
months, mental retardation or seizures (or convulsive-
like attacks) according to the history provided by the
mother, and neurological signs by agreement of the two
examiners. No standards are available for head circum-
ference or height of Iraqi children, so these factors
were evaluated in terms of standard deviations below
the mean for the group".
Subsequently, a more complete report (Marsh et al.,
1981) became available on 84 infant-mother pairs, includ-
ing the 29 pairs described above. The peak maternal hair
levels ranged from 0.4 to 640 mg/kg. Severe neurological
deficits were observed in five children. These severe ef-
fects are illustrated by the case report of one of these
children. At the age of 4 years and 9 months, the child
was blind and deaf and was unable to stand, walk, or talk.
Tonic neck responses were present. All limbs showed an
increase in tone and deep tendon reflexes with extensor
plantar responses and abnormal posture of the wrist.
Microcephaly was present, with a head circumference of
43 cm. The boy's height was 98 cm (Marsh et al., 1977).
These severely affected children had been exposed to
peak maternal levels during the second trimester of preg-
nancy. These findings agree with a histopathological re-
port of Choi et al. (1978), who found evidence of abnormal
neuronal migration in the brain of Iraqi victims exposed
maximally in the third and fourth months of pregnancy.
This is known to be the critical period for neuronal mi-
gration (Sidman & Rakic, 1973).
These reports (Marsh et al., 1977, 1981) were based on
the analysis of 1-cm segments of hair bundles. Peak hair
concentrations probably underestimated the actual peak
blood concentrations due to misalignment of hair strands
during collection and to the differences in growth rates
of individual strands (for further discussion, see
Giovanoli-Jakubczak & Berg, 1974). Furthermore, the ana-
lytical methods used in the hair analysis had a recovery
of 73 ± 10% (Wigfield et al., 1981).
Analysis of these Iraqi hair samples has been repeated
using single-strand sampling and X-ray fluorescence giving
complete recovery (Jaklevic et al., 1978). Detailed re-
sults from the Iraqi outbreak have been reported by Marsh
et al. (1987) are given in the Appendix. The effects in
mothers during pregnancy were mild and transient, the most
frequent symptom being paraesthesia. Symptoms were re-
ported by the mother more frequently as exposure level
increased. The severity of effects in the mother was much
less than that in her offspring. Two of the mothers of the
four most severely affected infants (pair numbers 45, 56,
68, and 70) recalled no symptoms, and the others com-
plained only of transient paraesthesia during pregnancy.
This confirmed the findings of Harada (1968) on infant-
mother pairs in the Minamata outbreak.
According to Marsh et al. (1987), the physical examin-
ation of the children included:
"observation, measurement of head circumference and
body length, cranial nerve signs, speech, involuntary
movements, strength, deep tendon reflexes, plantar
responses, coordination, dexterity, primitive re-
flexes, sensation, posture, and ability to sit, stand,
walk, and run. A scoring system was adopted. When the
neurological examination result was absolutely normal,
the score was 0. In attempting to identify minimal
signs, points were awarded for borderline findings
such as possibly increased reflexes. Scores of 0-3
indicated no definite abnormality. The highest score
in the most severely affected child was 11. The neuro-
logical score was limited to signs found on examin-
ation, and points were not awarded for features of
retardation reported by the mother".
Four cases received a neurological score of 11. The
evidence is strong that these were severe cases of pre-
natal methylmercury poisoning. The lowest-observed maxi-
mum maternal hair level for these severe cases was 404 mg
mercury/kg (mother-infant pair number 56). However, none
of these observed symptoms were specific to prenatal
methylmercury poisoning. The possibility of confounding
factors was considered by the authors:
"Maternal alcohol consumption was not a problem. They
followed the Moslem precept to avoid alcohol, so the
fetal alcohol syndrome was not a consideration. None
of them smoked. The absence of antenatal medical
supervision was uniform, so that no prescription medi-
cation were taken and non-prescription medications
were rarely available. There were no drug-induced
fetotoxic effects to account for. These were agricul-
tural communities with little socio-economic variation
and no evidence of malnutrition".
The evidence that such non-specific symptoms were
caused by methylmercury is based on a statistical corre-
lation of the frequency of these symptoms with methylmer-
cury exposure and the absence of confounding factors. This
was the first report of a milder syndrome of prenatal
methylmercury poisoning, as opposed to the severe cases
discussed above.
An example of one such statistical correlation is
given in Fig. 4. The frequency of a symptom of motor
retardation (delayed onset of walking) is plotted against
the logarithm of the maximum maternal hair concentration
during pregnancy. The continuous line in Fig. 4a gives the
best fit to the data calculated according to a non-
parametric model. The frequency of response increases
smoothly from virtually zero at a maternal hair mercury
level of 5 mg/kg to approximately 70% at the highest con-
centration. The shaded area is made up of individual 95%
confidence limits for the individual response frequencies.
The narrow confidence limits at the lowest hair levels
(about 1 mg/kg) indicate a low background response fre-
quency of less than 5%. Marsh et al. (1987) noted that, in
five European countries, 10% of infants were not walking
by the age of 16 months and 5% of a sample of infants in
Paris, France, were not walking by 18 months, this being
the criterium used in their study.
Fig. 4. The relationship between the maximal maternal hair concentrations
during pregnancy and the frequency of cases of motor retardation in
offspring. Calculated from data in the Appendix according to the
method of Cox et al. (1989).
 The non-parametric 95% confidence limits are superim-
posed on two parametric models (the "hockey-stick" and
logit models) in Fig. 4b. The figure shows that both
parametric models are consistent with the data and with
each other. The two curves are close to each other and
both lie entirely within the non-parametric confidence
limits.
The non-parametric 95% confidence limits are superim-
posed on two parametric models (the "hockey-stick" and
logit models) in Fig. 4b. The figure shows that both
parametric models are consistent with the data and with
each other. The two curves are close to each other and
both lie entirely within the non-parametric confidence
limits.
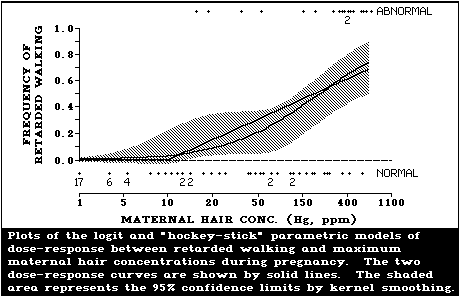 The collection of non-simultaneous confidence inter-
vals, as depicted in the shaded area, cannot be used to
obtain confidence intervals for such parameters as hair
concentration for a 10% or 50% risk. Instead, the para-
metric models were used. The result for the hockey-stick
model are given in Table 10.
The best estimate of a predicted threshold with the
hockey-stick model is a maximum maternal hair concen-
tration during pregnancy of 7.3 µg mercury/g with an
upper confidence limit of 13.6 µg mercury/g. This best
fit corresponds to a background of zero. This probably is
the outcome of the small number of infant-mother pairs in
the low exposure region. An assumed background frequency
of 2% or 4% does not greatly change the estimated pre-
dicted threshold values (8 and 9%, respectively). However,
an assumed background of 4% greatly increases the upper
95% confidence limit, and an assumed background of 8%
dramatically increases the estimate of the threshold to
119 µg mercury/g. These changes with increased values
for the background frequency are due in part to the
distribution of the data (the four abnormal values in the
hair mercury concentration range from 10 to 50 µg/g) and
in part to the assumed higher background values being
further away from the best fit (0%).
Table 10. The dependence of "practical" threshold
values of hair mercury concentration and upper
confidence limits on background frequency of responsesa
------------------------------------------------------
"Hockey-stick" model
-------------------------------
Response Background Practical Upper 95%
(%) threshold limit
(mg mercury/kg) (best fit)
------------------------------------------------------
Retarded 0b 7.3 13.6
walking 2c 8 17
4c 9 190
8c 119 230
Central 2c 7.8 24
nervous 4c 8.4 32
system 9b 10 287
signs
------------------------------------------------------
a Data in Appendix according to Cox et al. (1989).
b The best fit of the background frequency from data.
c Assumed background frequency.
However, a population threshold might not exist and
the hockey-stick model will not then be applicable to
these data. Thus the assumption that there is zero risk
at the threshold value estimated by the hockey-stick model
would be in error. The logit model provides a continuous
relationship between dose and response and will there-
fore give an estimate of the error in assuming zero risk
at the threshold dose estimated by the hockey-stick model.
Thus according to logit analysis, the excess risk over
background is 5% at the threshold hair mercury level of
7.3 mg/g determined by the hockey-stick model. In short,
if the hockey-stick model is not applicable, the estimated
threshold of 7.3 mg/g will underestimate the risk by 5%
(Fig. 4b).
The logit model, in agreement with the hockey-stick
model, gives a background frequency value of 0% according
to best fit of the data.
The logit and hockey-stick curves for abnormal central
nervous system signs are depicted in Fig 5. The curves are
superimposed on the 95% confidence limits estimated non-
parametrically as described for Fig. 4.
The collection of non-simultaneous confidence inter-
vals, as depicted in the shaded area, cannot be used to
obtain confidence intervals for such parameters as hair
concentration for a 10% or 50% risk. Instead, the para-
metric models were used. The result for the hockey-stick
model are given in Table 10.
The best estimate of a predicted threshold with the
hockey-stick model is a maximum maternal hair concen-
tration during pregnancy of 7.3 µg mercury/g with an
upper confidence limit of 13.6 µg mercury/g. This best
fit corresponds to a background of zero. This probably is
the outcome of the small number of infant-mother pairs in
the low exposure region. An assumed background frequency
of 2% or 4% does not greatly change the estimated pre-
dicted threshold values (8 and 9%, respectively). However,
an assumed background of 4% greatly increases the upper
95% confidence limit, and an assumed background of 8%
dramatically increases the estimate of the threshold to
119 µg mercury/g. These changes with increased values
for the background frequency are due in part to the
distribution of the data (the four abnormal values in the
hair mercury concentration range from 10 to 50 µg/g) and
in part to the assumed higher background values being
further away from the best fit (0%).
Table 10. The dependence of "practical" threshold
values of hair mercury concentration and upper
confidence limits on background frequency of responsesa
------------------------------------------------------
"Hockey-stick" model
-------------------------------
Response Background Practical Upper 95%
(%) threshold limit
(mg mercury/kg) (best fit)
------------------------------------------------------
Retarded 0b 7.3 13.6
walking 2c 8 17
4c 9 190
8c 119 230
Central 2c 7.8 24
nervous 4c 8.4 32
system 9b 10 287
signs
------------------------------------------------------
a Data in Appendix according to Cox et al. (1989).
b The best fit of the background frequency from data.
c Assumed background frequency.
However, a population threshold might not exist and
the hockey-stick model will not then be applicable to
these data. Thus the assumption that there is zero risk
at the threshold value estimated by the hockey-stick model
would be in error. The logit model provides a continuous
relationship between dose and response and will there-
fore give an estimate of the error in assuming zero risk
at the threshold dose estimated by the hockey-stick model.
Thus according to logit analysis, the excess risk over
background is 5% at the threshold hair mercury level of
7.3 mg/g determined by the hockey-stick model. In short,
if the hockey-stick model is not applicable, the estimated
threshold of 7.3 mg/g will underestimate the risk by 5%
(Fig. 4b).
The logit model, in agreement with the hockey-stick
model, gives a background frequency value of 0% according
to best fit of the data.
The logit and hockey-stick curves for abnormal central
nervous system signs are depicted in Fig 5. The curves are
superimposed on the 95% confidence limits estimated non-
parametrically as described for Fig. 4.
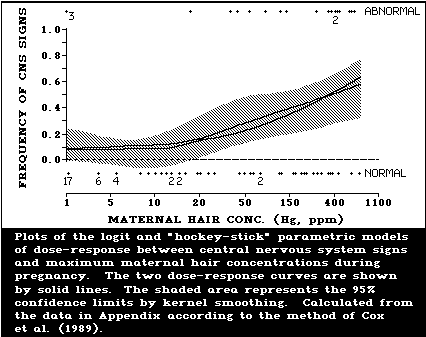 The two parametric models are consistent with each
other and with the non-parametric confidence limits. With
all three models, a statistically significant dose-
response relationship exists.
The hockey-stick model gives the best estimates of the
practical threshold at 10 µg mercury/g but with a very
high confidence limit (287 µg mercury/g) (Table 10).
Lower assumed values of the background frequency (2%
and 4%) give roughly the same practical threshold value,
but with lower upper confidence limits (24 and 32 µg
mercury/g, respectively). The lower upper limit values are
due to the fact that a definite assumed value for the
background frequency was used, whereas 9% is the best-fit
estimate of background and consequently the overall uncer-
tainty is greater.
The logit model estimates a similar background fre-
quency (9.3%). The excess risk over background is about
5% (Fig. 4).
Thus, the data in the Appendix can be used to demon-
strate a statistically significant dose-response relation-
ship for signs and symptoms of prenatal poisoning. Esti-
mates of a "threshold" or highest no-effect concen-
tration were made with the hockey-stick model. These esti-
mates are subject to considerable uncertainty due to the
small number of infant-mother pairs. As in the adult dose-
response relationships (see Fig. 3 and section 9.4.1.2),
the background frequency can greatly influence estimates
of risk at low (close to background) response rates, yet
cannot be estimated accurately due to the small number of
data points at the lowest hair mercury levels.
9.4.2.2 Canada
McKeown-Eyssen et al. (1983) examined the relationship
between prenatal exposure to methylmercury and neurologi-
cal and developmental abnormalities among 234 Cree Indian
children aged 12-30 months from four communities in north-
ern Quebec, Canada. The authors described their study as
follows:
"A medical team visited each community and examined
95% of the eligible children and their mothers,
`blinded' to their methylmercury exposure. One of the
four pediatric neurologists documented each child's
height, weight, and head circumference, assessed
dysmorphic and congenital features, and reported the
presence or absence of acquired disease. A neurologi-
cal examination was also conducted and included an
assessment of special senses, cranial nerves, sensory
function, muscle tone, stretch reflexes, coordination,
and persistence of the Babinski response which was
judged to be abnormal for the child's age, as well as
a summary of the presence or absence of neurological
abnormality. Finally, the neurologist assessed the
child's development by use of the Denver developmental
scale; for each child, the results were expressed as
the percentage of total test items that were passed,
separately for gross and fine motor development,
language development, and personal/social skills.
"Each mother was interviewed about her alcohol and
tobacco consumption both during the relevant pregnancy
and at the time of the interview. Because of the un-
certainty about the accuracy of the reporting, women
were classified simply as users of alcohol or ab-
stainers, and as smokers or nonsmokers according to
whether they reported ever drinking or smoking. Caf-
feine intake was calculated from answers to questions
on tea and coffee consumption.
"Information on pregnancy, labour, and delivery were
sought from the medical certificate of childbirth, a
standard form that reports the major characteristics
of pregnancy and delivery for all births in Quebec.
Because some deliveries occurred in the bush, these
certificates could be obtained for only 85% of the
births.
"Methylmercury concentrations of the hair were
measured in alternate one centimeter segments, begin-
ning with the scalp-end segment. The maximum concen-
tration in the segment of hair corresponding to the
period from one month before conception to one month
after delivery was used as an index of prenatal
exposure.
"A search was conducted to establish which measures
(if any) of neurologic function and development were
associated with methylmercury exposure. This was
achieved by use of a regression analysis of the
relationship between the methylmercury exposure index
and the results of four tests of neurologic function
(coordination, cranial nerves, muscle tone or re-
flexes, and an overall neurologic assessment) and
measures of four aspects of the Denver developmental
scale (gross and fine motor development, language
development, and personal/social skills). Once the
measure of neurologic function most closely associated
with exposure was identified, the odds ratio was esti-
mated from a discriminant analysis in which children
were classified as cases or controls depending on the
presence or absence of abnormality of the relevant
neurologic function. The analysis distinguished
between the cases and controls first on the basis of
confounding variables potentially associated with the
neurologic abnormality (child's age, duration of
breast-feeding, mother's age, and mother's smoking
habit and consumption of beverages containing alcohol
and caffeine), and then on the basis of the prenatal
indices of methylmercury exposure".
The ages of the mothers covered a wide range: 13% were
below 20 years of age and 15% were at least 35 years old.
About two-thirds said they consumed alcohol and slightly
more were smokers. The percentages of high risk preg-
nancies, complications at delivery, and duration of breast
feeding were similar for boys and girls. The birth weight
of the children tended to be above normal (34% weighed
over 4 kg).
The mean index of mercury exposure (maximum maternal
hair concentration during pregnancy) was the same
(6 µg/g), for both boys and girls, and only 6% of values
were above 20 µg/g. None of the children showed abnor-
mal physical development, but "abnormality" of muscle
tone or reflexes was positively associated with the pre-
natal index of methylmercury exposure (P <0.05, 2-tailed).
The highest maternal hair level in this study group of 97
males was 23.9 µg/g (Table 10). No other measure of
neurological function or development was significantly
associated with methylmercury exposure either before or
after adjustment for confounding variables. In girls, no
adverse effects were associated with mercury exposure. In
fact, a negative association was found between one neuro-
logical abnormality (incoordination) and prenatal mercury
exposure. McKeown-Eyssen et al. (1983) expressed some
reasons to doubt the "importance" of the finding of
methylmercury effects in boys. They noted that the "ab-
normality of muscle tone or reflexes . . . was . . . of
doubtful clinical importance", that previously reported
prenatal effects were at higher exposures, that a consist-
ent dose-response relationship was not seen in the boys
(Table 11), and that the effect was only seen in boys and
not in girls. Consequently, in their interpretation of the
data, the authors did not exclude the possibility that the
positive findings were chance observations.
Table 11. Prevalence of abnormality of
muscle tone or reflexes according to
maternal mercury levels during pregnancya
--------------------------------------
Prenatal Number % abnormal
exposureb of boys
index (mg/kg)
--------------------------------------
0 - 1.9 19 15.8
2 - 2.9 18 5.6
3 - 4.9 19 26.3
5 - 6.9 14 0
7 - 12.9 14 7.1
13 - 23.9 13 38.5
Total 97 15.5
--------------------------------------
a Adapted from: McKeown-Eyssen et al. (1983).
b Maximum maternal hair concentration during pregnancy.
9.4.2.3 New Zealand
Kjellstrom et al. (1986) reported preliminary tests
carried out on prenatally exposed children in a fish-
eating group in New Zealand. The study started with a
cohort of 11 000 recent mothers and their offspring.
Approximately 1000 of these mothers reported that they had
consumed fish more than three times per week during preg-
nancy. Analysis of samples of maternal head hair revealed
that 73 of the mothers had levels above 6 mg/kg. People of
Pacific Island descent accounted for 62%, Maoris for 27%,
and Europeans 11% of this group of 73.
Only 31 offspring from this group of 73 mothers could
be contacted by the time they were 4 years old. They were
matched according to ethnic group, maternal age, birth-
place, and birth date with offspring having low prenatal
exposure to methylmercury (maternal hair mercury below
6 mg/kg). The Denver Development Test, carried out on a
double-blind basis, was used to assess the effects of
methylmercury. Abnormal or questionable results were found
in 17% of the controls, compared with 50% in the children
exposed to high mercury levels (maternal hair mercury
levels above 6 mg/kg). The difference was statistically
significant.
A statistically significant dose-response relationship
was found between mean maternal hair mercury levels during
pregnancy and the frequency of deficient Denver Test
results. No influence of socio-economic factors (based on
place of residence), maternal health status, or smoking
habits was seen. However, other confounding factors
inherent in these studies make it difficult to draw final
conclusions.
In 1985, it was possible to locate 61 of the original
73 high-exposure children and to conduct detailed psycho-
logical and scholastic tests (carried out on a double-
blind basis) at the age of 6-7 years (Kjellstrom et al.,
1989). At this stage, the children had completed at least
one year at school. These tests included, among others,
the revised Wechsler Intelligence Scale for Children
(WISC-R) and the Test of Language Development (TOLD).
The high-exposure children (maternal hair mercury
levels within the range of 6-86 mg/kg, with the second
highest value being 19.6 mg/kg) were compared with three
matched groups: one group with maternal hair mercury
levels of 3-6 mg/kg and two groups with levels below
3 mg/kg (one group with high fish consumption and one with
low fish consumption). The mothers were matched for
child's sex and maternal ethnic group, age, smoking
habits, residence area, and residence time in New
Zealand.
The results of the different tests were correlated,
and showed that individual children with low scores in the
TOLD or WISC-R tests also had low scores in the other
tests. For those children who had been tested both at age
4 (Kjellstrom et al., 1986) and at age 6-7 (Kjellstrom et
al., 1989), there was also a correlation between the
Denver Test and the IQ scores (WISC-R scale). The sub-
groups were small, but the data indicated that a child who
had poor Denver Test results was highly likely to score
very poorly in the IQ test at school age. According to the
authors' summary, although "methylmercury exposure con-
tributes only a small part of the variation in tests
results" and "results of the psychological test vari-
ables are influenced by the child's ethnic background",
the study suggests that "an average hair mercury level
during pregnancy of 13-15 mg/kg (equivalent to about
25 mg/kg peak mercury level) may be associated with a
decreased test performance" (Kjellstrom et al., 1989).
It should be noted that the studies in Canada and Iraq
used maximum maternal hair concentrations during pregnancy
based on 1-cm segments (roughly one month's hair growth).
Kjellstrom et al. (1986, 1989) state that their mean
maternal hair values should be multiplied by a factor of
1.5 to obtain the maximum 1-cm value during pregnancy.
9.4.2.4 Summary
Severe derangement of the developing central nervous system
can be caused by prenatal exposure to methylmercury. The lowest
level (maximum maternal hair mercury concentration during preg-
nancy) at which severe effects were observed was 404 µg/g in
the Iraqi outbreak. The highest no-observed-effect-level (NOEL)
for severe effect was 399 µg/g. Fish-eating populations in
Canada and New Zealand have also been studied for prenatal
effects, but exposure levels were far below the highest NOEL
for severe effects in Iraq and no severe effects were seen.
Evidence of psychomotor retardation (delayed achievement of
developmental milestones, a history of seizures, abnormal
reflexes) were seen in the Iraqi population at maternal hair
levels well below those associated with severe effects. A
statistical analysis revealed that one of these effects (motor
retardation) rose above the background frequency at maternal
hair mercury levels (maximum level during pregnancy) of
10-20 µg/g. This range of values in maternal hair is consist-
ent with all available evidence and can be accepted as the
range of critical concentrations. The Canadian study found
that maternal hair levels were positively associated with
abnormal muscle tone or reflexes in boys, but not in girls
(the highest maximum maternal hair level during pregnancy was
23.9 µg/g).
The New Zealand study found evidence of developmental
retardation (according to the Denver Test) in 4-year-old
children at average maternal hair mercury levels during
pregnancy within the range of 6-86 µg/g (the second highest
value was 20 µg/g). The New Zealand mercury values should be
multiplied by 1.5 to convert to maximum maternal hair levels in
pregnancy.
10. EVALUATION OF HUMAN HEALTH RISKS
10.1 Exposure Levels and Routes
In view of the restrictions placed upon the use of
methylmercury in most countries, occupational exposure
will be low.
The major source of human exposure to methylmercury is
through the diet, more specifically from the consumption
of fish and fish products. In most countries, the import-
ant food fishes have methylmercury levels in their edible
portion not exceeding 200-300 µg/kg. However, levels in
such predatory species as ocean tuna, shark, and swordfish
(even from non-polluted areas), as well as freshwater
pike, walleye, and bass, may contain methylmercury levels
in excess of 1000 µg/kg. In view of the worldwide vari-
ation in dietary patterns and extent of pollution, it is
difficult to calculate a general exposure level for
methylmercury. However, assuming an average daily con-
sumption of 20 g of non-predatory species containing
200 µg/kg, the daily methylmercury intake would be 4 µg.
It has been estimated that long-term intake at this level
would raise the blood methylmercury levels by 4 µg/litre,
and hair levels by 1 µg/g. However, in some countries the
average consumption can be as high as 100 g/day and may
consist mainly of predatory species. In these cases,
methylmercury intakes can exceed 100 µg/day.
10.2 Toxic Effects
10.2.1 Adults
Concerning the risks in adults exposed to methylmer-
cury, the conclusions reached in Environmental Health
Criteria 1: Mercury (WHO, 1976) and the 1980 interim
evaluation remain unchanged. A daily methylmercury con-
sumption of 0.48 µg/kg body weight (WHO, 1989b) will not
result in any detectable adverse effects. However, a daily
intake of 3-7 µg/kg body weight would cause adverse
effects on the nervous system, manifested as an approxi-
mately 5% increase in the incidence of paraesthesia. Hair
concentrations would be approximately 50-125 µg/g at this
level of intake. Clinical observations in Iraq suggested
that women are more sensitive to the toxic effects of
methylmercury during pregnancy.
10.2.2 Prenatal exposure
The report (WHO, 1980) that evaluated the health
hazards from exposure to methylmercury through the con-
sumption of fish underlined that damage to the fetal brain
caused by prenatal exposure to methylmercury could be the
critical effect, and that more information was needed for
a proper risk assessment. Since 1980, experimental evi-
dence to elucidate the mechanisms involved in the neuro-
toxic action of methylmercury on the fetal brain has ac-
cumulated and has been reviewed in this monograph. Further
analysis of data from the Iraqi outbreak has extracted
additional information relating to the effects of prenatal
methylmercury exposure. From these sets of evidence, a
pattern has emerged that permits the construction of a
biological model for the neurotoxic action of methylmer-
cury on the fetal brain.
Methylmercury inhibits the growth of the fetal brain
and the migration of neurons from the embryological gener-
ation layer to the final destination in the brain cortex.
This has been demonstrated in clinical cases in Japan and
Iraq. An inhibition of brain growth is indicated by a
decrease in brain size and weight, as was observed in
studies on monkeys and humans. The inhibition of fetal
brain development caused by methylmercury exposure results
in the behavioural changes and reduced cognitive and motor
ability found in clinical cases. It has been demonstrated
that methylmercury interferes with microtubule formation,
cell division, and neuronal protein synthesis, all of
which could explain the effects described above.
The model emerging to explain the neurological effects
of methylmercury is a continuous dose-effect relationship,
with a range from subtle changes in brain function (indi-
cated by psychological tests) at low dose levels to a
severe neurological syndrome of cerebral palsy with pro-
nounced changes in the organization of brain structure at
high exposure levels. However, the possibility of
detecting and characterizing the methylmercury level at
which the subtle and early adverse effects on the fetal
brain may arise is limited by the availability of sensi-
tive test procedures. At present, some effects can only
be detected and adequately characterized in the epidemi-
ological studies of fairly large populations.
The crucial question is the actual exposure level (or
body burden) of methylmercury in humans which can lead to
subtle changes in the offspring. The actual exposure
levels and patterns are usually unknown, but the effect
can be related to the hair mercury level and an approxi-
mate daily exposure calculated from the known kinetic
parameters for methylmercury accumulation, distribution,
and excretion.
The statistical analysis of data on 84 infant-mother
pairs (maternal peak hair mercury levels during pregnancy
of 0.4-640 µg/g) showed that, at maternal hair concen-
trations above 70 µg/g, children exhibited evidence of
abnormal neurological signs, e.g., increased muscle tone
in the leg and exaggerated deep tendon reflexes, often
accompanied by ataxia together with a history of develop-
mental delay. This statistical analysis indicated a 30%
risk of these abnormal findings at maternal hair mercury
concentrations around 70 µg/g. The data from the Iraqi
outbreak do not permit firm conclusions to be drawn con-
cerning the risk of adverse effects below that level.
However, by applying the biological model described above,
the extrapolation method of Cox et al. (1989), and the
evaluation of other currently available data, it can be
calculated that a maternal hair mercury concentration of
10-20 µg/g implies a 5% risk. The possibility cannot be
excluded that effects detectable by psychological and
behavioural testing or subclinical effects might occur at
even lower levels of exposure, but evidence is lacking.
10.3 Conclusions
The general population does not face a significant
health risk from methylmercury. Certain groups with a high
fish consumption may attain a blood methylmercury level
(about 200 µg/litre, corresponding to 50 µg/g of hair)
associated with a low (5%) risk of neurological damage to
adults.
The fetus is at particular risk. Recent evidence shows
that at peak maternal hair mercury levels above 70 µg/g
there is a high risk (more than 30%) of neurological
disorder in the offspring. A prudent interpretation of
the Iraqi data implies that a 5% risk may be associated
with a peak mercury level of 10-20 µg/g in the maternal
hair.
There is a need for epidemiological studies on chil-
dren exposed in utero to levels of methylmercury that re-
sult in peak maternal hair mercury levels below 20 µg/g,
in order to screen for those effects only detectable by
available psychological and behavioural tests.
11. RECOMMENDATIONS
11.1 Gaps in Knowledge
In spite of significant advances in our understanding
of the toxicity and potential hazard of methylmercury,
there remain areas in which there is an urgent need for
additional studies.
The most important of these areas is the lower end of
the dose-response relationship for prenatal exposures.
This will require well coordinated and designed, inter-
national epidemiological studies that consider all rel-
evant confounding factors (e.g., drugs, alcohol, smoking).
As part of these studies, there is a need to develop
objective measurements of clinical manifestations. The
potential ability of selenium and other dietary components
(e.g., antioxidants) to alter the toxic responses elicited
by methylmercury should be investigated. These studies
will not only need to describe this interaction, but also
to provide data that can be used quantitatively in a risk
assessment of methylmercury, particularly for the fetus.
The mechanisms of damage to both the mature and developing
nervous system remain to be elucidated. As no information
on the relative vulnerability of the brain during differ-
ent periods of pregnancy is available, more experimental
work is needed to shed light on this aspect, which is
important for risk assessment and clinical judgement. The
selective damage to the nervous system and to specific
areas in the brain, the long period in the case of adult
poisoning, and the high vulnerability of the developing
nervous system (including sex differences in suscepti-
bility) are still unexplained.
11.2 Preventive Measures
In populations that consume large amounts of fish
(e.g., 100 g/day), the hair levels of methylmercury in
women of child-bearing age should be monitored. If the
results of these monitoring activities indicate excessive
exposure to methylmercury, appropriate and practical
measures, such as dietary recommendations, should be taken
to reduce the possibility of long-term exposure during
pregnancy and to keep it below internationally recommended
allowable intakes.
Measures to reduce methylmercury exposure via the con-
sumption of fish will need to consider the impact of these
measures on the overall dietary requirements of these
individuals.
12. PREVIOUS EVALUATIONS BY INTERNATIONAL BODIES
The human health risks from exposure to methylmercury
were previously evaluated in Environmental Health Criteria
1: Mercury (WHO, 1976b). This was followed by a brief up-
date (WHO, 1980), based upon a technical report prepared
by the Monitoring and Assessment Research Centre (MARC,
1981).
In the thirty-third report of the Joint FAO/WHO
Expert Committee on Food Additives (JECFA), it was rec-
ommended that the permissible tolerable weekly intake
(PTWI) for methylmercury in adults be maintained at
200 µg (3.3 µg/kg body weight) (WHO, 1978; WHO, 1989b).
However, the Committee noted that pregnant women and
nursing mothers are likely to be at greater risk, although
the available data were insufficient to recommend a
specific mercury intake for these population groups.
Regulatory standards established by some national
bodies in different countries and the EEC are summarized
in the data profile of the International Register of
Potentially Toxic Chemicals (IRPTC, 1987).
REFERENCES
ABE, T., HAGA, T., & KUROKAWA, M. (1975) Blockage of axoplasmic
transport and depolymerization of reassembled microtubules by
methylmercury. Brain Res., 86: 504-508.
AIREY, D. (1983) Total mercury concentrations in human hair from 13
countries in relation to fish consumption and location. Sci. total
Environ., 31: 157-180.
AL-MUFTI, A.W., COPPLESTONE, J.F., KAZANTZIS, G., MAHMOUD,
R.M., & MAJID, M.A. (1976) Epidemiology of organomercury poisoning in
Iraq: I. Incidence in a defined area and relationship to the eating of
contaminated bread. Bull. World Health Organ., 53(Suppl.): 23-36.
AL-SHAHRISTANI, H. & SHIHAB, K. (1974) Variation of biological half-
life of methylmercury in man. Arch. environ. Health, 28: 342-344.
AMIN-ZAKI, L., ELHASSANI, S., MAJEED, M.A., CLARKSON, T.W.,
DOHERTY, R.A. & GREENWOOD, M. (1974) Intra-uterine methylmercury
poisoning in Iraq. Pediatrics, 54(5): 587-595.
AMIN-ZAKI, L., ELHASSANI, S., MAJEED, M.A., CLARKSON, T.W.,
DOHERTY, R.A., GREENWOOD, M., & GIOVANOLI-JAKUBCZAK, T.
(1976) Perinatal methylmercury poisoning in Iraq. Am. J. dis. Child.,
130: 1070-1076.
ANDO, S., TOYODA, Y., NAGAI, Y., & IKUTA, F. (1985) Abnormalities in
gangliosides and other lipids of monkey, rabbit and human brains with
chronic organic mercury intoxication. Jpn. J. exp. Med., 55(1): 1-6.
ARAKI, K., WAKABAYASHI, M., SAKIMURA, K., KUSHIYA, E.,
OZAWA, H., KUMAMOTO, T., & TAKAHASHI, Y. (1981) Decreased uptake
of GABA by dorsal ganglia in methylmercury treated rats. Neurotoxicity,
2: 557-566.
ARITO, H., NOBORU, H., & SHITZU, T. (1983) Effect of methylmercury
chloride on sleep-waking rhythms in rats. Toxicology, 28: 335-345.
ASCHNER, M. (1986) Changes in axonally transported proteins in the rat
visual system following systemic methylmercury exposure. Acta
Pharmacol. toxicol., 59(2): 151-157.
ASCHNER, M. & CLARKSON, T.W. (1987) Mercury 203 distribution in
pregnant and non-pregnant rats following systemic infusions with thiol-
containing amino acid. Teratology, 36: 321-328.
ASCHNER, M., RODIER, P.M., & FINKELSTEIN, J.N. (1986) Reduction of
axonal transport in the rat optic system after direct application of
methylmercury. Brain Res., 381(2): 244-250.
ATCHISON, W.D. (1986) Extracellular calcium-dependent and independent
effects of methylmercury on spontaneous and potassium-evoked release of
acetylcholine at the neuromuscular junction. J. Pharmacol. exp. Ther.,
237(2): 672-680.
ATCHISON, W.D. & NARAHASHI, T. (1982) Methylmercury-induced
depression of neuromuscular transmission in the rat. Neurotoxicology,
3: 37-50.
BACCI, E., ANGOTZI, G., BRALIA, A., LAMPARIELLO, L., &
ZANETTE, E. (1976) Etude sur une population humaine exposée au
méthylmercure par la consommation de poisson. Rev. int. Océanogr. méd.,
41/42: 127-141.
BAKIR, F., DAMLUJI, S.F., AMIN-ZAKI, L., MURTADHA, M.,
KHALIDI, A., AL-RAWI, N.Y., TIKRITI, S., DHAHIR, H.I., CLARKSON,
T.W., SMITH, J.C., & DOHERTY, R.A. (1973) Methylmercury poisoning in
Iraq. Science, 181: 230-241.
BALLATORI, N. & CLARKSON, T. (1985) Biliary secretion of glutathione
and of glutathione-metal complexes. Fundam. appl. Toxicol., 5: 816-
831.
BARTOLOME, J., TREPANIER, P., CHAIT, E.A., SEIDLER, F.J.,
DESKIN, R., & SLOTKIN, T.A. (1982) Neonatal methylmercury poisoning in
the rat: effects on development of central catecholamine
neurotransmitter systems. Toxicol. appl. Pharmacol., 65: 92-99.
BEGLEY, T.P., WALTS, A.E., & WALSH, C.T. (1986) Bacterial
organomercurial lyase: overproduction, isolation, and characterization.
Biochemistry, 25: 7186-7192.
BEIJER, J. & JERNELOV, A. (1979) Methylation of mercury in aquatic
environments. In: Nriagu, J.O., ed. The biogeochemistry of mercury in
the environment, Amsterdam, Oxford, New York, Elsevier Science
Publishers, pp. 203-210.
BERLIN, M. (1976) Dose-response relations and diagnostic indices of
mercury concentrations in critical organs upon exposure to mercury and
mercurials. In: Nordberg, G.F., ed. Effects and dose-response
relationships of toxic metals, Amsterdam, Oxford, New York, Elsevier
Science Publishers, pp. 235-245.
BERLIN, M. (1986) Mercury. In: Friberg, L., Nordberg, G.F., & Voulk,
V., ed. Handbook on the toxicology of metals, 2nd ed., Amsterdam,
Oxford, New York, Elsevier Science Publishers, pp. 387-445.
BERLIN, M., BLOMSTRAND, C., GRANT, C.A., HAMBERGER, A., &
TROFAST, J. (1975) Tritiated methylmercury in the brain of squirrel
monkeys. Arch. environ. Health, 30: 591-597.
BERNAUDIN, J.F., DRUET, E., DRUET, P., & MASSE, R. (1981)
Inhalation or ingestion of organic or inorganic mercurials produces
auto-immune disease in rats. Clin. Immunol. Immunopathol., 20: 129-
135.
BERNHARD, M. & ANDREAE, M.O. (1984) Transport of trace metals in
marine food chains. In: Nriagu, J.O., ed. Changing metal cycles and
human health, Berlin, Heidelberg, New York, Springer-Verlag, pp. 143-
168.
BERNHARD, M., BUFFONI, R., & RENZONI, A. (1982) Mercury in
Mediterranean tuna. Why is their level higher than in Atlantic tuna?
Thalassia (Yugosl.), 18: 231-243.
BIENVENUE, E., BOUDOU, A., DASMAZES, J.P., GAVACH, C.,
GEORGESCAULD, D., SANDEAUX, J., SANDEAUX, R., & SETA, P. (1984)
Transport of mercury compounds across biomolecular lipid membranes:
effect of lipid composition, pH and chloride concentration. Chem.-biol.
Interact., 48: 91-101.
BJORNBERG, A.A., HAKANSON, L., & LUNDBERGH, K., (1988) A theory
on the mechanisms regulating the bioavailability of mercury in natural
water. Environ. Pollut., 49: 53-61.
BLAKLEY, B.R. (1984) Enhancement of urethan-induced adenoma formation
in Swiss mice exposed to methylmercury. Can. J. comp. Med., 48(3): 299-
302.
BORNHAUSEN, M., MUSCH, H.R., & GREIM, H. (1980) Operant behaviour
performance changes in rats after prenatal methyl-mercury exposure.
Toxicol. appl. Pharmacol., 56: 305-310.
BROWN, D., RUEHL, K., BORMANN, S., LITTLE, J. (1988). Effects of
methylmercury on the microtubule system of mouse lymphocytes. Toxicol.
appl. Pharmacol., 94: 66-75.
BRZEZNICKA, E.A. & CHMIELNICKA, J. (1985a) Interaction of
alkylmercury compounds with sodium selenite. III. Biotransformation,
levels of metallothioneinlike proteins and endogenous copper in some
tissues of rats exposed to methyl or ethylmercuric chloride with and
without sodium selenite. Environ. Health Perspect., 60: 423-431.
BRZEZNICKA, E.A. & CHMIELNICKA, J. (1985b) Interaction of
alkylmercuric compounds with sodium selenite. II. Metabolism of
methylmercuric chloride administered alone and in combination with
sodium selenite in rats. Environ. Health Perspect., 60: 411-421.
BUCHET, J.P., ROLES, H., HUBERMONT, G., & LAUWERYS, R. (1978)
Placental transfer of lead, mercury, cadmium, and carbon monoxide in
women. Environ. Res., 15: 494-503.
BUCHET, J.P., LAUWERYS, R., VANDEVOORDE, A., & PYCKE, J.M.
(1983) Oral daily intake of cadmium, lead, manganese, chromium,
mercury, calcium, zinc, and arsenic in Blegium. A duplicate meal
study. Food chem. Toxicol., 21: 19-24.
BURBACHER, T.M., MONNETT, C., GRANT, K.S., & MOTTET, N.K.
(1984) Methylmercury exposure and reproductive dysfunction in the
nonhuman primate. Toxicol. appl. Pharmacol., 75(1): 18-24.
BURTON, G.V. & MEIKLE, A.W. (1980) Acute and chronic methylmercury
poisoning impairs rat adrenal and testicular function. J. Toxicol.
environ. Health, 6: 597-606.
BYRNE, A.R. & KOSTA, L. (1974) Simultaneous neutron activation
determination of selenium and mercury in biological samples by
volatilization. Talanta, 21: 1083-1090.
CANADA-ONTARIO STEERING COMMITTEE (1983) Mercury pollution
in the Wabigon-English river system of Northwestern Ontario, and
possible remedial measures. Summary of a technical report, Toronto,
Canada-Ontario Steering Committee, Provincial Ministry of the
Environment.
CAPELLI, R., MINGANTI, V., SEMINO, G., & BERTARINI, W. (1986) The
presence of mercury (total and organic) and selenium in human
placentae. Sci. total Environ., 48(1/2): 69-79.
CAPPON, C.J. (1981) Mercury and selenium content and chemical form in
vegetable crops grown on sludge-amended soil. Arch. environ. Contam.
Toxicol., 10: 673-689.
CAPPON, C.J. (1987) Uptake and speciation of mercury and selenium in
vegetable crops grown on compost-treated soil. Water Air Soil Pollut.,
3: 353-361.
CAPPON, C.J. & SMITH, J.C. (1978) A simple and rapid procedure for the
gas chromatographic determination of methylmercury in biological
samples. Bull. environ. Contam. Toxicol., 19: 600-607.
CARMICHAEL, N., CAVANAGH, J.B., & RODDA, R.A. (1975) Some
effects of methylmercury salts on the rabbit nervous system. Acta
neuropathol., 32: 112-125.
CHANG, L.W. (1977) Neurotoxic effects of mercury - a review. Environ.
Res., 14: 329-373.
CHANG, L.W. & SUBER, R. (1982) Protective effect of selenium on
methylmercury toxicity: a possible mechanism. Bull. environ. Contam.
Toxicol., 29: 285-289.
CHANG, L.W., GILBERT, M., & SPRECHLER, J. (1978) Modification of
methylmercury neurotoxicity by vitamin E. Environ. Res., 17: 356-366.
CHEN, W.J., BODY, R.L., & MOTTET, N.K. (1979) Some effects of
continuous low-dose congenital exposure to methylmercury on organ
growth in the rat fetus. Teratology, 20: 31-36.
CHEN, W.J., BODY, R.L., & MOTTET, N.K. (1983) Biochemical and
morphological studies of monkeys chronically exposed to methylmercury.
J. Toxicol. environ. Health, 12: 407-416.
CHERIAN, M.G., HURSH, J.B., CLARKSON, T.W., & ALLEN, J. (1978)
Radioactive mercury distribution in biological fluids and excretion in
human subjects after inhalation of mercury vapor. Arch. environ.
Health, 33: 109-114.
CHEUNG, M.K. & VERITY, M.A. (1985) Experimental methylmercury
neurotoxicity: locus of mercurial inhibition of brain protein synthesis
in vivo and in vitro. J. Neurochem., 44(6): 1799-1808.
CHMIELNICKA, J., BRZEZNICKA, B., BARANSKI, B., & SITAREK, K.
(1985) The effect of methylmercury on prenatal development and trace
metal distribution in pregnant and fetal rats. Biol. Trace Elem. Res.,
8: 191-201.
CHOI, B.H. & LAPHAM, L.W. (1976) Interactions of neurons and astrocytes
during growth and development of human fetal brain in vitro. Exp. Mol.
Pathol., 24: 110-125.
CHOI, B.H. & LAPHAM, L.W. (1980) Effects of meso-2-3,
dimercaptosuccinic acid on methylmercury injured human fetal astrocytes
in vitro: a lapse cinematographic phase and electron microscopic study.
Fed. Proc., 39: 396.
CHOI, B.H. & KIM, R.C. (1984) The comparative effects of methylmercuric
chloride and mercuric chloride upon DNA synthesis in mouse fetal
astrocytes in vitro. Exp. Mol. Pathol., 41(3): 371-376.
CHOI, B.H., LAPHAM, L.W., AMIN-ZAKI, L., & SALEEM, T. (1978)
Abnormal neuronal migration, deranged cerebral cortical organization
and diffuse white matter astrocytosis of human fetal brain. A major
effect of methylmercury poisoning in utero. J. Neuropathol. exp.
Neurol., 37: 719-733.
CHOI, B.H., CHO, K.H. & LAPHAM, L.W. (1979) Effects of methylmercury on
human fetal brain cells in culture: a time lapse cinematographic phase
and electron microscopic study. J. Neuropathol. exp. Neurol., 33: 307.
CHOI, B.H., CHO, K.H., & LAPHAM, L.W. (1980) Effects of methylmercury
on DNA synthesis of human fetal astrocytes: a radioautographic study.
Brain Res., 202: 238-242.
CHOI, B.H., KUDO, M., & LAPHAM, L.W. (1981) A golgi and electron-
microscopic study of cerebellum in methylmercury poisoned neonatal
mice. Acta neuropathol., 54: 233-237.
CHOI, B.H., KIM, R.C., & PECKHAM, N.H. (1988) Hydrocephalus following
prenatal methylmercury poisoning. Acta neuropathol. 75: 325-330.
CLARKSON, T.W. (1983) Methylmercury toxicity in the mature and
developing nervous system: possible mechanism. In: Sarker, B. ed.
Biological aspects of metals and metal related diseases, New York,
Raven Press, pp. 183-192.
CLARKSON, T.W., FRIBERG, L., HURSH, J.B., & NYLANDER, M.
(1988) The prediction of intake of mercury vapor from amalgams. In:
Clarkson, T.W., Friberg, L., Nordberg, G.F., & Sager, P.R., ed.
Biological monitoring of toxic metals, New York, London, Plenum Press,
pp. 247-264.
CONCAS, A., CORDA, M.G., SALIS, M., MULAS, M.L., MILIA, A.,
CORONGIU, F.P., & BIGGIO, G. (1983) Biochemical changes in the rat
cerebellar cortex elicited by chronic treatment with methylmercury.
Toxicol. Lett., 18: 27-33.
COX, C., CLARKSON, T.W., MARSH, D.O., AMIN-ZAKI, L., TIKRITI,
S., & MYERS, G.G. (1989). Dose-response analysis of infants prenatally
exposed to methylmercury. An application of a single compartment model
to single-strand hair analysis. Environ. Res., 49: 318-332.
COYLE, P. & HARTLEY, T. (1981) Automated determination of mercury in
urine and blood by the Magos reagent and cold vapor atomic absorption
spectrometry. Anal. Chem., 53: 354-356.
CUOMO, V., AMBROSI, L., ANNAU, Z., CAGIANO, R., BRUNELLO, N., &
RACAGNI, G. (1984) Behavioural and neurochemical changes in offspring
of rats exposed to methylmercury during gestation. Neurobehav. Toxicol.
Teratol., 6(3): 249-254.
CURLE, D.C., RAY, M., & PERSAUD, T.V.N. (1983) Methymercury toxicity:
in vivo evaluation of teratogenesis and cytogenic changes. Anat. Anz.
(Jena), 153: 69-82.
DAVIES, T.W. & NIELSEN, S.W. (1977) Pathology of subacute
methylmercurialism in cats. Am. J. Vet. Med., 38: 59-67.
DAVIES, T.W., NIELSEN, S.W., & KIRCHNER, C.H. (1976) The pathology of
subacute methylmercurialism in swine. Cornell Vet., 66: 32-55.
DAVIES, T.W., NIELSEN, S.W., & JORTNER, B.S. (1977) Pathology of
chronic and subacute canine methylmercurialism. J. Am. Anim. Hosp.
Assoc., 13: 369-381.
DE SAINT-GEORGES, I., VERSHAEVE, L., & LEONARD, A. (1984) The
inhibitory effect of methylmercury chloride and mercuric chloride on
microtubule polymerization in vitro. C.R. Séances Soc. Biol. (Paris),
178: 562-566.
DEN TONKELAAR, E.M., VAN ESCH, G.J., HOFMAN, B., SCHULLER,
P.L., & ZWIERS, J.H.L. (1974) Mercury and other elements in blood of
the Dutch population. In: Proceedings of an International Symposium on
Recent Advances in the Assessment of the Health Effects of Environmen-
tal Pollution, Paris, 24-28 June, Luxembourg, Commission of the
European Communities, Vol. 2, pp. 1017-1027.
DOHERTY, R.A., GATES, A.H., & LANDRY, T. (1977) Methylmercury
excretion: developmental changes in mouse and man. Pediatr. Res., 11:
416.
DOI, R. & KOBAYASHI, T. (1982) Organ distribution and biological half-
time of methylmercury in four strains of mice. Jpn. J. exp. Med., 52:
307-314.
DOI, R. & TAGAWA, M. (1983) A study on the biochemical behavior of
methylmercury. Toxicol. appl. Pharmacol., 69: 407-416.
ECCLES, C.U. & ANNAU, Z. (1982a) Prenatal methylmercury exposure:
alterations in neonatal activity. Neurobehav. Toxicol., 4: 371-376.
ECCLES, C.U. & ANNAU, Z. (1982b) Prenatal methylmercury exposure. II.
Alterations in learning and psychotropic drug sensitivity in adult
offspring. Neurobehav. Toxicol. Teratol., 4: 377-382.
ELSNER, J., HODEL, B., SUTER, K.E., OEKLKE, D., ULBRICH, B.,
SCHREINER, G., CUOMO, V., CAGIONO, R.A., ROSENGREN, L.E.,
KARLSSON, J.E., & HAGLID, K.G. (1988) Detection limits of different
approaches in behavioral teratology, and correlation of effects with
neurochemical parameters. Neurotoxicol. Teratol., 10: 155-167.
EVANS, H.L., GARMAN, R.H., & WEISS, B. (1977) Methylmercury: exposure
duration and regional distribution as determinants of neurotoxicity in
non-human primates. Toxicol. appl. Pharmacol., 41: 15-33.
FAIR, P.H., BALTHROP, J.E., WADE, J.L., & BRADDON-GALLOWAY, S.
(1987). In vivo incorporation of 14C leucine into brain protein of
mice treated with methylmercury and thiol complexes of methylmercury.
Toxicol. Lett., 36: 213-220.
FALK, S.A., KLEIN, R., HASEMAN, J.K., SANDERS, G.M., & TALLEY,
F.A. (1974) Acute methylmercury intoxication and ototoxicity in guinea
pigs. Arch. Pathol., 97: 297-305.
FANG, S.C. (1980) Comparative study of uptake and tissue distribution
of methylmercury in female rats by inhalation and oral routes of
administration. Bull. environ. Contam. Toxicol., 24: 65-72.
FARANT, J.P., BRISSETTE, D., MONCION, L., BIGRAS, L., &
CHARTRAND, A. (1981) Improved cold-vapor atomic absorption technique
for the microdetermination of total and inorganic mercury in biological
samples. J. anal. Toxicol., 5: 47-51.
FORHAMMER, M., ALBANUS, L., BRUCE, A., MATTSON, P., &
OHLIN, B. (1984) Fish consumption and mercury in hair in pregnant
women. Var Föda, 36: 2-13.
FOUASSIN, A. & FONDU, M. (1978) Evaluation de la teneur moyenne en
mercure de la ration alimentaire en Belgique. Arch. Belg. Med. Soc.
Hyg. Med Trav. Med Leg., 36: 481-490.
FRIBERG, L. (1983) Quality control in laboratories testing for
environmental pollution. In: Clarkson, T.W., Nordberg, G.F., & Sager,
P.R., ed. Reproductive and developmental toxicity of metals, New York,
London, Plenum Press, pp. 811-829.
FRIBERG, L. (1988) Quality assurance. In: Clarkson, T.W., Friberg, L.,
Nordberg, G.F., & Sager, P.R., eds. Biological monitoring of toxic
metals, New York, London, Plenum Press, pp. 103-126.
FRIBERG, L., KULLMAN, L., LIND, B., & NYLANDER, M. (1986)
Mercury in the central nervous system in relation to amalgam fillings.
Lakartidningen, 83: 519-522.
FUJIKI, M. & TAJUMA, S. (1975) Studies on the methylmercury formation
in the environment. In: Studies on the health effects of alkylmercury
in Japan, Tokyo, Environment Agency, pp. 11-19.
FURUTANI, A. & RUDD, J.W. (1980) Measurement of mercury methylation in
lake water and sediment samples. Appl. environ. Microbiol., 40: 770-
776.
GALSTER, W.A. (1976) Mercury in Alaskan Eskimo mothers and infants.
Environ. Health Perspect., 15: 135-140.
GANSER, A.L. & KIRSCHNER, D.A. (1985) The interaction of mercurials
with myelin: comparison of in vitro and in vivo effects.
Neurotoxicology, 6(1): 63-77.
GANTHER, H.E. (1978) Modification of methylmercury toxicity and
metabolism by selenium and vitamin E: possible mechanisms. Environ.
Health Perspect., 25: 71-76.
GANTHER, H.E. (1979) Metabolism of hydrogen selenide and methylated
selenide. Adv. Nutr. Rev., 2: 107-128.
GANTHER, H.E., GOUDIE, C., SUNDE, M.L., KOPECKY, M.J.,
WAGNER, P., OH, S.H., & HOEKSTRA, W.G. (1972) Selenium: relation to
decreased toxicity of methylmercury added to diets containing tuna.
Science, 175: 1122-1124.
GARTRELL, M.J., CRAUN, J.C., PODREBARAC, D.S., & GUNDERSON,
E.L. (1985a) Pesticides, selected elements and other chemicals in
adult total diet samples: October 1978-September 1979. J. Chem. Assoc.
Off. Anal. Chem., 68: 862-875.
GARTRELL, M.J., CRAUN, J.C., PODREBARAC, D.S., & GUNDERSON,
E.L. (1985b) Pesticides, selected elements and other chemicals in
adult total diet samples: October 1979-September 1980. J. Chem. Assoc.
Off. Anal. Chem., 68: 1184-1197.
GARTRELL, M.J., CRAUN, J.C., PODREBARAC, D.S., & GUNDERSON,
E.L. (1986) Pesticides, selected elements and other chemicals in adult
total diet samples: October 1980-March 1982. J. Chem. Assoc. Off. Anal.
Chem., 68: 146-161.
GATES, A.H., DOHERTY, R.A., & COX, C. (1986) Reproduction and growth
following prenatal methylmercuric chloride exposure in mice. Fundam.
appl. Toxicol., 7: 486-493.
GESAMP (1986) Review of potentially harmful substances: arsenic,
mercury and selenium, Geneva. IMO/FAO/UNESCO/WMO/WHO/IAEA/
UN/UNEP Joint Group of Experts on the Scientific Aspects of Marine
Pollution, World Health Organization (Reports and Studies No. 28).
GILBERT, M.M., SPRECHER, J., CHANG, L.W., & MEISNER, L.F. (1983)
Protective effect of vitamin E on genotoxicity of methylmercury. J.
Toxicol. environ. Health, 12: 767-773.
GIOVANOLI-JAKUBCZAK, T. & BERG, G. (1974) Measurement of
mercury in human hair. Arch. Environ. Health, 28: 139-144.
GONZALEZ, M.J., RICO, M.C., HERNANDEZ, L.M., & BALUJA, G. (1985)
Mercury in human hair: a study of residents in Madrid, Spain. Arch.
environ. Health, 40: 225-228.
GOWDY, J.M., YATES, R., & DEMERS, F.X. (1977) Blood mercury
concentration in an urban population. Sci. total Environ., 8: 247-251.
GREENWOOD, M.R. (1985) Methylmercury poisoning in Iraq. An
epidemiological study of the 1971-72 outbreak. J. appl. Toxicol.,
5(3): 148-159.
GREENWOOD, M.R., CLARKSON, T.W., DOHERTY, R.A., GATES, A.H.,
AMIN-ZAKI, L., ELHASSANI, S., & MAJEED, M.A. (1978) Blood clearance
half-times in lactating and nonlactating members of a population
exposed to methylmercury. Environ. Res., 16: 48-54.
GREGUS, Z. & VARGA, F. (1985) Role of glutathione and hepatic
glutathione S-transferase in the biliary excretion of methylmercury,
cadmium, and zinc: a study with enzyme inducers and glutathione
depletors. Acta pharmacol. toxicol., 56: 398-403.
GRUENWEDEL, D.W. & DIAHAM, B. (1982) Methylmercury(II)-induced
histone perturbations in nuclei isolated from calf thymus. Mol.
Pharmacol., 22: 121-126.
GRUNDT, I.K. & NESKOVIC, N.M. (1985) UDP-Galactose: ceramide
galactosyltransferase and 2',3'-cyclic-nucleotide-3'-phosphodiesterase
activities in rat brain after long-term exposure to methylmercury or
triethyl-lead. Exp. Neurol., 88(3): 580-589.
GRUNDT, I.K. & BAKKEN, A.M. (1986) Adenine nucleotides in cultured
brain cells after exposure to methylmercury and triethyl lead. Acta
pharmacol. toxicol., 59: 11-16.
GRUNDT, I.K., AMMITZBOLL, T., & CLAUSEN, J. (1981) Triethyl-lead
treatments of cultured brain cells. Effect on accumulation of
radioactive precursors in callactolipids. Neurochem. Res., 6: 193-201.
GRUNDT, I.K., ROUX, F., TREICH, I., LORIETTE, C., RAULIN, J., &
FOURNIER, E. (1982) Effects of methylmercury and triethyllead on
Na+K+ATPase and Pyruvate dehydrogenase activities in glioma C6
cells. Acta pharmacol. toxicol., 51: 6-11.
GUNDERSON, V.M., GRANT, K.S., BURBACHER, T.M., FAGAN, J.F.,
& MOTTET, N.K. (1986) The effect of low-level prenatal methylmercury
exposure on visual recognition memory of infant carb-eating macaques.
Child Dev., 57: 1076-1083.
HANSEN, J.C., KROMANN, N., WULF, H.C., & ALBOGE, K. (1984)
Selenium and its interrelation with mercury in whole blood and hair in
an east Greenlandic population. Sci. total Environ., 38: 33-40.
HARADA, M., FUJINO, T., AKAGI, T., & NISHIGAKI, S. (1976)
Epidemiological and clinical study and historical background of mercury
pollution on Indian reservations in northwestern Ontario. Canada Bull.
Inst. Const. Med., 26: 169-184.
HARADA, M., FUJINO, T., & KABASHIMA, K. (1977) A study of
methylmercury concentration in the umbilical cords of the inhabitants
born in the Minamata area. Brain Dev., 9: 79-84 (In Japanese).
HARADA, Y. (1968) Congenital (or fetal) Minamata Bay disease. In:
Minamata disease, Kumamoto, Study Group of Minamata Disease, Kumamoto
University.
HARADA, Y. & MORIYAMA, H. (1977) [Study on the motor ability of school
children in the Minamata district.] Environ. Health Rep., 40: 97-99 (in
Japanese).
HARGREAVES, R.J., MOORHOUSE, S.R., GANGOLI, S.D., &
PELLING, D. (1986) The effects of methylmercury on glucose transport,
glucose metabolism and blood flow in the central nervous system of the
rat. In: Suckling, A.J., Rumsbury, M.G., & Bradbury, M.W.B., ed. The
blood-brain barrier in health and disease, Chichester, Ellis Horwood,
pp. 165-176.
HARPER, K., BURNS, R., & ERICKSON, R.P. (1981) Genetic aspects of the
effects of methylmercury in mice: the incidence of cleft palate and
concentrations of adenosine 3':5' cyclic monophosphate in tongue and
palatal shelf. Teratology, 23: 397-401.
HATCH, R.W. & OTT, W.L. (1969) Determination of sub-microgram
quantities of mercury by atomic absorption spectrophotometry. Anal.
Chem., 40: 2085-2087.
HAXTON, J., LINDSAY, D.G., HISLOP, J.S., SALMON, L., DIXON, E.J.,
EVANS, W.H., REID, J.R., HEWITT, C.J., & JEFFRIES, D.F. (1979)
Duplicate diet study on fishing communities in the United Kingdom:
mercury exposure in a "critical group". Environ. Res., 18: 351-368.
HERIGSTAD, R.R., WHITEHAIR, C.K., BEYER, N., MICKELSEN, O.,
& ZABIK, M.J. (1972) Chronic methylmercury toxicosis in calves. J. Am.
Vet. Med. Assoc., 160: 173-182.
HIRANO, M., MITSUMORI, K., MAITA, K., & SHIRASU, Y. (1986) Further
carcinogenicity study on methylmercury chloride in ICR mice. Nippon
Juigaku Zasshi, 48: 127-135.
HIRAYAMA, K. (1980) Effect of amino acids on brain uptake of
methylmercury. Toxicol. appl. Pharmacol., 55: 318-323.
HIRAYAMA, K. (1985) Effects of combined administration of thiol
compounds and methylmercury chloride on mercury distribution in rats.
Biochem. Pharmacol., 34: 3030-3032.
HIRAYAMA, K. & YASUTAKE, A. (1986) Sex and age differences in
mercury distribution and excretion in methylmercury-administered mice.
J. Toxicol. environ. Health, 18: 49-60.
HIROTA, Y., YAMAGUCHI, S., SHIMOJOH, N., & SANO, K. (1980)
Inhibitory effect of methylmercury on the activity of glutathione
peroxidase. Toxicol. appl. Pharmacol., 53: 174-176.
HISLOP, J.S., COLLIER, T.R., WHITE, G.F., KHATHING, D.T., &
FRENCH, E. (1983) The use of keratinised tissues to monitor the
detailed exposure of man to methyl mercury from fish. In: Brown, S.S. &
Savory, J., ed. Chemical toxicology and clinical chemistry of metals,
New York, Academic Press, pp. 145-148.
HORVAT, K., MAY, M., STOEPPLER, A., & BYRNE, R. (1988) Comparative
studies of methylmercury determination in biological and environmental
samples. Appl. organomet. Chem., 2: 515-524.
HORVAT, M., STEGNAR, A., BYRNE, R., DERMELJ, M., &
BRANICA, A. (1988) A study of trace elements in human placenta, blood
and hair from the Yugoslav central Adriatic. In: Braetter, P. &
Schramel, P., ed. Trace elements-analytical chemistry in medicine and
biology, Berlin, W. de Gruyter & Co., pp. 243-250.
HOSKINS, B.B. & HUPP, E.W. (1978) Methylmercury effects in rat,
hamster, and squirrel monkey. Environ. Res., 15: 5-19.
HOWARD, J.D. & MOTTET, N.K. (1986) Effects of methylmercury on the
morphogenesis of the rat cerebellum. Teratology, 34: 89-95.
HSIEH, H.S. & GANTHER, H.E. (1975) Acid-volatile selenium formation
catalyzed by glutathione reductase. Biochemistry 14(8): 1632-1636.
HULTBERG, H. & HASSELROT, B. (1981) Mercury in the ecosystem. In:
Project coal, health and environment, Vallingby, Swedish State Power
Board, pp. 33-51.
HUNTER, D. & RUSSELL, D.S. (1954) Focal cerebral and cerebellar atrophy
in a human subject due to organic mercury compounds. J. Neurol.
Neurosurg. Psychiatr., 17: 235-241.
IMURA, N., MIURA, K., INOKAWA, M., & NAKADA, S. (1980)
Mechanism of methylmercury cytotoxicity: by biochemical and
morphological experiments using cultured cells. Toxicology, 17: 241-
254.
INOUYE, M., KAJIWARA, Y., & HIRAYAMA, K. (1986) Dose and
sex-dependent alterations in mercury distribution in fetal mice
following methylmercury exposure. J. Toxicol. environ. Health, 19: 425-
435.
INSKIP, M.J. & PIOTROWSKI, J.K. (1985) Review of the health effects of
methylmercury. J. appl. Toxicol., 5: 113-133.
IRPTC (1987) IRPTC Legal file 1986, Geneva, International Register of
Potentially Toxic Chemicals, United Nations Environment Programme, Vol.
II.
IWATA, H., OKAMOTO, H., & OHSAWA, Y. (1973) Effect of selenium on
methylmercury poisoning. Res. Commun. chem. Pathol. Pharmacol., 5:
673.
JACOBS, A.J., MANISCALCO, W.M., & FINKELSTEIN, J.N. (1986)
Effects of methylmercuric chloride, cyclohexamide and colchicine on the
reaggregation of dissociated mouse cerebellar cells. Toxicol. appl.
Pharmacol., 86: 362-371.
JACOBS, J.M., CARMICHAEL, N., & CAVANAGH, J.B. (1977)
Ultrastructural changes in the nervous system of rabbits poisoned with
methylmercury. Toxicol. appl. Pharmacol., 39: 249-261.
JAKLEVIC, J.M., FRENCH, W.R., CLARKSON, T.W., & GREENWOOD,
M.R. (1978) X-ray fluorescence analysis applied to small samples. In:
Barrett, C.S., Leyden, D.E., Newkirk, J.B., & Rudd, C.O., ed. Advances
in X-ray analysis, New York, London, Plenum Press, Vol. 21, pp. 171-
185.
JERNELOV, A. (1972) Mercury and food chains. In: Hartung, R. & Binman,
B.D., ed. Environmental mercury contamination, Ann Arbor, Michigan, Ann
Arbor Science Publishers, pp. 174-177.
JOHANNESSON, T., LUND, G., & STEINNES, E. (1981) Mercury, arsenic,
cadmium, selenium and zinc in human hair and salmon fries in Iceland.
Acta pharmacol. toxicol., 48: 185-189.
JOHNSON, D.C. & BRAMAN, R.S. (1974) Distribution of atmospheric mercury
species near ground. Environ. Sci. Technol., 8: 1003-1009.
JUNGHANS, R.P. (1983) A review of the toxicity of methylmercury
compounds with application to occupational exposures associated with
laboratory uses. Environ. Res. 31: 1-31.
KASUYA, M. (1980) The effect of methylcobalamin on the toxicity of
methylmercury and mercuric chloride on nervous tissue in culture.
Toxicol. Lett., 7: 87-93.
KATO, I., AOYAGI, M., SATO, Y., MIZUKOSHI, K., & KAWASAKI, T.
(1981) Electrooculographic evaluation of methylmercury intoxication
in monkeys. Exp. Neurol., 72: 51-62.
KAWADA, J., NISHIDA, M., YOSHIMURA, Y., & MITANI, K. (1980)
Effects of organic and inorganic mercurials on thyroidal functions. J.
Pharm. Dyn., 3: 149-159.
KAWASAKI, Y., IKEDA, Y., YAMAMOTO, T., & IKEDA, K. (1986)
Long-term toxicity study of methylmercury chloride in monkeys. J. Food
Hyg. Soc. Jpn, 27(5): 528-552.
KAZANTZIS, G., AL-MUFTI, A.W., AL-JAWAD, A., AL-SHAHWANI,
Y., MAJID, M.A., MAHMOUD, R.M., SOUFI, M., TAWFIQ, K.,
IBRAHIM, M.A., & DABAGH, H. (1976a) Epidemiology of organomercury
poisoning in Iraq: II. Relationship of mercury levels in blood and
hair to exposure and to clinical findings. Bull. World Health Organ.,
53(Suppl.): 37-48.
KAZANTZIS, G., AL-MUFTI, A.W., COPPLESTONE, J.F., MAJID, M.A., &
MAHMOUD, R.M. (1976b) Epidemiology of organomercury poisoning in Iraq:
III. Clinical features and their changes with time. Bull. World Health
Organ., 53(Suppl.): 49-60.
KELMAN, B.J., WALTER, B.K., & SASSER, L.B. (1982) Fetal distribution of
mercury following introduction of methylmercury into porcine maternal
circulation. J. Toxicol. environ. Health, 10: 191-200.
KELMAN, B.J., STEINMETZ ,S.E., WALTER, B.K., & SASSER, L.B. (1980)
Absorption of methylmercury by the fetal guinea pig during mid to late
gestation. Teratology, 21: 161-165.
KERSHAW, T.G., CLARKSON, T.W., & DHAHIR, P.H. (1980) The
relationship between blood levels and dose of methylmercury in man.
Arch. environ. Health, 35(1): 28-36.
KHM (1981) Summary situation report. In: Project coal, health and
environment, Valingby, Swedish State Power Board.
KJELLSTROM, T., REEVES, R., & MITCHELL, J. (1982) Comparison
of mercury in hair with fish-eating habits of children in Auckland.
Commun. Health Stud. (Adelaide), 6: 57-63.
KJELLSTROM, T., KENNEDY, P., WALLIS, & MANTELL, C. (1986)
Physical and mental development of children with prenatal exposure to
mercury from fish. Stage 1. Preliminary tests at age 4, Solna, National
Swedish Environmental Board, 96 pp (Report No. 3080).
KJELLSTROM, T., KENNEDY, P., WALLIS, S., STEWART, A.,
FRIBERG, L., LIND, B., WUTHERSPOON, P., & MANTELL, C. (1989)
Physical and mental development of children with prenatal exposure
to mercury from fish. Stage 2. Interviews and psychological tests at
age 6, Solna, National Swedish Environmental Board, 112 pp (Report no.
3642).
KOBAYASHI, H., YUYAMA, A., MATSUSAKA, N., TAKENO, K., &
YANAGIVA, I. (1979) Effects of methylmercury chloride on various
cholinergic parameters in vitro. J. toxicol Sci., 4: 351-362.
KOBAYASHI, H., YUYAMA, A., MATSUSUAKA, N., TAKENO, K., &
YANAGIVA, I. (1981) Neuropharmacological effect of methylmercury in
mice with special reference to the central cholinergic system. Jpn. J.
Pharmacol., 31: 711-718.
KOLLER, L.D. & ROAN, J.G. (1980) Effects of lead, cadmium and
methylmercury on immunological memory. J. environ. Pathol. Toxicol., 4:
47-52.
KOLLER, L.D., ROAN, J.G., & BRAUNER, J.A. (1980) Methylmercury:
Effects of B-lymphocyte receptors and phagocytosis of macrophages. J.
environ. Pathol. Toxicol., 3: 407-411.
KOMSTA-SZUMSKA, E. & MILLER, D.R. (1984) A kinetic analysis of the
interaction between methylmercury and selenium. Toxicology, 33: 247-
257.
KOSTA, L. & BYRNE, R. (1969) Activation analysis for mercury in
biological samples at nanogram level. Talanta, 16: 1297-1302.
KUHNERT, P.M., KUHNERT, B.R., & ERHARD, P. (1981) Comparison of
mercury levels in maternal blood, fetal cord blood, and placental
tissues. Am. J. Obstet. Gynecol., 139: 209-213.
KUTSCHER, C.L., SEMBRAT, M., KUTSCHER, C.S., & KUTSCHER, N.L.
(1985) Effects of the high methylmercury dose used in the
collaborative behavioral teratology study on brain anatomy. Neurobehav.
Toxicol. Teratol., 7(6): 775-777.
KYLE, J.H. & GHANI, N. (1982a) Methylmercury in human hair: a study of
a Papua New Guinean population exposed to methylmercury through fish
consumption. Arch. environ. Health, 37: 266-270.
KYLE, J.H. & GHANI, N. (1982b) Elevated mercury levels in people from
Lake Murray, Western Province. Papua New Guinea med. J., 25: 81-88.
KYLE, J.H. & GHANI, N. (1983) Mercury concentrations in canned and
fresh fish and its accumulation in a population of Port Moresby
residents. Sci. total Environ., 26: 157-162.
LAKOWICZ, J.R. & ANDERSON, C.J. (1980) Permeability of lipid bilayers
to methylmercuric chloride: quantification by fluorescence quenching of
a carbazole-labelled phospholipid. Chem.-biol. Interact., 30: 309-323.
LAUWERYS, R., BUCHET, J.P., ROELD, H., & HUBERMONT, G. (1978)
Placental transfer of lead, mercury, cadmium, and carbon monoxide in
women. I. Comparison of the frequency distributions of the biological
indices in maternal and umbilical cord blood. Environ. Res., 15: 278-
289.
LEBLANC, R.M., JOLY, L.P., & PAIEMENT, J. (1984) pH-Dependent
interaction between methylmercury chloride and some membrane
phospholipids. Chem.-biol. Interact., 48: 237-241.
LEE, I.D. & DIXON, R.L. (1975) Effects of mercury on spermato-genesis
studied by velocity sedimentation, cell separation and serial mating.
J. Pharmacol. exp. Ther., 194: 171-181.
LEE, M., CHAN, K.S., SAIRENJI, E., & NIIKUNI, T. (1979) Effect of
sodium selenite on methylmercury-induced cleft palate in the mouse.
Environ. Res., 19: 39-48.
LEVESQUE, P. & ATCHISON, W. (1988) Effect of alteration of nerve
terminal Ca2+ regulation on increased spontaneous quantal release of
acetylcholine by methylmercury. Toxicol. appl. Pharmacol., 94: 55-65.
LIE, A., GUNDERSEN, N.M., & KORSGAARD, K.J. (1982) Mercury in
urine-sex, age and geographic differences in a reference population.
Scand. J. environ. Health, 8: 129-133.
LIND, B., BIGRAS, L., CERNICHIARI, E., CLARKSON, T.W., FRIBERG,
L., HELLMAN, M., KENNEDY, P., KIRKBRIDE, J., KJELLSTROM, T., &
OHLIN, B. (1988a) Quality control of analyses of mercury in hair.
Fresenius Z. anal. Chem., 332: 630-632.
LIND, B., FRIBERG, L., & NYLANDER, M. (1988b) II. Demethylation of
mercury in brain. J. Trace Elem. exp. Med., 1: 49-56.
LINDBERG, S., STOKES, P., GOLDBERG, E., & WREN, C. (1987) Group
report: Mercury. In: Hutchinson, T.W. & Meema, K.M., ed. Lead,
mercury, cadmium and arsenic in the environment, New York, Chichester,
Brisbane, Toronto, John Wiley & Sons, pp. 17-34.
LINDQVIST, O., JERNELOV, A., JOHANSSON, K., & RODHE, R. (1984)
Mercury in the Swedish environment: global and local sources, Solna,
National Swedish Environment Protection Board, 105 pp (Report No.
1816).
LOGDBERG, B., BRUN, A., BERLIN, M., & SCHUTZ, A. (1988) Congenital
lead encephalopathy in monkeys. Acta neuropathol., 77: 120-127.
LOK, E. (1983) The effect of weaning on blood, hair, fecal and urinary
mercury after chronic ingestion of methylmercury chloride by infant
monkeys. Toxicol. Lett., 15: 147-152.
LOMMEL, A., KRUSE, H., & WASSERMANN, O. (1985) Organochloride and
mercury in blood of a fish-eating population at the River Elbe in
Schleswig-Hostein, FRG. Arch. Toxicol., 8(Suppl.): 264-268.
MACFARLANE, D.E. (1981) The effects of methylmercury on platelets.
Mol. Pharmacol., 19: 470-476.
MCKEOWN-EYSSEN, G.E. & RUEDY, J. (1983a) Methylmercury exposure in
northern Quebec. I. Neurological findings in adults. Am. J. Epidemiol.,
118: 461-469.
MCKEOWN-EYSSEN, G.E. & RUEDY, J. (1983b) Prevalence of neurological
abnormality in Cree Indians exposed to methylmercury in northern
Quebec. Clin. invest. Med., 6: 161-169.
MCKEOWN-EYSSEN, G.E., RUEDY, J., & NEIMS, A. (1983) Methylmercury
exposure in northern Quebec. II. Neurological findings in children.
Am. J. Epidemiol., 118: 470-479.
MCKONE, C.E., YOUNG, C.A., BACHE, C.A., & LISK, D.J. (1971) Rapid
uptake of mercuric ion by goldfish. Environ. Sci. Technol., 5: 1138-
1139.
MAGNAVAL, R. & BATTI, R. (1980) Protective effect of phospho-lipids in
methylmercury inhibition of hydroxybutyrate dehydrogenase. Toxicol.
Lett., 5: 353-356.
MAGNUSSON, J. & RAMEL, C. (1986) Genetic variation in the
susceptibility to mercury and other metal compounds in Drosophila
melanogaster. Teratog. Carcinog. Mutagen., 6: 4.
MAGOS, L. (1971) Selective atomic-absorption determination of inorganic
mercury and methylmercury in undigested biological samples. Analyst,
96: 847-853.
MAGOS, L. (1982) Neurotoxicity, anorexia and the preferential choice of
antidote in methylmercury intoxicated rats. Neurobehav. Toxicol.
Teratol., 4: 643-646.
MAGOS, L. (1987) The absorption, distribution, and excretion of methyl
mercury. In: Edccles, C.U. & Annau, Z., ed. The toxicity of methyl-
mercury, Baltimore, John Hopkins University Press, pp. 24-44.
MAGOS, L. & BUTLER, W.H. (1972) Cumulative effects of methylmercury
dicyandiamide given orally to rats. Food Cosmet. Toxicol. 10: 513-517.
MAGOS, L. & CLARKSON, T.W. (1972) Atomic absorption determination of
total, inorganic and organic mercury in blood. J. Assoc. Off. Anal.
Chem., 55: 966-971.
MAGOS, L. & WEBB, M. (1977) The effect of selenium on the brain uptake
of methylmercury. Arch. Toxicol., 38: 201-207.
MAGOS, L., BAKIR, F., CLARKSON, T.W., AL-JAWAD, A.M., &
AL-SOFFI, M.H. (1976) Tissue levels of mercury in autopsy specimens of
liver and kidney. Bull. World Health Organ., 53: 93-96.
MAGOS, L., WEBB, M., & HUDSON, A.R. (1979) Complex formation between
selenium and methylmercury. Chem.-biol. Interact., 28: 201-207.
MAGOS, L., PERISTIANIS, C., CLARKSON, T.W., BROWN, A., PRESTON,
S., & SNOWDEN, R.T. (1981) Comparative study of the sensitivity of male
and female rats to methylmercury. Arch. Toxicol., 48: 11-20.
MAGOS, L., CLARKSON, T.W., & HUDSON, A.R. (1984) Differences in the
effects of selenite and biological selenium on the chemical form and
distribution of mercury after the simultaneous administration of HgCl2
and selenium to rats. J. Pharmacol. exp. Therap. 228(2): 478-483.
MAGOS, L., BROWN, A.W., SPARROW, S., BAILEY, E., SNOWDEN, R.T., &
SKIPP, W.R. (1985a) The comparative toxicology of ethyl- and
methylmercury. Arch. Toxicol., 57: 260-267.
MAGOS, L., CIKRT, M., & SNOWDEN, R. (1985b) The dependence of biliary
methylmercury secretion on liver GSH and ligandin. Biochem.
Pharmacol., 34: 301-305.
MAILHES, J.B. (1983) Methylmercury effects on Syrian hamster metaphase
II oocyte chromosomes. Environ. Mutagen., 5: 679-686.
MARC (1981) Health effects of methylmercury, London, Monitoring and
Assessment Research Centre, University of London, 82 pp (MARC Report
Number 24).
MARSH, D.O., MYERS, G.J., CLARKSON, T.W., AMIN-ZAKI, L., &
TIKRITI, S. (1977) Fetal methylmercury poisoning. New data on clinical
and toxicological aspects. Trans. Am. Neurol. Assoc., 102: 69-71.
MARSH, D.O., MYERS, G.J., CLARKSON, T.W., AMIN-ZAKI, L., TIKRITI,
S., & MAJEED, M.A. (1980) Fetal methylmercury poisoning: clinical and
toxicological data on 29 cases. Ann. Neurol., 7: 348-355.
MARSH, D.O., MYERS, G.J., CLARKSON, T.W., AMIN-ZAKI, L. TIKRITI,
S, MAJEED, M.A., & DABBAGH, A.R. (1981) Dose-response relationship for
human fetal exposure to methylmercury. Clin. Toxicol., 18: 1311-1318.
MARSH, D.O., CLARKSON, T.W., COX, C., MYERS, G.J., AMIN-ZAKI, L.,
& AL-TIKRITI, S. (1987) Fetal methylmercury poisoning. Arch. Neurol.,
44: 1017-1022.
MASUKAWA, T., KITO, H., HAYASHI, M., & IWATA, H. (1982) Formation
and possible role of bis(methylmercuric) selenide in rats treated with
methylmercury and selenite. Biochem. Pharmacol., 31: 75-78.
MATTHEWS, A.D. (1983) Mercury content of commercially important fish of
the Seychelles, and hair mercury levels of a selected part of the
population. Environ. Res., 30: 305-312.
MATTSSON, J.L., MILLER, E., ALLIGOOD, J.P., KOERING, J.E., &
LEVIN, S.G. (1981) Early effects of methylmercury on the visual evoked
response of the dog. Neurotoxicity, 2: 499-514.
MAY, K., STOEPPLER, M., & REISINGER, K. (1987) Studies in the ratio
total mercury/methylmercury in the aquatic food chain. Toxicol.
environ. Chem., 13: 153-159.
MIETTINEN, J.K. (1973) Absorption and elimination of dietary mercury
(Hg++) and methylmercury in man. In: Miller, M.W. & Clarkson, T.W., ed.
Mercury, mercurials and mercaptans, Springfield, Illinois, Charles C.
Thomas, pp. 233-246.
MILLER, C.T., KREWSKI, D., & TRYPHONAS, L. (1985)
Methylmercury-induced mitochondrial DNA synthesis in neural tissue of
cats. Fundam. appl. Toxicol., 5(2): 251-264.
MINAGAWA, K., SASAKI, T., TAKIZAWA, K., TAMURA, R., & OSHINA,
T. (1980) Accumulation route and chemical form of mercury in mushroom
species. Bull. environ. Contam. Toxicol., 25: 382-388.
MITSUMORI, K., MAITA, M., SAITO, T., TSUDA, S., & SHIRASU, Y. (1981)
Carcinogenicity of methylmercury chloride in ICR mice: preliminary note
on renal carcinogenesis. Cancer Lett., 12: 305-310.
MITSUMORI, K., MAITA, K., & SHIRASU, Y. (1984) Chronic toxicity of
methylmercury chloride in rats: pathological study. Jpn. J. vet. Sci.,
46: 549-557.
MIURA, K. & IMURA, N. (1987) Mechanism of methylmercury cytotoxicity.
Crit. Rev. in Toxicol., 18(3): 161-188.
MIURA, K., SUZUKI, K., & IMURA, N. (1978) Effects of methylmercury on
mitotic mouse glioma cells. Environ. Res., 17: 453-471.
MIURA, K., INOKAWA, M., & IMURA, N. (1984) Effects of methylmercury
and some metal ions on microtubule networks in mouse glioma cells and
in vitro tubulin polymerization. Toxicol. appl. Pharmacol., 73: 218-
231.
MOHAMED, M.K., EVANS, T.C., MOTTET, N.K., & BURBACHER, T.M.
(1986a) effects of methylmercury on sperm oxygen consumption. Acta
pharmacol. toxicol., 58: 219-224.
MOHAMED, M.K., LEE, W.I., MOTTET, N.K., & BURBACHER, T.M.
(1986b) Laser ligh-scattering study of the toxic effects of
methylmercury on sperm motility. J. Androl., 5(1): 11-15.
MORIMOTO, K., IIJIMA, S., & KOIZUMI, A. (1982) Selenite prevents the
induction of sister-chromatid exchanges by methylmercury and mercuric
chloride in human whole-blood cultures. Mut. Res., 102: 183-192.
MOTTET, N.K., SHAW, C.M., & BURBACHER, T.M. (1987) The pathological
lesions of methyl mercury intoxications in monkeys. In: Eccles, C.U. &
Annau, Z., ed. The toxicity of methyl mercury, Baltimore, John Hopkins
University Press, pp. 73-103.
MULDER, K.M. & KOSTYNIAK, P.J. (1985a) Effects of L-(alpha) S,5S)-
alpha-3-chloro-4,5-dihydro-5-isoxazoleacetic acid on urinary excretion
of methylmercury in the mouse. J. Pharmacol. exp. Ther., 234: 156-160.
MULDER, K.M. & KOSTYNIAK, P.J. (1985b) Involvement of glutathione in
the enhanced renal excretion of methylmercury in CFW Swiss mice.
Toxicol. appl. Pharmacol., 78: 451-457.
MUNRO, I.C., NERA, E.A., CHARBONNEAU, S.M., JUNKINS, B., &
ZAWIDZKA, Z. (1980) Chronic toxicity of methylmercury in the rat. J.
environ. Pathol. Toxicol., 3: 347-447.
MUSHAK, P. (1987) The quantitative measurement of methylmercury. In:
Eccles, C.U. & Annau, Z., ed. The Toxicity of methyl mercury,
Baltimore, Johns Hopkins University Press, pp. 1-12.
MYKKANEN, H., RASANEN, L., AHOLA, M., & KIMPPA, S. (1986) Dietary
intakes of mercury, lead, cadmium and arsenic by Finnish children.
Hum. Nutr. appl. Nutr., 40: 32-39.
NABRZYSKI, M. & GAJEWSKA, R. (1984) Determination of mercury,
cadmium, and lead in food. Rocz. PZH, 35(1): 1-11 (in Polish).
NAGANUMA, A. & IMURA, N. (1980) Bis(methylmercuric) selenide as a
reaction product from methylmercury and selenite in rabbit blood. Res.
Commun. chem. Pathol. Pharmacol., 27: 163-173.
NAGANUMA, A. & IMURA, N. (1984) Species differences in biliary
excretion of methylmercury. Biochem. Pharmcol., 33: 679-682.
NAGANUMA, A., KOYAMA, Y., & IMURA, N. (1980) Behavior of
methylmercury in mammalian erythrocytes. Toxicol. appl. Pharmacol., 54:
405-410.
NAKADA, S. & IMURA, N. (1982) Uptake of methylmercury and inorganic
mercury by mouse glioma and mouse neuroblastoma cells. Neurotoxicology
3: 249-258.
NAKADA, S. & IMURA, N. (1983) Susceptibility of lipids to mercurials.
J. appl. Toxicol., 3: 131-135.
NAKADA, S., NOMOTO, A., & IMURA, N. (1980) Effect of methylmercury
and inorganic mercury on protein synthesis in mammalian cells.
Ecotoxicol. environ. Saf., 4: 184-190.
NATIONAL ACADEMY OF SCIENCES (1978) An assessment of mercury in
the environment, Washington, DC, National Academy of Sciences, National
Research Council.
NEWBERNE, P.M., GLASER, O., FRIEDMAN, L., & STILLINGS, B.R. (1972)
Chronic exposure of rats to methyl mercury in fish protein. Nature
(Lond.), 237: 40-41.
NISHIKIDO, N., FURUYASHIKI, K., NAGANUMA, A., SUZUKI, T., &
IMURA, M. (1987) Maternal selenium deficiency enhances the fetolethal
toxicity of methylmercury. Toxicol. appl. Pharmacol., 88: 322-328.
NISHIKIDO, N., SATOH, Y., NAGANUMA, A., & IMURA, N. (1988a) Effect
of maternal selenium deficiency on the teratogenicity of methylmercury.
Toxicol. Lett., 40: 153-157.
NISHIKIDO, N., SATOH, Y., IWAI, I., ISHII, M., NAGANUMA, A., &
IMURA, A. (1988b) Specific alteration of the form of selenium in fetal
liver on maternal methylmercury treatment. Toxicol. appl. Pharmacol.,
92(3): 497-499.
NIXON, J.E., KOLLER, L.D., & EXON, J.H. (1979) Effect of methylmercury
chloride on transplacental tumors induced by sodium nitrites and
ethylurea in rats. J. Natl Cancer Inst., 63: 1057-1063.
NOBUNAGA, T., SATOH, H., & SUZUKI, T. (1979) Effects of sodium
selenite on methylmercury embryotoxicity and teratogenicity in mice.
Toxicol. appl. Pharmacol., 47: 79-88.
NORDBERG, G.F. & STRANGERT, P. (1976) Estimations of a dose-response
curve for long-term exposure to methylmercury compounds in human beings
taking into account variability of critical organ concentrations and
biological half-times. A preliminary communication. In: Nordberg,
G.F., ed. Effects and dose-response relationships, Amsterdam, Oxford,
New York, Elsevier Science Publishers, pp. 273-282.
NORDBERG, G.F. & STRANGERT, P. (1978) Fundamental aspects of dose-
response relationships and their extrapolation for non-carcinogenic
effects of metals. Environ. Health Perspect., 22: 97-108.
NORDBERG, G.F. & STRANGERT, P. (1982) Risk estimation models derived
from metabolic and damage parameter variation in the population. In:
Vouk, V.B., Butler, G.C., Hoel, D.G., & Peakall, D.B., ed. Methods for
estimating risk of chemical injury: Human and non-human biota and
ecosystems, Chichester, West Sussex, John Wiley and Sons, pp. 477-491
(SGOMSEC 2).
NORSETH, T. & CLARKSON, T.W. (1971) Intestinal transport of 203Hg-
labeled methyl mercury chloride. Role of biotransformation in rats.
Arch. environ. Health, 22: 668-577.
NRIAGU, J.O. (1979) The biogeochemistry of mercury in the environment,
Amsterdam, Oxford, New York, Elsevier Science Publishers.
NYLANDER, N., FRIBERG, L., & LIND, B. (1987) Mercury concentration in
the human brian and kidneys in relation to exposure from dental
amalgams. Swed. dent. J., 11: 179-187.
O'KUSKY, J.R., BOYES, B.E., & MCGEER, E.G. (1988)
Methylmercury-induced movement and postural disorders in developing
rat: regional analysis of brain catecholamines and indoleamines. Brain
Res., 439(1/2): 138-146.
OHI, G., NISHIGAKI, S., SEKI, H., TAMURA, Y., MAKI, T., MINOWA, K.,
SHIMAMURA, Y., MIZOGUCHI, I., INABA, Y., TAZIKAWA, Y., &
KAWANISHI, Y. (1980) The protective potency of marine animal meat
against the neurotoxicity of methylmercury: its relationship with the
organ distribution of mercury and selenium. Food Cosmet. Toxicol., 18:
139-145.
OHLANDER, E.H., OHLIN, B., ALBANUS, L., & BRUCE, A. (1985) Mercury
levels in the hair of pregnant women eating Swedish fresh water fish.
Var Föda, 8: 393-394.
OHSAWA, M. & MAGOS, L. (1974) The chemical form of methylmercury
complex in rat bile. Biochem. Pharmacol., 23: 1903-1906.
OHSAWA, M., FUKUDA, K., & KAWAI, K. (1981) Accelerated accumulation
of methylmercury in the rat fetus at the late pregnant stage. Ind.
Health, 19: 219-221.
OLSON, F.C. & MASSARO, E.J. (1980) Developmental pattern of cAMP,
adenyl cyclase, and cAMP phosphdiesterase in the palate, lung, and
liver of the fetal mouse: alterations resulting from exposure to
methylmercury at levels inhibiting palate closure. Teratology, 22:
155-166.
OMATA, S., SAKIMURA, K., ISHII, T., & SUGANO, H. (1978) Chemical
nature of methylmercury complex with a low molecular weight in the
liver cytosol of rats exposed to methylmercury chloride. Biochem.
Pharmacol., 27: 1700-1701.
OMATA, S., HORIGOME, T., MOMOSE, Y., KAMBAYASHI, M.,
MOCHIZUKI, M., & SUGANO, H. (1980) Effects of methylmercury chloride
on the in vivo rate of protein synthesis in the brain of the rat: in
vivo rate of protein synthesis in the brain of the rat: examination
with the injection of a large quantity of 14C- valine. Toxicol. Appl.
Pharmacol., 56: 207-215.
OMATA, S., MOMOSE, Y., UEKI, H., & SUGANO, H. (1982) In vivo effect
of methylmercury on protein synthesis in peripheral nervous tissues of
the rat. Arch. Toxicol., 49: 203-214.
ONFELT, A. (1983) Spindle disturbances in mammalian cells. I. Changes
in the quantity of free sulfhydryl groups in relation to survival and
C-mitosis in V79 Chinese hamster cells after treatment with colcemid,
diamide, carbaryl and methylmercury. Chem.-biol. Interact., 46: 201-
217.
ONFELT, A. & JENSSEN, D. (1982) Enhanced mutagenic response of MNU by
post-treatment with methylmercury, caffeine or thymidine in V79 Chinese
hamster cells. Mutat. Res., 106: 297-303.
PACYNA, J.M. (1987) Atmospheric emissions of arsenic, cadmium, lead and
mercury from high temperature processes in power generation and
industry. In: Hutchinson, T.C. & Meema, K.M., ed. Lead, Mercury,
Cadmium and Arsenic in the environment, New York, Chichester, Brisbane,
Toronto, John Wiley & Sons, pp. 69-88 (SCOPE 31).
PALLOTTI, G., BENCIVENGA, B., & SIMONETTI, T. (1979) Total mercury
levels in whole blood, hair and fingernails for a population group from
Rome and its surroundings. Sci. total Environ., 2: 69-72.
PECKHAM, N.H. & CHOI, B.H. (1986) Surface change alterations in mouse
fetal astrocytes due to methylmercury: an ultra-structural study with
cationized ferritin. Exp. mol. Pathol., 44: 230-234.
PETER, F. & STRUNC, G. (1984) Semiautomated analysis for mercury in
whole blood, urine and hair by on-stream generation of cold vapor.
Clin. Chem., 30(6): 893-895.
PHELPS, R.W., CLARKSON, T.W., KERSHAW, T.G., & WHEATLEY, B.
(1980) Interrelationships of blood and hair mercury concentrations in
a North American population exposed to methylmercury. Arch. environ.
Health, 35: 161-168.
PIPER, R.C., MILLER, V.L., & DICKINSON, E.O. (1971) Toxicity and
distribution of mercury in pigs with acute methylmercurialism. Am. J.
vet. Res., 32: 263-273.
PRASAD, K.N. & RAMANUJAM, S. (1980) Vitamin E and vitamin C alter the
effect of methylmercuric chloride on neuroblastoma and glioma cells in
culture. Environ. Res., 21: 343-349.
PROHASKA, J.R. & GANTHER, H.E. (1977) Interactions between selenium
and methylmercury in rat brain. Chem.-biol. Interact. 16: 155-167.
QUANDT, F.N., KATO, E., & NARAHASHI, T. (1982) Effects of
methylmercury on electrical responses of neuroblastoma cells.
Neurotoxicology, 3: 205-220.
RAMANUJAM, M. & PRASAD, K.N. (1979) Alterations in gene expression
after chronic treatment of glioma cells in culture with methylmercuric
chloride. Biochem. Pharmacol., 28: 2979-2984.
RAMLAL, P.S., RUDD, J.W.M., FURUTANI, A., & XUN, L. (1985) The
effect of pH on methylmercury production and decomposition in lake
sediments. Can. J. Fish. aquat. Sci., 42: 685-692.
RAMLAL, P.S., RUDD, J.W.M., & HECKY, R.E. (1986) Methods for
measuring specific rates of mercury methylation and degradation and
their uses in determining factors controlling net rates of mercury
methylation. Appl. environ. Microbiol., 51: 110-114.
REBEL, G., GUERIN, P., & PRASAD, K.N. (1983) Effect of methylmercuric
chloride on gangliosides of mouse neuroblastoma cells in culture.
Lipids, 18: 664-667.
REFSVIK, T. (1984a) N-Acetylpenicillamine potentiated excretion of
methylmercury in rat bile: influence of S-methyl-cysteine. Acta
pharmacol. toxicol., 55: 121-125.
REFSVIK, T. (1984b) N-Acetylpenicillamine potentiation of biliary
excretion of methylmercury: influence of glutathione depletors. Acta
pharmacol. toxicol., 55: 58-64.
REFSVIK, T. & NORSETH, T. (1975) Methylmercuric compounds in rat bile.
Acta pharmacol. toxicol., 36: 67-78.
REUHL, K.R., CHANG, L.W., & TOWNSEND, J.W. (1981a) Pathological
effects of in utero methylmercury exposure on the cerebellum of
methylmercury exposure on the cerebellum of the golden hamster. I.
Early effects upon the neonatal cerebellar cortex. Environ. Res., 26:
281-306.
REUHL, K.R., CHANG, L.W., & TOWNSEND, J.W. (1981b) Pathological
effects of in utero methylmercury exposure on the cerebellum of
methylmercury exposure on the cerebellum of the golden hamster. II.
Residual effects on the adult cerebellum. Environ. Res., 26: 307-327.
RICHARDSON, R.J. & MURPHY, S.D. (1975) Effect of glutathione depletion
on tissue deposition of methylmercury in rats. Toxicol. appl.
Pharmacol., 31: 505-519.
RIOLFATTI, M. (1977) [Further epidemiological studies on mercury
concentrations in edible fish and in human blood and hair.] Ig. mod.,
70: 169-186 (in Italian).
RODIER, P.M. (1977) Correlation between prenatally-induced alterations
in CNS cell populations and postnatal function. Teratology, 16: 235-
246.
RODIER, P.M., ASHNER, M., & SAGER, P.R. (1984) Mitotic arrest in the
developing CNS after prenatal exposure to methylmercury. Neurobehav.
Toxicol. Teratol., 6: 379-385.
RODIER, P.M. & KATES, B. (1988) Histological localization of
methylmercury in mouse brain and kidney by emulsion autoradiography
203Hg. Toxicol. appl. Pharmacol., 92: 224-234.
ROELS, H., HUBERMONT, G., BUCHET, J.P., & LAUWERYS, R. (1978)
Placental transfer of lead, mercury, cadmium and carbon monoxide in
women. III. Factors influencing the accumulation of heavy metals in
the placenta and the relationship between metal concentration and the
placenta and in maternal and cord blood. Environ. Res., 16: 236-247.
ROWLAND, I.R., DAVIES, M.J., & EVANS, J.G. (1980) Tissue content of
mercury in rats given methylmercuric chloride orally: influence of
intestinal flora. Arch. environ. Health, 35: 155-160.
ROWLAND, I.R., ROBINSON, R.D., DOHERTY, R.A., & LANDRY, T.D.
(1983) Are developmental changes in methylmercury metabolism and
excretion mediated by the intestinal microflora? In: Clarkson, T.W.,
Nordberg, G.F., & Sager, P.R., ed. Reproductive and developmental
toxicity of metals, New York, London, Plenum Press, pp. 745-758.
ROWLAND, I.R., ROBINSON, R.D., & DOHERTY, R.A. (1984) Effects of diet
on mercury metabolism and excretion in mice given methylmercury: role
of gut flora. Arch. environ. Health, 39: 401-418.
ROWLAND, I.R., MALLETT, A.K., FLYNN, J., & HARGREAVES, R.J.
(1986) The effect of various dietary fibres on tissue concentration and
chemical form of mercury after methylmercury exposure in mice. Arch.
Toxicol., 59: 94-98.
RUDD, J.W.M., FURUTANI, A., & TURNER, M.A. (1980) Mercury
methylation by fish intestinal contents. Appl. environ. Microbiol., 40:
777-782.
RUSTAM, H., VON BURG, R., AMIN-ZAKI, L., & ELHASSANI, S. (1975)
Evidence for a neuromuscular disorder in methylmercury poisoning.
Arch. environ. Health, 30: 190-195.
SAGER, P.R. (1988) Selectivity of methyl mercury effects on
cytoskeleton and mitotic progression in cultured cells. Toxicol appl.
Pharmacol., 94: 473-486.
SAGER, P.R. & MATHESON, D. (1988) Mechanisms of neurotoxicity related
to selective disruption of microtubules and intermediate filaments.
Toxicology, 49(2-3): 479-492.
SAGER, P.R., DOHERTY, R.A., & OLMSTEAD, J.B. (1981a) Interaction of
methylmercury with microtubules. Toxicologist, 1: 118-119.
SAGER, P.R., DOHERTY, R.A., & OLMSTEAD, J.B. (1981b) Interactions of
methylmercury with microtubules. J. cell Biol., 91: 330a.
SAGER, P.R., DOHERTY, R.A., & RODIER, P.M. (1982) Morphometric
analysis of the effect of methylmercury on developing mouse cerebellar
cortex. Toxicologist, 2: 116.
SAGER, P.R., DOHERTY, R.A., & OLMSTEAD, J.B. (1983) Interaction of
methylmercury with microtubules in cultured cells and in vitro. Exp.
cell Res., 146: 127-137.
SAGER, P.R., ASHNER, M., & RODIER, P.M. (1984) Persistent differential
alterations in developing cerebellar cortex of male and female mice
after methylmercury exposure. Brain Res., 12: 1-11.
SARAFIAN, T. & VERITY, M.A. (1985) Inhibition of RNA and protein
synthesis in isolated cerebellar cells by in vitro and in vivo methyl-
mercury. Neurochem. Pathol., 3(1): 27-39.
SARAFIAN, T. & VERITY, M.A. (1986) Mechanism of apparent transcription
inhibition by methylmercury in cerebellar neurons. J. Neurochem.,
47(2): 625-631.
SARAFIAN, T.A., CHEUNG, M.K., & VERITY, M.A. (1984) In vitro
methylmercury inhibition of protein synthesis in neonatal cerebellar
perikarya. Neuropathol. appl. Neurobiol., 10: 85-100.
SATOH, H., YASUDA, N., & SHIMAI, S. (1985) Development of reflexes in
neonatal mice prenatally exposed to methylmercury and selenite.
Toxicol. Lett., 25: 199-203.
SCHROEDER, W.H. & JACKSON, R.A. (1987) Environmental measurements
with an atmospheric mercury monitor having specific capabilties.
Chemosphere, 16: 183-199.
SECO, J.M. (1987) Big mercury deposit found in Spain. Financial Times,
30 October 1987.
SHAMOO, A.E., MACLENNAN, D.H., & ELDEFRAWI, M.E. (1976)
Differential effects of mercurial compounds on excitable tissues.
Chem.-biol. Interact., 12: 41-52.
SHERLOCK, J.C., LINDSAY, D.G., HISLOP, J.E., EVANS, W.H., &
COLLIER, T.R. (1982) Duplication diet study on mercury intake by fish
consumption in the United Kingdom. Arch. environ. Health, 37: 271-278.
SHERLOCK, J.C. & QUINN, M. (1988) Underestimation of dose-response
relationship with particular reference to the relationship between the
dietary intake of mercury and its concentration in blood. Hum.
Toxicol. 7: 129-132.
SHERLOCK, J.C., HISLOP, J., NEWTON, D., TOPPING, G., & WHITTLE, K.
(1984) Elevation of mercury in human blood from controlled chronic
ingestion of methylmercury in fish. Hum. Toxicol., 3: 117-131.
SHIMAI, S. & SATOH, H. (1985) Behavioral teratology of methylmercury.
J. toxicol. Sci., 10: 199-216.
SHIMOJO, N., YAMAGUCHI, S., & SANO-KENICHI (1976) Methylmercury
derivatives in engine exhausts and its synthesis. Jpn. J. ind. Health,
18: 36-37.
SIDMAN, R.L. & RAKIC, P. (1973) Neuronal migration, with special
reference to developing human brain: a review. Brain Res., 63: 1-35.
SIKORSKI, R., PASZKOWSKI, T., & SZPRENGIER-JUSZKIEWICZ, T.
(1986) Mercury in neonatal scalp hair. Sci. total Environ., 57: 105-
110.
SILVER, S. (1984) Bacterial transformations of and resistance to heavy
metals. In: Nriagu, J.O., ed. Changing metal cycles and human health,
Berlin, Heidelberg, New York, Springer-Verlag, pp. 199-225.
SKERFVING, S. (1974) Methylmercury exposure, mercury levels in blood
and hair, and health status in Swedes consuming contaminated fish.
Toxicology, 2: 3-23.
SLOTKIN, T.A., KAVLOCK, R.J., COWDERY, T., ORBAND, L.,
BARTOLOME, M., GRAY, J.A., REHNBERG, B.F., & BARTOLOME, J.
(1986) Functional consequences of prenatal methylmercury exposure:
effects on renal and hepatic repsonses to trophic stimuli and on renal
excretory mechanisms. Toxicol. Lett., 34: 231-245.
SLOTKIN, T.A., PACHMAN, S., KAVLOCK, R.J., & BARTOLOME, J.
(1985) Effects of neonatal methylmercury exposure on development of
nucleic acids and proteins in rat brain: regional specificity. Brain
Res. Bull., 14: 397-400.
SMITH, J.H., MCCORMACK, K.M., BRASELTON, W.E., Jr, & HOOK, J.B.
(1983) The effect of prenatal methylmercury administration on postnatal
renal functional development. Environ. Res., 30: 63-71.
SMITH, R.G., VORWALD, A.J., PATIL, L.S., & MOONEY, T.F. (1970)
Effects of exposure to mercury in the manufacture of chlorine. Am. Ind.
Hyg. Assoc. J., 31: 687-700.
SPUHLER, K. & PRASAD, K.N. (1980) Inhibition by methylmercuric chloride
of prostaglandin E1-sensitive adenylate cyclase activity in glioma but
not in neuroblastoma cells in culture. Biochem. Pharmacol., 29: 201-
203.
SPYKER, J.M., SPARBER, S.B., & GOLDBERG, A.M. (1972) Subtle
consequences of methylmercury exposure: behavioural deviations in
offspring of treated mothers. Science, 177: 621-623.
STEIN, A., GREGUS, Z., & KLAASSEN, C. (1988) Species variations in
biliary excretion of glutathione-related thiols and methylmercury.
Toxicol. appl. Pharmacol., 93: 351-359.
STOKES, P.M. & WREN, C.D. (1987) Bioaccumulation of mercury by aquatic
biota in hydroelectric reservoirs: a review and consideration of
mechanisms. In: Hutchinson, T.W. & Meema, K.M., ed. Lead, mercury,
cadmium and arsenic in the environment, New York, Chichester, Brisbane,
Toronto, John Wiley & Sons, pp. 255-277.
SUDA, I. & TAKAHASHI, H. (1986) Enhanced and inhibited bio-transfor-
mation of methylmercury in the rat spleen. Toxicol. appl. Pharmacol.,
82: 45-52.
SUGIURA, Y., TAMI, Y., & TANAKA, H. (1978) Selenium protection against
mercury toxicity: high binding affinity of methylmercury by selenium-
containing ligands in comparison with sulfur-containing ligands.
Bioinorg. Chem. 9(2): 167-180.
SUZUKI, T., SHISHIDO, S., & URUSHIYAMA, K. (1976) Mercury in
cigarettes. Tohoku J. exp. Med., 119: 353-356.
SUZUKI, T., HONGO, T., & YAMAMOTO, R.A (1984a) Hair mercury levels
of Japanese women during the period 1881-1968. J. appl. Toxicol. 4:101-
104.
SUZUKI, T, YONEMOTO, J., SATOH, H., NAGANUMA, A., IMURA, N., &
KIGAWA, T. (1984b) Normal organic and inorganic mercury levels in the
human feto-placental system. J. appl. Toxicol., 4: 249-252.
SUZUKI, T., WATANABE, S., HONGO, T., KAWABE, T., INAOKA, T.,
OHTSUKA, R., & AKIMICHI, T. (1988) Mercury in scalp hair of Papuans in
the Fly Estuary, Papua New Guinea. Asia-Pacific J. public Health, 2:
39-47.
SWEDISH ENVIRONMENTAL PROTECTION BOARD (1986) Mercury:
Occurrence and turnover of mercury in the environment, Stockholm,
National Environmental Protection Board (Mercury Report No. 3).
SWEDISH EXPERT GROUP (1971) Methylmercury in fish. A toxicological-
epidemiological evaluation of risks. Nord. Hyg. Tidskr., 4(Suppl.):
19-364.
SYVERSEN, T.L.M. (1982) Changes in protein and RNA synthesis in rat
brain neurons after a single dose of methylmercury. Toxicol. Lett., 10:
31-34.
SZPRENGIER-JUSZKIEWICZ, T. (1988) [Evaluation of daily intake of
mercury with food stuffs in Poland.] Bromatol. Chem. Toksykol., 21:
228-232 (in Polish).
SZUCKI, B. & KURYS, H. (1982) [Mercury levels in the blood and hairs in
the general population.] Rocz. PZH, 33(3): 143-148 (in Polish).
TAKEUCHI, T. (1977) Pathology of fetal Minamata disease. The effect of
methylmercury on intrauterine life of human being. Pediatrician, 6:
69-87.
TAKEUCHI, T. & ETO, K. (1975) Minamata disease. Chronic occurrence from
pathological viewpoints. In: Studies on the health effects of
alkylmercury in Japan, Tokyo, Japan Environment Agency, pp. 28-62.
TAMASHIRO, H., AKAGI, H., ARAKAKI, M., FUTATSUKA, M., &
ROHT, L.H. (1984) Causes of death in Minamata disease: analysis of
death certificates. Int. Arch. occup. environ. Health, 54: 135-146.
TAMASHIRO, H., ARAKAKI, M., FUTATSUKA, M., & LEE, S. (1986)
Methylmercury exposure and mortality in southern Japan: a close look at
causes of death. J. Epidemiol. community Health, 40: 181-185.
TAMASHIRO, H., FUKUTOMI, K., & LEE, E. (1987) Methylmercury
exposure and mortality in Japan: A life table analysis. Arch. environ.
Health, 42: 100-107.
TAYARANI, I., LEFAUCONNIER, J., & BOURRE, J. (1988) The effect of
mercurials on amino acid transport and rubidium uptake by isolated rat
brain microvessels. Neurotoxicology, 8(4): 543-552.
Taylor A, Marks V (1973) Measurement of urinary mercury excretion by atomic absorption
in health and disease. Br J Ind Med 30: 293-296.
THOMAS, D.J. & SMITH, J.C. (1979) Partial characterization of a low-
molecular weight methylmercury complex in rat cerebrum. Toxicol. appl.
Pharmacol., 47: 547-556.
THOMAS, D.J. & SMITH, J.C. (1982) Effects of co-administered low-
molecular-weight thiol compounds on short-term distribution of methyl-
mercury in the rat. Toxicol. appl. Pharmacol., 62: 104-110.
THOMAS, D.J. & SMITH, J.C. (1984) Effects of co-administered sodium
selenite on short-term distribution of methylmercury in the rat.
Environ. Res., 34: 287-294.
THOMAS, D.J., FISHER, H.L., SUMLER, M.R., MARCUS, A.H., MUSHAK,
P., & HALL, L.L. (1986) Sexual differences in the distribution and
retention of organic and inorganic mercury in methylmercury-treated
rats. Environ. Res., 41: 219-234.
THROWER, S.J. & ANDREWARTHA, K.A. (1981) Glutathione peroxidase
response in tissues of rats fed diets containing fish protein
concentrate prepared from shark flesh of known mercury and selenium
content. Bull. environ. Contam. Toxicol., 26: 77-84.
TOLLEFSON, L. & CORDLE, F. (1986) Methylmercury in fish: a review of
residue levels, fish consumption and regulatory action in the United
States. Environ. Health Perspect., 68: 203-208.
TSUBAKI, T. & IRUKAYAMA, K., ed. (1977) Minamata disease, Amsterdam,
Oxford, New York, Elsevier Science Publishers.
TSUBAKI, T. & TAKAHASHI, H. (1986) Recent advances in Minamata disease
studies, Tokyo, Kodansha.
TSUBAKI, T., HIROTA, K., SHIRAKAWA, K., KONDO, K., & SATO, T.
(1978) Clinical, epidemiological and toxicological studies on
methylmercury poisoning. In: Plaa, G.L. & Duncan, W.A.M., ed.
Proceedings of the First International Congress on Toxicology, New
York, London, San Francisco, Academic Press, pp. 339-357.
TURNER, C.J., BHATNAGER, M.K., & YAMASHIRO, S. (1981) Ethanol
potentiation of methyl mercury toxicity: a preliminary report. J.
Toxicol. environ. Health, 7: 665-668.
TURNER, M.A. & RUDD, J.W.M. (1983) The English-Wabigoon river system.
III. Selenium in lake enclosures: its geochemistry, bioaccumulation and
ability to reduce mercury bioaccumulation. Can. J. Fish. aquat. Sci.,
40: 2228-2250.
TURNER, M.D., KILPPER, R.W., SMITH, J.C., MARSH, D.O., &
CLARKSON, T.W. (1975) Studies on volunteers consuming methylmercury in
tuna fish. Clin. Res., 23: 2.
TURNER, M.D., MARSH, D.O., SMITH, J.C., CLARKSON, T.W., INGLIS,
J.B., RUBINO, E.C., CHIRIBOGA, J., & CHIRIBOGA, C.C. (1980)
Methylmercury in populations eating large quantities of marine fish.
Arch. environ. Health, 35: 367-378.
URANO, T., NAGANUMA, A., & IMURA, N. (1988) Methylmercury-
cysteinylglycine constitutes the main form of methylmercury in rat
bile. Res. Commun. chem. Pathol. Pharmacol., 60: 197-210.
US DEPARTMENT OF COMMERCE (1978) Report on the chance of US
seafood consumers exceeding the current acceptable daily intake for
mercury and on recommended regulatory controls, Washington, DC, US
Department of Commerce, National Oceanic and Atmospheric
Administration, National Marine Fisheries Service, pp. 1-198.
US EPA (1980) Ambient water quality criteria for mercury, Washington,
DC, US Environmental Protection Agency, Criteria and Standards Division
(EPA-600/479-049).
US EPA (1984) Mercury health effects update: health issue assessment,
Washington, DC, US Environmental Protection Agency (EPA-600/8-84-
019F).
VALCIUKAS, J.A., LEVIN, S.M., NICHOLSON, W.J., & SELIKOFF, I.J.
(1986) Neurobehavioural assessment of Mohawk Indians for sub-clinical
indications of methyl mercury neurotoxicity. Arch. environ. Health, 41:
269-272.
VERSCHAEVE, L. & LEONARD, A. (1984) Dominant lethal test in female
mice treated with methylmercury chloride. Mutat. Res., 136: 131-136.
VERSCHAEVE, L., KIRSCH-VOLDERS, M., & SUSANNE, C. (1983)
Mercury chloride- and methyl mercury chloride-induced inhibition of NOR
activity. Teratog. Carcinog. Mutagen., 3: 447-456.
VOGEL, D.G., MARGOLIS, R.L., & MOTTET, N.K. (1985) The effects of
methylmercury binding to microtubules. Toxicol. appl. Pharmacol., 80:
473-486.
VOGEL, D.G., RABINOVITCH, P.S., & MOTTET, N.K. (1986)
Methyl-mercury effects on cell cycle kinetics. Cell Tissue Kinet., 19:
227-242.
VON BURG, R. & LANDRY, T. (1976) Methylmercury and the skeletal muscle
receptor. J. Pharm. Pharmacol., 28: 548-551.
VON BURG, R., FARRIS, F., & SMITH, J.C. (1974) Determinations of
methylmercury in blood by gas chromatography. J. Chromatogr., 97: 65-
70.
WALSH, C.T. (1982) The influence of age on the gastrointestinal
absorption of mercuric chloride and methylmercury chloride in the rat.
Environ. Res., 27: 412-420.
WASSICK, K.H. & YONOVITZ, A. (1985) Methylmercury ototoxicity in mice
determined by auditory brain stem responses. Acta otolarynol.
(Stockholm), 99: 35-45.
WATANABE, H., SHIMOJO, N., SANO, K., & YAMAGUCHI, S. (1988) The
distribution of total mercury in the brian after the lateral
ventricular single injection of methylmercury and glutathione. Res.
Commun. chem. Pathol. Pharmacol. 60(1): 57-69.
WATANABE, T., SHIMADA, T., & ENDO, A. (1982) Effects of mercury
compounds on ovulation and meiotic and mitotic chromosomes in female
golden hamsters. Teratology, 25: 381-384.
WELSH, S.O. (1979) The protective effect of vitamin E and N,N'-
diphenyl-p-phenylenediamine (DPPD) against methyl mercury toxicity in
the rat. J. Nutr., 109: 1673-1681.
WESTOO, G. (1968) Determination of methylmercury salts in various kinds
of biological material. Acta chem. Scand. 22: 2277-2280.
WGMF (1980) Report on mercury in fish and fish products. Canberra
Working Group on Mercury in Fish, Department of Primary Industry, p.
371.
WHEATLEY, B. (1979) Methylmercury in Canada: exposure of Indian and
Inuit residents to methylmercury in the Canadian environment, Ottawa,
Department of National Health and Welfare, Medical Services Branch, p.
200.
WHEATLEY, B., BARBEAU, A., CLARKSON, T.W., & LAPHAM, L. (1979)
Methylmercury poisoning in Canadian Indians - the elusive diagnosis.
Can. J. neurol. Sci., 6(4): 417-422.
WHO (1976a) Conference on intoxication due to alkylmercury-treated
seed, Baghdad, Iraq, 9-13 September 1974, Bull. World Health Organ.,
53(Suppl.): 105-112.
WHO (1976b) Environmental Health Criteria 1: Mercury, Geneva, World
Health Organization, 132 pp.
WHO (1978) WHO Technical Report Series, No. 631 (Evaluation of certain
food additives and contaminants. Twenty-second report of the Joint
FAO/WHO Expert Committee on Food Additives).
WHO (1980) Consultation to re-examine the WHO Environmental Health
Criteria for mercury, Geneva, 21-25 April 1980, Geneva, World Health
Organization (Unpublished report EHE/EHC/80.22).
WHO (1989a) Environmental Health Criteria 86: Mercury - Environmental
aspects, Geneva, World Health Organization, 150 pp.
WHO (1989b) Evaluation of certain food additives and contaminants.
Thirty-third report of the Joint FAO/WHO Expert Committee on Food
Additives, Geneva, World Health Organization (WHO Technical Report
Series 776).
WIENER, J.G. (1987) Metal contamination of fish in low-pH lakes and
potential implications for piscivorous wildlife. Trans. North Am.
Wildl. Natl. Resour. Conf., 52: 645-657.
WIGFIELD, D.C., CROTEAU, S.M., & PERKINS, S.L. (1981) Elimination of
the matrix effect in the cold-vapor atomic absorption analysis of
mercury in human hair samples. J. anal. Toxicol., 5: 52-55.
WOOD, J.M. & WANG, H.K. (1983) Microbial resistance to heavy metals.
Environ. Sci. Technol., 17: 82a-90a.
WULF, H.C., KROMANN, N., KOUSGAARD, N., HANSEN, J.C.,
NIEBUHR, E., & ALBOGE, K. (1986) Sister chromatid exchange (SCE) in
Greenlandic Eskimos. Dose-respone relationship between SCE and seal
diet, smoking and blood cadmium and mercury concentrations. Sci. total
Environ., 48: 81-94.
XUN, L. & CAMPBELL, N.E.R. (1987) Measurements of specific rates of net
methyl mercury production in the water column and surface sediments of
acidified and circumneutral lakes. Can. J. Fish. aquat. Sci., 44: 750-
757.
YAMAGUCHI, S., FUJIKI, M., SHIMOJO, N., KAKU, S., HIROTA, Y.,
MORI, Y., PHAS, B., & SANO, K. (1977) A background of geographical
pathology on mercury in the east Pacific area. J. occup. Med., 19: 502-
504.
YAMAMOTO, R., SUZUKI, T., SATOH, H., & KAWAI, K. (1986) Generation
and dose as modifying factors of inorganic mercury accumulation in
brain, liver and kidneys of rats fed methylmercury. Environ. Res., 41:
309-318.
YAMINI, B. & SLEIGHT, S.D. (1984) Effects of ascorbic acid deficiency
on methylmercury dicyandiamide toxicosis in guinea pigs. J. environ.
Pathol. Toxicol. Oncol., 5: 139-150.
YOSHINO, Y., MOZAI, T., & NAKAO, K. (1966) Biochemical changes in the
brain in rats poisoned with an alkyl mercury compound, with special
reference to the inhibition of protein synthesis in brain cortex
slices. J. Neurochem., 13: 1223-1230.
ZELENKO, V. & KOSTA, L. (1973) A new method for the isolation of
methylmercury from biological tissue and its determination at the
parts-per-million level by gas chromatography. Talanta, 20: 115-123.
ZIMMER, L., JOHNSON, P.C., & CARTER, D.E. (1980) A comparison of
biochemical, pathological or behavioral methods for the assessment of
the effectiveness of treatment for methylmercury poisoning in rats.
Neurobehav. Toxicol., 2: 323-330.
APPENDIX
Comparison between maximum hair levels of mercury during pregnancy and
symptoms and signs in the mother and her offspringa
-----------------------------------------------------------------------------------------------
Mother Child
------------------------- ----------------------------------------------------------
Symptoms Symptoms
----------------------- -------------------------------
Mother- Paraes- Other Mercury Sex Walked Talked Mental Seizures Neurological
infant thesia level (month) (month) score
number (mg/kg)
-----------------------------------------------------------------------------------------------
2 0 0 1 female 12 24 0 0 2
3 0 0 1 male - - 0 0 2
5 0 0 1 male 14 12 0 0 0
6 0 0 1 male 18 18 0 0 0
7 0 0 1 male 18 24 0 0 3
9 0 0 1 male 13 26 + 0 3
13 0 1 1 female 12 12 0 0 4
14 0 0 1 female 18 26 0 0 2
18 0 0 1 female 16 18 0 0 0
19 0 0 1 male 12 12 0 0 0
26 0 0 1 male 12 14 0 0 0
31 0 0 1 male 11 12 0 0 1
33 0 0 1 female 12 20 0 0 2
39 0 0 1 female - - 0 0 4
41 0 0 1 male 11 18 0 0 3
69 0 0 1 male 18 20 0 0 4
4 0 0 2 male 18 - 0 0 0
8 0 0 2 female 13 18 0 0 0
10 0 0 2 male 16 18 0 0 3
11 0 0 2 male 12 24 0 0 3
12 0 0 2 male 18 18 0 0 3
16 0 0 2 female 18 18 0 0 2
27 0 0 2 male 12 10 0 0 0
32 0 0 2 male 14 - 0 0 0
47 0 0 2 male 18 24 0 0 3
1 0 0 3 female 14 18 0 0 0
21 0 0 3 male 18 - 0 0 1
23 0 0 5 male 12 12 0 0 1
34 0 0 6 male 12 10 0 0 0
38 0 0 6 female 18 10 0 0 2
35 0 0 7 male 12 18 0 0 0
29 0 0 8 male 18 19 0 0 0
40 0 0 9 female 12 - 0 0 0
20 0 0 10 male 12 12 0 0 2
24 0 + 10 male 14 - 0 0 3
22 0 0 12 male 18 14 0 0 1
28 0 0 12 female 14 18 0 0 2
17 + + 14 female 20b 18 0 0 1
-----------------------------------------------------------------------------------------------
Appendix (contd).
-----------------------------------------------------------------------------------------------
Mother Child
------------------------ --------------------------------------------------
Symptoms Symptoms
------------------------ -------------------------------
Mother- Paraes- Other Mercury Sex Walked Talked Mental Seizures Neurological
infant thesia level (month) (month) score
number (mg/kg)
-----------------------------------------------------------------------------------------------
36 0 0 16 male 18 16 0 0 5
42 0 0 18 female 36b 30b 0 0 0
25 0 0 19 male 12 18 0 0 2
30 + + 23 female 12 12 0 0 1
37 0 0 26 male 12 12 0 0 1
15 0 0 38 male 20b 18 0 0 6
49 0 0 45 male - - 0 0 4
59 0 0 46 male 12 12 0 0 2
53 0 0 52 female 18 18 0 0 1
48 + + 59 female 18 26b 0 0 0
43 0 0 60 male 20b 18 0 0 5
44 0 0 62 male 18 24 0 0 0
54 + + 74 male 18 26b 0 0 2
46 + 0 75 female 12 12 0 0 0
52 + 0 78 female 14 28b + + 4
50 0 0 86 male 11 26b 0 0 6
58 0 + 98 female 12 12 0 0 2
57 0 0 104 female 15 18 0 0 4
72 0 0 114 male 14 48b + 0 0
64 0 0 118 female 18 18 0 0 0
51 + + 154 male 24b 36b 0 + 3
76 0 0 196 male 12 15 0 0 0
77 0 0 202 male 24b 20 0 0 3
61 0 + 242 female 15 18 + 0 0
74 0 0 263 female 18 18 0 0 5
66 0 0 269 male 12 12 0 0 1
63 + 0 294 male 20b 34b + + 0
62 + + 336 male 24b 36b 0 + 0
67 + 0 339 female 20b 26b 0 0 4
60 + 0 357 female 20b 30b 0 0 2
65 + 0 362 male 14 16 0 0 4
71 + + 376 female 20b 30b 0 + 2
75 0 0 399 male 15 24 0 0 3
56 + + 404 male 60b 60b + + 11
70 + 0 405 female 60b 36b + 0 11
68 0 0 418 male 72b 72b + + 11
45 0 0 443 male 36b 30b + 0 11
73 0 0 468 female 14 20 0 0 6
-----------------------------------------------------------------------------------------------
Appendix (contd).
-----------------------------------------------------------------------------------------------
Mother Child
----------------------- ----------------------------------------------
Symptoms Symptoms
----------------------- -------------------------------
Mother- Paraes- Other Mercury Sex Walked Talked Mental Seizures Neurological
infant thesia level (month) (month) score
number (mg/kg)
-----------------------------------------------------------------------------------------------
80 0 + 557 female 22b 22b 0 0 2
79 0 0 568 female 20b 26b 0 0 4
78 0 0 598 male 24b 23 0 0 7
81 + + 674 male 24b 26b 0 0 2
-----------------------------------------------------------------------------------------------
a From: Marsh et al. (1987)
o = absence of abnormality.
+ = presence of abnormality.
- = no observations were made.
b Abnormal value.
For further details, see section 9.4.2.1.
The two parametric models are consistent with each
other and with the non-parametric confidence limits. With
all three models, a statistically significant dose-
response relationship exists.
The hockey-stick model gives the best estimates of the
practical threshold at 10 µg mercury/g but with a very
high confidence limit (287 µg mercury/g) (Table 10).
Lower assumed values of the background frequency (2%
and 4%) give roughly the same practical threshold value,
but with lower upper confidence limits (24 and 32 µg
mercury/g, respectively). The lower upper limit values are
due to the fact that a definite assumed value for the
background frequency was used, whereas 9% is the best-fit
estimate of background and consequently the overall uncer-
tainty is greater.
The logit model estimates a similar background fre-
quency (9.3%). The excess risk over background is about
5% (Fig. 4).
Thus, the data in the Appendix can be used to demon-
strate a statistically significant dose-response relation-
ship for signs and symptoms of prenatal poisoning. Esti-
mates of a "threshold" or highest no-effect concen-
tration were made with the hockey-stick model. These esti-
mates are subject to considerable uncertainty due to the
small number of infant-mother pairs. As in the adult dose-
response relationships (see Fig. 3 and section 9.4.1.2),
the background frequency can greatly influence estimates
of risk at low (close to background) response rates, yet
cannot be estimated accurately due to the small number of
data points at the lowest hair mercury levels.
9.4.2.2 Canada
McKeown-Eyssen et al. (1983) examined the relationship
between prenatal exposure to methylmercury and neurologi-
cal and developmental abnormalities among 234 Cree Indian
children aged 12-30 months from four communities in north-
ern Quebec, Canada. The authors described their study as
follows:
"A medical team visited each community and examined
95% of the eligible children and their mothers,
`blinded' to their methylmercury exposure. One of the
four pediatric neurologists documented each child's
height, weight, and head circumference, assessed
dysmorphic and congenital features, and reported the
presence or absence of acquired disease. A neurologi-
cal examination was also conducted and included an
assessment of special senses, cranial nerves, sensory
function, muscle tone, stretch reflexes, coordination,
and persistence of the Babinski response which was
judged to be abnormal for the child's age, as well as
a summary of the presence or absence of neurological
abnormality. Finally, the neurologist assessed the
child's development by use of the Denver developmental
scale; for each child, the results were expressed as
the percentage of total test items that were passed,
separately for gross and fine motor development,
language development, and personal/social skills.
"Each mother was interviewed about her alcohol and
tobacco consumption both during the relevant pregnancy
and at the time of the interview. Because of the un-
certainty about the accuracy of the reporting, women
were classified simply as users of alcohol or ab-
stainers, and as smokers or nonsmokers according to
whether they reported ever drinking or smoking. Caf-
feine intake was calculated from answers to questions
on tea and coffee consumption.
"Information on pregnancy, labour, and delivery were
sought from the medical certificate of childbirth, a
standard form that reports the major characteristics
of pregnancy and delivery for all births in Quebec.
Because some deliveries occurred in the bush, these
certificates could be obtained for only 85% of the
births.
"Methylmercury concentrations of the hair were
measured in alternate one centimeter segments, begin-
ning with the scalp-end segment. The maximum concen-
tration in the segment of hair corresponding to the
period from one month before conception to one month
after delivery was used as an index of prenatal
exposure.
"A search was conducted to establish which measures
(if any) of neurologic function and development were
associated with methylmercury exposure. This was
achieved by use of a regression analysis of the
relationship between the methylmercury exposure index
and the results of four tests of neurologic function
(coordination, cranial nerves, muscle tone or re-
flexes, and an overall neurologic assessment) and
measures of four aspects of the Denver developmental
scale (gross and fine motor development, language
development, and personal/social skills). Once the
measure of neurologic function most closely associated
with exposure was identified, the odds ratio was esti-
mated from a discriminant analysis in which children
were classified as cases or controls depending on the
presence or absence of abnormality of the relevant
neurologic function. The analysis distinguished
between the cases and controls first on the basis of
confounding variables potentially associated with the
neurologic abnormality (child's age, duration of
breast-feeding, mother's age, and mother's smoking
habit and consumption of beverages containing alcohol
and caffeine), and then on the basis of the prenatal
indices of methylmercury exposure".
The ages of the mothers covered a wide range: 13% were
below 20 years of age and 15% were at least 35 years old.
About two-thirds said they consumed alcohol and slightly
more were smokers. The percentages of high risk preg-
nancies, complications at delivery, and duration of breast
feeding were similar for boys and girls. The birth weight
of the children tended to be above normal (34% weighed
over 4 kg).
The mean index of mercury exposure (maximum maternal
hair concentration during pregnancy) was the same
(6 µg/g), for both boys and girls, and only 6% of values
were above 20 µg/g. None of the children showed abnor-
mal physical development, but "abnormality" of muscle
tone or reflexes was positively associated with the pre-
natal index of methylmercury exposure (P <0.05, 2-tailed).
The highest maternal hair level in this study group of 97
males was 23.9 µg/g (Table 10). No other measure of
neurological function or development was significantly
associated with methylmercury exposure either before or
after adjustment for confounding variables. In girls, no
adverse effects were associated with mercury exposure. In
fact, a negative association was found between one neuro-
logical abnormality (incoordination) and prenatal mercury
exposure. McKeown-Eyssen et al. (1983) expressed some
reasons to doubt the "importance" of the finding of
methylmercury effects in boys. They noted that the "ab-
normality of muscle tone or reflexes . . . was . . . of
doubtful clinical importance", that previously reported
prenatal effects were at higher exposures, that a consist-
ent dose-response relationship was not seen in the boys
(Table 11), and that the effect was only seen in boys and
not in girls. Consequently, in their interpretation of the
data, the authors did not exclude the possibility that the
positive findings were chance observations.
Table 11. Prevalence of abnormality of
muscle tone or reflexes according to
maternal mercury levels during pregnancya
--------------------------------------
Prenatal Number % abnormal
exposureb of boys
index (mg/kg)
--------------------------------------
0 - 1.9 19 15.8
2 - 2.9 18 5.6
3 - 4.9 19 26.3
5 - 6.9 14 0
7 - 12.9 14 7.1
13 - 23.9 13 38.5
Total 97 15.5
--------------------------------------
a Adapted from: McKeown-Eyssen et al. (1983).
b Maximum maternal hair concentration during pregnancy.
9.4.2.3 New Zealand
Kjellstrom et al. (1986) reported preliminary tests
carried out on prenatally exposed children in a fish-
eating group in New Zealand. The study started with a
cohort of 11 000 recent mothers and their offspring.
Approximately 1000 of these mothers reported that they had
consumed fish more than three times per week during preg-
nancy. Analysis of samples of maternal head hair revealed
that 73 of the mothers had levels above 6 mg/kg. People of
Pacific Island descent accounted for 62%, Maoris for 27%,
and Europeans 11% of this group of 73.
Only 31 offspring from this group of 73 mothers could
be contacted by the time they were 4 years old. They were
matched according to ethnic group, maternal age, birth-
place, and birth date with offspring having low prenatal
exposure to methylmercury (maternal hair mercury below
6 mg/kg). The Denver Development Test, carried out on a
double-blind basis, was used to assess the effects of
methylmercury. Abnormal or questionable results were found
in 17% of the controls, compared with 50% in the children
exposed to high mercury levels (maternal hair mercury
levels above 6 mg/kg). The difference was statistically
significant.
A statistically significant dose-response relationship
was found between mean maternal hair mercury levels during
pregnancy and the frequency of deficient Denver Test
results. No influence of socio-economic factors (based on
place of residence), maternal health status, or smoking
habits was seen. However, other confounding factors
inherent in these studies make it difficult to draw final
conclusions.
In 1985, it was possible to locate 61 of the original
73 high-exposure children and to conduct detailed psycho-
logical and scholastic tests (carried out on a double-
blind basis) at the age of 6-7 years (Kjellstrom et al.,
1989). At this stage, the children had completed at least
one year at school. These tests included, among others,
the revised Wechsler Intelligence Scale for Children
(WISC-R) and the Test of Language Development (TOLD).
The high-exposure children (maternal hair mercury
levels within the range of 6-86 mg/kg, with the second
highest value being 19.6 mg/kg) were compared with three
matched groups: one group with maternal hair mercury
levels of 3-6 mg/kg and two groups with levels below
3 mg/kg (one group with high fish consumption and one with
low fish consumption). The mothers were matched for
child's sex and maternal ethnic group, age, smoking
habits, residence area, and residence time in New
Zealand.
The results of the different tests were correlated,
and showed that individual children with low scores in the
TOLD or WISC-R tests also had low scores in the other
tests. For those children who had been tested both at age
4 (Kjellstrom et al., 1986) and at age 6-7 (Kjellstrom et
al., 1989), there was also a correlation between the
Denver Test and the IQ scores (WISC-R scale). The sub-
groups were small, but the data indicated that a child who
had poor Denver Test results was highly likely to score
very poorly in the IQ test at school age. According to the
authors' summary, although "methylmercury exposure con-
tributes only a small part of the variation in tests
results" and "results of the psychological test vari-
ables are influenced by the child's ethnic background",
the study suggests that "an average hair mercury level
during pregnancy of 13-15 mg/kg (equivalent to about
25 mg/kg peak mercury level) may be associated with a
decreased test performance" (Kjellstrom et al., 1989).
It should be noted that the studies in Canada and Iraq
used maximum maternal hair concentrations during pregnancy
based on 1-cm segments (roughly one month's hair growth).
Kjellstrom et al. (1986, 1989) state that their mean
maternal hair values should be multiplied by a factor of
1.5 to obtain the maximum 1-cm value during pregnancy.
9.4.2.4 Summary
Severe derangement of the developing central nervous system
can be caused by prenatal exposure to methylmercury. The lowest
level (maximum maternal hair mercury concentration during preg-
nancy) at which severe effects were observed was 404 µg/g in
the Iraqi outbreak. The highest no-observed-effect-level (NOEL)
for severe effect was 399 µg/g. Fish-eating populations in
Canada and New Zealand have also been studied for prenatal
effects, but exposure levels were far below the highest NOEL
for severe effects in Iraq and no severe effects were seen.
Evidence of psychomotor retardation (delayed achievement of
developmental milestones, a history of seizures, abnormal
reflexes) were seen in the Iraqi population at maternal hair
levels well below those associated with severe effects. A
statistical analysis revealed that one of these effects (motor
retardation) rose above the background frequency at maternal
hair mercury levels (maximum level during pregnancy) of
10-20 µg/g. This range of values in maternal hair is consist-
ent with all available evidence and can be accepted as the
range of critical concentrations. The Canadian study found
that maternal hair levels were positively associated with
abnormal muscle tone or reflexes in boys, but not in girls
(the highest maximum maternal hair level during pregnancy was
23.9 µg/g).
The New Zealand study found evidence of developmental
retardation (according to the Denver Test) in 4-year-old
children at average maternal hair mercury levels during
pregnancy within the range of 6-86 µg/g (the second highest
value was 20 µg/g). The New Zealand mercury values should be
multiplied by 1.5 to convert to maximum maternal hair levels in
pregnancy.
10. EVALUATION OF HUMAN HEALTH RISKS
10.1 Exposure Levels and Routes
In view of the restrictions placed upon the use of
methylmercury in most countries, occupational exposure
will be low.
The major source of human exposure to methylmercury is
through the diet, more specifically from the consumption
of fish and fish products. In most countries, the import-
ant food fishes have methylmercury levels in their edible
portion not exceeding 200-300 µg/kg. However, levels in
such predatory species as ocean tuna, shark, and swordfish
(even from non-polluted areas), as well as freshwater
pike, walleye, and bass, may contain methylmercury levels
in excess of 1000 µg/kg. In view of the worldwide vari-
ation in dietary patterns and extent of pollution, it is
difficult to calculate a general exposure level for
methylmercury. However, assuming an average daily con-
sumption of 20 g of non-predatory species containing
200 µg/kg, the daily methylmercury intake would be 4 µg.
It has been estimated that long-term intake at this level
would raise the blood methylmercury levels by 4 µg/litre,
and hair levels by 1 µg/g. However, in some countries the
average consumption can be as high as 100 g/day and may
consist mainly of predatory species. In these cases,
methylmercury intakes can exceed 100 µg/day.
10.2 Toxic Effects
10.2.1 Adults
Concerning the risks in adults exposed to methylmer-
cury, the conclusions reached in Environmental Health
Criteria 1: Mercury (WHO, 1976) and the 1980 interim
evaluation remain unchanged. A daily methylmercury con-
sumption of 0.48 µg/kg body weight (WHO, 1989b) will not
result in any detectable adverse effects. However, a daily
intake of 3-7 µg/kg body weight would cause adverse
effects on the nervous system, manifested as an approxi-
mately 5% increase in the incidence of paraesthesia. Hair
concentrations would be approximately 50-125 µg/g at this
level of intake. Clinical observations in Iraq suggested
that women are more sensitive to the toxic effects of
methylmercury during pregnancy.
10.2.2 Prenatal exposure
The report (WHO, 1980) that evaluated the health
hazards from exposure to methylmercury through the con-
sumption of fish underlined that damage to the fetal brain
caused by prenatal exposure to methylmercury could be the
critical effect, and that more information was needed for
a proper risk assessment. Since 1980, experimental evi-
dence to elucidate the mechanisms involved in the neuro-
toxic action of methylmercury on the fetal brain has ac-
cumulated and has been reviewed in this monograph. Further
analysis of data from the Iraqi outbreak has extracted
additional information relating to the effects of prenatal
methylmercury exposure. From these sets of evidence, a
pattern has emerged that permits the construction of a
biological model for the neurotoxic action of methylmer-
cury on the fetal brain.
Methylmercury inhibits the growth of the fetal brain
and the migration of neurons from the embryological gener-
ation layer to the final destination in the brain cortex.
This has been demonstrated in clinical cases in Japan and
Iraq. An inhibition of brain growth is indicated by a
decrease in brain size and weight, as was observed in
studies on monkeys and humans. The inhibition of fetal
brain development caused by methylmercury exposure results
in the behavioural changes and reduced cognitive and motor
ability found in clinical cases. It has been demonstrated
that methylmercury interferes with microtubule formation,
cell division, and neuronal protein synthesis, all of
which could explain the effects described above.
The model emerging to explain the neurological effects
of methylmercury is a continuous dose-effect relationship,
with a range from subtle changes in brain function (indi-
cated by psychological tests) at low dose levels to a
severe neurological syndrome of cerebral palsy with pro-
nounced changes in the organization of brain structure at
high exposure levels. However, the possibility of
detecting and characterizing the methylmercury level at
which the subtle and early adverse effects on the fetal
brain may arise is limited by the availability of sensi-
tive test procedures. At present, some effects can only
be detected and adequately characterized in the epidemi-
ological studies of fairly large populations.
The crucial question is the actual exposure level (or
body burden) of methylmercury in humans which can lead to
subtle changes in the offspring. The actual exposure
levels and patterns are usually unknown, but the effect
can be related to the hair mercury level and an approxi-
mate daily exposure calculated from the known kinetic
parameters for methylmercury accumulation, distribution,
and excretion.
The statistical analysis of data on 84 infant-mother
pairs (maternal peak hair mercury levels during pregnancy
of 0.4-640 µg/g) showed that, at maternal hair concen-
trations above 70 µg/g, children exhibited evidence of
abnormal neurological signs, e.g., increased muscle tone
in the leg and exaggerated deep tendon reflexes, often
accompanied by ataxia together with a history of develop-
mental delay. This statistical analysis indicated a 30%
risk of these abnormal findings at maternal hair mercury
concentrations around 70 µg/g. The data from the Iraqi
outbreak do not permit firm conclusions to be drawn con-
cerning the risk of adverse effects below that level.
However, by applying the biological model described above,
the extrapolation method of Cox et al. (1989), and the
evaluation of other currently available data, it can be
calculated that a maternal hair mercury concentration of
10-20 µg/g implies a 5% risk. The possibility cannot be
excluded that effects detectable by psychological and
behavioural testing or subclinical effects might occur at
even lower levels of exposure, but evidence is lacking.
10.3 Conclusions
The general population does not face a significant
health risk from methylmercury. Certain groups with a high
fish consumption may attain a blood methylmercury level
(about 200 µg/litre, corresponding to 50 µg/g of hair)
associated with a low (5%) risk of neurological damage to
adults.
The fetus is at particular risk. Recent evidence shows
that at peak maternal hair mercury levels above 70 µg/g
there is a high risk (more than 30%) of neurological
disorder in the offspring. A prudent interpretation of
the Iraqi data implies that a 5% risk may be associated
with a peak mercury level of 10-20 µg/g in the maternal
hair.
There is a need for epidemiological studies on chil-
dren exposed in utero to levels of methylmercury that re-
sult in peak maternal hair mercury levels below 20 µg/g,
in order to screen for those effects only detectable by
available psychological and behavioural tests.
11. RECOMMENDATIONS
11.1 Gaps in Knowledge
In spite of significant advances in our understanding
of the toxicity and potential hazard of methylmercury,
there remain areas in which there is an urgent need for
additional studies.
The most important of these areas is the lower end of
the dose-response relationship for prenatal exposures.
This will require well coordinated and designed, inter-
national epidemiological studies that consider all rel-
evant confounding factors (e.g., drugs, alcohol, smoking).
As part of these studies, there is a need to develop
objective measurements of clinical manifestations. The
potential ability of selenium and other dietary components
(e.g., antioxidants) to alter the toxic responses elicited
by methylmercury should be investigated. These studies
will not only need to describe this interaction, but also
to provide data that can be used quantitatively in a risk
assessment of methylmercury, particularly for the fetus.
The mechanisms of damage to both the mature and developing
nervous system remain to be elucidated. As no information
on the relative vulnerability of the brain during differ-
ent periods of pregnancy is available, more experimental
work is needed to shed light on this aspect, which is
important for risk assessment and clinical judgement. The
selective damage to the nervous system and to specific
areas in the brain, the long period in the case of adult
poisoning, and the high vulnerability of the developing
nervous system (including sex differences in suscepti-
bility) are still unexplained.
11.2 Preventive Measures
In populations that consume large amounts of fish
(e.g., 100 g/day), the hair levels of methylmercury in
women of child-bearing age should be monitored. If the
results of these monitoring activities indicate excessive
exposure to methylmercury, appropriate and practical
measures, such as dietary recommendations, should be taken
to reduce the possibility of long-term exposure during
pregnancy and to keep it below internationally recommended
allowable intakes.
Measures to reduce methylmercury exposure via the con-
sumption of fish will need to consider the impact of these
measures on the overall dietary requirements of these
individuals.
12. PREVIOUS EVALUATIONS BY INTERNATIONAL BODIES
The human health risks from exposure to methylmercury
were previously evaluated in Environmental Health Criteria
1: Mercury (WHO, 1976b). This was followed by a brief up-
date (WHO, 1980), based upon a technical report prepared
by the Monitoring and Assessment Research Centre (MARC,
1981).
In the thirty-third report of the Joint FAO/WHO
Expert Committee on Food Additives (JECFA), it was rec-
ommended that the permissible tolerable weekly intake
(PTWI) for methylmercury in adults be maintained at
200 µg (3.3 µg/kg body weight) (WHO, 1978; WHO, 1989b).
However, the Committee noted that pregnant women and
nursing mothers are likely to be at greater risk, although
the available data were insufficient to recommend a
specific mercury intake for these population groups.
Regulatory standards established by some national
bodies in different countries and the EEC are summarized
in the data profile of the International Register of
Potentially Toxic Chemicals (IRPTC, 1987).
REFERENCES
ABE, T., HAGA, T., & KUROKAWA, M. (1975) Blockage of axoplasmic
transport and depolymerization of reassembled microtubules by
methylmercury. Brain Res., 86: 504-508.
AIREY, D. (1983) Total mercury concentrations in human hair from 13
countries in relation to fish consumption and location. Sci. total
Environ., 31: 157-180.
AL-MUFTI, A.W., COPPLESTONE, J.F., KAZANTZIS, G., MAHMOUD,
R.M., & MAJID, M.A. (1976) Epidemiology of organomercury poisoning in
Iraq: I. Incidence in a defined area and relationship to the eating of
contaminated bread. Bull. World Health Organ., 53(Suppl.): 23-36.
AL-SHAHRISTANI, H. & SHIHAB, K. (1974) Variation of biological half-
life of methylmercury in man. Arch. environ. Health, 28: 342-344.
AMIN-ZAKI, L., ELHASSANI, S., MAJEED, M.A., CLARKSON, T.W.,
DOHERTY, R.A. & GREENWOOD, M. (1974) Intra-uterine methylmercury
poisoning in Iraq. Pediatrics, 54(5): 587-595.
AMIN-ZAKI, L., ELHASSANI, S., MAJEED, M.A., CLARKSON, T.W.,
DOHERTY, R.A., GREENWOOD, M., & GIOVANOLI-JAKUBCZAK, T.
(1976) Perinatal methylmercury poisoning in Iraq. Am. J. dis. Child.,
130: 1070-1076.
ANDO, S., TOYODA, Y., NAGAI, Y., & IKUTA, F. (1985) Abnormalities in
gangliosides and other lipids of monkey, rabbit and human brains with
chronic organic mercury intoxication. Jpn. J. exp. Med., 55(1): 1-6.
ARAKI, K., WAKABAYASHI, M., SAKIMURA, K., KUSHIYA, E.,
OZAWA, H., KUMAMOTO, T., & TAKAHASHI, Y. (1981) Decreased uptake
of GABA by dorsal ganglia in methylmercury treated rats. Neurotoxicity,
2: 557-566.
ARITO, H., NOBORU, H., & SHITZU, T. (1983) Effect of methylmercury
chloride on sleep-waking rhythms in rats. Toxicology, 28: 335-345.
ASCHNER, M. (1986) Changes in axonally transported proteins in the rat
visual system following systemic methylmercury exposure. Acta
Pharmacol. toxicol., 59(2): 151-157.
ASCHNER, M. & CLARKSON, T.W. (1987) Mercury 203 distribution in
pregnant and non-pregnant rats following systemic infusions with thiol-
containing amino acid. Teratology, 36: 321-328.
ASCHNER, M., RODIER, P.M., & FINKELSTEIN, J.N. (1986) Reduction of
axonal transport in the rat optic system after direct application of
methylmercury. Brain Res., 381(2): 244-250.
ATCHISON, W.D. (1986) Extracellular calcium-dependent and independent
effects of methylmercury on spontaneous and potassium-evoked release of
acetylcholine at the neuromuscular junction. J. Pharmacol. exp. Ther.,
237(2): 672-680.
ATCHISON, W.D. & NARAHASHI, T. (1982) Methylmercury-induced
depression of neuromuscular transmission in the rat. Neurotoxicology,
3: 37-50.
BACCI, E., ANGOTZI, G., BRALIA, A., LAMPARIELLO, L., &
ZANETTE, E. (1976) Etude sur une population humaine exposée au
méthylmercure par la consommation de poisson. Rev. int. Océanogr. méd.,
41/42: 127-141.
BAKIR, F., DAMLUJI, S.F., AMIN-ZAKI, L., MURTADHA, M.,
KHALIDI, A., AL-RAWI, N.Y., TIKRITI, S., DHAHIR, H.I., CLARKSON,
T.W., SMITH, J.C., & DOHERTY, R.A. (1973) Methylmercury poisoning in
Iraq. Science, 181: 230-241.
BALLATORI, N. & CLARKSON, T. (1985) Biliary secretion of glutathione
and of glutathione-metal complexes. Fundam. appl. Toxicol., 5: 816-
831.
BARTOLOME, J., TREPANIER, P., CHAIT, E.A., SEIDLER, F.J.,
DESKIN, R., & SLOTKIN, T.A. (1982) Neonatal methylmercury poisoning in
the rat: effects on development of central catecholamine
neurotransmitter systems. Toxicol. appl. Pharmacol., 65: 92-99.
BEGLEY, T.P., WALTS, A.E., & WALSH, C.T. (1986) Bacterial
organomercurial lyase: overproduction, isolation, and characterization.
Biochemistry, 25: 7186-7192.
BEIJER, J. & JERNELOV, A. (1979) Methylation of mercury in aquatic
environments. In: Nriagu, J.O., ed. The biogeochemistry of mercury in
the environment, Amsterdam, Oxford, New York, Elsevier Science
Publishers, pp. 203-210.
BERLIN, M. (1976) Dose-response relations and diagnostic indices of
mercury concentrations in critical organs upon exposure to mercury and
mercurials. In: Nordberg, G.F., ed. Effects and dose-response
relationships of toxic metals, Amsterdam, Oxford, New York, Elsevier
Science Publishers, pp. 235-245.
BERLIN, M. (1986) Mercury. In: Friberg, L., Nordberg, G.F., & Voulk,
V., ed. Handbook on the toxicology of metals, 2nd ed., Amsterdam,
Oxford, New York, Elsevier Science Publishers, pp. 387-445.
BERLIN, M., BLOMSTRAND, C., GRANT, C.A., HAMBERGER, A., &
TROFAST, J. (1975) Tritiated methylmercury in the brain of squirrel
monkeys. Arch. environ. Health, 30: 591-597.
BERNAUDIN, J.F., DRUET, E., DRUET, P., & MASSE, R. (1981)
Inhalation or ingestion of organic or inorganic mercurials produces
auto-immune disease in rats. Clin. Immunol. Immunopathol., 20: 129-
135.
BERNHARD, M. & ANDREAE, M.O. (1984) Transport of trace metals in
marine food chains. In: Nriagu, J.O., ed. Changing metal cycles and
human health, Berlin, Heidelberg, New York, Springer-Verlag, pp. 143-
168.
BERNHARD, M., BUFFONI, R., & RENZONI, A. (1982) Mercury in
Mediterranean tuna. Why is their level higher than in Atlantic tuna?
Thalassia (Yugosl.), 18: 231-243.
BIENVENUE, E., BOUDOU, A., DASMAZES, J.P., GAVACH, C.,
GEORGESCAULD, D., SANDEAUX, J., SANDEAUX, R., & SETA, P. (1984)
Transport of mercury compounds across biomolecular lipid membranes:
effect of lipid composition, pH and chloride concentration. Chem.-biol.
Interact., 48: 91-101.
BJORNBERG, A.A., HAKANSON, L., & LUNDBERGH, K., (1988) A theory
on the mechanisms regulating the bioavailability of mercury in natural
water. Environ. Pollut., 49: 53-61.
BLAKLEY, B.R. (1984) Enhancement of urethan-induced adenoma formation
in Swiss mice exposed to methylmercury. Can. J. comp. Med., 48(3): 299-
302.
BORNHAUSEN, M., MUSCH, H.R., & GREIM, H. (1980) Operant behaviour
performance changes in rats after prenatal methyl-mercury exposure.
Toxicol. appl. Pharmacol., 56: 305-310.
BROWN, D., RUEHL, K., BORMANN, S., LITTLE, J. (1988). Effects of
methylmercury on the microtubule system of mouse lymphocytes. Toxicol.
appl. Pharmacol., 94: 66-75.
BRZEZNICKA, E.A. & CHMIELNICKA, J. (1985a) Interaction of
alkylmercury compounds with sodium selenite. III. Biotransformation,
levels of metallothioneinlike proteins and endogenous copper in some
tissues of rats exposed to methyl or ethylmercuric chloride with and
without sodium selenite. Environ. Health Perspect., 60: 423-431.
BRZEZNICKA, E.A. & CHMIELNICKA, J. (1985b) Interaction of
alkylmercuric compounds with sodium selenite. II. Metabolism of
methylmercuric chloride administered alone and in combination with
sodium selenite in rats. Environ. Health Perspect., 60: 411-421.
BUCHET, J.P., ROLES, H., HUBERMONT, G., & LAUWERYS, R. (1978)
Placental transfer of lead, mercury, cadmium, and carbon monoxide in
women. Environ. Res., 15: 494-503.
BUCHET, J.P., LAUWERYS, R., VANDEVOORDE, A., & PYCKE, J.M.
(1983) Oral daily intake of cadmium, lead, manganese, chromium,
mercury, calcium, zinc, and arsenic in Blegium. A duplicate meal
study. Food chem. Toxicol., 21: 19-24.
BURBACHER, T.M., MONNETT, C., GRANT, K.S., & MOTTET, N.K.
(1984) Methylmercury exposure and reproductive dysfunction in the
nonhuman primate. Toxicol. appl. Pharmacol., 75(1): 18-24.
BURTON, G.V. & MEIKLE, A.W. (1980) Acute and chronic methylmercury
poisoning impairs rat adrenal and testicular function. J. Toxicol.
environ. Health, 6: 597-606.
BYRNE, A.R. & KOSTA, L. (1974) Simultaneous neutron activation
determination of selenium and mercury in biological samples by
volatilization. Talanta, 21: 1083-1090.
CANADA-ONTARIO STEERING COMMITTEE (1983) Mercury pollution
in the Wabigon-English river system of Northwestern Ontario, and
possible remedial measures. Summary of a technical report, Toronto,
Canada-Ontario Steering Committee, Provincial Ministry of the
Environment.
CAPELLI, R., MINGANTI, V., SEMINO, G., & BERTARINI, W. (1986) The
presence of mercury (total and organic) and selenium in human
placentae. Sci. total Environ., 48(1/2): 69-79.
CAPPON, C.J. (1981) Mercury and selenium content and chemical form in
vegetable crops grown on sludge-amended soil. Arch. environ. Contam.
Toxicol., 10: 673-689.
CAPPON, C.J. (1987) Uptake and speciation of mercury and selenium in
vegetable crops grown on compost-treated soil. Water Air Soil Pollut.,
3: 353-361.
CAPPON, C.J. & SMITH, J.C. (1978) A simple and rapid procedure for the
gas chromatographic determination of methylmercury in biological
samples. Bull. environ. Contam. Toxicol., 19: 600-607.
CARMICHAEL, N., CAVANAGH, J.B., & RODDA, R.A. (1975) Some
effects of methylmercury salts on the rabbit nervous system. Acta
neuropathol., 32: 112-125.
CHANG, L.W. (1977) Neurotoxic effects of mercury - a review. Environ.
Res., 14: 329-373.
CHANG, L.W. & SUBER, R. (1982) Protective effect of selenium on
methylmercury toxicity: a possible mechanism. Bull. environ. Contam.
Toxicol., 29: 285-289.
CHANG, L.W., GILBERT, M., & SPRECHLER, J. (1978) Modification of
methylmercury neurotoxicity by vitamin E. Environ. Res., 17: 356-366.
CHEN, W.J., BODY, R.L., & MOTTET, N.K. (1979) Some effects of
continuous low-dose congenital exposure to methylmercury on organ
growth in the rat fetus. Teratology, 20: 31-36.
CHEN, W.J., BODY, R.L., & MOTTET, N.K. (1983) Biochemical and
morphological studies of monkeys chronically exposed to methylmercury.
J. Toxicol. environ. Health, 12: 407-416.
CHERIAN, M.G., HURSH, J.B., CLARKSON, T.W., & ALLEN, J. (1978)
Radioactive mercury distribution in biological fluids and excretion in
human subjects after inhalation of mercury vapor. Arch. environ.
Health, 33: 109-114.
CHEUNG, M.K. & VERITY, M.A. (1985) Experimental methylmercury
neurotoxicity: locus of mercurial inhibition of brain protein synthesis
in vivo and in vitro. J. Neurochem., 44(6): 1799-1808.
CHMIELNICKA, J., BRZEZNICKA, B., BARANSKI, B., & SITAREK, K.
(1985) The effect of methylmercury on prenatal development and trace
metal distribution in pregnant and fetal rats. Biol. Trace Elem. Res.,
8: 191-201.
CHOI, B.H. & LAPHAM, L.W. (1976) Interactions of neurons and astrocytes
during growth and development of human fetal brain in vitro. Exp. Mol.
Pathol., 24: 110-125.
CHOI, B.H. & LAPHAM, L.W. (1980) Effects of meso-2-3,
dimercaptosuccinic acid on methylmercury injured human fetal astrocytes
in vitro: a lapse cinematographic phase and electron microscopic study.
Fed. Proc., 39: 396.
CHOI, B.H. & KIM, R.C. (1984) The comparative effects of methylmercuric
chloride and mercuric chloride upon DNA synthesis in mouse fetal
astrocytes in vitro. Exp. Mol. Pathol., 41(3): 371-376.
CHOI, B.H., LAPHAM, L.W., AMIN-ZAKI, L., & SALEEM, T. (1978)
Abnormal neuronal migration, deranged cerebral cortical organization
and diffuse white matter astrocytosis of human fetal brain. A major
effect of methylmercury poisoning in utero. J. Neuropathol. exp.
Neurol., 37: 719-733.
CHOI, B.H., CHO, K.H. & LAPHAM, L.W. (1979) Effects of methylmercury on
human fetal brain cells in culture: a time lapse cinematographic phase
and electron microscopic study. J. Neuropathol. exp. Neurol., 33: 307.
CHOI, B.H., CHO, K.H., & LAPHAM, L.W. (1980) Effects of methylmercury
on DNA synthesis of human fetal astrocytes: a radioautographic study.
Brain Res., 202: 238-242.
CHOI, B.H., KUDO, M., & LAPHAM, L.W. (1981) A golgi and electron-
microscopic study of cerebellum in methylmercury poisoned neonatal
mice. Acta neuropathol., 54: 233-237.
CHOI, B.H., KIM, R.C., & PECKHAM, N.H. (1988) Hydrocephalus following
prenatal methylmercury poisoning. Acta neuropathol. 75: 325-330.
CLARKSON, T.W. (1983) Methylmercury toxicity in the mature and
developing nervous system: possible mechanism. In: Sarker, B. ed.
Biological aspects of metals and metal related diseases, New York,
Raven Press, pp. 183-192.
CLARKSON, T.W., FRIBERG, L., HURSH, J.B., & NYLANDER, M.
(1988) The prediction of intake of mercury vapor from amalgams. In:
Clarkson, T.W., Friberg, L., Nordberg, G.F., & Sager, P.R., ed.
Biological monitoring of toxic metals, New York, London, Plenum Press,
pp. 247-264.
CONCAS, A., CORDA, M.G., SALIS, M., MULAS, M.L., MILIA, A.,
CORONGIU, F.P., & BIGGIO, G. (1983) Biochemical changes in the rat
cerebellar cortex elicited by chronic treatment with methylmercury.
Toxicol. Lett., 18: 27-33.
COX, C., CLARKSON, T.W., MARSH, D.O., AMIN-ZAKI, L., TIKRITI,
S., & MYERS, G.G. (1989). Dose-response analysis of infants prenatally
exposed to methylmercury. An application of a single compartment model
to single-strand hair analysis. Environ. Res., 49: 318-332.
COYLE, P. & HARTLEY, T. (1981) Automated determination of mercury in
urine and blood by the Magos reagent and cold vapor atomic absorption
spectrometry. Anal. Chem., 53: 354-356.
CUOMO, V., AMBROSI, L., ANNAU, Z., CAGIANO, R., BRUNELLO, N., &
RACAGNI, G. (1984) Behavioural and neurochemical changes in offspring
of rats exposed to methylmercury during gestation. Neurobehav. Toxicol.
Teratol., 6(3): 249-254.
CURLE, D.C., RAY, M., & PERSAUD, T.V.N. (1983) Methymercury toxicity:
in vivo evaluation of teratogenesis and cytogenic changes. Anat. Anz.
(Jena), 153: 69-82.
DAVIES, T.W. & NIELSEN, S.W. (1977) Pathology of subacute
methylmercurialism in cats. Am. J. Vet. Med., 38: 59-67.
DAVIES, T.W., NIELSEN, S.W., & KIRCHNER, C.H. (1976) The pathology of
subacute methylmercurialism in swine. Cornell Vet., 66: 32-55.
DAVIES, T.W., NIELSEN, S.W., & JORTNER, B.S. (1977) Pathology of
chronic and subacute canine methylmercurialism. J. Am. Anim. Hosp.
Assoc., 13: 369-381.
DE SAINT-GEORGES, I., VERSHAEVE, L., & LEONARD, A. (1984) The
inhibitory effect of methylmercury chloride and mercuric chloride on
microtubule polymerization in vitro. C.R. Séances Soc. Biol. (Paris),
178: 562-566.
DEN TONKELAAR, E.M., VAN ESCH, G.J., HOFMAN, B., SCHULLER,
P.L., & ZWIERS, J.H.L. (1974) Mercury and other elements in blood of
the Dutch population. In: Proceedings of an International Symposium on
Recent Advances in the Assessment of the Health Effects of Environmen-
tal Pollution, Paris, 24-28 June, Luxembourg, Commission of the
European Communities, Vol. 2, pp. 1017-1027.
DOHERTY, R.A., GATES, A.H., & LANDRY, T. (1977) Methylmercury
excretion: developmental changes in mouse and man. Pediatr. Res., 11:
416.
DOI, R. & KOBAYASHI, T. (1982) Organ distribution and biological half-
time of methylmercury in four strains of mice. Jpn. J. exp. Med., 52:
307-314.
DOI, R. & TAGAWA, M. (1983) A study on the biochemical behavior of
methylmercury. Toxicol. appl. Pharmacol., 69: 407-416.
ECCLES, C.U. & ANNAU, Z. (1982a) Prenatal methylmercury exposure:
alterations in neonatal activity. Neurobehav. Toxicol., 4: 371-376.
ECCLES, C.U. & ANNAU, Z. (1982b) Prenatal methylmercury exposure. II.
Alterations in learning and psychotropic drug sensitivity in adult
offspring. Neurobehav. Toxicol. Teratol., 4: 377-382.
ELSNER, J., HODEL, B., SUTER, K.E., OEKLKE, D., ULBRICH, B.,
SCHREINER, G., CUOMO, V., CAGIONO, R.A., ROSENGREN, L.E.,
KARLSSON, J.E., & HAGLID, K.G. (1988) Detection limits of different
approaches in behavioral teratology, and correlation of effects with
neurochemical parameters. Neurotoxicol. Teratol., 10: 155-167.
EVANS, H.L., GARMAN, R.H., & WEISS, B. (1977) Methylmercury: exposure
duration and regional distribution as determinants of neurotoxicity in
non-human primates. Toxicol. appl. Pharmacol., 41: 15-33.
FAIR, P.H., BALTHROP, J.E., WADE, J.L., & BRADDON-GALLOWAY, S.
(1987). In vivo incorporation of 14C leucine into brain protein of
mice treated with methylmercury and thiol complexes of methylmercury.
Toxicol. Lett., 36: 213-220.
FALK, S.A., KLEIN, R., HASEMAN, J.K., SANDERS, G.M., & TALLEY,
F.A. (1974) Acute methylmercury intoxication and ototoxicity in guinea
pigs. Arch. Pathol., 97: 297-305.
FANG, S.C. (1980) Comparative study of uptake and tissue distribution
of methylmercury in female rats by inhalation and oral routes of
administration. Bull. environ. Contam. Toxicol., 24: 65-72.
FARANT, J.P., BRISSETTE, D., MONCION, L., BIGRAS, L., &
CHARTRAND, A. (1981) Improved cold-vapor atomic absorption technique
for the microdetermination of total and inorganic mercury in biological
samples. J. anal. Toxicol., 5: 47-51.
FORHAMMER, M., ALBANUS, L., BRUCE, A., MATTSON, P., &
OHLIN, B. (1984) Fish consumption and mercury in hair in pregnant
women. Var Föda, 36: 2-13.
FOUASSIN, A. & FONDU, M. (1978) Evaluation de la teneur moyenne en
mercure de la ration alimentaire en Belgique. Arch. Belg. Med. Soc.
Hyg. Med Trav. Med Leg., 36: 481-490.
FRIBERG, L. (1983) Quality control in laboratories testing for
environmental pollution. In: Clarkson, T.W., Nordberg, G.F., & Sager,
P.R., ed. Reproductive and developmental toxicity of metals, New York,
London, Plenum Press, pp. 811-829.
FRIBERG, L. (1988) Quality assurance. In: Clarkson, T.W., Friberg, L.,
Nordberg, G.F., & Sager, P.R., eds. Biological monitoring of toxic
metals, New York, London, Plenum Press, pp. 103-126.
FRIBERG, L., KULLMAN, L., LIND, B., & NYLANDER, M. (1986)
Mercury in the central nervous system in relation to amalgam fillings.
Lakartidningen, 83: 519-522.
FUJIKI, M. & TAJUMA, S. (1975) Studies on the methylmercury formation
in the environment. In: Studies on the health effects of alkylmercury
in Japan, Tokyo, Environment Agency, pp. 11-19.
FURUTANI, A. & RUDD, J.W. (1980) Measurement of mercury methylation in
lake water and sediment samples. Appl. environ. Microbiol., 40: 770-
776.
GALSTER, W.A. (1976) Mercury in Alaskan Eskimo mothers and infants.
Environ. Health Perspect., 15: 135-140.
GANSER, A.L. & KIRSCHNER, D.A. (1985) The interaction of mercurials
with myelin: comparison of in vitro and in vivo effects.
Neurotoxicology, 6(1): 63-77.
GANTHER, H.E. (1978) Modification of methylmercury toxicity and
metabolism by selenium and vitamin E: possible mechanisms. Environ.
Health Perspect., 25: 71-76.
GANTHER, H.E. (1979) Metabolism of hydrogen selenide and methylated
selenide. Adv. Nutr. Rev., 2: 107-128.
GANTHER, H.E., GOUDIE, C., SUNDE, M.L., KOPECKY, M.J.,
WAGNER, P., OH, S.H., & HOEKSTRA, W.G. (1972) Selenium: relation to
decreased toxicity of methylmercury added to diets containing tuna.
Science, 175: 1122-1124.
GARTRELL, M.J., CRAUN, J.C., PODREBARAC, D.S., & GUNDERSON,
E.L. (1985a) Pesticides, selected elements and other chemicals in
adult total diet samples: October 1978-September 1979. J. Chem. Assoc.
Off. Anal. Chem., 68: 862-875.
GARTRELL, M.J., CRAUN, J.C., PODREBARAC, D.S., & GUNDERSON,
E.L. (1985b) Pesticides, selected elements and other chemicals in
adult total diet samples: October 1979-September 1980. J. Chem. Assoc.
Off. Anal. Chem., 68: 1184-1197.
GARTRELL, M.J., CRAUN, J.C., PODREBARAC, D.S., & GUNDERSON,
E.L. (1986) Pesticides, selected elements and other chemicals in adult
total diet samples: October 1980-March 1982. J. Chem. Assoc. Off. Anal.
Chem., 68: 146-161.
GATES, A.H., DOHERTY, R.A., & COX, C. (1986) Reproduction and growth
following prenatal methylmercuric chloride exposure in mice. Fundam.
appl. Toxicol., 7: 486-493.
GESAMP (1986) Review of potentially harmful substances: arsenic,
mercury and selenium, Geneva. IMO/FAO/UNESCO/WMO/WHO/IAEA/
UN/UNEP Joint Group of Experts on the Scientific Aspects of Marine
Pollution, World Health Organization (Reports and Studies No. 28).
GILBERT, M.M., SPRECHER, J., CHANG, L.W., & MEISNER, L.F. (1983)
Protective effect of vitamin E on genotoxicity of methylmercury. J.
Toxicol. environ. Health, 12: 767-773.
GIOVANOLI-JAKUBCZAK, T. & BERG, G. (1974) Measurement of
mercury in human hair. Arch. Environ. Health, 28: 139-144.
GONZALEZ, M.J., RICO, M.C., HERNANDEZ, L.M., & BALUJA, G. (1985)
Mercury in human hair: a study of residents in Madrid, Spain. Arch.
environ. Health, 40: 225-228.
GOWDY, J.M., YATES, R., & DEMERS, F.X. (1977) Blood mercury
concentration in an urban population. Sci. total Environ., 8: 247-251.
GREENWOOD, M.R. (1985) Methylmercury poisoning in Iraq. An
epidemiological study of the 1971-72 outbreak. J. appl. Toxicol.,
5(3): 148-159.
GREENWOOD, M.R., CLARKSON, T.W., DOHERTY, R.A., GATES, A.H.,
AMIN-ZAKI, L., ELHASSANI, S., & MAJEED, M.A. (1978) Blood clearance
half-times in lactating and nonlactating members of a population
exposed to methylmercury. Environ. Res., 16: 48-54.
GREGUS, Z. & VARGA, F. (1985) Role of glutathione and hepatic
glutathione S-transferase in the biliary excretion of methylmercury,
cadmium, and zinc: a study with enzyme inducers and glutathione
depletors. Acta pharmacol. toxicol., 56: 398-403.
GRUENWEDEL, D.W. & DIAHAM, B. (1982) Methylmercury(II)-induced
histone perturbations in nuclei isolated from calf thymus. Mol.
Pharmacol., 22: 121-126.
GRUNDT, I.K. & NESKOVIC, N.M. (1985) UDP-Galactose: ceramide
galactosyltransferase and 2',3'-cyclic-nucleotide-3'-phosphodiesterase
activities in rat brain after long-term exposure to methylmercury or
triethyl-lead. Exp. Neurol., 88(3): 580-589.
GRUNDT, I.K. & BAKKEN, A.M. (1986) Adenine nucleotides in cultured
brain cells after exposure to methylmercury and triethyl lead. Acta
pharmacol. toxicol., 59: 11-16.
GRUNDT, I.K., AMMITZBOLL, T., & CLAUSEN, J. (1981) Triethyl-lead
treatments of cultured brain cells. Effect on accumulation of
radioactive precursors in callactolipids. Neurochem. Res., 6: 193-201.
GRUNDT, I.K., ROUX, F., TREICH, I., LORIETTE, C., RAULIN, J., &
FOURNIER, E. (1982) Effects of methylmercury and triethyllead on
Na+K+ATPase and Pyruvate dehydrogenase activities in glioma C6
cells. Acta pharmacol. toxicol., 51: 6-11.
GUNDERSON, V.M., GRANT, K.S., BURBACHER, T.M., FAGAN, J.F.,
& MOTTET, N.K. (1986) The effect of low-level prenatal methylmercury
exposure on visual recognition memory of infant carb-eating macaques.
Child Dev., 57: 1076-1083.
HANSEN, J.C., KROMANN, N., WULF, H.C., & ALBOGE, K. (1984)
Selenium and its interrelation with mercury in whole blood and hair in
an east Greenlandic population. Sci. total Environ., 38: 33-40.
HARADA, M., FUJINO, T., AKAGI, T., & NISHIGAKI, S. (1976)
Epidemiological and clinical study and historical background of mercury
pollution on Indian reservations in northwestern Ontario. Canada Bull.
Inst. Const. Med., 26: 169-184.
HARADA, M., FUJINO, T., & KABASHIMA, K. (1977) A study of
methylmercury concentration in the umbilical cords of the inhabitants
born in the Minamata area. Brain Dev., 9: 79-84 (In Japanese).
HARADA, Y. (1968) Congenital (or fetal) Minamata Bay disease. In:
Minamata disease, Kumamoto, Study Group of Minamata Disease, Kumamoto
University.
HARADA, Y. & MORIYAMA, H. (1977) [Study on the motor ability of school
children in the Minamata district.] Environ. Health Rep., 40: 97-99 (in
Japanese).
HARGREAVES, R.J., MOORHOUSE, S.R., GANGOLI, S.D., &
PELLING, D. (1986) The effects of methylmercury on glucose transport,
glucose metabolism and blood flow in the central nervous system of the
rat. In: Suckling, A.J., Rumsbury, M.G., & Bradbury, M.W.B., ed. The
blood-brain barrier in health and disease, Chichester, Ellis Horwood,
pp. 165-176.
HARPER, K., BURNS, R., & ERICKSON, R.P. (1981) Genetic aspects of the
effects of methylmercury in mice: the incidence of cleft palate and
concentrations of adenosine 3':5' cyclic monophosphate in tongue and
palatal shelf. Teratology, 23: 397-401.
HATCH, R.W. & OTT, W.L. (1969) Determination of sub-microgram
quantities of mercury by atomic absorption spectrophotometry. Anal.
Chem., 40: 2085-2087.
HAXTON, J., LINDSAY, D.G., HISLOP, J.S., SALMON, L., DIXON, E.J.,
EVANS, W.H., REID, J.R., HEWITT, C.J., & JEFFRIES, D.F. (1979)
Duplicate diet study on fishing communities in the United Kingdom:
mercury exposure in a "critical group". Environ. Res., 18: 351-368.
HERIGSTAD, R.R., WHITEHAIR, C.K., BEYER, N., MICKELSEN, O.,
& ZABIK, M.J. (1972) Chronic methylmercury toxicosis in calves. J. Am.
Vet. Med. Assoc., 160: 173-182.
HIRANO, M., MITSUMORI, K., MAITA, K., & SHIRASU, Y. (1986) Further
carcinogenicity study on methylmercury chloride in ICR mice. Nippon
Juigaku Zasshi, 48: 127-135.
HIRAYAMA, K. (1980) Effect of amino acids on brain uptake of
methylmercury. Toxicol. appl. Pharmacol., 55: 318-323.
HIRAYAMA, K. (1985) Effects of combined administration of thiol
compounds and methylmercury chloride on mercury distribution in rats.
Biochem. Pharmacol., 34: 3030-3032.
HIRAYAMA, K. & YASUTAKE, A. (1986) Sex and age differences in
mercury distribution and excretion in methylmercury-administered mice.
J. Toxicol. environ. Health, 18: 49-60.
HIROTA, Y., YAMAGUCHI, S., SHIMOJOH, N., & SANO, K. (1980)
Inhibitory effect of methylmercury on the activity of glutathione
peroxidase. Toxicol. appl. Pharmacol., 53: 174-176.
HISLOP, J.S., COLLIER, T.R., WHITE, G.F., KHATHING, D.T., &
FRENCH, E. (1983) The use of keratinised tissues to monitor the
detailed exposure of man to methyl mercury from fish. In: Brown, S.S. &
Savory, J., ed. Chemical toxicology and clinical chemistry of metals,
New York, Academic Press, pp. 145-148.
HORVAT, K., MAY, M., STOEPPLER, A., & BYRNE, R. (1988) Comparative
studies of methylmercury determination in biological and environmental
samples. Appl. organomet. Chem., 2: 515-524.
HORVAT, M., STEGNAR, A., BYRNE, R., DERMELJ, M., &
BRANICA, A. (1988) A study of trace elements in human placenta, blood
and hair from the Yugoslav central Adriatic. In: Braetter, P. &
Schramel, P., ed. Trace elements-analytical chemistry in medicine and
biology, Berlin, W. de Gruyter & Co., pp. 243-250.
HOSKINS, B.B. & HUPP, E.W. (1978) Methylmercury effects in rat,
hamster, and squirrel monkey. Environ. Res., 15: 5-19.
HOWARD, J.D. & MOTTET, N.K. (1986) Effects of methylmercury on the
morphogenesis of the rat cerebellum. Teratology, 34: 89-95.
HSIEH, H.S. & GANTHER, H.E. (1975) Acid-volatile selenium formation
catalyzed by glutathione reductase. Biochemistry 14(8): 1632-1636.
HULTBERG, H. & HASSELROT, B. (1981) Mercury in the ecosystem. In:
Project coal, health and environment, Vallingby, Swedish State Power
Board, pp. 33-51.
HUNTER, D. & RUSSELL, D.S. (1954) Focal cerebral and cerebellar atrophy
in a human subject due to organic mercury compounds. J. Neurol.
Neurosurg. Psychiatr., 17: 235-241.
IMURA, N., MIURA, K., INOKAWA, M., & NAKADA, S. (1980)
Mechanism of methylmercury cytotoxicity: by biochemical and
morphological experiments using cultured cells. Toxicology, 17: 241-
254.
INOUYE, M., KAJIWARA, Y., & HIRAYAMA, K. (1986) Dose and
sex-dependent alterations in mercury distribution in fetal mice
following methylmercury exposure. J. Toxicol. environ. Health, 19: 425-
435.
INSKIP, M.J. & PIOTROWSKI, J.K. (1985) Review of the health effects of
methylmercury. J. appl. Toxicol., 5: 113-133.
IRPTC (1987) IRPTC Legal file 1986, Geneva, International Register of
Potentially Toxic Chemicals, United Nations Environment Programme, Vol.
II.
IWATA, H., OKAMOTO, H., & OHSAWA, Y. (1973) Effect of selenium on
methylmercury poisoning. Res. Commun. chem. Pathol. Pharmacol., 5:
673.
JACOBS, A.J., MANISCALCO, W.M., & FINKELSTEIN, J.N. (1986)
Effects of methylmercuric chloride, cyclohexamide and colchicine on the
reaggregation of dissociated mouse cerebellar cells. Toxicol. appl.
Pharmacol., 86: 362-371.
JACOBS, J.M., CARMICHAEL, N., & CAVANAGH, J.B. (1977)
Ultrastructural changes in the nervous system of rabbits poisoned with
methylmercury. Toxicol. appl. Pharmacol., 39: 249-261.
JAKLEVIC, J.M., FRENCH, W.R., CLARKSON, T.W., & GREENWOOD,
M.R. (1978) X-ray fluorescence analysis applied to small samples. In:
Barrett, C.S., Leyden, D.E., Newkirk, J.B., & Rudd, C.O., ed. Advances
in X-ray analysis, New York, London, Plenum Press, Vol. 21, pp. 171-
185.
JERNELOV, A. (1972) Mercury and food chains. In: Hartung, R. & Binman,
B.D., ed. Environmental mercury contamination, Ann Arbor, Michigan, Ann
Arbor Science Publishers, pp. 174-177.
JOHANNESSON, T., LUND, G., & STEINNES, E. (1981) Mercury, arsenic,
cadmium, selenium and zinc in human hair and salmon fries in Iceland.
Acta pharmacol. toxicol., 48: 185-189.
JOHNSON, D.C. & BRAMAN, R.S. (1974) Distribution of atmospheric mercury
species near ground. Environ. Sci. Technol., 8: 1003-1009.
JUNGHANS, R.P. (1983) A review of the toxicity of methylmercury
compounds with application to occupational exposures associated with
laboratory uses. Environ. Res. 31: 1-31.
KASUYA, M. (1980) The effect of methylcobalamin on the toxicity of
methylmercury and mercuric chloride on nervous tissue in culture.
Toxicol. Lett., 7: 87-93.
KATO, I., AOYAGI, M., SATO, Y., MIZUKOSHI, K., & KAWASAKI, T.
(1981) Electrooculographic evaluation of methylmercury intoxication
in monkeys. Exp. Neurol., 72: 51-62.
KAWADA, J., NISHIDA, M., YOSHIMURA, Y., & MITANI, K. (1980)
Effects of organic and inorganic mercurials on thyroidal functions. J.
Pharm. Dyn., 3: 149-159.
KAWASAKI, Y., IKEDA, Y., YAMAMOTO, T., & IKEDA, K. (1986)
Long-term toxicity study of methylmercury chloride in monkeys. J. Food
Hyg. Soc. Jpn, 27(5): 528-552.
KAZANTZIS, G., AL-MUFTI, A.W., AL-JAWAD, A., AL-SHAHWANI,
Y., MAJID, M.A., MAHMOUD, R.M., SOUFI, M., TAWFIQ, K.,
IBRAHIM, M.A., & DABAGH, H. (1976a) Epidemiology of organomercury
poisoning in Iraq: II. Relationship of mercury levels in blood and
hair to exposure and to clinical findings. Bull. World Health Organ.,
53(Suppl.): 37-48.
KAZANTZIS, G., AL-MUFTI, A.W., COPPLESTONE, J.F., MAJID, M.A., &
MAHMOUD, R.M. (1976b) Epidemiology of organomercury poisoning in Iraq:
III. Clinical features and their changes with time. Bull. World Health
Organ., 53(Suppl.): 49-60.
KELMAN, B.J., WALTER, B.K., & SASSER, L.B. (1982) Fetal distribution of
mercury following introduction of methylmercury into porcine maternal
circulation. J. Toxicol. environ. Health, 10: 191-200.
KELMAN, B.J., STEINMETZ ,S.E., WALTER, B.K., & SASSER, L.B. (1980)
Absorption of methylmercury by the fetal guinea pig during mid to late
gestation. Teratology, 21: 161-165.
KERSHAW, T.G., CLARKSON, T.W., & DHAHIR, P.H. (1980) The
relationship between blood levels and dose of methylmercury in man.
Arch. environ. Health, 35(1): 28-36.
KHM (1981) Summary situation report. In: Project coal, health and
environment, Valingby, Swedish State Power Board.
KJELLSTROM, T., REEVES, R., & MITCHELL, J. (1982) Comparison
of mercury in hair with fish-eating habits of children in Auckland.
Commun. Health Stud. (Adelaide), 6: 57-63.
KJELLSTROM, T., KENNEDY, P., WALLIS, & MANTELL, C. (1986)
Physical and mental development of children with prenatal exposure to
mercury from fish. Stage 1. Preliminary tests at age 4, Solna, National
Swedish Environmental Board, 96 pp (Report No. 3080).
KJELLSTROM, T., KENNEDY, P., WALLIS, S., STEWART, A.,
FRIBERG, L., LIND, B., WUTHERSPOON, P., & MANTELL, C. (1989)
Physical and mental development of children with prenatal exposure
to mercury from fish. Stage 2. Interviews and psychological tests at
age 6, Solna, National Swedish Environmental Board, 112 pp (Report no.
3642).
KOBAYASHI, H., YUYAMA, A., MATSUSAKA, N., TAKENO, K., &
YANAGIVA, I. (1979) Effects of methylmercury chloride on various
cholinergic parameters in vitro. J. toxicol Sci., 4: 351-362.
KOBAYASHI, H., YUYAMA, A., MATSUSUAKA, N., TAKENO, K., &
YANAGIVA, I. (1981) Neuropharmacological effect of methylmercury in
mice with special reference to the central cholinergic system. Jpn. J.
Pharmacol., 31: 711-718.
KOLLER, L.D. & ROAN, J.G. (1980) Effects of lead, cadmium and
methylmercury on immunological memory. J. environ. Pathol. Toxicol., 4:
47-52.
KOLLER, L.D., ROAN, J.G., & BRAUNER, J.A. (1980) Methylmercury:
Effects of B-lymphocyte receptors and phagocytosis of macrophages. J.
environ. Pathol. Toxicol., 3: 407-411.
KOMSTA-SZUMSKA, E. & MILLER, D.R. (1984) A kinetic analysis of the
interaction between methylmercury and selenium. Toxicology, 33: 247-
257.
KOSTA, L. & BYRNE, R. (1969) Activation analysis for mercury in
biological samples at nanogram level. Talanta, 16: 1297-1302.
KUHNERT, P.M., KUHNERT, B.R., & ERHARD, P. (1981) Comparison of
mercury levels in maternal blood, fetal cord blood, and placental
tissues. Am. J. Obstet. Gynecol., 139: 209-213.
KUTSCHER, C.L., SEMBRAT, M., KUTSCHER, C.S., & KUTSCHER, N.L.
(1985) Effects of the high methylmercury dose used in the
collaborative behavioral teratology study on brain anatomy. Neurobehav.
Toxicol. Teratol., 7(6): 775-777.
KYLE, J.H. & GHANI, N. (1982a) Methylmercury in human hair: a study of
a Papua New Guinean population exposed to methylmercury through fish
consumption. Arch. environ. Health, 37: 266-270.
KYLE, J.H. & GHANI, N. (1982b) Elevated mercury levels in people from
Lake Murray, Western Province. Papua New Guinea med. J., 25: 81-88.
KYLE, J.H. & GHANI, N. (1983) Mercury concentrations in canned and
fresh fish and its accumulation in a population of Port Moresby
residents. Sci. total Environ., 26: 157-162.
LAKOWICZ, J.R. & ANDERSON, C.J. (1980) Permeability of lipid bilayers
to methylmercuric chloride: quantification by fluorescence quenching of
a carbazole-labelled phospholipid. Chem.-biol. Interact., 30: 309-323.
LAUWERYS, R., BUCHET, J.P., ROELD, H., & HUBERMONT, G. (1978)
Placental transfer of lead, mercury, cadmium, and carbon monoxide in
women. I. Comparison of the frequency distributions of the biological
indices in maternal and umbilical cord blood. Environ. Res., 15: 278-
289.
LEBLANC, R.M., JOLY, L.P., & PAIEMENT, J. (1984) pH-Dependent
interaction between methylmercury chloride and some membrane
phospholipids. Chem.-biol. Interact., 48: 237-241.
LEE, I.D. & DIXON, R.L. (1975) Effects of mercury on spermato-genesis
studied by velocity sedimentation, cell separation and serial mating.
J. Pharmacol. exp. Ther., 194: 171-181.
LEE, M., CHAN, K.S., SAIRENJI, E., & NIIKUNI, T. (1979) Effect of
sodium selenite on methylmercury-induced cleft palate in the mouse.
Environ. Res., 19: 39-48.
LEVESQUE, P. & ATCHISON, W. (1988) Effect of alteration of nerve
terminal Ca2+ regulation on increased spontaneous quantal release of
acetylcholine by methylmercury. Toxicol. appl. Pharmacol., 94: 55-65.
LIE, A., GUNDERSEN, N.M., & KORSGAARD, K.J. (1982) Mercury in
urine-sex, age and geographic differences in a reference population.
Scand. J. environ. Health, 8: 129-133.
LIND, B., BIGRAS, L., CERNICHIARI, E., CLARKSON, T.W., FRIBERG,
L., HELLMAN, M., KENNEDY, P., KIRKBRIDE, J., KJELLSTROM, T., &
OHLIN, B. (1988a) Quality control of analyses of mercury in hair.
Fresenius Z. anal. Chem., 332: 630-632.
LIND, B., FRIBERG, L., & NYLANDER, M. (1988b) II. Demethylation of
mercury in brain. J. Trace Elem. exp. Med., 1: 49-56.
LINDBERG, S., STOKES, P., GOLDBERG, E., & WREN, C. (1987) Group
report: Mercury. In: Hutchinson, T.W. & Meema, K.M., ed. Lead,
mercury, cadmium and arsenic in the environment, New York, Chichester,
Brisbane, Toronto, John Wiley & Sons, pp. 17-34.
LINDQVIST, O., JERNELOV, A., JOHANSSON, K., & RODHE, R. (1984)
Mercury in the Swedish environment: global and local sources, Solna,
National Swedish Environment Protection Board, 105 pp (Report No.
1816).
LOGDBERG, B., BRUN, A., BERLIN, M., & SCHUTZ, A. (1988) Congenital
lead encephalopathy in monkeys. Acta neuropathol., 77: 120-127.
LOK, E. (1983) The effect of weaning on blood, hair, fecal and urinary
mercury after chronic ingestion of methylmercury chloride by infant
monkeys. Toxicol. Lett., 15: 147-152.
LOMMEL, A., KRUSE, H., & WASSERMANN, O. (1985) Organochloride and
mercury in blood of a fish-eating population at the River Elbe in
Schleswig-Hostein, FRG. Arch. Toxicol., 8(Suppl.): 264-268.
MACFARLANE, D.E. (1981) The effects of methylmercury on platelets.
Mol. Pharmacol., 19: 470-476.
MCKEOWN-EYSSEN, G.E. & RUEDY, J. (1983a) Methylmercury exposure in
northern Quebec. I. Neurological findings in adults. Am. J. Epidemiol.,
118: 461-469.
MCKEOWN-EYSSEN, G.E. & RUEDY, J. (1983b) Prevalence of neurological
abnormality in Cree Indians exposed to methylmercury in northern
Quebec. Clin. invest. Med., 6: 161-169.
MCKEOWN-EYSSEN, G.E., RUEDY, J., & NEIMS, A. (1983) Methylmercury
exposure in northern Quebec. II. Neurological findings in children.
Am. J. Epidemiol., 118: 470-479.
MCKONE, C.E., YOUNG, C.A., BACHE, C.A., & LISK, D.J. (1971) Rapid
uptake of mercuric ion by goldfish. Environ. Sci. Technol., 5: 1138-
1139.
MAGNAVAL, R. & BATTI, R. (1980) Protective effect of phospho-lipids in
methylmercury inhibition of hydroxybutyrate dehydrogenase. Toxicol.
Lett., 5: 353-356.
MAGNUSSON, J. & RAMEL, C. (1986) Genetic variation in the
susceptibility to mercury and other metal compounds in Drosophila
melanogaster. Teratog. Carcinog. Mutagen., 6: 4.
MAGOS, L. (1971) Selective atomic-absorption determination of inorganic
mercury and methylmercury in undigested biological samples. Analyst,
96: 847-853.
MAGOS, L. (1982) Neurotoxicity, anorexia and the preferential choice of
antidote in methylmercury intoxicated rats. Neurobehav. Toxicol.
Teratol., 4: 643-646.
MAGOS, L. (1987) The absorption, distribution, and excretion of methyl
mercury. In: Edccles, C.U. & Annau, Z., ed. The toxicity of methyl-
mercury, Baltimore, John Hopkins University Press, pp. 24-44.
MAGOS, L. & BUTLER, W.H. (1972) Cumulative effects of methylmercury
dicyandiamide given orally to rats. Food Cosmet. Toxicol. 10: 513-517.
MAGOS, L. & CLARKSON, T.W. (1972) Atomic absorption determination of
total, inorganic and organic mercury in blood. J. Assoc. Off. Anal.
Chem., 55: 966-971.
MAGOS, L. & WEBB, M. (1977) The effect of selenium on the brain uptake
of methylmercury. Arch. Toxicol., 38: 201-207.
MAGOS, L., BAKIR, F., CLARKSON, T.W., AL-JAWAD, A.M., &
AL-SOFFI, M.H. (1976) Tissue levels of mercury in autopsy specimens of
liver and kidney. Bull. World Health Organ., 53: 93-96.
MAGOS, L., WEBB, M., & HUDSON, A.R. (1979) Complex formation between
selenium and methylmercury. Chem.-biol. Interact., 28: 201-207.
MAGOS, L., PERISTIANIS, C., CLARKSON, T.W., BROWN, A., PRESTON,
S., & SNOWDEN, R.T. (1981) Comparative study of the sensitivity of male
and female rats to methylmercury. Arch. Toxicol., 48: 11-20.
MAGOS, L., CLARKSON, T.W., & HUDSON, A.R. (1984) Differences in the
effects of selenite and biological selenium on the chemical form and
distribution of mercury after the simultaneous administration of HgCl2
and selenium to rats. J. Pharmacol. exp. Therap. 228(2): 478-483.
MAGOS, L., BROWN, A.W., SPARROW, S., BAILEY, E., SNOWDEN, R.T., &
SKIPP, W.R. (1985a) The comparative toxicology of ethyl- and
methylmercury. Arch. Toxicol., 57: 260-267.
MAGOS, L., CIKRT, M., & SNOWDEN, R. (1985b) The dependence of biliary
methylmercury secretion on liver GSH and ligandin. Biochem.
Pharmacol., 34: 301-305.
MAILHES, J.B. (1983) Methylmercury effects on Syrian hamster metaphase
II oocyte chromosomes. Environ. Mutagen., 5: 679-686.
MARC (1981) Health effects of methylmercury, London, Monitoring and
Assessment Research Centre, University of London, 82 pp (MARC Report
Number 24).
MARSH, D.O., MYERS, G.J., CLARKSON, T.W., AMIN-ZAKI, L., &
TIKRITI, S. (1977) Fetal methylmercury poisoning. New data on clinical
and toxicological aspects. Trans. Am. Neurol. Assoc., 102: 69-71.
MARSH, D.O., MYERS, G.J., CLARKSON, T.W., AMIN-ZAKI, L., TIKRITI,
S., & MAJEED, M.A. (1980) Fetal methylmercury poisoning: clinical and
toxicological data on 29 cases. Ann. Neurol., 7: 348-355.
MARSH, D.O., MYERS, G.J., CLARKSON, T.W., AMIN-ZAKI, L. TIKRITI,
S, MAJEED, M.A., & DABBAGH, A.R. (1981) Dose-response relationship for
human fetal exposure to methylmercury. Clin. Toxicol., 18: 1311-1318.
MARSH, D.O., CLARKSON, T.W., COX, C., MYERS, G.J., AMIN-ZAKI, L.,
& AL-TIKRITI, S. (1987) Fetal methylmercury poisoning. Arch. Neurol.,
44: 1017-1022.
MASUKAWA, T., KITO, H., HAYASHI, M., & IWATA, H. (1982) Formation
and possible role of bis(methylmercuric) selenide in rats treated with
methylmercury and selenite. Biochem. Pharmacol., 31: 75-78.
MATTHEWS, A.D. (1983) Mercury content of commercially important fish of
the Seychelles, and hair mercury levels of a selected part of the
population. Environ. Res., 30: 305-312.
MATTSSON, J.L., MILLER, E., ALLIGOOD, J.P., KOERING, J.E., &
LEVIN, S.G. (1981) Early effects of methylmercury on the visual evoked
response of the dog. Neurotoxicity, 2: 499-514.
MAY, K., STOEPPLER, M., & REISINGER, K. (1987) Studies in the ratio
total mercury/methylmercury in the aquatic food chain. Toxicol.
environ. Chem., 13: 153-159.
MIETTINEN, J.K. (1973) Absorption and elimination of dietary mercury
(Hg++) and methylmercury in man. In: Miller, M.W. & Clarkson, T.W., ed.
Mercury, mercurials and mercaptans, Springfield, Illinois, Charles C.
Thomas, pp. 233-246.
MILLER, C.T., KREWSKI, D., & TRYPHONAS, L. (1985)
Methylmercury-induced mitochondrial DNA synthesis in neural tissue of
cats. Fundam. appl. Toxicol., 5(2): 251-264.
MINAGAWA, K., SASAKI, T., TAKIZAWA, K., TAMURA, R., & OSHINA,
T. (1980) Accumulation route and chemical form of mercury in mushroom
species. Bull. environ. Contam. Toxicol., 25: 382-388.
MITSUMORI, K., MAITA, M., SAITO, T., TSUDA, S., & SHIRASU, Y. (1981)
Carcinogenicity of methylmercury chloride in ICR mice: preliminary note
on renal carcinogenesis. Cancer Lett., 12: 305-310.
MITSUMORI, K., MAITA, K., & SHIRASU, Y. (1984) Chronic toxicity of
methylmercury chloride in rats: pathological study. Jpn. J. vet. Sci.,
46: 549-557.
MIURA, K. & IMURA, N. (1987) Mechanism of methylmercury cytotoxicity.
Crit. Rev. in Toxicol., 18(3): 161-188.
MIURA, K., SUZUKI, K., & IMURA, N. (1978) Effects of methylmercury on
mitotic mouse glioma cells. Environ. Res., 17: 453-471.
MIURA, K., INOKAWA, M., & IMURA, N. (1984) Effects of methylmercury
and some metal ions on microtubule networks in mouse glioma cells and
in vitro tubulin polymerization. Toxicol. appl. Pharmacol., 73: 218-
231.
MOHAMED, M.K., EVANS, T.C., MOTTET, N.K., & BURBACHER, T.M.
(1986a) effects of methylmercury on sperm oxygen consumption. Acta
pharmacol. toxicol., 58: 219-224.
MOHAMED, M.K., LEE, W.I., MOTTET, N.K., & BURBACHER, T.M.
(1986b) Laser ligh-scattering study of the toxic effects of
methylmercury on sperm motility. J. Androl., 5(1): 11-15.
MORIMOTO, K., IIJIMA, S., & KOIZUMI, A. (1982) Selenite prevents the
induction of sister-chromatid exchanges by methylmercury and mercuric
chloride in human whole-blood cultures. Mut. Res., 102: 183-192.
MOTTET, N.K., SHAW, C.M., & BURBACHER, T.M. (1987) The pathological
lesions of methyl mercury intoxications in monkeys. In: Eccles, C.U. &
Annau, Z., ed. The toxicity of methyl mercury, Baltimore, John Hopkins
University Press, pp. 73-103.
MULDER, K.M. & KOSTYNIAK, P.J. (1985a) Effects of L-(alpha) S,5S)-
alpha-3-chloro-4,5-dihydro-5-isoxazoleacetic acid on urinary excretion
of methylmercury in the mouse. J. Pharmacol. exp. Ther., 234: 156-160.
MULDER, K.M. & KOSTYNIAK, P.J. (1985b) Involvement of glutathione in
the enhanced renal excretion of methylmercury in CFW Swiss mice.
Toxicol. appl. Pharmacol., 78: 451-457.
MUNRO, I.C., NERA, E.A., CHARBONNEAU, S.M., JUNKINS, B., &
ZAWIDZKA, Z. (1980) Chronic toxicity of methylmercury in the rat. J.
environ. Pathol. Toxicol., 3: 347-447.
MUSHAK, P. (1987) The quantitative measurement of methylmercury. In:
Eccles, C.U. & Annau, Z., ed. The Toxicity of methyl mercury,
Baltimore, Johns Hopkins University Press, pp. 1-12.
MYKKANEN, H., RASANEN, L., AHOLA, M., & KIMPPA, S. (1986) Dietary
intakes of mercury, lead, cadmium and arsenic by Finnish children.
Hum. Nutr. appl. Nutr., 40: 32-39.
NABRZYSKI, M. & GAJEWSKA, R. (1984) Determination of mercury,
cadmium, and lead in food. Rocz. PZH, 35(1): 1-11 (in Polish).
NAGANUMA, A. & IMURA, N. (1980) Bis(methylmercuric) selenide as a
reaction product from methylmercury and selenite in rabbit blood. Res.
Commun. chem. Pathol. Pharmacol., 27: 163-173.
NAGANUMA, A. & IMURA, N. (1984) Species differences in biliary
excretion of methylmercury. Biochem. Pharmcol., 33: 679-682.
NAGANUMA, A., KOYAMA, Y., & IMURA, N. (1980) Behavior of
methylmercury in mammalian erythrocytes. Toxicol. appl. Pharmacol., 54:
405-410.
NAKADA, S. & IMURA, N. (1982) Uptake of methylmercury and inorganic
mercury by mouse glioma and mouse neuroblastoma cells. Neurotoxicology
3: 249-258.
NAKADA, S. & IMURA, N. (1983) Susceptibility of lipids to mercurials.
J. appl. Toxicol., 3: 131-135.
NAKADA, S., NOMOTO, A., & IMURA, N. (1980) Effect of methylmercury
and inorganic mercury on protein synthesis in mammalian cells.
Ecotoxicol. environ. Saf., 4: 184-190.
NATIONAL ACADEMY OF SCIENCES (1978) An assessment of mercury in
the environment, Washington, DC, National Academy of Sciences, National
Research Council.
NEWBERNE, P.M., GLASER, O., FRIEDMAN, L., & STILLINGS, B.R. (1972)
Chronic exposure of rats to methyl mercury in fish protein. Nature
(Lond.), 237: 40-41.
NISHIKIDO, N., FURUYASHIKI, K., NAGANUMA, A., SUZUKI, T., &
IMURA, M. (1987) Maternal selenium deficiency enhances the fetolethal
toxicity of methylmercury. Toxicol. appl. Pharmacol., 88: 322-328.
NISHIKIDO, N., SATOH, Y., NAGANUMA, A., & IMURA, N. (1988a) Effect
of maternal selenium deficiency on the teratogenicity of methylmercury.
Toxicol. Lett., 40: 153-157.
NISHIKIDO, N., SATOH, Y., IWAI, I., ISHII, M., NAGANUMA, A., &
IMURA, A. (1988b) Specific alteration of the form of selenium in fetal
liver on maternal methylmercury treatment. Toxicol. appl. Pharmacol.,
92(3): 497-499.
NIXON, J.E., KOLLER, L.D., & EXON, J.H. (1979) Effect of methylmercury
chloride on transplacental tumors induced by sodium nitrites and
ethylurea in rats. J. Natl Cancer Inst., 63: 1057-1063.
NOBUNAGA, T., SATOH, H., & SUZUKI, T. (1979) Effects of sodium
selenite on methylmercury embryotoxicity and teratogenicity in mice.
Toxicol. appl. Pharmacol., 47: 79-88.
NORDBERG, G.F. & STRANGERT, P. (1976) Estimations of a dose-response
curve for long-term exposure to methylmercury compounds in human beings
taking into account variability of critical organ concentrations and
biological half-times. A preliminary communication. In: Nordberg,
G.F., ed. Effects and dose-response relationships, Amsterdam, Oxford,
New York, Elsevier Science Publishers, pp. 273-282.
NORDBERG, G.F. & STRANGERT, P. (1978) Fundamental aspects of dose-
response relationships and their extrapolation for non-carcinogenic
effects of metals. Environ. Health Perspect., 22: 97-108.
NORDBERG, G.F. & STRANGERT, P. (1982) Risk estimation models derived
from metabolic and damage parameter variation in the population. In:
Vouk, V.B., Butler, G.C., Hoel, D.G., & Peakall, D.B., ed. Methods for
estimating risk of chemical injury: Human and non-human biota and
ecosystems, Chichester, West Sussex, John Wiley and Sons, pp. 477-491
(SGOMSEC 2).
NORSETH, T. & CLARKSON, T.W. (1971) Intestinal transport of 203Hg-
labeled methyl mercury chloride. Role of biotransformation in rats.
Arch. environ. Health, 22: 668-577.
NRIAGU, J.O. (1979) The biogeochemistry of mercury in the environment,
Amsterdam, Oxford, New York, Elsevier Science Publishers.
NYLANDER, N., FRIBERG, L., & LIND, B. (1987) Mercury concentration in
the human brian and kidneys in relation to exposure from dental
amalgams. Swed. dent. J., 11: 179-187.
O'KUSKY, J.R., BOYES, B.E., & MCGEER, E.G. (1988)
Methylmercury-induced movement and postural disorders in developing
rat: regional analysis of brain catecholamines and indoleamines. Brain
Res., 439(1/2): 138-146.
OHI, G., NISHIGAKI, S., SEKI, H., TAMURA, Y., MAKI, T., MINOWA, K.,
SHIMAMURA, Y., MIZOGUCHI, I., INABA, Y., TAZIKAWA, Y., &
KAWANISHI, Y. (1980) The protective potency of marine animal meat
against the neurotoxicity of methylmercury: its relationship with the
organ distribution of mercury and selenium. Food Cosmet. Toxicol., 18:
139-145.
OHLANDER, E.H., OHLIN, B., ALBANUS, L., & BRUCE, A. (1985) Mercury
levels in the hair of pregnant women eating Swedish fresh water fish.
Var Föda, 8: 393-394.
OHSAWA, M. & MAGOS, L. (1974) The chemical form of methylmercury
complex in rat bile. Biochem. Pharmacol., 23: 1903-1906.
OHSAWA, M., FUKUDA, K., & KAWAI, K. (1981) Accelerated accumulation
of methylmercury in the rat fetus at the late pregnant stage. Ind.
Health, 19: 219-221.
OLSON, F.C. & MASSARO, E.J. (1980) Developmental pattern of cAMP,
adenyl cyclase, and cAMP phosphdiesterase in the palate, lung, and
liver of the fetal mouse: alterations resulting from exposure to
methylmercury at levels inhibiting palate closure. Teratology, 22:
155-166.
OMATA, S., SAKIMURA, K., ISHII, T., & SUGANO, H. (1978) Chemical
nature of methylmercury complex with a low molecular weight in the
liver cytosol of rats exposed to methylmercury chloride. Biochem.
Pharmacol., 27: 1700-1701.
OMATA, S., HORIGOME, T., MOMOSE, Y., KAMBAYASHI, M.,
MOCHIZUKI, M., & SUGANO, H. (1980) Effects of methylmercury chloride
on the in vivo rate of protein synthesis in the brain of the rat: in
vivo rate of protein synthesis in the brain of the rat: examination
with the injection of a large quantity of 14C- valine. Toxicol. Appl.
Pharmacol., 56: 207-215.
OMATA, S., MOMOSE, Y., UEKI, H., & SUGANO, H. (1982) In vivo effect
of methylmercury on protein synthesis in peripheral nervous tissues of
the rat. Arch. Toxicol., 49: 203-214.
ONFELT, A. (1983) Spindle disturbances in mammalian cells. I. Changes
in the quantity of free sulfhydryl groups in relation to survival and
C-mitosis in V79 Chinese hamster cells after treatment with colcemid,
diamide, carbaryl and methylmercury. Chem.-biol. Interact., 46: 201-
217.
ONFELT, A. & JENSSEN, D. (1982) Enhanced mutagenic response of MNU by
post-treatment with methylmercury, caffeine or thymidine in V79 Chinese
hamster cells. Mutat. Res., 106: 297-303.
PACYNA, J.M. (1987) Atmospheric emissions of arsenic, cadmium, lead and
mercury from high temperature processes in power generation and
industry. In: Hutchinson, T.C. & Meema, K.M., ed. Lead, Mercury,
Cadmium and Arsenic in the environment, New York, Chichester, Brisbane,
Toronto, John Wiley & Sons, pp. 69-88 (SCOPE 31).
PALLOTTI, G., BENCIVENGA, B., & SIMONETTI, T. (1979) Total mercury
levels in whole blood, hair and fingernails for a population group from
Rome and its surroundings. Sci. total Environ., 2: 69-72.
PECKHAM, N.H. & CHOI, B.H. (1986) Surface change alterations in mouse
fetal astrocytes due to methylmercury: an ultra-structural study with
cationized ferritin. Exp. mol. Pathol., 44: 230-234.
PETER, F. & STRUNC, G. (1984) Semiautomated analysis for mercury in
whole blood, urine and hair by on-stream generation of cold vapor.
Clin. Chem., 30(6): 893-895.
PHELPS, R.W., CLARKSON, T.W., KERSHAW, T.G., & WHEATLEY, B.
(1980) Interrelationships of blood and hair mercury concentrations in
a North American population exposed to methylmercury. Arch. environ.
Health, 35: 161-168.
PIPER, R.C., MILLER, V.L., & DICKINSON, E.O. (1971) Toxicity and
distribution of mercury in pigs with acute methylmercurialism. Am. J.
vet. Res., 32: 263-273.
PRASAD, K.N. & RAMANUJAM, S. (1980) Vitamin E and vitamin C alter the
effect of methylmercuric chloride on neuroblastoma and glioma cells in
culture. Environ. Res., 21: 343-349.
PROHASKA, J.R. & GANTHER, H.E. (1977) Interactions between selenium
and methylmercury in rat brain. Chem.-biol. Interact. 16: 155-167.
QUANDT, F.N., KATO, E., & NARAHASHI, T. (1982) Effects of
methylmercury on electrical responses of neuroblastoma cells.
Neurotoxicology, 3: 205-220.
RAMANUJAM, M. & PRASAD, K.N. (1979) Alterations in gene expression
after chronic treatment of glioma cells in culture with methylmercuric
chloride. Biochem. Pharmacol., 28: 2979-2984.
RAMLAL, P.S., RUDD, J.W.M., FURUTANI, A., & XUN, L. (1985) The
effect of pH on methylmercury production and decomposition in lake
sediments. Can. J. Fish. aquat. Sci., 42: 685-692.
RAMLAL, P.S., RUDD, J.W.M., & HECKY, R.E. (1986) Methods for
measuring specific rates of mercury methylation and degradation and
their uses in determining factors controlling net rates of mercury
methylation. Appl. environ. Microbiol., 51: 110-114.
REBEL, G., GUERIN, P., & PRASAD, K.N. (1983) Effect of methylmercuric
chloride on gangliosides of mouse neuroblastoma cells in culture.
Lipids, 18: 664-667.
REFSVIK, T. (1984a) N-Acetylpenicillamine potentiated excretion of
methylmercury in rat bile: influence of S-methyl-cysteine. Acta
pharmacol. toxicol., 55: 121-125.
REFSVIK, T. (1984b) N-Acetylpenicillamine potentiation of biliary
excretion of methylmercury: influence of glutathione depletors. Acta
pharmacol. toxicol., 55: 58-64.
REFSVIK, T. & NORSETH, T. (1975) Methylmercuric compounds in rat bile.
Acta pharmacol. toxicol., 36: 67-78.
REUHL, K.R., CHANG, L.W., & TOWNSEND, J.W. (1981a) Pathological
effects of in utero methylmercury exposure on the cerebellum of
methylmercury exposure on the cerebellum of the golden hamster. I.
Early effects upon the neonatal cerebellar cortex. Environ. Res., 26:
281-306.
REUHL, K.R., CHANG, L.W., & TOWNSEND, J.W. (1981b) Pathological
effects of in utero methylmercury exposure on the cerebellum of
methylmercury exposure on the cerebellum of the golden hamster. II.
Residual effects on the adult cerebellum. Environ. Res., 26: 307-327.
RICHARDSON, R.J. & MURPHY, S.D. (1975) Effect of glutathione depletion
on tissue deposition of methylmercury in rats. Toxicol. appl.
Pharmacol., 31: 505-519.
RIOLFATTI, M. (1977) [Further epidemiological studies on mercury
concentrations in edible fish and in human blood and hair.] Ig. mod.,
70: 169-186 (in Italian).
RODIER, P.M. (1977) Correlation between prenatally-induced alterations
in CNS cell populations and postnatal function. Teratology, 16: 235-
246.
RODIER, P.M., ASHNER, M., & SAGER, P.R. (1984) Mitotic arrest in the
developing CNS after prenatal exposure to methylmercury. Neurobehav.
Toxicol. Teratol., 6: 379-385.
RODIER, P.M. & KATES, B. (1988) Histological localization of
methylmercury in mouse brain and kidney by emulsion autoradiography
203Hg. Toxicol. appl. Pharmacol., 92: 224-234.
ROELS, H., HUBERMONT, G., BUCHET, J.P., & LAUWERYS, R. (1978)
Placental transfer of lead, mercury, cadmium and carbon monoxide in
women. III. Factors influencing the accumulation of heavy metals in
the placenta and the relationship between metal concentration and the
placenta and in maternal and cord blood. Environ. Res., 16: 236-247.
ROWLAND, I.R., DAVIES, M.J., & EVANS, J.G. (1980) Tissue content of
mercury in rats given methylmercuric chloride orally: influence of
intestinal flora. Arch. environ. Health, 35: 155-160.
ROWLAND, I.R., ROBINSON, R.D., DOHERTY, R.A., & LANDRY, T.D.
(1983) Are developmental changes in methylmercury metabolism and
excretion mediated by the intestinal microflora? In: Clarkson, T.W.,
Nordberg, G.F., & Sager, P.R., ed. Reproductive and developmental
toxicity of metals, New York, London, Plenum Press, pp. 745-758.
ROWLAND, I.R., ROBINSON, R.D., & DOHERTY, R.A. (1984) Effects of diet
on mercury metabolism and excretion in mice given methylmercury: role
of gut flora. Arch. environ. Health, 39: 401-418.
ROWLAND, I.R., MALLETT, A.K., FLYNN, J., & HARGREAVES, R.J.
(1986) The effect of various dietary fibres on tissue concentration and
chemical form of mercury after methylmercury exposure in mice. Arch.
Toxicol., 59: 94-98.
RUDD, J.W.M., FURUTANI, A., & TURNER, M.A. (1980) Mercury
methylation by fish intestinal contents. Appl. environ. Microbiol., 40:
777-782.
RUSTAM, H., VON BURG, R., AMIN-ZAKI, L., & ELHASSANI, S. (1975)
Evidence for a neuromuscular disorder in methylmercury poisoning.
Arch. environ. Health, 30: 190-195.
SAGER, P.R. (1988) Selectivity of methyl mercury effects on
cytoskeleton and mitotic progression in cultured cells. Toxicol appl.
Pharmacol., 94: 473-486.
SAGER, P.R. & MATHESON, D. (1988) Mechanisms of neurotoxicity related
to selective disruption of microtubules and intermediate filaments.
Toxicology, 49(2-3): 479-492.
SAGER, P.R., DOHERTY, R.A., & OLMSTEAD, J.B. (1981a) Interaction of
methylmercury with microtubules. Toxicologist, 1: 118-119.
SAGER, P.R., DOHERTY, R.A., & OLMSTEAD, J.B. (1981b) Interactions of
methylmercury with microtubules. J. cell Biol., 91: 330a.
SAGER, P.R., DOHERTY, R.A., & RODIER, P.M. (1982) Morphometric
analysis of the effect of methylmercury on developing mouse cerebellar
cortex. Toxicologist, 2: 116.
SAGER, P.R., DOHERTY, R.A., & OLMSTEAD, J.B. (1983) Interaction of
methylmercury with microtubules in cultured cells and in vitro. Exp.
cell Res., 146: 127-137.
SAGER, P.R., ASHNER, M., & RODIER, P.M. (1984) Persistent differential
alterations in developing cerebellar cortex of male and female mice
after methylmercury exposure. Brain Res., 12: 1-11.
SARAFIAN, T. & VERITY, M.A. (1985) Inhibition of RNA and protein
synthesis in isolated cerebellar cells by in vitro and in vivo methyl-
mercury. Neurochem. Pathol., 3(1): 27-39.
SARAFIAN, T. & VERITY, M.A. (1986) Mechanism of apparent transcription
inhibition by methylmercury in cerebellar neurons. J. Neurochem.,
47(2): 625-631.
SARAFIAN, T.A., CHEUNG, M.K., & VERITY, M.A. (1984) In vitro
methylmercury inhibition of protein synthesis in neonatal cerebellar
perikarya. Neuropathol. appl. Neurobiol., 10: 85-100.
SATOH, H., YASUDA, N., & SHIMAI, S. (1985) Development of reflexes in
neonatal mice prenatally exposed to methylmercury and selenite.
Toxicol. Lett., 25: 199-203.
SCHROEDER, W.H. & JACKSON, R.A. (1987) Environmental measurements
with an atmospheric mercury monitor having specific capabilties.
Chemosphere, 16: 183-199.
SECO, J.M. (1987) Big mercury deposit found in Spain. Financial Times,
30 October 1987.
SHAMOO, A.E., MACLENNAN, D.H., & ELDEFRAWI, M.E. (1976)
Differential effects of mercurial compounds on excitable tissues.
Chem.-biol. Interact., 12: 41-52.
SHERLOCK, J.C., LINDSAY, D.G., HISLOP, J.E., EVANS, W.H., &
COLLIER, T.R. (1982) Duplication diet study on mercury intake by fish
consumption in the United Kingdom. Arch. environ. Health, 37: 271-278.
SHERLOCK, J.C. & QUINN, M. (1988) Underestimation of dose-response
relationship with particular reference to the relationship between the
dietary intake of mercury and its concentration in blood. Hum.
Toxicol. 7: 129-132.
SHERLOCK, J.C., HISLOP, J., NEWTON, D., TOPPING, G., & WHITTLE, K.
(1984) Elevation of mercury in human blood from controlled chronic
ingestion of methylmercury in fish. Hum. Toxicol., 3: 117-131.
SHIMAI, S. & SATOH, H. (1985) Behavioral teratology of methylmercury.
J. toxicol. Sci., 10: 199-216.
SHIMOJO, N., YAMAGUCHI, S., & SANO-KENICHI (1976) Methylmercury
derivatives in engine exhausts and its synthesis. Jpn. J. ind. Health,
18: 36-37.
SIDMAN, R.L. & RAKIC, P. (1973) Neuronal migration, with special
reference to developing human brain: a review. Brain Res., 63: 1-35.
SIKORSKI, R., PASZKOWSKI, T., & SZPRENGIER-JUSZKIEWICZ, T.
(1986) Mercury in neonatal scalp hair. Sci. total Environ., 57: 105-
110.
SILVER, S. (1984) Bacterial transformations of and resistance to heavy
metals. In: Nriagu, J.O., ed. Changing metal cycles and human health,
Berlin, Heidelberg, New York, Springer-Verlag, pp. 199-225.
SKERFVING, S. (1974) Methylmercury exposure, mercury levels in blood
and hair, and health status in Swedes consuming contaminated fish.
Toxicology, 2: 3-23.
SLOTKIN, T.A., KAVLOCK, R.J., COWDERY, T., ORBAND, L.,
BARTOLOME, M., GRAY, J.A., REHNBERG, B.F., & BARTOLOME, J.
(1986) Functional consequences of prenatal methylmercury exposure:
effects on renal and hepatic repsonses to trophic stimuli and on renal
excretory mechanisms. Toxicol. Lett., 34: 231-245.
SLOTKIN, T.A., PACHMAN, S., KAVLOCK, R.J., & BARTOLOME, J.
(1985) Effects of neonatal methylmercury exposure on development of
nucleic acids and proteins in rat brain: regional specificity. Brain
Res. Bull., 14: 397-400.
SMITH, J.H., MCCORMACK, K.M., BRASELTON, W.E., Jr, & HOOK, J.B.
(1983) The effect of prenatal methylmercury administration on postnatal
renal functional development. Environ. Res., 30: 63-71.
SMITH, R.G., VORWALD, A.J., PATIL, L.S., & MOONEY, T.F. (1970)
Effects of exposure to mercury in the manufacture of chlorine. Am. Ind.
Hyg. Assoc. J., 31: 687-700.
SPUHLER, K. & PRASAD, K.N. (1980) Inhibition by methylmercuric chloride
of prostaglandin E1-sensitive adenylate cyclase activity in glioma but
not in neuroblastoma cells in culture. Biochem. Pharmacol., 29: 201-
203.
SPYKER, J.M., SPARBER, S.B., & GOLDBERG, A.M. (1972) Subtle
consequences of methylmercury exposure: behavioural deviations in
offspring of treated mothers. Science, 177: 621-623.
STEIN, A., GREGUS, Z., & KLAASSEN, C. (1988) Species variations in
biliary excretion of glutathione-related thiols and methylmercury.
Toxicol. appl. Pharmacol., 93: 351-359.
STOKES, P.M. & WREN, C.D. (1987) Bioaccumulation of mercury by aquatic
biota in hydroelectric reservoirs: a review and consideration of
mechanisms. In: Hutchinson, T.W. & Meema, K.M., ed. Lead, mercury,
cadmium and arsenic in the environment, New York, Chichester, Brisbane,
Toronto, John Wiley & Sons, pp. 255-277.
SUDA, I. & TAKAHASHI, H. (1986) Enhanced and inhibited bio-transfor-
mation of methylmercury in the rat spleen. Toxicol. appl. Pharmacol.,
82: 45-52.
SUGIURA, Y., TAMI, Y., & TANAKA, H. (1978) Selenium protection against
mercury toxicity: high binding affinity of methylmercury by selenium-
containing ligands in comparison with sulfur-containing ligands.
Bioinorg. Chem. 9(2): 167-180.
SUZUKI, T., SHISHIDO, S., & URUSHIYAMA, K. (1976) Mercury in
cigarettes. Tohoku J. exp. Med., 119: 353-356.
SUZUKI, T., HONGO, T., & YAMAMOTO, R.A (1984a) Hair mercury levels
of Japanese women during the period 1881-1968. J. appl. Toxicol. 4:101-
104.
SUZUKI, T, YONEMOTO, J., SATOH, H., NAGANUMA, A., IMURA, N., &
KIGAWA, T. (1984b) Normal organic and inorganic mercury levels in the
human feto-placental system. J. appl. Toxicol., 4: 249-252.
SUZUKI, T., WATANABE, S., HONGO, T., KAWABE, T., INAOKA, T.,
OHTSUKA, R., & AKIMICHI, T. (1988) Mercury in scalp hair of Papuans in
the Fly Estuary, Papua New Guinea. Asia-Pacific J. public Health, 2:
39-47.
SWEDISH ENVIRONMENTAL PROTECTION BOARD (1986) Mercury:
Occurrence and turnover of mercury in the environment, Stockholm,
National Environmental Protection Board (Mercury Report No. 3).
SWEDISH EXPERT GROUP (1971) Methylmercury in fish. A toxicological-
epidemiological evaluation of risks. Nord. Hyg. Tidskr., 4(Suppl.):
19-364.
SYVERSEN, T.L.M. (1982) Changes in protein and RNA synthesis in rat
brain neurons after a single dose of methylmercury. Toxicol. Lett., 10:
31-34.
SZPRENGIER-JUSZKIEWICZ, T. (1988) [Evaluation of daily intake of
mercury with food stuffs in Poland.] Bromatol. Chem. Toksykol., 21:
228-232 (in Polish).
SZUCKI, B. & KURYS, H. (1982) [Mercury levels in the blood and hairs in
the general population.] Rocz. PZH, 33(3): 143-148 (in Polish).
TAKEUCHI, T. (1977) Pathology of fetal Minamata disease. The effect of
methylmercury on intrauterine life of human being. Pediatrician, 6:
69-87.
TAKEUCHI, T. & ETO, K. (1975) Minamata disease. Chronic occurrence from
pathological viewpoints. In: Studies on the health effects of
alkylmercury in Japan, Tokyo, Japan Environment Agency, pp. 28-62.
TAMASHIRO, H., AKAGI, H., ARAKAKI, M., FUTATSUKA, M., &
ROHT, L.H. (1984) Causes of death in Minamata disease: analysis of
death certificates. Int. Arch. occup. environ. Health, 54: 135-146.
TAMASHIRO, H., ARAKAKI, M., FUTATSUKA, M., & LEE, S. (1986)
Methylmercury exposure and mortality in southern Japan: a close look at
causes of death. J. Epidemiol. community Health, 40: 181-185.
TAMASHIRO, H., FUKUTOMI, K., & LEE, E. (1987) Methylmercury
exposure and mortality in Japan: A life table analysis. Arch. environ.
Health, 42: 100-107.
TAYARANI, I., LEFAUCONNIER, J., & BOURRE, J. (1988) The effect of
mercurials on amino acid transport and rubidium uptake by isolated rat
brain microvessels. Neurotoxicology, 8(4): 543-552.
Taylor A, Marks V (1973) Measurement of urinary mercury excretion by atomic absorption
in health and disease. Br J Ind Med 30: 293-296.
THOMAS, D.J. & SMITH, J.C. (1979) Partial characterization of a low-
molecular weight methylmercury complex in rat cerebrum. Toxicol. appl.
Pharmacol., 47: 547-556.
THOMAS, D.J. & SMITH, J.C. (1982) Effects of co-administered low-
molecular-weight thiol compounds on short-term distribution of methyl-
mercury in the rat. Toxicol. appl. Pharmacol., 62: 104-110.
THOMAS, D.J. & SMITH, J.C. (1984) Effects of co-administered sodium
selenite on short-term distribution of methylmercury in the rat.
Environ. Res., 34: 287-294.
THOMAS, D.J., FISHER, H.L., SUMLER, M.R., MARCUS, A.H., MUSHAK,
P., & HALL, L.L. (1986) Sexual differences in the distribution and
retention of organic and inorganic mercury in methylmercury-treated
rats. Environ. Res., 41: 219-234.
THROWER, S.J. & ANDREWARTHA, K.A. (1981) Glutathione peroxidase
response in tissues of rats fed diets containing fish protein
concentrate prepared from shark flesh of known mercury and selenium
content. Bull. environ. Contam. Toxicol., 26: 77-84.
TOLLEFSON, L. & CORDLE, F. (1986) Methylmercury in fish: a review of
residue levels, fish consumption and regulatory action in the United
States. Environ. Health Perspect., 68: 203-208.
TSUBAKI, T. & IRUKAYAMA, K., ed. (1977) Minamata disease, Amsterdam,
Oxford, New York, Elsevier Science Publishers.
TSUBAKI, T. & TAKAHASHI, H. (1986) Recent advances in Minamata disease
studies, Tokyo, Kodansha.
TSUBAKI, T., HIROTA, K., SHIRAKAWA, K., KONDO, K., & SATO, T.
(1978) Clinical, epidemiological and toxicological studies on
methylmercury poisoning. In: Plaa, G.L. & Duncan, W.A.M., ed.
Proceedings of the First International Congress on Toxicology, New
York, London, San Francisco, Academic Press, pp. 339-357.
TURNER, C.J., BHATNAGER, M.K., & YAMASHIRO, S. (1981) Ethanol
potentiation of methyl mercury toxicity: a preliminary report. J.
Toxicol. environ. Health, 7: 665-668.
TURNER, M.A. & RUDD, J.W.M. (1983) The English-Wabigoon river system.
III. Selenium in lake enclosures: its geochemistry, bioaccumulation and
ability to reduce mercury bioaccumulation. Can. J. Fish. aquat. Sci.,
40: 2228-2250.
TURNER, M.D., KILPPER, R.W., SMITH, J.C., MARSH, D.O., &
CLARKSON, T.W. (1975) Studies on volunteers consuming methylmercury in
tuna fish. Clin. Res., 23: 2.
TURNER, M.D., MARSH, D.O., SMITH, J.C., CLARKSON, T.W., INGLIS,
J.B., RUBINO, E.C., CHIRIBOGA, J., & CHIRIBOGA, C.C. (1980)
Methylmercury in populations eating large quantities of marine fish.
Arch. environ. Health, 35: 367-378.
URANO, T., NAGANUMA, A., & IMURA, N. (1988) Methylmercury-
cysteinylglycine constitutes the main form of methylmercury in rat
bile. Res. Commun. chem. Pathol. Pharmacol., 60: 197-210.
US DEPARTMENT OF COMMERCE (1978) Report on the chance of US
seafood consumers exceeding the current acceptable daily intake for
mercury and on recommended regulatory controls, Washington, DC, US
Department of Commerce, National Oceanic and Atmospheric
Administration, National Marine Fisheries Service, pp. 1-198.
US EPA (1980) Ambient water quality criteria for mercury, Washington,
DC, US Environmental Protection Agency, Criteria and Standards Division
(EPA-600/479-049).
US EPA (1984) Mercury health effects update: health issue assessment,
Washington, DC, US Environmental Protection Agency (EPA-600/8-84-
019F).
VALCIUKAS, J.A., LEVIN, S.M., NICHOLSON, W.J., & SELIKOFF, I.J.
(1986) Neurobehavioural assessment of Mohawk Indians for sub-clinical
indications of methyl mercury neurotoxicity. Arch. environ. Health, 41:
269-272.
VERSCHAEVE, L. & LEONARD, A. (1984) Dominant lethal test in female
mice treated with methylmercury chloride. Mutat. Res., 136: 131-136.
VERSCHAEVE, L., KIRSCH-VOLDERS, M., & SUSANNE, C. (1983)
Mercury chloride- and methyl mercury chloride-induced inhibition of NOR
activity. Teratog. Carcinog. Mutagen., 3: 447-456.
VOGEL, D.G., MARGOLIS, R.L., & MOTTET, N.K. (1985) The effects of
methylmercury binding to microtubules. Toxicol. appl. Pharmacol., 80:
473-486.
VOGEL, D.G., RABINOVITCH, P.S., & MOTTET, N.K. (1986)
Methyl-mercury effects on cell cycle kinetics. Cell Tissue Kinet., 19:
227-242.
VON BURG, R. & LANDRY, T. (1976) Methylmercury and the skeletal muscle
receptor. J. Pharm. Pharmacol., 28: 548-551.
VON BURG, R., FARRIS, F., & SMITH, J.C. (1974) Determinations of
methylmercury in blood by gas chromatography. J. Chromatogr., 97: 65-
70.
WALSH, C.T. (1982) The influence of age on the gastrointestinal
absorption of mercuric chloride and methylmercury chloride in the rat.
Environ. Res., 27: 412-420.
WASSICK, K.H. & YONOVITZ, A. (1985) Methylmercury ototoxicity in mice
determined by auditory brain stem responses. Acta otolarynol.
(Stockholm), 99: 35-45.
WATANABE, H., SHIMOJO, N., SANO, K., & YAMAGUCHI, S. (1988) The
distribution of total mercury in the brian after the lateral
ventricular single injection of methylmercury and glutathione. Res.
Commun. chem. Pathol. Pharmacol. 60(1): 57-69.
WATANABE, T., SHIMADA, T., & ENDO, A. (1982) Effects of mercury
compounds on ovulation and meiotic and mitotic chromosomes in female
golden hamsters. Teratology, 25: 381-384.
WELSH, S.O. (1979) The protective effect of vitamin E and N,N'-
diphenyl-p-phenylenediamine (DPPD) against methyl mercury toxicity in
the rat. J. Nutr., 109: 1673-1681.
WESTOO, G. (1968) Determination of methylmercury salts in various kinds
of biological material. Acta chem. Scand. 22: 2277-2280.
WGMF (1980) Report on mercury in fish and fish products. Canberra
Working Group on Mercury in Fish, Department of Primary Industry, p.
371.
WHEATLEY, B. (1979) Methylmercury in Canada: exposure of Indian and
Inuit residents to methylmercury in the Canadian environment, Ottawa,
Department of National Health and Welfare, Medical Services Branch, p.
200.
WHEATLEY, B., BARBEAU, A., CLARKSON, T.W., & LAPHAM, L. (1979)
Methylmercury poisoning in Canadian Indians - the elusive diagnosis.
Can. J. neurol. Sci., 6(4): 417-422.
WHO (1976a) Conference on intoxication due to alkylmercury-treated
seed, Baghdad, Iraq, 9-13 September 1974, Bull. World Health Organ.,
53(Suppl.): 105-112.
WHO (1976b) Environmental Health Criteria 1: Mercury, Geneva, World
Health Organization, 132 pp.
WHO (1978) WHO Technical Report Series, No. 631 (Evaluation of certain
food additives and contaminants. Twenty-second report of the Joint
FAO/WHO Expert Committee on Food Additives).
WHO (1980) Consultation to re-examine the WHO Environmental Health
Criteria for mercury, Geneva, 21-25 April 1980, Geneva, World Health
Organization (Unpublished report EHE/EHC/80.22).
WHO (1989a) Environmental Health Criteria 86: Mercury - Environmental
aspects, Geneva, World Health Organization, 150 pp.
WHO (1989b) Evaluation of certain food additives and contaminants.
Thirty-third report of the Joint FAO/WHO Expert Committee on Food
Additives, Geneva, World Health Organization (WHO Technical Report
Series 776).
WIENER, J.G. (1987) Metal contamination of fish in low-pH lakes and
potential implications for piscivorous wildlife. Trans. North Am.
Wildl. Natl. Resour. Conf., 52: 645-657.
WIGFIELD, D.C., CROTEAU, S.M., & PERKINS, S.L. (1981) Elimination of
the matrix effect in the cold-vapor atomic absorption analysis of
mercury in human hair samples. J. anal. Toxicol., 5: 52-55.
WOOD, J.M. & WANG, H.K. (1983) Microbial resistance to heavy metals.
Environ. Sci. Technol., 17: 82a-90a.
WULF, H.C., KROMANN, N., KOUSGAARD, N., HANSEN, J.C.,
NIEBUHR, E., & ALBOGE, K. (1986) Sister chromatid exchange (SCE) in
Greenlandic Eskimos. Dose-respone relationship between SCE and seal
diet, smoking and blood cadmium and mercury concentrations. Sci. total
Environ., 48: 81-94.
XUN, L. & CAMPBELL, N.E.R. (1987) Measurements of specific rates of net
methyl mercury production in the water column and surface sediments of
acidified and circumneutral lakes. Can. J. Fish. aquat. Sci., 44: 750-
757.
YAMAGUCHI, S., FUJIKI, M., SHIMOJO, N., KAKU, S., HIROTA, Y.,
MORI, Y., PHAS, B., & SANO, K. (1977) A background of geographical
pathology on mercury in the east Pacific area. J. occup. Med., 19: 502-
504.
YAMAMOTO, R., SUZUKI, T., SATOH, H., & KAWAI, K. (1986) Generation
and dose as modifying factors of inorganic mercury accumulation in
brain, liver and kidneys of rats fed methylmercury. Environ. Res., 41:
309-318.
YAMINI, B. & SLEIGHT, S.D. (1984) Effects of ascorbic acid deficiency
on methylmercury dicyandiamide toxicosis in guinea pigs. J. environ.
Pathol. Toxicol. Oncol., 5: 139-150.
YOSHINO, Y., MOZAI, T., & NAKAO, K. (1966) Biochemical changes in the
brain in rats poisoned with an alkyl mercury compound, with special
reference to the inhibition of protein synthesis in brain cortex
slices. J. Neurochem., 13: 1223-1230.
ZELENKO, V. & KOSTA, L. (1973) A new method for the isolation of
methylmercury from biological tissue and its determination at the
parts-per-million level by gas chromatography. Talanta, 20: 115-123.
ZIMMER, L., JOHNSON, P.C., & CARTER, D.E. (1980) A comparison of
biochemical, pathological or behavioral methods for the assessment of
the effectiveness of treatment for methylmercury poisoning in rats.
Neurobehav. Toxicol., 2: 323-330.
APPENDIX
Comparison between maximum hair levels of mercury during pregnancy and
symptoms and signs in the mother and her offspringa
-----------------------------------------------------------------------------------------------
Mother Child
------------------------- ----------------------------------------------------------
Symptoms Symptoms
----------------------- -------------------------------
Mother- Paraes- Other Mercury Sex Walked Talked Mental Seizures Neurological
infant thesia level (month) (month) score
number (mg/kg)
-----------------------------------------------------------------------------------------------
2 0 0 1 female 12 24 0 0 2
3 0 0 1 male - - 0 0 2
5 0 0 1 male 14 12 0 0 0
6 0 0 1 male 18 18 0 0 0
7 0 0 1 male 18 24 0 0 3
9 0 0 1 male 13 26 + 0 3
13 0 1 1 female 12 12 0 0 4
14 0 0 1 female 18 26 0 0 2
18 0 0 1 female 16 18 0 0 0
19 0 0 1 male 12 12 0 0 0
26 0 0 1 male 12 14 0 0 0
31 0 0 1 male 11 12 0 0 1
33 0 0 1 female 12 20 0 0 2
39 0 0 1 female - - 0 0 4
41 0 0 1 male 11 18 0 0 3
69 0 0 1 male 18 20 0 0 4
4 0 0 2 male 18 - 0 0 0
8 0 0 2 female 13 18 0 0 0
10 0 0 2 male 16 18 0 0 3
11 0 0 2 male 12 24 0 0 3
12 0 0 2 male 18 18 0 0 3
16 0 0 2 female 18 18 0 0 2
27 0 0 2 male 12 10 0 0 0
32 0 0 2 male 14 - 0 0 0
47 0 0 2 male 18 24 0 0 3
1 0 0 3 female 14 18 0 0 0
21 0 0 3 male 18 - 0 0 1
23 0 0 5 male 12 12 0 0 1
34 0 0 6 male 12 10 0 0 0
38 0 0 6 female 18 10 0 0 2
35 0 0 7 male 12 18 0 0 0
29 0 0 8 male 18 19 0 0 0
40 0 0 9 female 12 - 0 0 0
20 0 0 10 male 12 12 0 0 2
24 0 + 10 male 14 - 0 0 3
22 0 0 12 male 18 14 0 0 1
28 0 0 12 female 14 18 0 0 2
17 + + 14 female 20b 18 0 0 1
-----------------------------------------------------------------------------------------------
Appendix (contd).
-----------------------------------------------------------------------------------------------
Mother Child
------------------------ --------------------------------------------------
Symptoms Symptoms
------------------------ -------------------------------
Mother- Paraes- Other Mercury Sex Walked Talked Mental Seizures Neurological
infant thesia level (month) (month) score
number (mg/kg)
-----------------------------------------------------------------------------------------------
36 0 0 16 male 18 16 0 0 5
42 0 0 18 female 36b 30b 0 0 0
25 0 0 19 male 12 18 0 0 2
30 + + 23 female 12 12 0 0 1
37 0 0 26 male 12 12 0 0 1
15 0 0 38 male 20b 18 0 0 6
49 0 0 45 male - - 0 0 4
59 0 0 46 male 12 12 0 0 2
53 0 0 52 female 18 18 0 0 1
48 + + 59 female 18 26b 0 0 0
43 0 0 60 male 20b 18 0 0 5
44 0 0 62 male 18 24 0 0 0
54 + + 74 male 18 26b 0 0 2
46 + 0 75 female 12 12 0 0 0
52 + 0 78 female 14 28b + + 4
50 0 0 86 male 11 26b 0 0 6
58 0 + 98 female 12 12 0 0 2
57 0 0 104 female 15 18 0 0 4
72 0 0 114 male 14 48b + 0 0
64 0 0 118 female 18 18 0 0 0
51 + + 154 male 24b 36b 0 + 3
76 0 0 196 male 12 15 0 0 0
77 0 0 202 male 24b 20 0 0 3
61 0 + 242 female 15 18 + 0 0
74 0 0 263 female 18 18 0 0 5
66 0 0 269 male 12 12 0 0 1
63 + 0 294 male 20b 34b + + 0
62 + + 336 male 24b 36b 0 + 0
67 + 0 339 female 20b 26b 0 0 4
60 + 0 357 female 20b 30b 0 0 2
65 + 0 362 male 14 16 0 0 4
71 + + 376 female 20b 30b 0 + 2
75 0 0 399 male 15 24 0 0 3
56 + + 404 male 60b 60b + + 11
70 + 0 405 female 60b 36b + 0 11
68 0 0 418 male 72b 72b + + 11
45 0 0 443 male 36b 30b + 0 11
73 0 0 468 female 14 20 0 0 6
-----------------------------------------------------------------------------------------------
Appendix (contd).
-----------------------------------------------------------------------------------------------
Mother Child
----------------------- ----------------------------------------------
Symptoms Symptoms
----------------------- -------------------------------
Mother- Paraes- Other Mercury Sex Walked Talked Mental Seizures Neurological
infant thesia level (month) (month) score
number (mg/kg)
-----------------------------------------------------------------------------------------------
80 0 + 557 female 22b 22b 0 0 2
79 0 0 568 female 20b 26b 0 0 4
78 0 0 598 male 24b 23 0 0 7
81 + + 674 male 24b 26b 0 0 2
-----------------------------------------------------------------------------------------------
a From: Marsh et al. (1987)
o = absence of abnormality.
+ = presence of abnormality.
- = no observations were made.
b Abnormal value.
For further details, see section 9.4.2.1.